working paper no: 438 market segmentation of facebook users
TRANSCRIPT

WORKING PAPER NO: 438
Market Segmentation of Facebook Users
Raj Dash Doctoral Student,
Marketing Indian Institute of Management Bangalore Bannerghatta Road, Bangalore – 5600 76
Year of Publication-November 2013
1
Market Segmentation of Facebook Users
Raj Dash
Abstract
In this paper, I develop afresh a comprehensive approach to market segmentation of Facebook users.
The approach considers the implications of Facebook’s business model built around its multi-sided
platform (MSP). In the first part of the study, I present a series of five propositions that inform the
formulation of segmentation and targeting strategies for Facebook and more generally MSPs. These
are based on a review and synthesis of extant literature on multi-sided markets and classification of
Facebook and social media users. The second part of the study uses empirical survey data from 261
Facebook users to (a) evaluate some of these propositions, and (b) develop a segmentation scheme
that may guide the development of marketing strategy for social networking sites (SNS) like
Facebook.
The empirical analysis makes use of cross-tabs, classification and regression trees, linear discriminant
analysis, cluster analysis, and artificial neural networks (ANN). The basis variables of importance to
Facebook for market segmentation are frequency of use and level of engagement. Important
descriptors that help determine segment membership are: marital status, blogging habits, use of
Facebook mobile, general interest in online social networking (OSN), and use of competing OSNs
such as LinkedIn and Google +. I conclude with a discussion on future research priorities in
strategizing for social networking sites.
Introduction
In recent years, several research studies (Brandtzaeg and Heim 2011; Bernoff 2010; Lorenzo-
Romero and Alarcon-Del-Amo 2012; Lee, Jarvinen and Sutherland 2011; Foster, West and
Francescucci 2011) have tried to classify users of social media including those of social
networking sites (SNSs) such as Facebook. These studies offer classifications or typologies
of users rather than comprehensive market segmentation*, the objective of this paper. Also,
current research ignores the fact that Facebook’s business model, based on its multi-sided
platform, generates revenue from affiliate marketers and developers of apps/games. Facebook
doesn’t get any money from users though they make it possible from the marketers and
developers. A market segmentation strategy for Facebook cannot be optimal at the platform
level unless the interests of marketers and developers are factored in. I address these gaps in
this research to arrive at a more comprehensive market segmentation strategy for Facebook.
2
*Segmentation (Smith 1956) is based upon developments in the demand side of the market and represents a
rational and more precise adjustment of product and marketing effort to consumer or user requirements. In the
language of the economist, segmentation is disaggregative in its effects and tends to bring out recognition of
several demand schedules where only one was recognized before (italics added).
Meaningful classification of users of social media or those of SNS is a moving target because
social technologies and their usage are evolving at a rapid pace. In view of this fact, I try to
distinguish between variables that are likely to endure as determinants of segment structure
and those that are likely to change with passage of time. For example, age may cease to
associate with low rate of adoption and use of Facebook in future because the share of people
who had late exposure to SNS or Facebook is decreasing with time. Similar is the case with
subjective norms (Ajzen 1991) and normative beliefs that are changing over time. With
continual innovations on functionality and accelerating positive network externality, users are
doing an increasing share of instant messaging, chatting and emailing on Facebook in recent
years even in a developing country like India (TCS Study 2013). SNS is becoming a
multiplex of wide ranging activities with recent additions like social shopping, social care and
social search. Perhaps, the biggest of transformations of the social technologies landscape is
about to begin with ubiquitous smart phones and wearable computers that not only keep
people online anytime anywhere but also provide bountiful apps that seamlessly integrate
with social technologies. In this paper, with an extensive empirical analysis of segment
structures, I identify and evaluate basis and descriptor variables for market segmentation that
are relatively time invariant in usefulness. They are also consistent with the marketing
objectives of affiliate marketers and developers, the sources of revenue for the Facebook
Company. The approach I propose can be extended to accommodate variations in business
model as well.
Considerable research has accumulated on two-sided or multi-sided platform strategy in
recent years, but most of it deals with pricing strategy and in my observation, there is none
that deals with market segmentation strategy. Similarly, there are several studies on
classification/profiling/segmentation of Facebook users. But none goes beyond profiling or
clustering users into different groups. These studies fall short of structuring segments in terms
of basis and descriptor variables with predictive relations. They also ignore the implications
of the MSP based business model of Facebook for market segmentation. A market
segmentation strategy for a SNS like Facebook is not straight forward like it is for a
conventional service provider because of interdependencies and disparities in the interests of
different parties and network effects.
Facebook’s Business Model
As shown in figure 1 in next page, there are four parties to the use of the multi-sided platform
(MSP) provided by Facebook – the Facebook Company, users, affiliate marketers* (of their
own products/brands) and affiliate developers (of apps/games). In the current business model,

3
Facebook makes money by enabling direct interactions on the MSP (Hagiu and Wright 2011;
Enders et al 2008)) between marketers and users and developers and users. Marketers and
developers do get some of the utilities and services for free but pay for others. Users get free
* Though I often use the term affiliate marketer or just marketer, it may be more appropriate to call them
businesses because they are increasingly doing activities such as social care, crowd-sourcing and so on that go
beyond marketing/advertising. I also use ‘user’ for ‘personal users’ as opposed to business users.
access to the platform for online social networking (OSN) which is their primary motive for
using Facebook. While Facebook offers its facilities to users free of cost today, this need not
necessarily continue in the same form in future. It is possible that, like LinkedIn, it may adopt
a freemium model offering some premium features for a price.
Facebook’s MSP and Business Model
Figure 1
Facebook users may choose to interact with affiliate marketers by responding to
advertisements on their own Facebook pages or by connecting to a marketer’s business page
on Facebook by ‘liking’ the brand or the marketer. The latter mode is often used by marketers
to drive engagement* (Doorn et al 2010) in addition to more targeted advertisements for
sales. Facebook earns fees for advertising and also fees for facilitating posts from marketers
to users who have ‘liked’ them. Targeted advertising is the predominant source of Facebook’s
revenue and profits. Advertisers may reach users based on the information shared by users
such as age, gender, location, education, work history or specific interests. Developers of
apps/games reach out to users mainly through the App Centre on user’s Facebook page and
also through advertisements on the user’s page. Facebook makes money from developers
mainly through its share of 30% of value transacted between developers and users. Most of
the money from developers is based on purchase of virtual goods and services that
accompany the use of apps/games.
Marketers/
Businesses Developers (apps)
Facebook MSP
Facebook Users
Facebook Co.

4
As a MSP, Facebook has two types of network effects (Eisenmann, Parker and Van Alstyne
2006 ). Same-side (also called direct) and cross-side (indirect) effects each of which can be
positive or negative. Both positive and negative may coexist too. A same-side effect, in
which increasing the number of users on one side of the network makes it either more or less
* I measure engagement (p 15) as behavioural as well as attitudinal manifestations beyond the act of purchase.
valuable to users on the same side; and a cross-side effect, in which increasing the number of
users on one side of the network makes it either more or less valuable to the users on the
other side. Cross-side network effects are typically positive, but they can be negative. An
increase in ads on Facebook pages may repel users. Same-side network effects are positive
for SNS users but usually negative for marketers and developers if competitors are added. It
is positive when marketers of complementary offerings are added. There are positive cross-
side network effects between users and marketers, and users and developers. Increase in
number of users benefits and attracts more marketers as well as developers. Increase in
developers has positive effect on users. The effect may be negative when addition of
marketers results in more advertisements. There can be situations when some users benefit
from adding a marketer whereas other users find it intrusive. However, when marketers use
Facebook as a store front or as a channel of customer care, the cross-side effect on users are
clearly positive.
Objectives
The key research question I try to answer in the first part of this paper is; how market
segmentation for a multi-sided platform (MSP) provider like Facebook is different from that
in the conventional single sided case? Based on my review of research literature spanning
strategies for multi-sided markets, classification of social media and Facebook users and
market segmentation, I put forth a series of five propositions that may inform development of
segmentation strategy for a MSP like Facebook. In the second part, I make an empirical
investigation into the segment structures existing in this market. I answer the question of how
best can we segment the market of Facebook users in terms of basis variables (Lilien and
Rangaswamy 2004) that can be accessed via descriptors they are associated with. I select
basis variables that can be consistent across the interests of the three business users (or user
groups) of the MSP – the Facebook Company, affiliate marketers and affiliate developers. I
also evaluate predictive validity of the proposed segmentation model using the basis and
descriptor/access variables.
The Facebook Company may segment the users of its social networking site (SNS) or
platform for more effective marketing (Smith 1965; Fank, Massy and Wind 1972). The
marketing objectives may be to drive penetration, raise share of time spent on SNS, increase
rate of use, intensify engagement, decrease price sensitivity, enhance brand equity, and
improve revenue or profitability and so on. Strategies may be tailored for each target segment

5
to optimize at the aggregate level. The company’s business model today makes it primarily
depend on advertising revenue from product marketers. 85% is ad revenue from marketers
and 15% is fees that are mainly from developers. To raise the advertising revenue, Facebook
needs to grow the number of active users, their rate of use and if possible their inclination to
respond to the advertisements. Advertisers may also be concerned about the relative level of
engagement of users with the SNS medium and related opportunity costs. A higher level of
engagement of the user with the SNS may raise the chances of response and engagement with
marketers in many cases. But it may not make a difference or even lower the chances when
the marketer’s stimulus is viewed as a distraction. We examine such issues in the section on
propositions.
There are obvious constraints in developing an optimal segmentation scheme in the absence
of specific information on marketing objectives and other elements of marketing strategy. An
optimal segmentation and targeting scheme for a new product launch is likely to be different
from that for a new positioning strategy for the same product. So, what is optimal is elusive
in the absence of definite information about the context in which such a scheme would be
implemented. Marketing strategy is essentially about S-T-P (Segmentation-Targeting-
Positioning), 4 P’s and branding. In the present context, we have the additional consideration
of synergizing marketing strategy, including segmentation and targeting, across the three
interfaces – Facebook Company – user, marketer – user and developers –user. A further
complication is that marketers are a diverse group with activities that are increasingly non-
standardized. The extent to which Facebook can accommodate the interests of this diverse
group in its segmentation and targeting strategy is limited. Though there is less diversity in
the activities and interests of developers, here again, addressing such interests collectively
may not benefit the atypical developer adequately.
Market segmentation is only one element albeit a fundamental one in the strategy document.
In the absence of information on the context of objectives and rest of the strategies for
Facebook, we may develop only a general guideline with standard assumptions about the
context. The empirical analysis may inform rather than prescribe.
Literature Review
Social networking sites (SNS) may be defined (Boyd and Ellison 2007) as web-based
services that allow individuals to (1) construct a public or semi-public profile within a
bounded system, (2) articulate a list of other users with whom they share a connection, and
(3) view and traverse their list of connections and those made by others within the system.
Users come to the Facebook platform primarily for information, social connection and
entertainment (Heinonen 2011) and their primary activities on the platform are consumption
of content, participation and production of content.
SNS like Facebook constitute a growing segment in the social media space. Below, I review
five research studies that classify or segment Facebook/SNS/Social Media users. A common
6
pattern is evident in all these studies. The segments differ on frequency/duration of use and
also on types/range of use. A clear pattern is creative use versus responsive or assenting use,
social influence versus social surveillance. Demographic variables such as marital status and
age and in some cases education level may help access the segments of interest in these
studies. However, these studies do not go beyond the task of grouping users on a range of
variables.
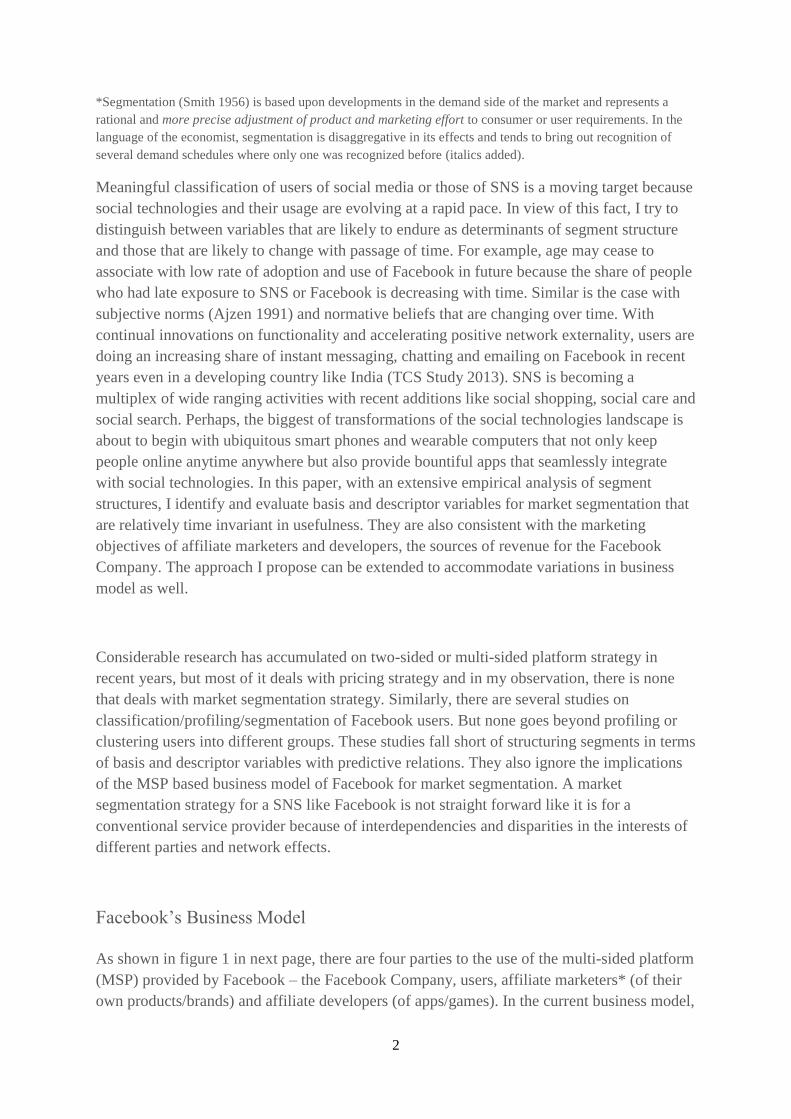
A very elaborate classification study (Brandtzaeg and Heim 2010) of SNS users is based on
an analysis of the survey data from 5,233 respondents in Norway in four major SNSs -
Facebook, Orkut, LinkedIn, and MySpace. The study found five distinct user types:
1 sporadic 2 lurker 3 socialiser 4 debater and 5 active
Typology of SNS users Source: Brandtzaeg and Heim 2010
Figure 2A
Typology of SNS users
Figure 2B

7
This typology is based on quantitative and qualitative aspects of SNS use. The sporadic
constituting 19% are occasional users with little initiative. They respond but hardly upload
any content. Key benefit they seek is information from time to time. Circle of contacts on
SNS is very limited. Surprisingly, they are spread evenly across age groups and genders.
Lurkers making up 27% are also passive users and contribute little UGC (user generated
content), but they may additionally use SNS for recreation and time pass. Their presence cuts
across the 4 SNS studied. A lurker is more likely to be a female (58%) than a male (42%).
Socialisers at 25% incidence are unlike the sporadic or the lurker. The socialiser has
distinctly higher level of participation; follows up and comments on pictures of friends, even
seeks out new friends on SNS and tends to be young in age group. SNS interests her much
more than it does to the sporadic and the lurker. However the occurrence of socialisers differs
a lot across the different SNS studied. Debaters at 11% have a participation level that matches
that of socialisers, but the activities are qualitatively different. With university education and
older age, they tend to be more intellectual in their choice of activities. They read, write and
discuss more on the internet but are unlikely to post videos. Actives at 18% have the widest
range of activities such as community events and publishing music or videos. Unlike
debaters, they have a balance of informational versus recreational mode in their activities.
A more recent segmentation study (Lorenzo-Romero and Alarcón-del-Amo 2012) makes use
of latent class segmentation technique to arrive at 3 segments – introvert users (41%),
versatile users (47%) and expert users (12%). Introverts are mostly women who are more
than 51 years in age, use at most once a week for less than 1 hr, have less than 50 contacts.
They hardly make new friends online. Versatile users use SNS several times a week for a
total of 1-5 hrs and are predominantly females in the 25-32 age group. They have wide
ranging activities on SNS, but do not make friends online. Keeping in touch and
entertainment are dominant motives. Expert users (only 12%) are mostly females less than 25
years in age. They use it more than once in a day. They have the widest range of activities on
SNS including informing others about brands or products they use. Dominant motives are
making new friends, experiencing the novelty of SNS, and pursuit of professional interests.
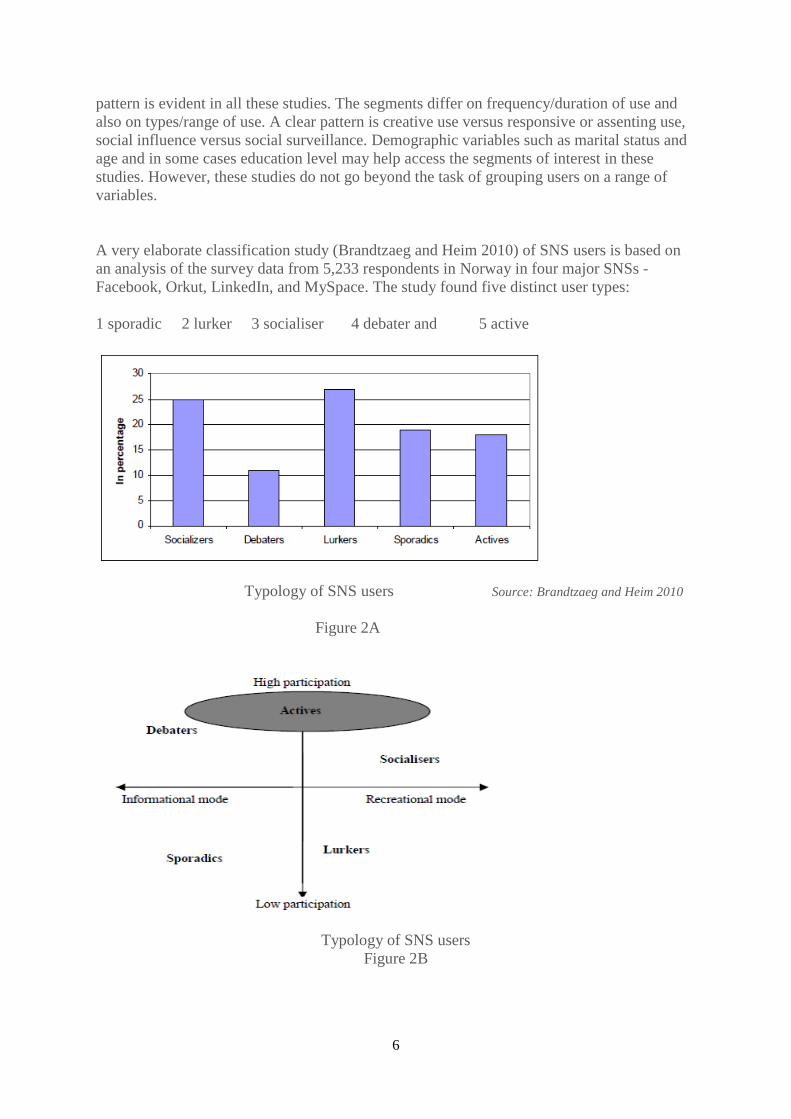
Social Technographics (see Figure 3 in next page) by Forrester Research (Bernoff 2010)
profiles* social media users as shown. Although a trade publication, it is authoritative
because of its large sample of 10,112 consumers among other things. In Forrester’s ladder of
social media sophistication, regular SNS users form a group called conversationalists just
below the group called creators in the top rung. It is interesting for the context of our research
that several social media activities cut across different types of platforms – SNS, blogs/micro
blogs, wikis, ratings and review sites, media/file sharing sites, social gaming sites, social
commerce sites and discussion forums.
The savviest users of social media at the top rung create content – textual, pictorial, audio,
and video content and upload or publish it on the web. These 24% of creators distinguish
themselves from the spectators who consume content – read, listen or watch content but do
not create/upload/publish it. The Facebook user has similar choice of activities within
Facebook. She can take on roles similar to that of a creator or critic or spectator or joiner or
8
inactive. So, we can classify Facebook users in terms of their initiative and creativity, their
consumption of content or entertainment and their level of activity. In a similar vein, Foster et
al. (Foster et al. 2011) find 3 dominant online social behavior - creator, socializer and
information seeker. The position of SNS users on Forrester’s ladder implies that regular SNS
users who update status at least once a month belong in the top two rungs. They are among
the savviest users of social media.
* Groups are allowed to overlap on some of the important aspects.
Social Technographics (2010): Grouping Consumers by How They Participate
Figure 3
Lee et al. (2011) present a segmentation scheme that takes into account the interests of
marketers in the form of 3 measures – opinion leadership, deal proneness and market
mavenism. They find clusters that primarily differ on gratifications/motivations - social
interaction, entertainment, self-expression and information seeking gratifications. A large
segment of 32% is labelled middle of the road because members are average on all four
9
motivations as well as minutes on internet and Facebook. It has a high 86% (sample average
is 66%) of members who have become fans of one or more companies on Facebook pages.
This segment, also has an above average rate of use for apps/games and average score on
opinion leadership and market mavenism. (In the author’s opinion, a better indicator of
responsiveness to marketing stimuli would consider a higher threshold than a single ‘like’ for
a company.)
The second cluster, social interactors (15%) has higher social interaction and entertainment
motivations and lower information seeking and self-presentation motives. They have fewer
but deeper friends than average on Facebook. They are low on use of apps/games,
coupons/promotions on Facebook and market mavenism. The third cluster, the second largest
group, labelled maximizers (26%) scores highest in all four gratifications sought. They tend
to maximize use of Facebook features. They are higher in frequency as well as duration of
use. A maximize is likely to be a fan of a company and send out mass messages.
The fourth cluster, information seekers (20%) value information seeking more than the other
three gratifications. They have significantly more friends (average 1243) than the other
clusters. Almost all (98%) are fans or members of a group on Facebook. The fifth cluster,
labelled laggards (7%), is similar to the middle of the road cluster in the pattern of
gratifications sought. It simply lags behind the other clusters in Facebook gratifications. It has
the least frequent users of Facebook with few friends each. These users are more self-serving
than other groups in that they are more likely to use Facebook to sell something.
Propositions for Segmentation of Users for the MSP
Based on the preceding review of published research on social media segmentation and
multi-sided markets (Haigu and Wright 2010; Rysman 2009; Eisenmann et al. 2006; Rochet
and Tirole 2006; and Evans 2005) along with findings of a pilot study of 50 Facebook users, I
offer five propositions that may inform the market segmentation and targeting strategies for a
SNS like Facebook or more generally for MSPs like Facebook. These propositions may be
viewed as imperatives of an effective market segmentation strategy for the platform provider.
I try to evaluate these propositions to some extent using the findings of the subsequent
empirical study on market segmentation of Facebook users.
Proposition 1
Market segmentation of Facebook users for the Facebook Company, to be optimal, has to be
guided by the company’s business model based on the architecture of the multi-sided
platform (MSP). It has to take into account the business interests of affiliate marketers and
developers while giving primacy to interests of the Facebook Company.
Users of Facebook with personal profiles/accounts constitute the biggest asset for the
company. The company’s profit potential is a function of their number, rate and range of
activities and level of engagement with the OSN platform. So a primary business objective of
10
the company is to grow the user base, its usage and engagement with the Facebook Company.
An effective segmentation strategy needs to help drive use and engagement in the face of
competing OSNs. However, the company derives returns from this asset (user base) through
affiliate marketers and developers. This is somewhat like some real estate brokers who take a
commission only from the seller and not from the buyer. A key role for Facebook is that of a
matchmaker. Growing segments of users whose interests match with that of the marketers
and developers on the MSP would serve Facebook’s business and marketing objectives better
than growing users whose interests are not aligned with that of the marketers and developers.
Viewing from the other standpoint, the imperative is to affiliate with marketers and
developers whose interests are aligned with that of the segments of users Facebook is able to
cultivate. For example, as Facebook’s appeal to teens is on the wane (Shontell 2013) in recent
times, marketers whose primary target segment is teens may shy away from Facebook if they
think the trend is irreversible. Similarly, matching interests of career/job seekers with that of
recruiters is better on the MSP of LinkedIn than on that of Facebook.
In the current business model, Facebook users get to use the Facebook internet platform for
free though it is possible for the company to adopt a freemium model. Such a model may
offer a version with superior features for a price premium or provide an ad-free version of the
SNS for a price to users who are averse to advertisements and would pay for a respite. But,
such a business model may make the SNS less attractive to advertisers and reduce their ad
spend on Facebook. Some of them may withdraw facilities like social care as well and look
for alternate platforms. It raises questions about whether the net effect on profits would be
positive. It is unclear what would be the same-side and cross-side network effects. The MSP
may become less attractive to affiliate marketers because they are denied access to what may
be a very lucrative segment of Facebook users. Because marketers who persist with
remaining users have a smaller and more price sensitive user base to address, they may not be
able to make better offers and drive better engagement on Facebook. This may lead to same-
side negative network effects among marketers. It may also limit the adoption and usage of
Facebook by users in the long term because marketers/businesses have less to offer them on
Facebook. Given the fact that SNS is a highly competitive market space, competing sites may
offer those very opportunities to advertisers that Facebook denies them.
A very promising component of revenue from affiliate marketers is for the services of
Facebook Company to affiliate marketers for facilitating marketing communications in the
form of posts to fans (those Facebook users who like brands/marketers and so connect with
the business pages of the brands/marketers for communications) and friends of fans. A new
trend in service industries like banks is driving fan base and customer engagement through
social customer care. Advertising is much more effective when it is directed at fans and
friends of fans. Such communications may span a range of activities beyond advertising;
promotional content, special offers, market research interactions, crowd-sourcing activities,
customer service and so on.
A common thread that runs through most though not all of these activities is the drive for
customer engagement (Barwise 2010) that is beyond the act of purchase. Leading marketers,
Barwise points out, have created lively exchanges with and among customers on sites such as
11
OPEN Forum (American Express), Beinggirl.com (Procter & Gamble), myPlanNet (Cisco),
and Fiesta Movement (Ford), tapping into participants’ expertise and creativity for product
development. This is apart from the fact that social media can also boost brand awareness,
trial, and ultimately sales, especially when a campaign goes viral.
More important for most companies, however, is that through social media they can gain rich,
unmediated customer insights, faster than ever before. Social media such as Facebook can
help unlock tremendous value and productivity for businesses (Chui et al 2012) through the
engaging interactions made possible by the new range of social technologies. Given the huge
potential of marketer – user interactions on Facebook, affiliate marketers have the
overarching role in generating revenue and profits for Facebook. Market segmentation
strategy for Facebook has to be evaluated in terms of what would be its impact on marketer-
user interactions and resulting cash flows. Interestingly, if marketplace or customer insight is
a dominant motive of affiliate marketers or businesses like Virgin Atlantic (Barwise 2010) in
their social media activity on Facebook, they may benefit from interacting with nonusers and
infrequent or competitive users on social media.
The 30% share of revenue Facebook currently gets from developers of apps/games is mostly
generated from the sale of virtual goods associated with apps/games. Facebook does offer a
range of games that is exclusive to Facebook and traction is building up for Facebook
apps/games as evident from the rising share of this revenue stream from developers over the
years. The social networking context enhances the use of apps/games. Users can easily
choose to play multiplayer games on Facebook with the help of information on what games
their friends are playing. Still, apps/games offer benefits that are distinct from the main fare
of OSN on Facebook and this warrants additional considerations for market segmentation.
The segment of users that generates profits may differ from the segment that generates profits
from marketers and also from the segment that engages with the Facebook OSN.
Proposition 2
Extent of use and engagement are key basis variables on which we may effectively segment
Facebook users. These basis variables, in general, are useful and important for market
segmentation of users not only for the Facebook Company but also for its affiliate marketers
and developers.
What this simply means is that rate of use and levels of engagement are not only effective
basis for behavioural segmentation of users by the Facebook Company but also for a
marketer/business affiliate like ICICI Bank, a leading business user of Facebook in
segmenting its customers. Such a segmentation scheme may help move the bank’s customers
from infrequent user of social app of the bank to frequent user and finally to engaged user. In
fact driving engagement is high on the bank’s agenda in its official social strategy. There is
merit in maintaining consistency on basis variables like this because there is more
commonality than difference in the context. A customer of ICICI Bank who uses Facebook
occasionally would be difficult to engage with on the SNS platform. A frequent user is more
amenable and likely to engage with and an engaged user even more so.
12
A marketer/business which mainly advertises on Facebook for sales, however, may need to
use basis variables such as click through rate of user for category advertisements and related
purchase rate and value. The marketer-user interface is more complex than what it is in the
preceding example because of the variety of ways in which the interaction may take place
between a marketer and user. Nevertheless, we may choose to segment users into infrequent,
frequent and engaged users to our advantage. We are aware from published data that only a
small fraction of Facebook users use or respond to marketing communications from affiliate
marketers either in the form of advertisements or posts from their business pages. Even
among fans or those who have liked brands/marketers on the web and so are connected to
their business pages on Facebook, less than .05% respond to posts from the brands/marketers.
Here we can employ measures such as number of responses to marketing stimuli or
communication in a day/week/month as a measure of frequency of use and extent of
behaviour such as displaying, sharing, tagging, spreading or participating in brand activity as
a measure of engagement. This way of segmenting users with respect to Facebook, marketers
and developers is particularly meaningful because, to a considerable extent such grouping
may hold good across categories.
Developers of apps/games may also use the infrequent – frequent – engaged paradigm of
segmentation. For them, engaged may include those who generate positive word of mouth or
recommendations on top of frequent use. To incorporate the profit potential angle better,
purchase of virtual goods may be factored in as a necessary condition for engagement.
There are three cross-side interactions; Facebook – user, marketer – user; and developer –
user. The second and third interactions generate revenue and the first makes it all possible
though it doesn’t directly generate revenue in the current business model. For each of these
interaction type, we may classify users to be in 3 possible states – infrequent user, frequent
user (who is low on engagement), and engaged user (frequent user who is high on
engagement).
In the Facebook-user interaction, we may notice a progression from infrequent to frequent to
engaged state. Behaviourally, this makes sense as a system of segmentation. Facebook drives
numbers (penetration and even better adoption numbers) and then usage rate (frequency and
also duration) and finally engagement (behavioural and attitudinal). Here, we must note that
even a low frequency of 2/3 times a month for 5 – 10 minutes is of value to Facebook. Weak
ties (Granovetter 1973) are of value to people. The frequent or everyday users value
Facebook more because they can interact with these less frequent or infrequent users through
Facebook. The very presence of the infrequent adds value. Without them, frequents shall be
lower in number and may be less frequent in usage than they are now. A finer point is
infrequent versus irregular or occasional users. Those who find time to use Facebook once
every week (albeit for only 15 minutes) are regular though the periodicity is low. They are
likely to be of greater value to Facebook than those whose average is 1.5/2 visits (of similar
duration) a week but irregular (5 times in some weeks and 0 times in other). The former can
be more predictably reached for communication/interaction through Facebook than the latter.

13
Proposition 3
(3a) The interests of Facebook Company, marketers and developers may converge for some
while it may diverge for other segments. Tradeoffs are called for where they diverge.
(3b) Positive (negative) cross-side network effects can facilitate convergence (divergence).
(3c) There are synergistic interactions that facilitate convergence.
(3d) Multi-homing facilitates divergence.
(3e) The greater the convergence (bilateral or trilateral) the higher is the profits.
Developers may care about externality such as which users spend on apps/games and not how
many users of the SNS are there or even who are the engaged users of the SNS. Marketers are
concerned about whether a user is ready to connect, respond or engage with them. (The click
through rate or CTR is around .05 % according to 2011 Webtrends report, but these are opt-in
prospects unlike in conventional media.) Some users may have negative externality towards
advertisements while others may view it positively. This may be a key basis for segmentation
for marketers. The platform provider or intermediary Facebook is of course concerned about
driving adoption, use and engagement to build a user base that can be used as an asset.
The benefits or value propositions of the Facebook OSN platform, marketers and offerings of
developers are distinct from each other though they share the social context of Facebook. A
social shopper looking for deals or offer on Facebook has an interest that may be relatively
independent of his or her interest in apps/games or in the OSN fare of Facebook. On the other
hand, using/playing apps/games may be enhanced and made more interesting because of the
social context afforded by the OSN. One can identify and choose playmates from among
friends for playing games on Facebook. One can find fellow hobbyists who may help choose
apps that relate to the hobby. These are instances where there is synergy between different
cross-side interactions. Like in a mall, customers frequent some shops more than others;
Facebook users may frequent some options more than others. Like in a mall however
Facebook can benefit more if users frequent a wider range of offerings on the platform across
OSN, marketers and developers.
Convergence and Divergence of Interests
Segment combination Facebook
Co
Marketers Developers size Remarks Imp
1 F1 M1 D1 # # # 8 sparse
2 F1 M1 D2 # # √ 6 sparse
3 F1 M2 D1 # √ # 7 sparse
4 F1 M2 D2 # √ √ 5 sparse
5 F2 M1 D1 √ # # 4 potential *
6 F2 M1 D2 √ # √ 3 niche *
7 F2 M2 D1 √ √ # 2 lucrative *
8 F2 M2 D2 √ √ √ 1 cream *
Possible segments of
interest 5, 6, 7 & 8 3, 4, 7 &
8
2, 4, 6 & 8
F, M and D followed by 1 are infrequent in use or response to marketers or using apps/games.
14
Table 1
We may develop a theoretical market segmentation scheme (Table 1) based on convergence
and divergence of interests of the 3 business users or parties as follows. For a simple
exposition in the table below, we divide users into two groups for each party - √ (2) for
frequent and # (1) for infrequent. Here, SNS user is divided into F1 and F2. For marketers,
users are divided into M1 and M2 and for developers D1 and D2. We may say 2 is the more
responsive or frequent in use segment and 1 the less so. This can be easily extended to the 3
groups case with frequent subdivided into engaged (frequent and engaged) and frequent (with
low engagement).
The profitable segments according to Facebook’s current business model may very well be 8,
7 and 6 (in that order) which frequently respond to marketers’ communications (ads or posts).
Or use apps/games frequently. It is interesting to note that segment 5 that consists of frequent
users of Facebook contributes little to Facebook’s revenue because they are infrequent in
their response to marketers’ communications or apps/games on offer. A fraction of such
frequent users of Facebook who are engaged with Facebook however may be receptive to a
freemium model as discussed elsewhere in this paper. Even if they cannot be monetized
directly, they do contribute towards same-side network effects. Besides, the social media
space is evolving at a fast pace. Therefore, usage and engagement behaviour are in a state of
flux and more often than not on the ascendancy.
The differences among the segments can be partly explained by network effects – same side
and cross side network effects. Segment 8 is likely to be benefitting from cross-side network
effects. A strong user base with varied interests and higher on the social media ladder
(Bernoff 2010) can raise frequency of interaction with all 3 parties. Segment 1, 2, 3 and 4 are
likely to be sparse in users. It is implausible that that users visit Facebook for marketing
communications and/or apps/games alone and not for the main fare of OSN. These segments
may be rather uninhabited.
Multihoming may facilitate divergence because, it provides more competing options. So
because a Facebook user multihomes, she picks what is best for her at Facebook and goes for
G + or LinkedIn for a feature/affordance that is best there. Let’s say, she may choose to use
OSN at Facebook and apps/games at G +.In the absence of multi-homing, perhaps,
engagement with Facebook’s SNS would automatically pave the way for using apps/games
on Facebook unless G + has a big edge in apps/games and she gets to know that. For the
Facebook Company as well as the marketers, developers and users it would be very useful to
understand the factors, controllable and uncontrollable, that drive convergence and
divergence. If they can orchestrate convergence as a team, the system as a whole optimizes.
Proposition 4
If a Facebook user is more engaged with Facebook compared to any other media (SNS or
otherwise) through which a marketer or brand can reach him or her, then it may be better for
the marketer or brand to engage with him or her on Facebook than on any other media
provided cost or other strategic considerations do not outweigh the benefits.
15
Corollary
(a) The engaged segment of Facebook users is the prime target for marketers.
(b) Ceteris paribus, an engaged user has higher customer lifetime value (CLV) to a marketer
compared to the non-engaged.
The engaged segment shows engagement attitude and behaviour (Van Doorn 2010) beyond
the act of using Facebook for OSN. In addition to being frequent users, they have greater
attachment and readiness to involve themselves in activities related to Facebook. They have
stronger commitment or continuance intention. Often, this is backed up by a clear preference
over competing offerings. They may have positive emotions such as love towards Facebook.
They are less price sensitive with Facebook. If they enjoy being on Facebook more than in
other media, then Facebook is the best place to try to engage them with conversations about
the marketing content or propositions and start driving engagement for the brand or company.
For example, if a customer uses Facebook as well as LinkedIn for equal length of time a day,
the marketer may choose one SNS over another on the basis of extent of engagement and fit
of the SNS with the product. As Barwise (Barwise 2010) points out Facebook may not be the
best place to drive purchase, but provided you already have customers who have experienced
your products, Facebook may be among the best places to drive engagement. Proposition 4
posits that this is more so when the customer is engaged with Facebook as a SNS.
On the other hand, irregular users of the SNS may be difficult to engage with on Facebook
though such users may be good customers of the concerned marketer already. For a SNS user
to be an appropriate target for marketing, regular (does not mean frequent; two days a week is
regular but not frequent) use is a necessary condition for effective reach and the fact that the
user is a prospective or existing customer of the marketer’s offerings may be the sufficient
condition. The preferred medium may facilitate higher level of engagement though there may
be exceptions to this general rule. We may also note that increasingly the media space is
getting integrated by social and related technologies with people reading news on online apps
and viewing TV programs in social context. With social technologies enmeshing and even
integrating mainstream media such as TV programs, print and electronic, social may be the
key to more effective engagement in any medium. This is primarily because of the interactive
features of social media and its superior connectivity. People can like, comment on, curate,
tag, share and spread the content they consume in different media during the day. They can
do so with content elsewhere through Facebook.
Trade literature on Facebook and social media marketing already talk about ‘value of a fan.’
In general, it is plausible that value of a user to a marketer, among other things, is a function
of the rate of use of Facebook’s SNS and level of engagement with it. There is likely to be
interaction effects – higher the use and engagement with SNS, greater the response to
marketing stimuli and engagement with marketers on Facebook platform.

16
Proposition 5
These are propositions that may help identify characteristics of user segments that interest
marketers (Lee et al 2011) and developers on Facebook. Some of them delineate key
interdependencies.
(5a) Users who do little multihoming (say less than 20% share of total time spent on SNS is
on platforms other than Facebook) would tend to use apps/games on Facebook more often
than those who do more muti-homing.
(5b) those who rate and review products online such as at amazon.com would tend to ‘like’
and engage with brands/marketers on Facebook more than those who do not.
(5c) Connecting with marketers is independent of using apps/games
(5d) Value of purchase in response to advertisements on Facebook is independent of
purchases from developers of apps/games.
Consumer behaviour literature in marketing (Lilien, Kotler and Moorthy 2004) observes that
a large share of consumer choices is made using satisficing rather than optimizing heuristic.
Time and monetary cost of search for alternatives and processing of information to evaluate
fresh alternatives may inhibit and restrict the consideration set as well as choice set. Search
and cost is lower for those who multi-home (also use other platforms or media that provide
similar range of SNS plus market offerings plus apps/games). Like people have a limitation
in the number of malls they would visit for shopping every month, they may limit themselves
to only few platforms where they get substitutes or alternatives to what they get on the
Facebook platform. Because multihoming increases readily available alternatives and lowers
search costs, it may lead to lower convergence - one may use the Facebook SNS more but
use apps/games mostly on Google + and engage with marketers/brands usually on Twitter.
As observed in Forrester’s ladder of profiles for social media users, there are strong
interdependencies in behaviour across social platforms. Findings of our pilot study for the
empirical research also shows association between reading and commenting on blogs and
SNS use. It is plausible that those who rate and review products online are more frequent
online buyers and so may tend to engage with marketers more on Facebook.
Apps/games tend to be very different in functionality and benefit from responding to a
marketer’s ads or engaging with brands on Facebook (barring a few overlaps). There may be
a segment of young who are not involved in household purchases but have the pastime of
playing games for hours on Facebook every day.
It may be possible to identify some of the key factors that give rise to positive (negative)
cross-side externalities and so cause convergence (divergence). Secondary trade/industry
17
literature on Facebook and social media may yield hypotheses and insights of value in this
direction.
Market Segmentation: Empirical Study
In this section, I present the findings of an empirical study to develop a market segmentation
strategy for Facebook. This is based on around 261 (50 pilot and 211 in final round)
responses from current and past students of Indian Institute of Management Bangalore, a
premier business school in India. (Link for IIM B Facebook Study* Questionnaire:
https://qtrial.qualtrics.com/SE/?SID=SV_ahlxGCTWQEyk4mN ). The study gathers
information on user characteristics, use and engagement. Variables of interest for the market
segmentation study may be outlined as follows.
User Characteristics
Demographic Profile:
gender, age, marital status, stay alone or with family, mother’s employment status, price of
your mobile, proximity (% Facebook friends who stay within 5 km of your place of stay),
program/category
Behavioural Profile:
active OSN accounts (Twitter, Google +, LinkedIn and Facebook), recency of activity on
leading (4) OSNs, level of social media category activity such as blogging/skyping, devices
for accessing Facebook, online hrs, years with Facebook, range of people in Facebook
network, share of OSN for time pass, flow
Attitudinal Profile:
perceived benefits (14) such as association with social influence or satisfying social curiosity,
subjective norms such as whether Facebook perceived as more for teenagers than adults,
perceived behavioural control such as whether use of Facebook is effortful, values,
personality, stated share of time, competitive share, share of time pass activities, priority,
concerns (negatives such as privacy and security)
Other correlates of Facebook use:
network externality (n_ext, #close friends in facebook network), psychographic correlates
such as preference for outdoor versus indoor leisure activity, physical versus mental activity,
whether they experience flow while working online.
Use
recency of using OSN accounts, functional measures (type and rate) for like, comment, status
update, follow, album and apps/games; # mobile visits in last 24 hrs, # login/ visits a day,
minutes a day, average minutes a visit # Facebook Friends, # Facebook groups, # close friends
who are on Facebook, self rating as a user of Facebook: extent, range of features and
proficiency, years with Facebook, % opp sex on Facebook , % within 5 km of place of stay
*This survey was carried out as part of a multi-purpose research by the author along with Praveen S.
and Tushar Tanwar in May 2013 at IIM Bangalore. The sample size of 261 excludes 17 respondents
18
who reported not having active Facebook accounts.
Engagement
habituation or daily routine, continuance intention, feeling of being out of touch without
access, anxiousness without , love, need to deactivate, worry (negatives) brand equity/price
sensitivity
I have used a repertoire of analytical techniques to design and evaluate a range of
segmentation schemes. I have used simple tools like cross tabs and classification trees and
also more involved techniques like discriminant analysis, logistic regression, cluster analysis
(K means and Two step), and artificial neural networks (ANN). These investigations help
identify the underlying segment structures that leaves little room for doubt on what should be
the basis for effective segmentation and what descriptors or independent variables may help
access the resulting segments. Some of these techniques help predict the basis or dependent
variables on the basis of data on a few independent variables or descriptors. Interestingly,
there is a lot in common in the outcomes from the different analyses in terms of segment
structures. We present segmentation scheme I below based on cross tabs to begin with
because in a simple way it captures the essential structure comprehensively.
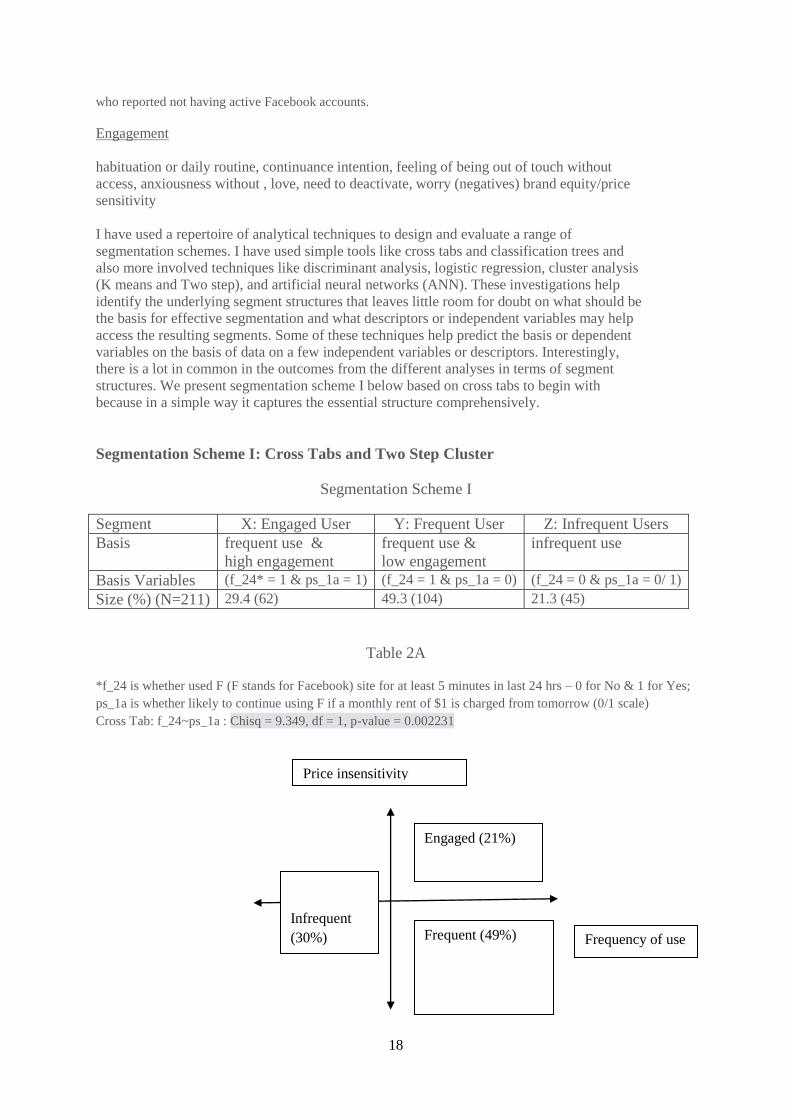
Segmentation Scheme I: Cross Tabs and Two Step Cluster
Segmentation Scheme I
Segment X: Engaged User Y: Frequent User Z: Infrequent Users
Basis frequent use &
high engagement
frequent use &
low engagement
infrequent use
Basis Variables (f_24* = 1 & ps_1a = 1) (f_24 = 1 & ps_1a = 0) (f_24 = 0 & ps_1a = 0/ 1)
Size (%) (N=211) 29.4 (62) 49.3 (104) 21.3 (45)
Table 2A
*f_24 is whether used F (F stands for Facebook) site for at least 5 minutes in last 24 hrs – 0 for No & 1 for Yes;
ps_1a is whether likely to continue using F if a monthly rent of $1 is charged from tomorrow (0/1 scale)
Cross Tab: f_24~ps_1a : Chisq = 9.349, df = 1, p-value = 0.002231
Frequency of use
Price insensitivity
Infrequent
(30%)
Engaged (21%)
Frequent (49%)
19
Figure 4A
Figure 4B
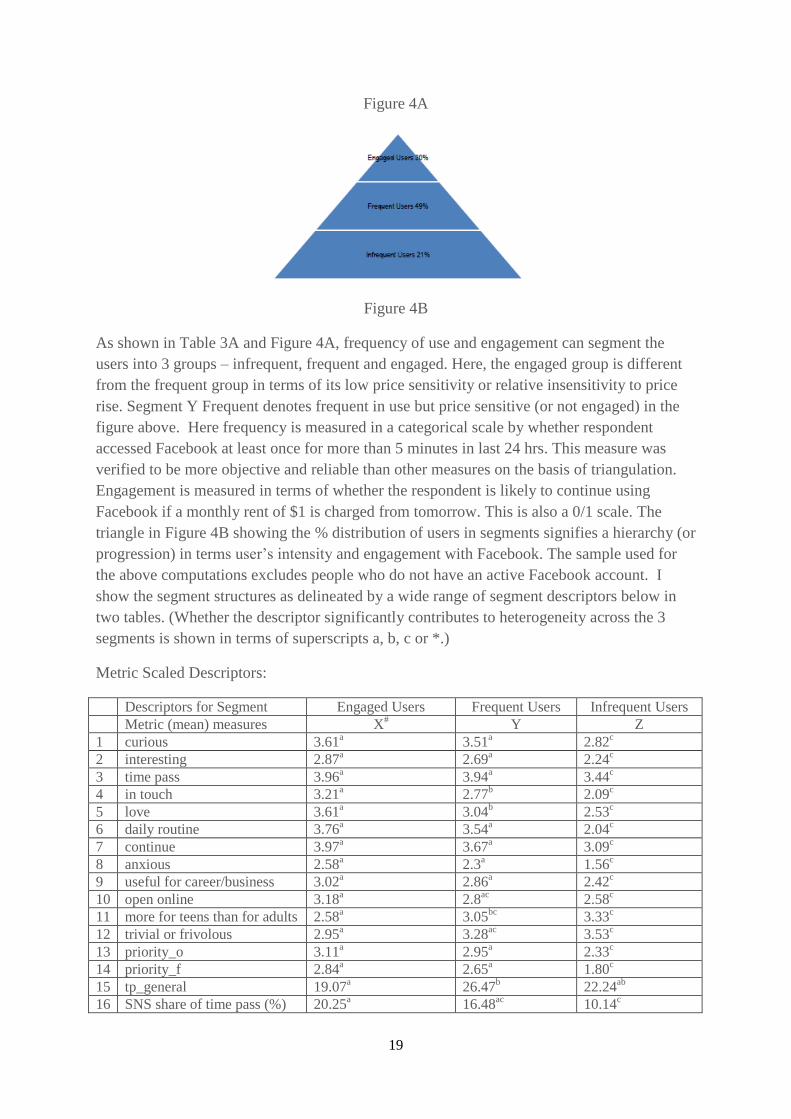
As shown in Table 3A and Figure 4A, frequency of use and engagement can segment the
users into 3 groups – infrequent, frequent and engaged. Here, the engaged group is different
from the frequent group in terms of its low price sensitivity or relative insensitivity to price
rise. Segment Y Frequent denotes frequent in use but price sensitive (or not engaged) in the
figure above. Here frequency is measured in a categorical scale by whether respondent
accessed Facebook at least once for more than 5 minutes in last 24 hrs. This measure was
verified to be more objective and reliable than other measures on the basis of triangulation.
Engagement is measured in terms of whether the respondent is likely to continue using
Facebook if a monthly rent of $1 is charged from tomorrow. This is also a 0/1 scale. The
triangle in Figure 4B showing the % distribution of users in segments signifies a hierarchy (or
progression) in terms user’s intensity and engagement with Facebook. The sample used for
the above computations excludes people who do not have an active Facebook account. I
show the segment structures as delineated by a wide range of segment descriptors below in
two tables. (Whether the descriptor significantly contributes to heterogeneity across the 3
segments is shown in terms of superscripts a, b, c or *.)
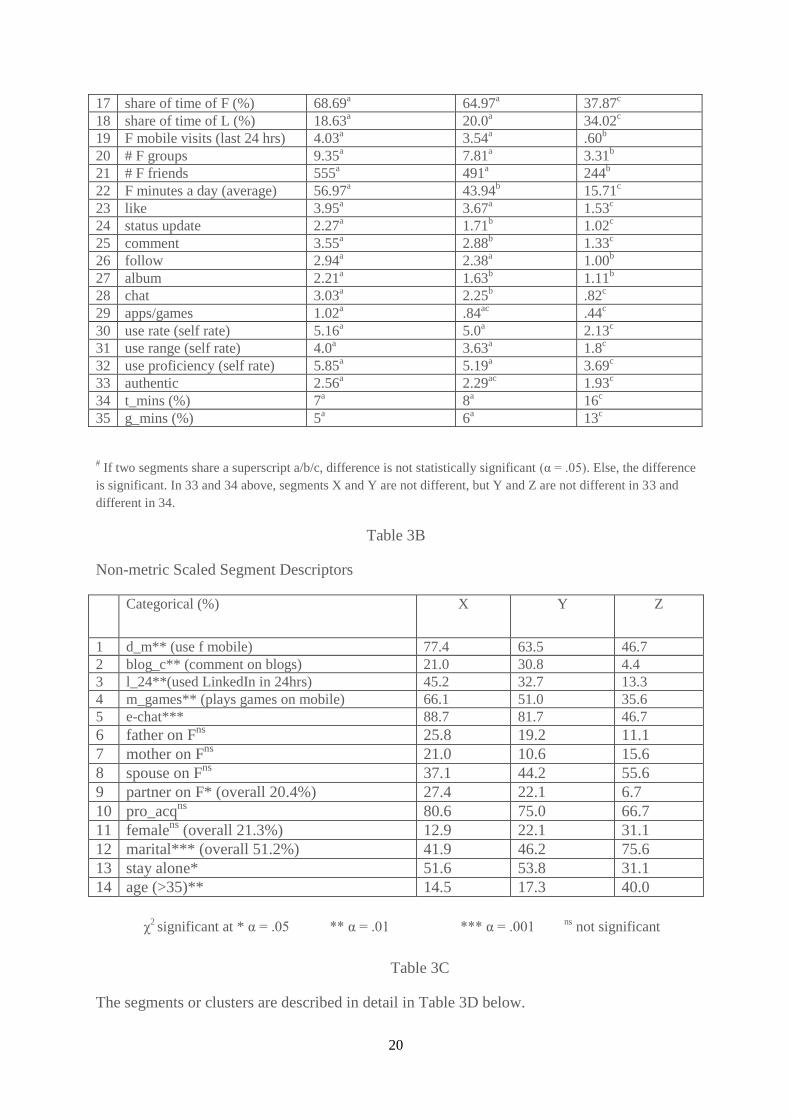
Metric Scaled Descriptors:
Descriptors for Segment Engaged Users Frequent Users Infrequent Users
Metric (mean) measures X#
Y Z
1 curious 3.61a
3.51a
2.82c
2 interesting
2.87a
2.69a
2.24c
3 time pass 3.96a
3.94a
3.44c
4 in touch 3.21a
2.77b
2.09c
5 love 3.61a
3.04b
2.53c
6 daily routine 3.76a
3.54a
2.04c
7 continue 3.97a
3.67a
3.09c
8 anxious 2.58a
2.3a
1.56c
9 useful for career/business 3.02a
2.86a
2.42c
10 open online 3.18a
2.8ac
2.58c
11 more for teens than for adults 2.58a
3.05bc
3.33c
12 trivial or frivolous 2.95a
3.28ac
3.53c
13 priority_o 3.11a
2.95a
2.33c
14 priority_f 2.84a
2.65a
1.80c
15 tp_general 19.07a
26.47b
22.24ab
16 SNS share of time pass (%) 20.25a
16.48ac
10.14c
20
17 share of time of F (%) 68.69a
64.97a
37.87c
18 share of time of L (%) 18.63a
20.0a
34.02c
19 F mobile visits (last 24 hrs) 4.03a
3.54a
.60b
20 # F groups 9.35a
7.81a
3.31b
21 # F friends 555a
491a
244b
22 F minutes a day (average) 56.97a
43.94b
15.71c
23 like 3.95a
3.67a
1.53c
24 status update 2.27a
1.71b
1.02c
25 comment 3.55a
2.88b
1.33c
26 follow 2.94a
2.38a
1.00b
27 album 2.21a
1.63b
1.11b
28 chat 3.03a
2.25b
.82c
29 apps/games 1.02a
.84ac
.44c
30 use rate (self rate) 5.16a
5.0a
2.13c
31 use range (self rate) 4.0a
3.63a
1.8c
32 use proficiency (self rate) 5.85a
5.19a
3.69c
33 authentic 2.56a
2.29ac
1.93c
34 t_mins (%) 7a
8a
16c
35 g_mins (%) 5a
6a
13c
# If two segments share a superscript a/b/c, difference is not statistically significant (α = .05). Else, the difference
is significant. In 33 and 34 above, segments X and Y are not different, but Y and Z are not different in 33 and
different in 34.
Table 3B
Non-metric Scaled Segment Descriptors
Categorical (%) X Y Z
1 d_m** (use f mobile) 77.4 63.5 46.7
2 blog_c** (comment on blogs) 21.0 30.8 4.4
3 l_24**(used LinkedIn in 24hrs) 45.2 32.7 13.3
4 m_games** (plays games on mobile) 66.1 51.0 35.6
5 e-chat*** 88.7 81.7 46.7
6 father on Fns
25.8 19.2 11.1
7 mother on Fns
21.0 10.6 15.6
8 spouse on Fns
37.1 44.2 55.6
9 partner on F* (overall 20.4%) 27.4 22.1 6.7
10 pro_acqns
80.6 75.0 66.7
11 femalens
(overall 21.3%) 12.9 22.1 31.1
12 marital*** (overall 51.2%) 41.9 46.2 75.6
13 stay alone* 51.6 53.8 31.1
14 age (>35)** 14.5 17.3 40.0
χ2 significant at * α = .05 ** α = .01 *** α = .001
ns not significant
Table 3C
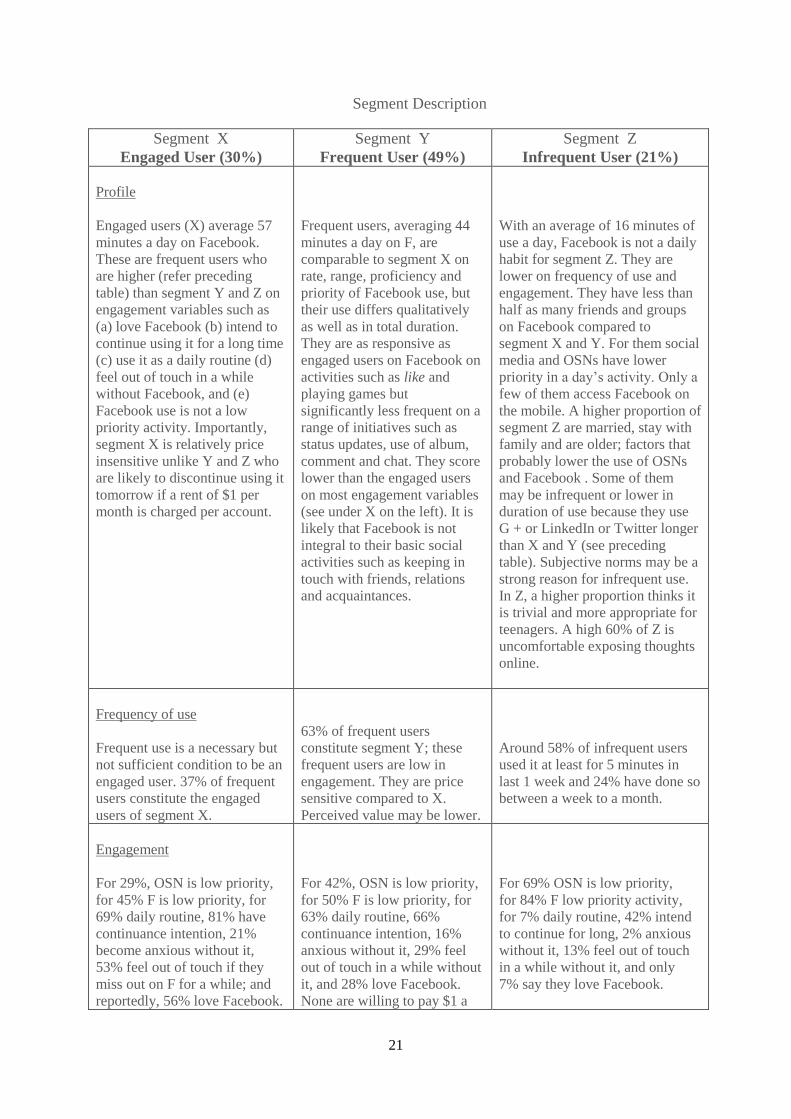
The segments or clusters are described in detail in Table 3D below.
21
Segment Description
Segment X
Engaged User (30%)
Segment Y
Frequent User (49%)
Segment Z
Infrequent User (21%)
Profile
Engaged users (X) average 57
minutes a day on Facebook.
These are frequent users who
are higher (refer preceding
table) than segment Y and Z on
engagement variables such as
(a) love Facebook (b) intend to
continue using it for a long time
(c) use it as a daily routine (d)
feel out of touch in a while
without Facebook, and (e)
Facebook use is not a low
priority activity. Importantly,
segment X is relatively price
insensitive unlike Y and Z who
are likely to discontinue using it
tomorrow if a rent of $1 per
month is charged per account.
Frequent users, averaging 44
minutes a day on F, are
comparable to segment X on
rate, range, proficiency and
priority of Facebook use, but
their use differs qualitatively
as well as in total duration.
They are as responsive as
engaged users on Facebook on
activities such as like and
playing games but
significantly less frequent on a
range of initiatives such as
status updates, use of album,
comment and chat. They score
lower than the engaged users
on most engagement variables
(see under X on the left). It is
likely that Facebook is not
integral to their basic social
activities such as keeping in
touch with friends, relations
and acquaintances.
With an average of 16 minutes of
use a day, Facebook is not a daily
habit for segment Z. They are
lower on frequency of use and
engagement. They have less than
half as many friends and groups
on Facebook compared to
segment X and Y. For them social
media and OSNs have lower
priority in a day’s activity. Only a
few of them access Facebook on
the mobile. A higher proportion of
segment Z are married, stay with
family and are older; factors that
probably lower the use of OSNs
and Facebook . Some of them
may be infrequent or lower in
duration of use because they use
G + or LinkedIn or Twitter longer
than X and Y (see preceding
table). Subjective norms may be a
strong reason for infrequent use.
In Z, a higher proportion thinks it
is trivial and more appropriate for
teenagers. A high 60% of Z is
uncomfortable exposing thoughts
online.
Frequency of use
Frequent use is a necessary but
not sufficient condition to be an
engaged user. 37% of frequent
users constitute the engaged
users of segment X.
63% of frequent users
constitute segment Y; these
frequent users are low in
engagement. They are price
sensitive compared to X.
Perceived value may be lower.
Around 58% of infrequent users
used it at least for 5 minutes in
last 1 week and 24% have done so
between a week to a month.
Engagement
For 29%, OSN is low priority,
for 45% F is low priority, for
69% daily routine, 81% have
continuance intention, 21%
become anxious without it,
53% feel out of touch if they
miss out on F for a while; and
reportedly, 56% love Facebook.
For 42%, OSN is low priority,
for 50% F is low priority, for
63% daily routine, 66%
continuance intention, 16%
anxious without it, 29% feel
out of touch in a while without
it, and 28% love Facebook.
None are willing to pay $1 a
For 69% OSN is low priority,
for 84% F low priority activity,
for 7% daily routine, 42% intend
to continue for long, 2% anxious
without it, 13% feel out of touch
in a while without it, and only
7% say they love Facebook.

22
All willing to pay $1 a month. month for using Facebook.
Demographics
42% are married (sample % is
51) young (85% are 35 or less)
52% stay alone (away from
family)
46% are married
young (83% are 35 or less)
54% stay alone
76% are married
old (60% are 35 or less)
34% stay alone
Subjective Norms/Beliefs
21% think F is more for teens,
31% find it trivial, for 48% it is
more stylized self-presentation
than authentic socializing, and
31% not comfortable exposing
thoughts online
34% think it is more for teens
41% find it trivial
66% find it less authentic
49% uncomfortable opening
up online
47% think it is more for teens
49% think it is trivial/frivolous
80% more stylized self-present,
60% not comfortable exposing
thoughts online
Behavioural
8 out of 10 use F mobile
interest in social media and
SNS is higher for segment X
89% chat on internet
21% read and comment on
blogs
66% play games on mobile
45% used LinkedIn in 24 hrs
Facebook gets 69% of time for
SNS (F,L, G+ & T)
39% find it useful for
career/business
Features or affordances of
Facebook that the engaged
segment use more often than the
frequent segment are: status
update, comment, album and
chat. On use of apps/games, X
and Y are comparable. (see
metric descriptors table 3B for
more details)
6 out of 10 use F mobile
larger share of SNS in time
pass for X and Y than Z
82% e-chat
31% read and comment on
blogs
51% play games on mobile
33% used LinkedIn in 24 hrs
Facebook gets 65% of SNS
time
24% find it so for
career/business
Rate, range and proficiency of
use is remarkably higher for
the engaged and frequent
segments compared to the
infrequent – it’s more than
twice (refer table 3B).
5 out of 10 use f mobile
priority of OSN and Facebook
falls from segment X to Y to Z
47% e-chat
4% comments on blogs.
36% play games on mobile
13% used LinkedIn in 24 hrs
Facebook gets 38% of SNS time,
LinkedIn, Google + and Twitter
get more time in this segment
16% find it so for career/business
Frequency of use is significantly
lower for almost all types of
features or affordances.
Table 3D
23
In this model of segmentation, we are taking into account only people with active Facebook
accounts. While these segments suggest a hierarchical progression in the pyramid (Figure 4B)
, such progression may be true only for some of the users. Many users may choose not to go
all the way up like in the case of the brand equity (Keller 1993) model. This may be because
of level of interest in the SNS subcategory or preference for competing SNS or subjective
norms (Ajzen 1991) that limit use and attachment. Being married or staying with family may
lower the need for socialising on SNS because of factors such as proximity, intimacy and
privacy.
From the point of view of Facebook Company, marketers and developers, the objective is to
move users up this pyramid – higher the number of engaged users, the better. There are
however qualifications. We see that the segment of engaged users has more varied usage and
uses apps/games significantly more than the infrequent user segment but not necessarily more
than the frequent user segment. It is possible that some specific apps/games have more takers
among frequent users than among engaged users. These are people who may visit Facebook
more for using some apps/games than for the main fare. Similarly, a greater share of engaged
users than frequent users may be averse to advertisements and marketing communications
from marketers on Facebook. So some marketers may find the segment of frequent users
more engaging than the segment of engaged users of Facebook. The current study however
cannot validate these propositions adequately.
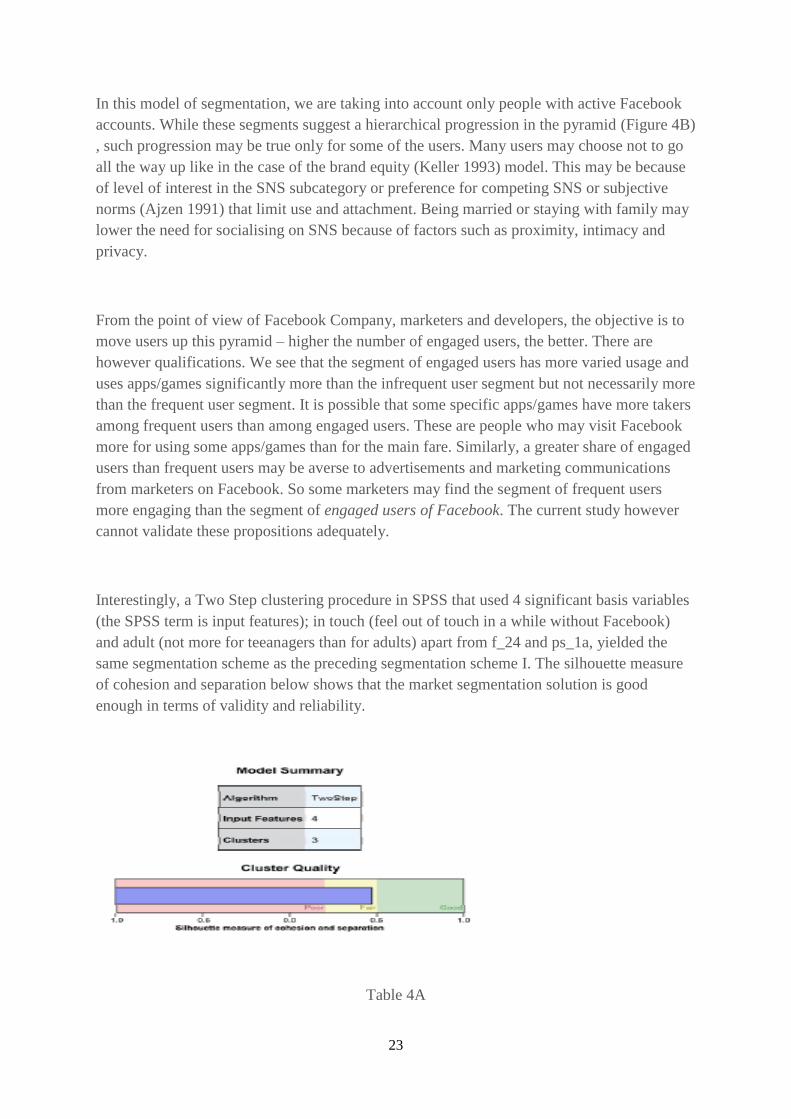
Interestingly, a Two Step clustering procedure in SPSS that used 4 significant basis variables
(the SPSS term is input features); in touch (feel out of touch in a while without Facebook)
and adult (not more for teeanagers than for adults) apart from f_24 and ps_1a, yielded the
same segmentation scheme as the preceding segmentation scheme I. The silhouette measure
of cohesion and separation below shows that the market segmentation solution is good
enough in terms of validity and reliability.
Table 4A

24
Table 4B
Frequent Engaged Infrequent
Similar to
Frequent in
Scheme I
Similar to
Engaged in
Scheme I
Similar to
Infrequent in
Scheme I
25
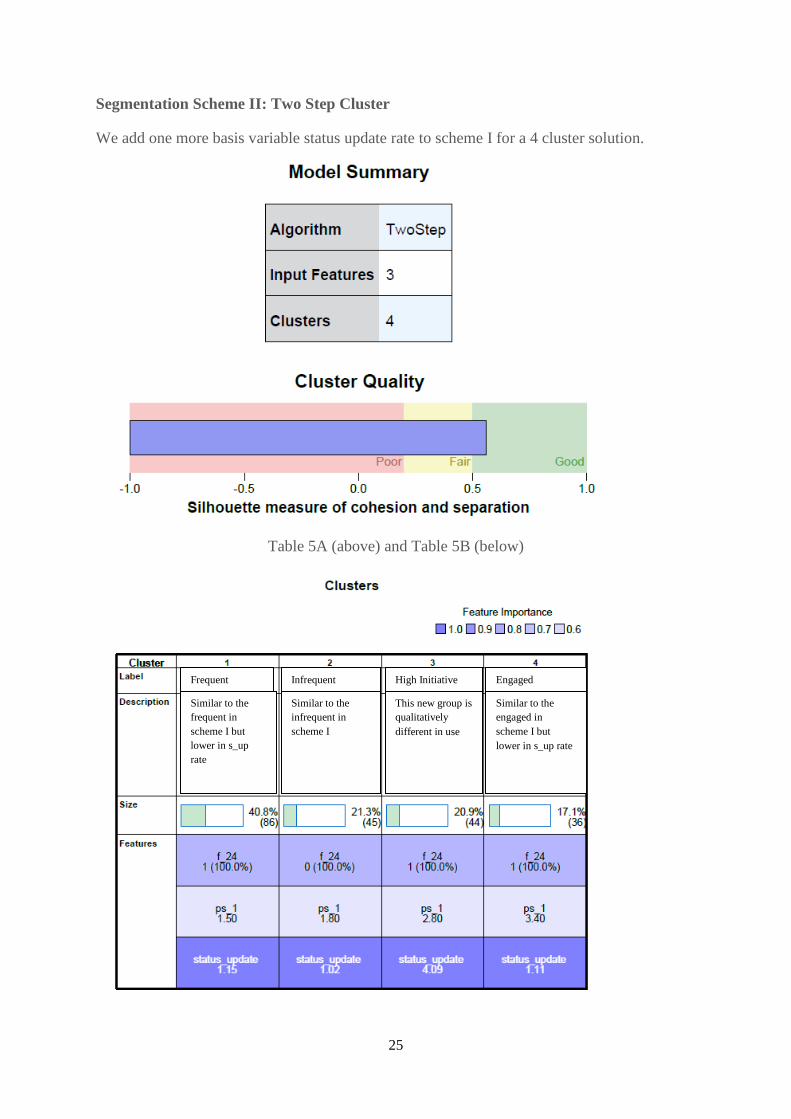
Segmentation Scheme II: Two Step Cluster
We add one more basis variable status update rate to scheme I for a 4 cluster solution.
Table 5A (above) and Table 5B (below)
Frequent Infrequent High Initiative Engaged
Similar to the
frequent in
scheme I but
lower in s_up
rate
Similar to the
infrequent in
scheme I
This new group is
qualitatively
different in use
Similar to the
engaged in
scheme I but
lower in s_up rate

26
Segmentation Scheme III: K Means Cluster
We use the K Means clustering algorithm in SPSS to arrive at a 4 cluster solution as follows.
This scheme has a similar pattern as segmentation scheme I above. Here, we have taken
Likert scaled variable daily routine instead of the binary variable f_24 (whether used in last
24 hrs) and price sensitivity on 4 point bipolar scale. This restructuring reveals a segment of
attached users who may not use every day yet are relatively price insensitive. This may be
due to more attitudinal loyalty than behavioural.
Final Cluster Centers (Scheme II)
Cluster
1 2 3 4
intouch 2 4 2 3
ps_1 3.0 3.2 1.3 1.6
daily
routine
2 4 2 4
sensible 3 3 2 3
Tables 6A
Segment* % Description of profile
1
Light but
loyal user
19
Not a daily routine for most, yet attachment is high, tends to use Facebook
less for keeping in touch with friends than those in cluster 2 and 4. Unlike
cluster 2, does not find Facebook a trivial or frivolous activity. Likely to pay
$1 a month to use a Facebook account.
2
Engaged
user
21
Daily routine and high engagement, habituated to Facebook use for keeping
in touch with friends, finds Facebook activities meaningful and serious rather
than trivial or frivolous. More likely than the other 3 groups to pay a price
for using the Facebook account.
3
Infrequent
user
22
Not a daily activity and low in engagement, doesn’t feel out of touch when
s\he misses out on Facebook for a while; Facebook is a trivial activity.
Unlikely to pay even $1 a month towards using a Facebook account.
4
Frequent
user
38
It’s a daily routine, but engagement is low, Facebook is useful for keeping in
touch but extent of habituation is limited, finds it sensible to use Facebook.
Unlikely to pay even 1$ a month for use.
*Method of Extraction: K Means Clusters
Table 6B
27
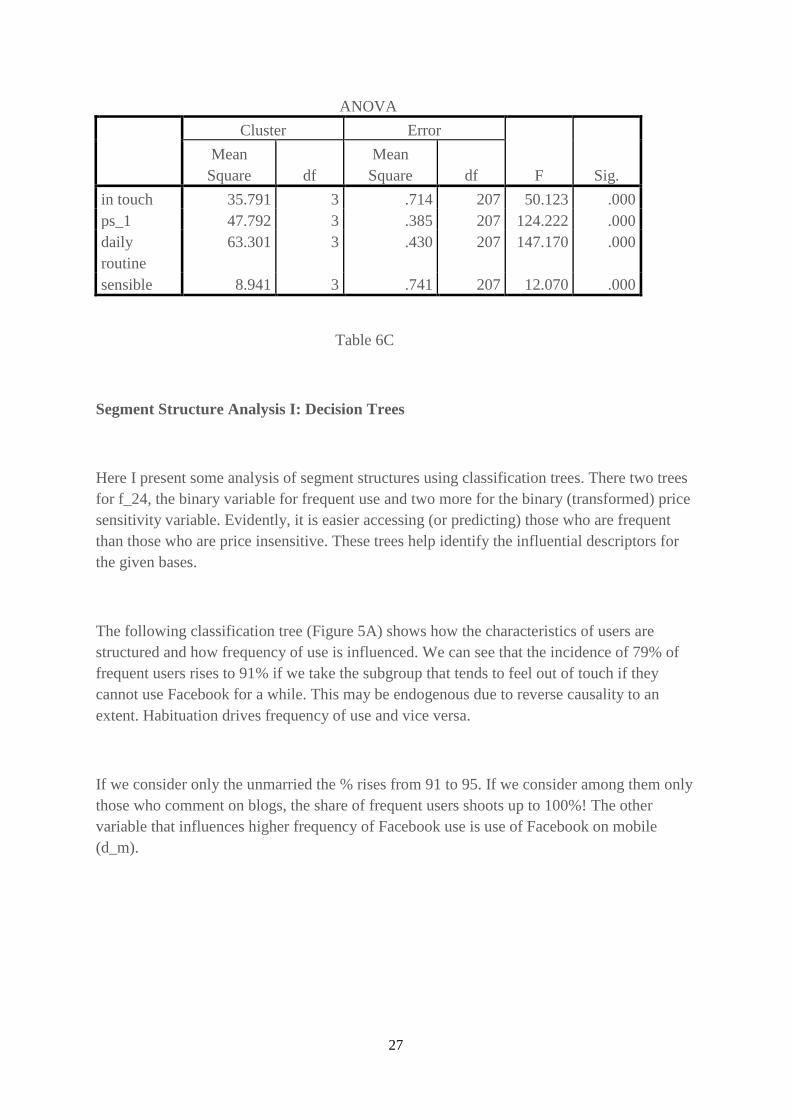
ANOVA
Cluster Error
F Sig.
Mean
Square df
Mean
Square df
in touch 35.791 3 .714 207 50.123 .000
ps_1 47.792 3 .385 207 124.222 .000
daily
routine
63.301 3 .430 207 147.170 .000
sensible 8.941 3 .741 207 12.070 .000
Table 6C
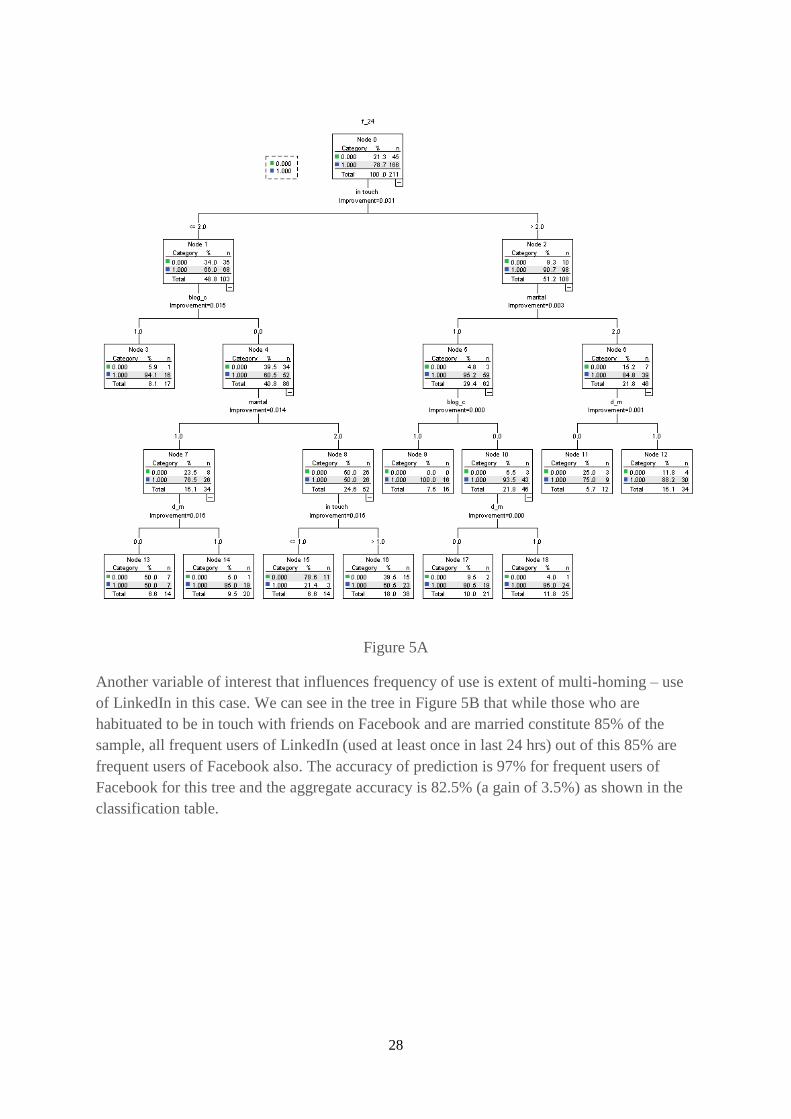
Segment Structure Analysis I: Decision Trees
Here I present some analysis of segment structures using classification trees. There two trees
for f_24, the binary variable for frequent use and two more for the binary (transformed) price
sensitivity variable. Evidently, it is easier accessing (or predicting) those who are frequent
than those who are price insensitive. These trees help identify the influential descriptors for
the given bases.
The following classification tree (Figure 5A) shows how the characteristics of users are
structured and how frequency of use is influenced. We can see that the incidence of 79% of
frequent users rises to 91% if we take the subgroup that tends to feel out of touch if they
cannot use Facebook for a while. This may be endogenous due to reverse causality to an
extent. Habituation drives frequency of use and vice versa.
If we consider only the unmarried the % rises from 91 to 95. If we consider among them only
those who comment on blogs, the share of frequent users shoots up to 100%! The other
variable that influences higher frequency of Facebook use is use of Facebook on mobile
(d_m).
28
Figure 5A
Another variable of interest that influences frequency of use is extent of multi-homing – use
of LinkedIn in this case. We can see in the tree in Figure 5B that while those who are
habituated to be in touch with friends on Facebook and are married constitute 85% of the
sample, all frequent users of LinkedIn (used at least once in last 24 hrs) out of this 85% are
frequent users of Facebook also. The accuracy of prediction is 97% for frequent users of
Facebook for this tree and the aggregate accuracy is 82.5% (a gain of 3.5%) as shown in the
classification table.

29
Figure 5B
Classification
Observed
Predicted
0 1
Percent
Correct
0 13 32 28.9%
1 5 161 97.0%
Overall
Percentage
8.5% 91.5% 82.5%
Table 7A
The tree for binary price sensitivity variable ps_1a is lower on overall predictive accuracy as
seen from the classification table 7B below.
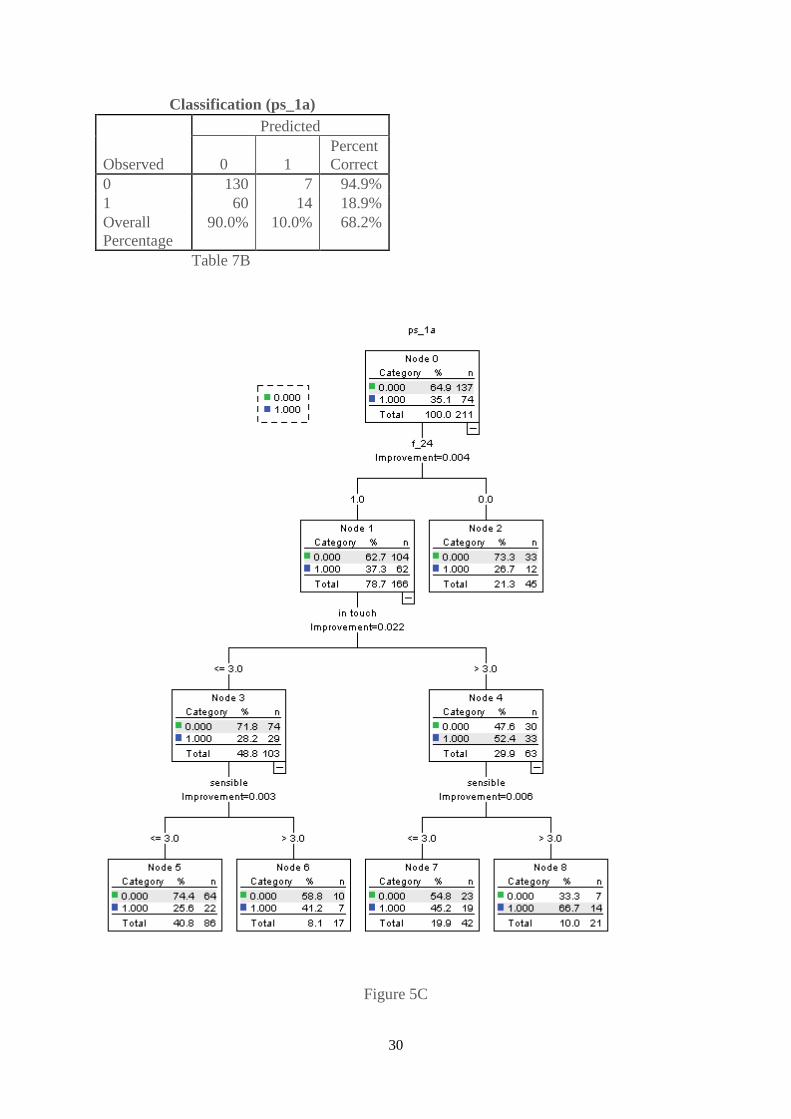
30
Classification (ps_1a)
Observed
Predicted
0 1
Percent
Correct
0 130 7 94.9%
1 60 14 18.9%
Overall
Percentage
90.0% 10.0% 68.2%
Table 7B
Figure 5C
31
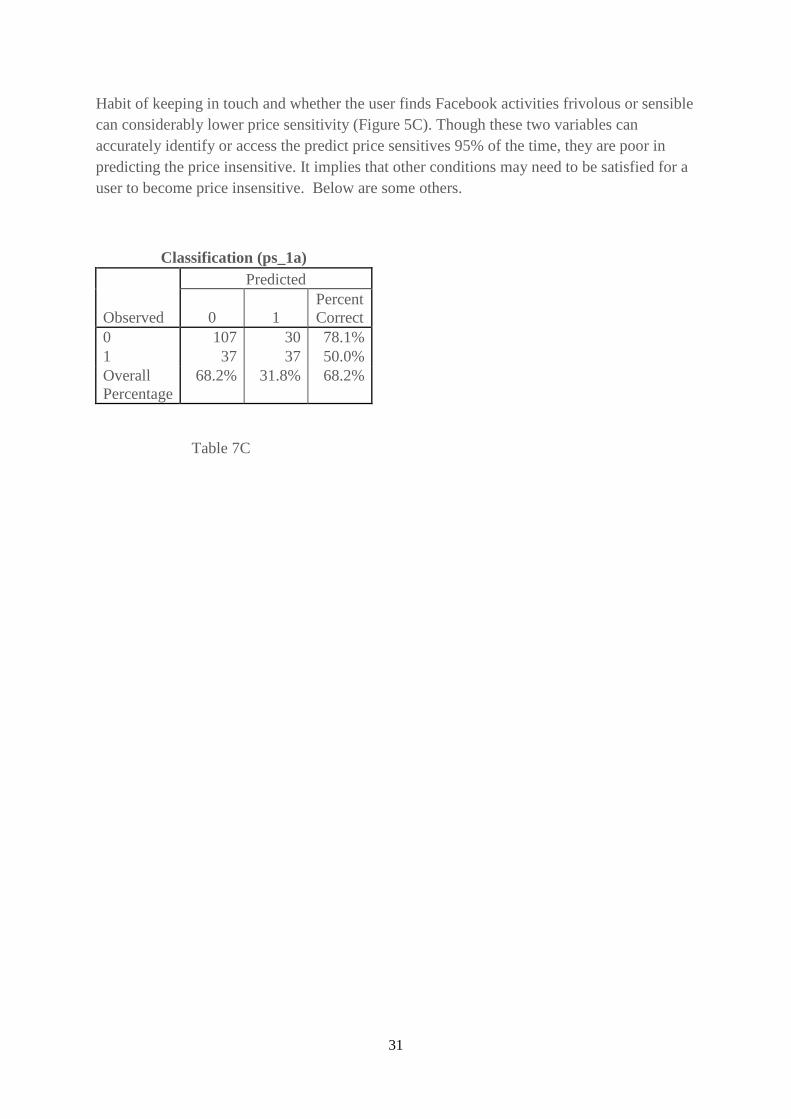
Habit of keeping in touch and whether the user finds Facebook activities frivolous or sensible
can considerably lower price sensitivity (Figure 5C). Though these two variables can
accurately identify or access the predict price sensitives 95% of the time, they are poor in
predicting the price insensitive. It implies that other conditions may need to be satisfied for a
user to become price insensitive. Below are some others.
Classification (ps_1a)
Observed
Predicted
0 1
Percent
Correct
0 107 30 78.1%
1 37 37 50.0%
Overall
Percentage
68.2% 31.8% 68.2%
Table 7C

32
Figure 5D
Segment Structure Analysis II: ANN
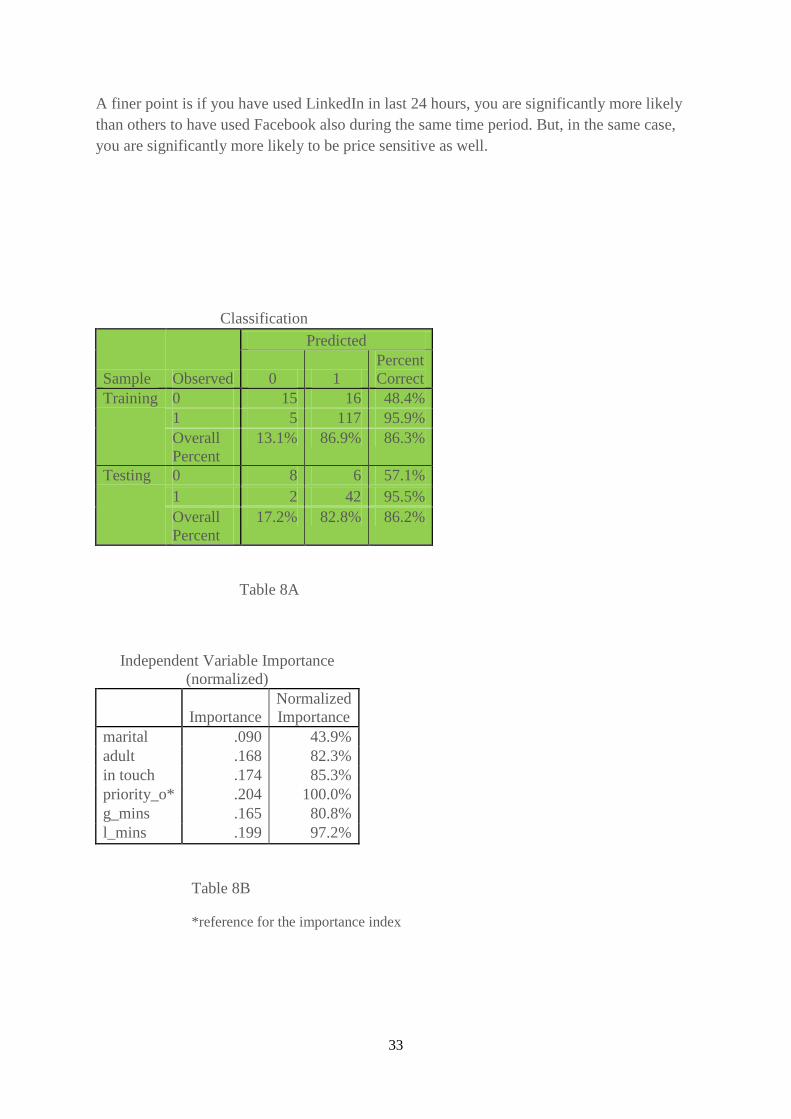
Using Artificial Neural Network (ANN), I found that a few specific variables can help predict
dependent variable frequent users (f_24 = 1) with an accuracy as high as 95% as shown
below in Table 5A. The variables are shown in table 5B below. The overall accuracy of 86%
in training as well as testing is also gain over the sample incidence of 79%. It is evident that
multi-homing and alternate means or ways of keeping in touch strongly influences frequency
of use.
33
A finer point is if you have used LinkedIn in last 24 hours, you are significantly more likely
than others to have used Facebook also during the same time period. But, in the same case,
you are significantly more likely to be price sensitive as well.
Classification
Sample Observed
Predicted
0 1
Percent
Correct
Training 0 15 16 48.4%
1 5 117 95.9%
Overall
Percent
13.1% 86.9% 86.3%
Testing 0 8 6 57.1%
1 2 42 95.5%
Overall
Percent
17.2% 82.8% 86.2%
Table 8A
Independent Variable Importance
(normalized)
Importance
Normalized
Importance
marital .090 43.9%
adult .168 82.3%
in touch .174 85.3%
priority_o* .204 100.0%
g_mins .165 80.8%
l_mins .199 97.2%
Table 8B
*reference for the importance index

34
Figure 6A
Predicting price sensitivity with ANN is easier when we use adequate number of descriptors.
We can get 84% accuracy in identifying the price sensitive as seen in the classification tree
below. The area under the curve is .724. So there is a gain of 22.4% compared to a random
process of prediction.
Classification
Sample Observed
Predicted
0 1
Percent
Correct
Training 0 83 10 89.2%
1 24 15 38.5%
Overall
Percent
81.1% 18.9% 74.2%
Testing 0 17 2 89.5%
1 14 5 26.3%
Overall
Percent
81.6% 18.4% 57.9%
Holdout 0 21 4 84.0%
1 12 4 25.0%
Overall
Percent
80.5% 19.5% 61.0%
Table 8D

35
Area Under the Curve
Area
ps_1
binary
0 .724
1 .724
Table 8E
Network Information
Input
Layer
Factors 1 marital
2 blog_c
3 f_24
Covariates 1 influential
2 adult
3 in touch
4 sensible
5 l_mins
6 g_mins
7 priority_o
Number
of Units
13
Rescaling
Method
for
Covariates
Adjusted
normalized
Hidden
Layer
Number
of Units
6a
Activation
Function
Softmax
Output
Layer
Dependent
Variables
1 ps_1
binary
Number of Units 2
Activation Function Identity
Error Function Sum of
Squares
Table 8F
36
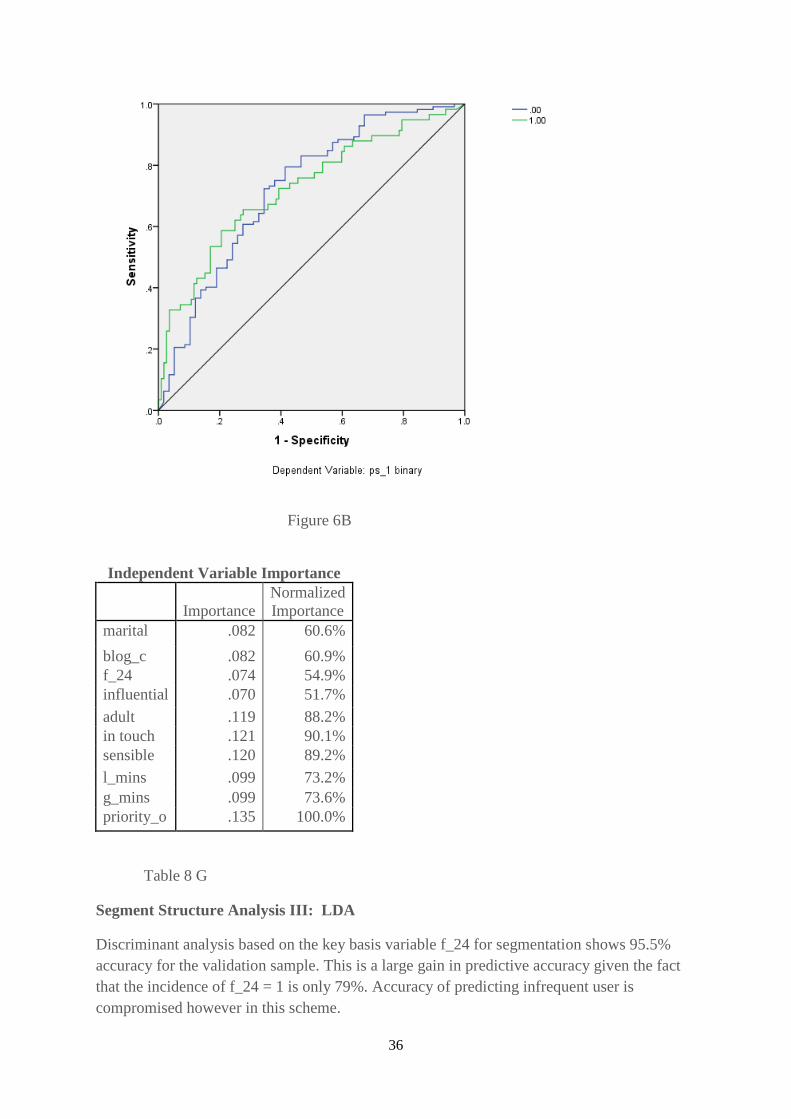
Figure 6B
Independent Variable Importance
Importance
Normalized
Importance
marital .082 60.6%
blog_c .082 60.9%
f_24 .074 54.9%
influential .070 51.7%
adult .119 88.2%
in touch .121 90.1%
sensible .120 89.2%
l_mins .099 73.2%
g_mins .099 73.6%
priority_o .135 100.0%
Table 8 G
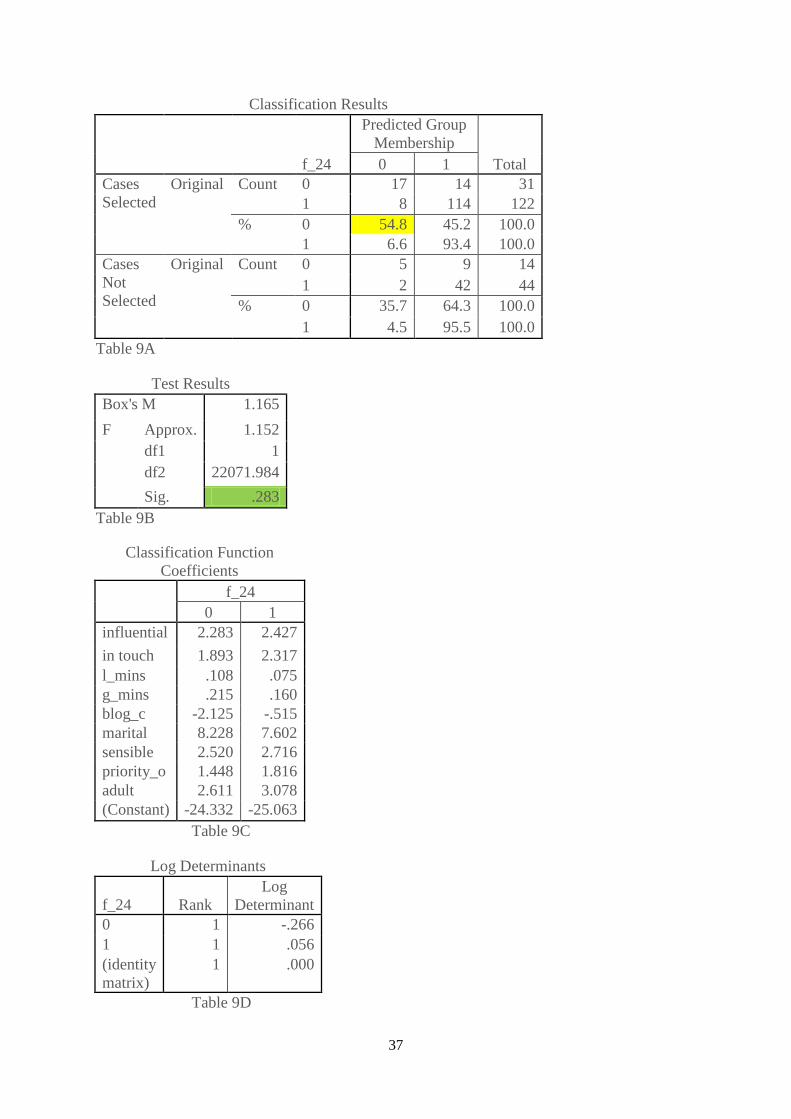
Segment Structure Analysis III: LDA
Discriminant analysis based on the key basis variable f_24 for segmentation shows 95.5%
accuracy for the validation sample. This is a large gain in predictive accuracy given the fact
that the incidence of f_24 = 1 is only 79%. Accuracy of predicting infrequent user is
compromised however in this scheme.
37
Classification Results
f_24
Predicted Group
Membership
Total
0 1
Cases
Selected
Original Count 0 17 14 31
1 8 114 122
% 0 54.8 45.2 100.0
1 6.6 93.4 100.0
Cases
Not
Selected
Original Count 0 5 9 14
1 2 42 44
% 0 35.7 64.3 100.0
1 4.5 95.5 100.0
Table 9A
Test Results
Box's M 1.165
F Approx. 1.152
df1 1
df2 22071.984
Sig. .283
Table 9B
Classification Function
Coefficients
f_24
0 1
influential 2.283 2.427
in touch 1.893 2.317
l_mins .108 .075
g_mins .215 .160
blog_c -2.125 -.515
marital 8.228 7.602
sensible 2.520 2.716
priority_o 1.448 1.816
adult 2.611 3.078
(Constant) -24.332 -25.063
Table 9C
Log Determinants
f_24 Rank
Log
Determinant
0 1 -.266
1 1 .056
(identity
matrix)
1 .000
Table 9D
38
The preceding analysis shows that a 3 or 4 cluster solution with f_24 (frequency of use) and
ps_1a (price sensitivity) as the key basis variables is appropriate in the given circumstances.
These basis or dependent variables may be predicted or accessed well by the demonstrated set
of descriptor variables. The list of descriptors to predict ps_1a however is rather long. This
analysis however provides a segmentation solution that doesn’t make sure that the interests of
affiliate marketers and developers are addressed adequately. Data on connecting and
engaging with marketers is not collected in this survey. Use of apps/games is surprisingly low
in frequency. The pilot round revealed that very few in this sample buy apps/games related
virtual offerings. Evidence to evaluate some of the propositions for segmenting at MSP level
(rather than based on the Face book Company - user interaction) is available to a limited
extent in the data set and I shall discuss it in the next section.
Discussions
In this section, I shall discuss in the light of the preceding empirical analysis, some of the
propositions put forth earlier. Subsequently, I would try to relate the various strands of
understandings gained in the study so far in an overall perspective. The guiding theme is how
market segmentation and targeting can be optimized at an aggregate level in the case of a
MSP like Facebook. How best the convergent and divergent interests of the four players on
the platform can be configured in a way that helps achieve the optimum at an aggregate level.
Propositions
Some aspects of the five propositions I put forth earlier can be examined in the light of the
findings of the preceding empirical analysis. The empirical evidence strongly supports
segmentation scheme that was proposed a priori (this was based on a pilot study of 50
respondents) in proposition 2 (p 11). For the SNS, infrequent, frequent and engaged are
groups that meet the requirement (Lilien et al. 2004; Frank et al. 1972) of appropriate
segments as follows.
There is significant heterogeneity in extent and types of needs (see table 3B and 3C) across
the segments.
Though users are heterogeneous across groups, they do cluster into homogeneous groups.
These segments respond differently to the firm’s promotional activities or marketing
communications.
Prima facie there is no reason to think that addressing segment specific needs would not be
cost effective.
Using descriptor or access variables, it is possible to predict segment membership with
reasonable accuracy
In segmentation scheme II (p 25), one sees that among frequent users; when price sensitivity
goes down from 1.5 to 2.8 to 3.4 (across clusters 1-3-4), the rate of status update moves from
1.15 to a high of 4.09 to a low of 1.11. (see figure 7 below)

39
Figure 7
Such nonlinear pattern implies that for a sizeable segment like the engaged in scheme II,
some type of activities will not go up with rise in frequency of use or falling price sensitivity
( price sensitivity is a proxy measure for engagement as supported by the findings of this
study). Therefore, if Facebook, the platform provider drives use and engagement, it doesn’t
necessarily raise the use and engagement in relation to all types of activities. It may even fall
like it does in this case. This is evidence that substantiates proposition 1.
By implication, it is possible that response to marketers and use of apps/games may fall for
some segments while use and engagement with Facebook SNS rises. The chart above shows
just that. Even if price sensitivity falls from 2 to 3 (from likely to discontinue if charged $1 a
month for Facebook use to likely to continue in the same case), use of apps/games falls from
1 to 0.8. This observation lends support to proposition 1 which may be restated to say that
interests of marketers and developers are not addressed adequately and automatically if the
interest of Facebook in the Facebook-user interaction alone is taken care of. Ensuring that
users use and engage in the best possible way with the platform doesn’t necessarily ensure
that the users do so with marketers and developers. Sometimes, it may have a negative
fallout. There are various same-side/cross-side and positive/negative externality or network
effects at work.
For the Facebook – user interaction, the effectiveness of segmenting users into 3 groups
according to proposition 2 was seen earlier with the analysis of survey data (Table 3B). The
table and segment structure analyses show that such behavioural segmentation may be more
40
useful from a marketing point of view than segmenting on the basis of variables such as
benefits or demographics or psychographics. In the same analysis, we also observe that a
similar pattern of classification may hold good for the developer – user interaction through
apps/games. Rate of using apps/games are 1.02a, .84
ac and .44
c – engaged and infrequent
users significantly differ on frequency of using apps/games. The difference in frequency of
use of apps/games between the frequent and engaged users of Facebook however is not
statistically significant. This implies that engaged users of Facebook may not be any more
lucrative as a segment for developers than frequent users if we assume that profits generated
by users of apps/games is proportional to frequency of using apps/games. Adhering to
proposition 2 may not always be useful as it may be redundant in some cases because of
inadequate heterogeneity across segments. Proposition 2 may be viewed as a general
principle that may not be efficient in some situations. Such situations however may be
difficult to tell a priori.
Proposition 3d on multi-homing can also be evaluated here to an extent. We see from the tree
diagram for f_24 in figure X that variable l_24 (whether used LinkedIn in last 24hrs, a
measure of multihoming) makes a substantial difference – a jump from 85% to 100% to f_24,
whether used Facebook in last 24 hrs. Very likely, there are complementarities or positive
association. In the event of such positive association, multi-homing is likely to lead to
convergence rather than divergence. Multi-homing is unlikely to lead to divergence if the
user views the concerned offerings as complements.
Comprehensive Market Segmentation
Next, we consider the comprehensive approach to market segmentation of Facebook users.
Conventional wisdom says that we should go for not more than 8 segments. But Facebook
has more than a billion users. One need not persist with the norm. Theoretically, we can
extend Table 1 (p 13) to make room for 3 groups each for Facebook Company, marketers as a
group and developers as a group. A priori, the segments may be infrequent, frequent and
engaged. In case of developer, ‘engaged’ may include purchase and attitudes/behaviours in
relation to apps/games/developers beyond purchase. We may introduce a customer value
index based on the average purchase or lower quartile of purchase as an alternative or in
addition to engagement. In case of the Facebook Company, the response variables are use and
engagement or change in response with stimulus such as change in price. Similarly, for
marketers also, we can find 3 groups. Depending on how many independent segments we
divide the user base into for each party; we may have 33 to 4
3 or 27 to 64 theoretical
combinatorial groups/segments instead of the 8 (22) groups we got in Table 1 .
On the lines of Table 1, if we divide users into 3 groups (see Figure 8) each (F1, F2 & F3 for
SNS users, M1, M2 & M3 for marketers and D1, D2 & D3 for Developers), we would have a
range of 27 theoretical groups – a Rubik’s cube (let’s call it F Cube for our purpose here) of
segments. Imagine a vertex of this F cube sitting on (x,y,z) axes at (0,0,0). If F1, F2 and F3
are on X axis, M1, M2 and M3 on Y and D1, D2 and D3 on Z and each small cube out of the
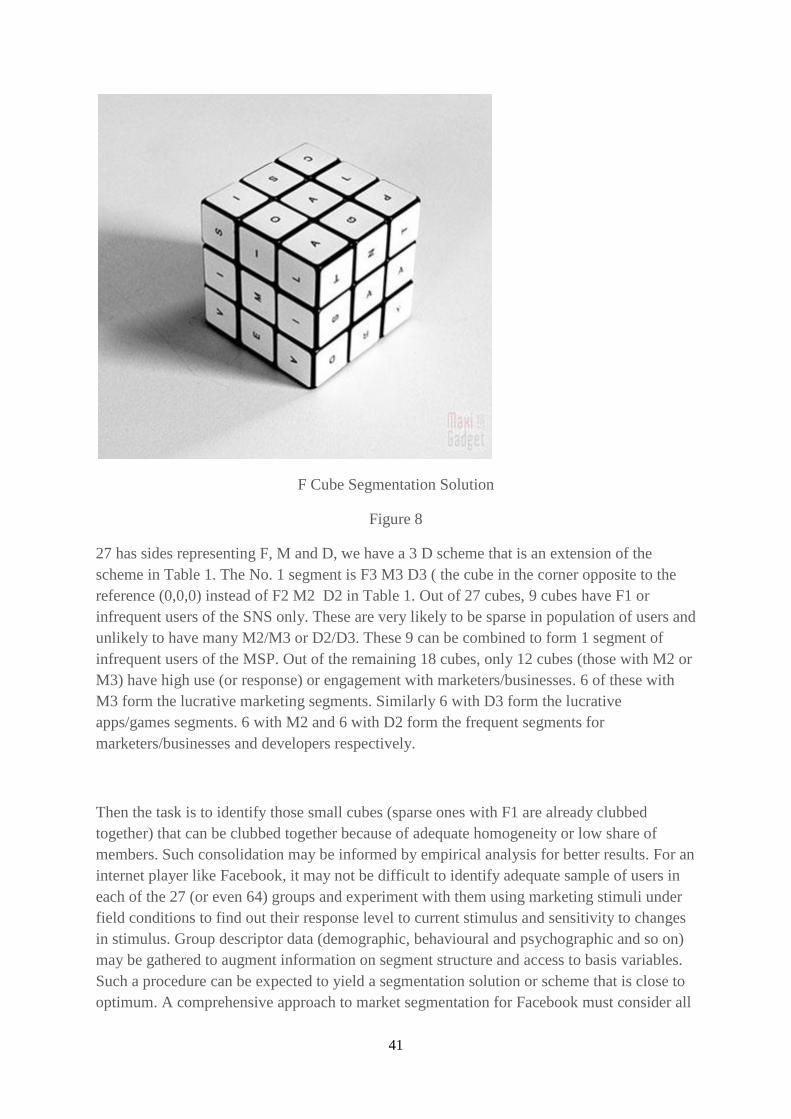
41
F Cube Segmentation Solution
Figure 8
27 has sides representing F, M and D, we have a 3 D scheme that is an extension of the
scheme in Table 1. The No. 1 segment is F3 M3 D3 ( the cube in the corner opposite to the
reference (0,0,0) instead of F2 M2 D2 in Table 1. Out of 27 cubes, 9 cubes have F1 or
infrequent users of the SNS only. These are very likely to be sparse in population of users and
unlikely to have many M2/M3 or D2/D3. These 9 can be combined to form 1 segment of
infrequent users of the MSP. Out of the remaining 18 cubes, only 12 cubes (those with M2 or
M3) have high use (or response) or engagement with marketers/businesses. 6 of these with
M3 form the lucrative marketing segments. Similarly 6 with D3 form the lucrative
apps/games segments. 6 with M2 and 6 with D2 form the frequent segments for
marketers/businesses and developers respectively.
Then the task is to identify those small cubes (sparse ones with F1 are already clubbed
together) that can be clubbed together because of adequate homogeneity or low share of
members. Such consolidation may be informed by empirical analysis for better results. For an
internet player like Facebook, it may not be difficult to identify adequate sample of users in
each of the 27 (or even 64) groups and experiment with them using marketing stimuli under
field conditions to find out their response level to current stimulus and sensitivity to changes
in stimulus. Group descriptor data (demographic, behavioural and psychographic and so on)
may be gathered to augment information on segment structure and access to basis variables.
Such a procedure can be expected to yield a segmentation solution or scheme that is close to
optimum. A comprehensive approach to market segmentation for Facebook must consider all
42
same side and cross-side network effects and the key interactions the user has with the three
key players – Facebook Company and its affiliate marketers and developers.
As discussed earlier in the section on propositions, a key understanding, theoretical as well as
empirical, that is of value in order to develop an effective segmentation strategy for a MSP
like Facebook is the factors that lead to convergence and divergence of response at user level
for the 3 different business players – Facebook Company, marketers and developers. Such
factors can be wide ranging and theoretical as well as contextual. Future research may
identify the key factors that would influence segmentation strategy and their extent of
influence on outcomes of strategy.
References
Ajzen, I. (1991). The theory of planned behavior. Organizational behavior and human
decision processes, 50(2), 179-211.
Barwise, P., & Meehan, S. (2010). The one thing you must get right when building a
brand. Harvard Business Review, 88(12), 80-84.
Bernoff, Josh (2010). Introducing The New Social Technographics, Forrester Research
Brandtzaeg, P. B., & Heim, J. (2011) A typology of social networking sites users.
International Journal of Web Based Communities, 7(1), 28-51.
Chui, Michael, et al. "The Social Economy: Unlocking Value and Productivity Through
Social Technologies." McKinsey Global Institute, July 22, 2012.
Eisenmann, T., Parker, G., & Van Alstyne, M. W. (2006). Strategies for two-sided
markets. Harvard business review, 84(10), 92.
Ellison, N. B. (2007). Social network sites: Definition, history, and scholarship.Journal of
Computer‐Mediated Communication, 13(1), 210-230.
Enders, A., Hungenberg, H., Denker, H. P., & Mauch, S. (2008). The long tail of social
networking: Revenue models of social networking sites. European Management
Journal, 26(3), 199-211.
Evans, David S., and Schmalensee, Richard (2005). The industrial organization of markets
with two-sided platforms, NBER Working Paper
Foster, M., West, B., & Francescucci, A. (2011). Exploring social media user segmentation
and online brand profiles. Journal of Brand Management, 19(1), 4-17.
43
Granovetter, M. S. (1973). The strength of weak ties. American journal of sociology, 1360-
1380.
Hagiu, A., & Wright, J. (2011). Multi-sided platforms. Working Paper, Harvard Business
School.
Heinonen, K. (2011). Consumer activity in social media: Managerial approaches to
consumers' social media behavior. Journal of Consumer Behaviour, 10(6), 356-364.
Keller, K. L. (1993). Conceptualizing, measuring, and managing customer-based brand
equity. The Journal of Marketing, 1-22.
Lee, C., Jarvinen, V., & Sutherland, J. (2011). Profiling social network site users: Who is the
most responsive to marketing attempts? In conference of the American Academy of
Advertising (p. 59).
Lilien, G. L., Kotler, P., & Moorthy, K. S. (1992). Marketing models (pp. 385-397).
Englewood Cliffs: Prentice-Hall.
Lilien, G. L., & Rangaswamy, A. (2004). Marketing engineering: computer-assisted
marketing analysis and planning. DecisionPro.
Lorenzo-Romero, C., & Alarcón-del-Amo, M. D. C. (2012). Segmentation of users of social
networking websites. Social Behavior and Personality: an international journal, 40(3), 401-
414.
Frank, R. E., Massy, W. F., & Wind, Y. (1972). Market segmentation. Englewood Cliffs, NJ:
Prentice-Hall.
Rochet, J. C., & Tirole, J. (2006). Two‐sided markets: a progress report. The RAND Journal
of Economics, 37(3), 645-667.
Rysman, M. (2009) “The Economics of Two-Sided Markets,” Journal of Economic
Perspectives, 23(3): 125-143.
Shontell, Alyson (2013). http://www.businessinsider.com/its-official-teens-are-bored-of-
facebook-2013-3
Smith, W. R. (1956). Product differentiation and market segmentation as alternative
marketing strategies. The Journal of Marketing, 21(1), 3-8.
Van Doorn, J., Lemon, K. N., Mittal, V., Nass, S., Pick, D., Pirner, P., & Verhoef, P. C.
(2010). Customer engagement behavior: theoretical foundations and research
directions. Journal of Service Research, 13(3), 253-266.