working paper no 1 · 2013-10-23 · regional economic profile profile and trends 2 square...
TRANSCRIPT

Capes Regional Economic
Development Strategy
Regional economic profile
Working Paper No 1
Final Draft 31 March 2009

Reliance and Disclaimer The professional analysis and advice in this report has been prepared by ACIL Tasman for the exclusive use of the party or parties to whom it is addressed (the addressee) and for the purposes specified in it. This report is supplied in good faith and reflects the knowledge, expertise and experience of the consultants involved. The report must not be published, quoted or disseminated to any other party without ACIL Tasman’s prior written consent. ACIL Tasman accepts no responsibility whatsoever for any loss occasioned by any person acting or refraining from action as a result of reliance on the report, other than the addressee. In conducting the analysis in this report ACIL Tasman has endeavoured to use what it considers is the best information available at the date of publication, including information supplied by the addressee. Unless stated otherwise, ACIL Tasman does not warrant the accuracy of any forecast or prediction in the report. Although ACIL Tasman exercises reasonable care when making forecasts or predictions, factors in the process, such as future market behaviour, are inherently uncertain and cannot be forecast or predicted reliably. ACIL Tasman shall not be liable in respect of any claim arising out of the failure of a client investment to perform to the advantage of the client or to the advantage of the client to the degree suggested or assumed in any advice or forecast given by ACIL Tasman.
ACIL Tasman Pty Ltd ABN 68 102 652 148 Internet www.aciltasman.com.au
Melbourne (Head Office) Level 6, 224-236 Queen Street Melbourne VIC 3000 Telephone (+61 3) 9600 3144 Facsimile (+61 3) 9600 3155 Email [email protected]
Darwin Suite G1, Paspalis Centrepoint 48-50 Smith Street Darwin NT 0800 GPO Box 908 Darwin NT 0801 Telephone (+61 8) 8943 0643 Facsimile (+61 8) 8941 0848 Email [email protected]
Brisbane Level 15, 127 Creek Street Brisbane QLD 4000 GPO Box 32 Brisbane QLD 4001 Telephone (+61 7) 3009 8700 Facsimile (+61 7) 3009 8799 Email [email protected]
Perth Centa Building C2, 118 Railway Street West Perth WA 6005 Telephone (+61 8) 9449 9600 Facsimile (+61 8) 9322 3955 Email [email protected]
Canberra Level 1, 33 Ainslie Place Canberra City ACT 2600 GPO Box 1322 Canberra ACT 2601 Telephone (+61 2) 6103 8200 Facsimile (+61 2) 6103 8233 Email [email protected]
Sydney PO Box 1554 Double Bay NSW 1360 Telephone (+61 2) 9958 6644 Facsimile (+61 2) 8080 8142 Email [email protected]
For information on this report Please contact: Ian Satchwell Telephone (08) 9449 9600 Mobile 0404 822 492 Email [email protected]

Regional economic profile
iii
Contents 1 Overview 1
2 Profile and trends 1
2.1 Geographic location 1
2.2 Economic history 3
2.2.1 Changes in industry structure 3
2.2.2 Employment trends 3
2.3 The economy today 6
2.3.1 The South West 6
2.3.2 Capes Region 6
2.3.3 Services sector 9
2.3.4 Agriculture 10
2.3.5 Manufacturing 11
2.3.6 Tourism 11
2.3.7 Retail trade 13
2.3.8 Construction sector and its supply chain 13
2.4 Workforce and labour market 14
2.4.1 Unemployment 15
2.4.2 Labour force participation 16
2.4.3 Occupations 19
2.4.4 Education and training 21
2.5 Population profile and trends 23
2.5.1 Population change 23
2.5.2 Age profile 23
2.5.3 Population mobility 24
2.5.4 Incomes 25
2.5.5 Resident population of Capes Region settlements 27
2.5.6 Non resident population 28
3 Statistical analysis of the Capes Region economy 30
3.1 Input-output analysis 31
3.1.1 The Capes Region input-output table 31
3.1.2 Interpreting the Capes Region input-output table 31
3.2 Location quotient analysis 34
3.2.1 Location quotients – employment 34
3.2.2 Location quotients – business enterprises 35
3.3 Shift share analysis 36
3.4 Summary of analysis 38

Regional economic profile
iv
A Technical appendix A-1
Boxes, figures and tables Box 1 Location quotient formula A-1 Box 2 Shift share formula A-8 Figure 1 South West Region of Western Australia showing Capes Region Shires 2 Figure 2 Share of employment (% of workforce): Western Australia and Capes
Region: retail trade industry 5 Figure 3 Share of employment (% of workforce): Western Australia and Capes
Region: Agriculture, Forestry and Fishing industry 6 Figure 4 Composition of economies: Shires, Capes Region and South West, 2006 8 Figure 5 Average sales value of dwellings: South West Region and Capes Region 10 Figure 6 Capes Region and Shire building approvals 14 Figure 7 Size of the labour force in Capes Region (Vasse) and the South West
1996-2006 15 Figure 8 Unemployment rates in Capes Region (Vasse), South West and Western
Australia 1996-2006 (%) 16 Figure 9 Labour force participation rates in the Capes Region (Vasse), South West
and Western Australia 1996-2006 (%) 16 Figure 10 Labour force participation rates by age in Capes Region (Vasse) and
South West 1996-2006 17 Figure 11 Employment by industry (% of workforce): Capes Region (Vasse) and
South West, 2006 17 Figure 12 Labour force by occupation in the Capes Region (Vasse), the South West
and Western Australia (%) 20 Figure 13 Percentage of people that finished year 12, Capes Region and WA 2006 22 Figure 14 Population change in Capes Region (Vasse) and the South West, 1996-
2006 23 Figure 15 Age structure of the Capes Region (Vasse) and South West 2006 24 Figure 16 Median individual weekly income in the Capes Region (Vasse), South
West and Western Australia, 1996-2006 ($/weekly) 26 Figure 17 Median household income Capes Region (Vasse), South West and
Western Australia, 1996-2006 ($/weekly) 26 Figure 18 Location quotient analysis – Capes Region employment 35 Table 1 Contribution to Gross Regional Product, key industries in the South
West 2001 and 2006 4 Table 2 Top employment by industry (% of workforce): Western Australia and
Capes Region 1991 to 2006 5 Table 3 Industry sector contributions to Capes Region GRP 2006 9 Table 4 Visitors and visitor nights, Capes Region average 2005, 2006, 2007 12 Table 5 Overnight visitor numbers and nights, Capes Region, 1999 to 2007 12 Table 6 Visitor expenditure, Capes Region average 2005, 2006, 2007 13 Table 7 Employment by industry (% of workforce): Western Australia and Capes
Region (2006) 18 Table 8 Population mobility in the South West 2001-06 25 Table 9 Estimated resident populations of selected Capes Region settlements,
2006 27

Regional economic profile
v
Table 10 Estimated resident populations 2006 (ABS final) 28 Table 11 Aggregated input-output table, Capes Region 33 Table 12 Location quotients: South West, Capes Region, Augusta Margaret River
and Busselton (2006) A-3 Table 13 Employment by industry and location quotients, Capes Region A-4 Table 14 Shift Share analysis, Capes Region A-9 Table 15 ANZSIC Divisions 2006 A-12

Regional economic profile
Overview 1
1 Overview This Regional Economic Profile (Working Paper 1) is one of several documents that underpin the Capes Regional Economic Development Strategy (the Strategy), developed collaboratively between the Shire Councils of Augusta Margaret River and Busselton.
The purpose of the Strategy is to foster the creation of sustainable economic and jobs growth in the region.
The Shires are in the process of updating their Local Planning Strategies and Schemes, and in conjunction with these processes are preparing economic, social and infrastructure strategies.
Other working papers that inform and support the Strategy are: • Working Paper 2: Vision document considering growth trends and future
direction for the economy of the region • Working Paper 3: Industry plans – current industry profiles, and strategies
and actions per industry to promote economic growth • Working Paper 4: Government Action Plans – considering the industry
plans and regional issues, proposed actions by levels of government to support and facilitate economic development
• Working Paper 5: Cluster Plans – plans where cross-industry cooperation could benefit industry development
Working Paper 6 is the Strategy itself: a summary providing a concise strategy for economic development in the Capes Region
2 Profile and trends The nature of the Capes Region is changing, not least because of its liveability, unique lifestyle, proximity to major regional urban centres and to Perth, and the opportunities afforded by globalisation and the new economy. All of these factors contribute to strong regional population growth.
While traditional industries that have been the mainstay of employment in the Capes Region will continue to play a major role in the economic life of the Region, new industries and occupations as well as home based and micro businesses are emerging.
2.1 Geographic location The Capes Region is part of the South West region, which is one of nine Western Australian regions. The South West covers an area just under 24,000

Regional economic profile
Profile and trends 2
square kilometres, and has a population approaching 140,000. It incorporates the port town of Bunbury which is a major administrative centre within the Region, with Collie, Busselton, Manjimup and Margaret River playing important sub-regional roles.
The Australian Bureau of Statistics has divided the Region into four statistical subdivisions: Blackwood, Bunbury, Preston and Vasse. The Vasse Region incorporates the local government areas of Busselton and Augusta Margaret River, which in this report we have designated as the Capes Region.
The area of the Capes Region is 2,242.6 km2 or 9 per cent of the South West Region. It has a population of more that 38,000.
Figure 1 South West Region of Western Australia showing Capes Region Shires
Source: South West Development Commission

Regional economic profile
Profile and trends 3
2.2 Economic history1
Augusta was one of the first European settlements in Western Australia when the area was settled for agricultural purposes in 1830s. It was not until the 1870s that the Augusta Margaret River area was settled by timber industry workers and their families. Not long after the closure of the Karridale sawmill in 1913, the area was opened up for agricultural purposes under the Group Settlement Scheme and the dairy industry began.
European settlement of the Shire of Busselton area also started during the 1830s. Many of the towns in the Busselton coastal area were later established to service the timber industry. The Group Settlement Scheme saw the further development of the agricultural industry.
The wine industry began in the Busselton and Margaret River areas in the late 1960s and the 1970s.
Tourism began to play an important part in the economy of the Capes Region since the mid 1900s due to its diverse coastal location and the natural attractions including the limestone caves of the Leeuwin-Naturaliste National Park.
2.2.1 Changes in industry structure
2.2.2 Changes in industry structure
The economy of the Capes Region has changed over time as relative contributions of industries have changed. These changes have been driven by a range of factors, including changes to markets, changes to technologies, innovation and population changes.
Industry contributions to Gross Regional Product (GRP) in the South West over time illustrate these changes (Table 1), as do employment trends in section 2.2.2 below.
1 The information for this section has come from a variety of sources including Resource
Futures Program, CSIRO Sustainable Ecosystems, Augusta-Margaret River Regional Profile: A background document into the location, demographics, economy and environment of the Shire of Augusta-Margaret River (WA), October 2005 pp 11 – 12.

Regional economic profile
Profile and trends 4
Table 1 Contribution to Gross Regional Product, key industries in the South West 2001 and 2006
Industry Contribution to GRP at factor cost
2001
Contribution to GRP at factor cost
2006
$m % $m %
Services 282 35.0% 485 39.7%
Manufacturing 150 18.6% 213 17.4% Tourism (includes retail, and
accommodation, cafes and restaurants) 120 14.9% 160 13.1%
Construction 71 8.8% 136 11.1%
Agriculture 67 8.3% 104 8.5%
Transport 36 4.4% 33 2.7%
Trade (includes wholesale trade) 27 3.3% 31 2.6%
Govt administration 18 2.2% 29 2.4%
Forestry & fishing 8 1.0% 14 1.2%
Utilities 21 2.6% 9 0.8%
Mining 7 0.8% 6 0.5%
TOTAL 807 1,222
The changes shown are as expected: • Services are growing in importance, in part because of high population
growth • Manufacturing share reflects normal economic fluctuations • The role of tourism also fluctuates, although for this analysis, it includes all
retail and restaurants.
2.2.3 Employment trends
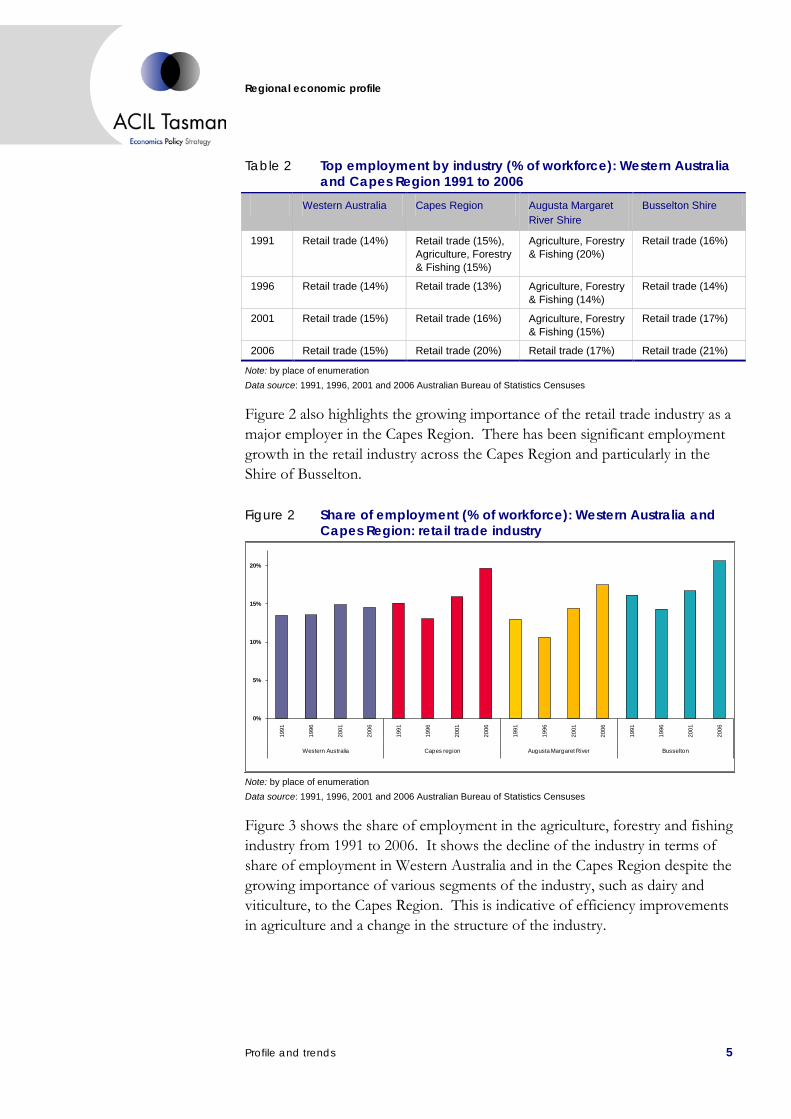
Table 2 shows the largest industries by employment over time in Western Australia, in the Capes Region and in the two Shires. The table shows that the biggest employer in Western Australia is retail trade, which has consistently employed 14 per cent of the working population or more over the period 1991 to 2006. Retail trade is also a large and growing employer in the Capes Region.
Regional economic profile
Profile and trends 5
Table 2 Top employment by industry (% of workforce): Western Australia and Capes Region 1991 to 2006
Western Australia Capes Region Augusta Margaret River Shire
Busselton Shire
1991 Retail trade (14%) Retail trade (15%), Agriculture, Forestry & Fishing (15%)
Agriculture, Forestry & Fishing (20%)
Retail trade (16%)
1996 Retail trade (14%) Retail trade (13%) Agriculture, Forestry & Fishing (14%)
Retail trade (14%)
2001 Retail trade (15%) Retail trade (16%) Agriculture, Forestry & Fishing (15%)
Retail trade (17%)
2006 Retail trade (15%) Retail trade (20%) Retail trade (17%) Retail trade (21%)
Note: by place of enumeration Data source: 1991, 1996, 2001 and 2006 Australian Bureau of Statistics Censuses
Figure 2 also highlights the growing importance of the retail trade industry as a major employer in the Capes Region. There has been significant employment growth in the retail industry across the Capes Region and particularly in the Shire of Busselton.
Figure 2 Share of employment (% of workforce): Western Australia and Capes Region: retail trade industry
0%
5%
10%
15%
20%
1991
1996
2001
2006
1991
1996
2001
2006
1991
1996
2001
2006
1991
1996
2001
2006
Western Australia Capes region Augusta Margaret River Busselton
Note: by place of enumeration Data source: 1991, 1996, 2001 and 2006 Australian Bureau of Statistics Censuses
Figure 3 shows the share of employment in the agriculture, forestry and fishing industry from 1991 to 2006. It shows the decline of the industry in terms of share of employment in Western Australia and in the Capes Region despite the growing importance of various segments of the industry, such as dairy and viticulture, to the Capes Region. This is indicative of efficiency improvements in agriculture and a change in the structure of the industry.

Regional economic profile
Profile and trends 6
Figure 3 Share of employment (% of workforce): Western Australia and Capes Region: Agriculture, Forestry and Fishing industry
0%
2%
4%
6%
8%
10%
12%
14%
16%
18%
20%
1991
1996
2001
2006
1991
1996
2001
2006
1991
1996
2001
2006
1991
1996
2001
2006
Western Australia Capes region Augusta Margaret River Busselton
Note: by place of enumeration Data source: 1991, 1996, 2001 and 2006 Australian Bureau of Statistics Censuses
2.3 The economy today
2.3.1 The South West
The South West is Western Australia’s pre-eminent region in terms of population and economic diversity and growth.
The South West region’s population growth is driven by strong employment prospects associated with economic growth and lifestyle choices. In addition these coastal local governments experience large seasonal population growth, attributable largely to the tourism sector. The South West is the most visited region in Western Australia outside of the Perth Metropolitan Area.
A detailed description of the South West economy is published and updated regularly as part of the South West Development Commission’s Economic Perspective. It contains information about major industry sectors, takes account of economic, social and environmental factors that drive the economy, discusses future opportunities for growth and describes current infrastructure and future proposals to improve service networks. The most recent perspective is available on the Development Commission’s website (www.swdc.wa.gov.au).
2.3.2 Capes Region
The Capes Region’s contribution to the economy of the South West and the State is significant in that the region: • contains one of the largest population concentrations outside of the Perth
Metropolitan Area • is the major visitor destination in the South West

Regional economic profile
Profile and trends 7
• produces nearly all of wine grapes in the South West and two-thirds of the State’s grape production
• contributes significantly to retail turnover in the South West • has around double the average sales value of dwellings of the South West • contributes one third of the South West Region’s workforce • consistently has an unemployment rate below that of Western Australia as a
whole • provides employment in a diverse range of industries including agriculture,
forestry and fishing, retail trade, manufacturing and construction.
Figure 4 and Table 3 show the value of production by industry in the Capes Region, in each of the two Shires and in the South West as a whole. The gross regional product (GRP) of the Capes Region (as calculated by ACIL Tasman) in 2006 was $1.2 billion.

Regional economic profile
Profile and trends 8
The services sector accounts for the largest proportional contribution to GRP in the Capes Region, which exceeds the combined contribution of the next two ranked sectors of manufacturing and tourism. The retail sector is a major component of services and as shown in section 2.2, is a major and growing employer. Construction and agriculture are ranked fourth and fifth respectively in the top five industry sectors.
The workforce and employment rate in the Capes Region has increased steadily during the last ten years. At the same time the unemployment rate has decreased from 8.4 per cent to 3.3 per cent, showing the strength of the economic activity in the region. The distribution of the labour force
Figure 4 Composition of economies: Shires, Capes Region and South West, 2006
0.386 billion Augusta Margaret River economy $1.2 billion Capes Region economy
$0.836 billion Busselton economy $5.3 billion South West economy
Data source: ACIL Tasman Capes Region Input-Output Table for 2006

Regional economic profile
Profile and trends 9
participation is centred around the 20-50 years of age cohort. Construction, retail trade, accommodation and food services, and manufacturing are the most important industries in terms of employment in the region, in line with the South West trend.
Occupation trends are also very similar for the Capes Region and South West. Technicians and trades, managers and labourers are the most important activities.
The trend in education shows an important shift in the education level between past and current generations. Currently more than 50 per cent of the population in the 20-25 years cohort has finished its year 12, in contrast to one and two generations ago for which only 40 per cent and 30 per cent of the population finished year 12.
Table 3 Industry sector contributions to Capes Region GRP 2006 Contribution
to GRP at market prices
Contribution to GRP at factor
cost
Gross operating surplus
Compensation of employees
$m $m % $m
Final demand 106
Services 509 485 39.7% 270 216
Manufacturing 225 213 17.4% 131 82
Tourism 169 160 13.1% 52 108
Construction 139 136 11.1% 74 62
Agriculture 107 104 8.5% 80 23
Transport 37 33 2.7% 16 18
Trade 32 31 2.6% 11 21
Govt administration 31 29 2.4% 4 26
Forestry & fishing 15 14 1.2% 10 4
Utilities 10 9 0.8% 7 3
Mining 7 6 0.5% 5 2
TOTAL 1,395 1,222 658 564
2.3.3 Services sector
The services sector comprises retail services, communications, financial, property, technical services, business and professional services. Together, these services contribute $485 million to the Capes Region GRP, or 39.7 per cent. For the purpose of this analysis, the services sector excludes education, health and community services, which while important industries, are included in Table 3 within government administration.

Regional economic profile
Profile and trends 10
Property, property services and professional services (eg legal, accounting and taxation services) comprise a significant component of the GRP of the Capes Region. Together these sectors contribute almost half of the services sector contribution to GRP ($230 million in 2006).
Sales value data presented in Figure 5 shows that the average value of dwellings in the Capes Region is very high at almost twice that of the South West Region as a whole.
In addition, the housing sector has experienced strong growth since 2003. This is believed to be due both to strong population growth in the region placing demand on housing and land stock, and to investment in property in the Capes Region enabled by the strong growth in the State’s economy and in wealth of individuals.
Figure 5 Average sales value of dwellings: South West Region and Capes Region
$100,000
$200,000
$300,000
$400,000
$500,000
1996 1997 1998 1999 2000 2001 2002 2003 2004 2005
Augusta-Margaret River Busselton Capes region South West region
Data source: South West Development Commission from Residential Sales Data, Valuer General's Office, 2006
2.3.4 Agriculture
The contribution of agriculture to the GRP of the Capes Region was $104 million in 2006. Forestry and fishing have traditionally been of less significance to the economy of the Capes Region than in other parts of the South West.
There has been a rapid rise in the value of fruit production in the South West due to growth in the value of wine grape production. In 2003/04, wine grape production accounted for 54.3 per cent of fruit production in the South West2
2 South West Development Commission, Economic Perspective 2007, p 8.
.

Regional economic profile
Profile and trends 11
Nearly all of this production occurs in the Capes Region. In 2006 the value of wine grapes in the Margaret River region (including the Shire of Augusta Margaret River and the Shire of Busselton) was $37.8 million or two thirds of the total production of the State.
The horticulture and associated viticulture industry also has an impact for other industries in its role in attracting visitors to the Region and as a customer for services.
The dairy industry has enjoyed a resurgence in recent years on the back of deregulation and aggressive pursuit of interstate and international markets.
2.3.5 Manufacturing
The ABS defines manufacturing to include activities that are mainly ‘a physical or chemical transformation of materials, substances or components into new products (except agriculture and construction)’.
The major manufacturing sector in the Region is the wine industry. The wine industry alone contributed $161 million to the GRP of the Capes Region economy in 2006 (of a total of $213 million). The value adding processing of meat, dairy and horticulture produce contributed a further $15 million to GRP in 2006.
Significantly, the manufacturing of furniture, mostly using timber from the South West, contributed another $8 million to GRP in 2006.
2.3.6 Tourism
The Capes Region is a major visitor destination. The major part of the value of the tourism sector is generated by the accommodation and food services, and retail sectors. These two sectors combined contributed $160 million to the GRP of the Capes Region in 2006.
The South West Region is the most visited region outside of the Perth Metropolitan Area by both domestic and international visitors. Tourism WA3
Table 4
estimated that there were around 3.6 million visitors to the South West per year on average in 2005, 2006 and 2007, or 20 per cent of all visitors to the State. shows that on average, about 1.8 million people a year visit the Capes Region, with overnight visitors generating nearly 3.6 million visitor nights.
Around 90 per cent of all visitors to the South West Region visited for holiday and leisure purposes or to visit friends and relatives (VFR). For the Capes
3 Tourism WA, Regional Development Commission Area Fact Sheet: South West 2007
Regional economic profile
Profile and trends 12
Region, holiday and leisure and VFR visitation make up well over 90 per cent of all visitation.
Table 4 Visitors and visitor nights, Capes Region average 2005, 2006, 2007
Shire of Augusta Margaret River
Shire of Busselton Total Capes Region
Visitors Nights Visitors Nights Visitors Nights
Overnight Visitors
Intrastate 335,000 980,000 535,000 1,792,000 870,000 2,772,000
Interstate 89,000 287,000 37,000 114,000 126,000 401,000
International 55,100 252,100 31,700 159,000 86,800 411,100
Total Overnight 479,100 1,519,100 603,700 2,065,400 1,082,800 3,584,500
Day Visitors
Domestic Day Trips 292,000 N/A 430,000 N/A 722,000 N/A
Data sources: Tourism WA, Local Government Area Fact Sheets, Shire of Busselton and Shire of Augusta Margaret River
As Table 5 shows, average visitor numbers and visitor nights in the Capes Region have risen somewhat since the 1999-2001 period, but are down from the peak of the 2002-2004 period.
Table 5 Overnight visitor numbers and nights, Capes Region, 1999 to 2007
Visitors Annual Average 1999-
2001 Annual Average 2002-
2004 Annual Average 2005-
2007
Intrastate 804,000 933,000 870,000
Interstate 68,000 141,000 126,000
International 77,800 86,500 86,800
Total 949,800 1,160,500 1,082,800
Nights
Total 3,448,000 4,105,200 3,584,500
Data sources: Tourism WA, Local Government Area Fact Sheets, Shire of Busselton and Shire of Augusta Margaret River
Major visitor activities in the Capes Region include going to beaches, eating out at restaurants, general sightseeing, visiting wineries, visiting friends and relatives and going shopping.4 Table 6 shows that visitors spend almost $590 million a year in the region.
4 Tourism WA, Local Government Area Fact Sheets, Shire of Busselton and Shire of Augusta
Margaret River
Regional economic profile
Profile and trends 13
Table 6 Visitor expenditure, Capes Region average 2005, 2006, 2007
Shire of Augusta Margaret River
Shire of Busselton
Total Capes Region
Total Spend ($millions)
Total Spend ($millions)
Total Spend ($millions)
Overnight Visitors
Domestic (intrastate and Interstate) 194 285 479
International 28 13 41
Total Overnight 222 298 520
Day Visitors
Domestic Day Trips 30 39 69
Data sources: Tourism WA, Local Government Area Fact Sheets, Shire of Busselton and Shire of Augusta Margaret River
The tourism sector in the Capes Region generates significant direct and indirect employment, which is reflected in jobs in a range of industries including accommodation, cafes and restaurants, and retail trade.
2.3.7 Retail trade
Bunbury and Busselton are considered the commercial centres of the South West Region as well as the major population centres and therefore the source of much of the retail activity in the Region. Bunbury lies outside the Capes Region.
There has been very strong growth in retail trade reflecting the growth in population in the Region. Retail turnover in the South West Region was estimated at $1.5 billion in 2006/07, which was an increase of 9.4 per cent from the previous year. In addition, the share of overall Western Australia’s retail turnover increased from 6.3 per cent in 2005/06 to 6.6 per cent in 2006/075
2.3.8 Construction sector and its supply chain
.
As Busselton is one of the larger population centres in the South West Region, it is expected that a significant portion of this retail activity occurs in the town, although more visitors identify shopping in the Shire of Augusta Margaret River as a major activity.
The construction sector is made up of residential construction, commercial property (industrial buildings, offices, hotels and other holiday accommodation and retail premises) and construction trade services. Combined, the construction sector contributed $136 million to the GRP of the Capes Region
5 South West Development Commission, Stats News July 2007
Regional economic profile
Profile and trends 14
in 2006. Two thirds of this ($88 million) was contributed by construction trade services. Residential construction and commercial construction contributed $14 million and $35 million respectively to GRP.
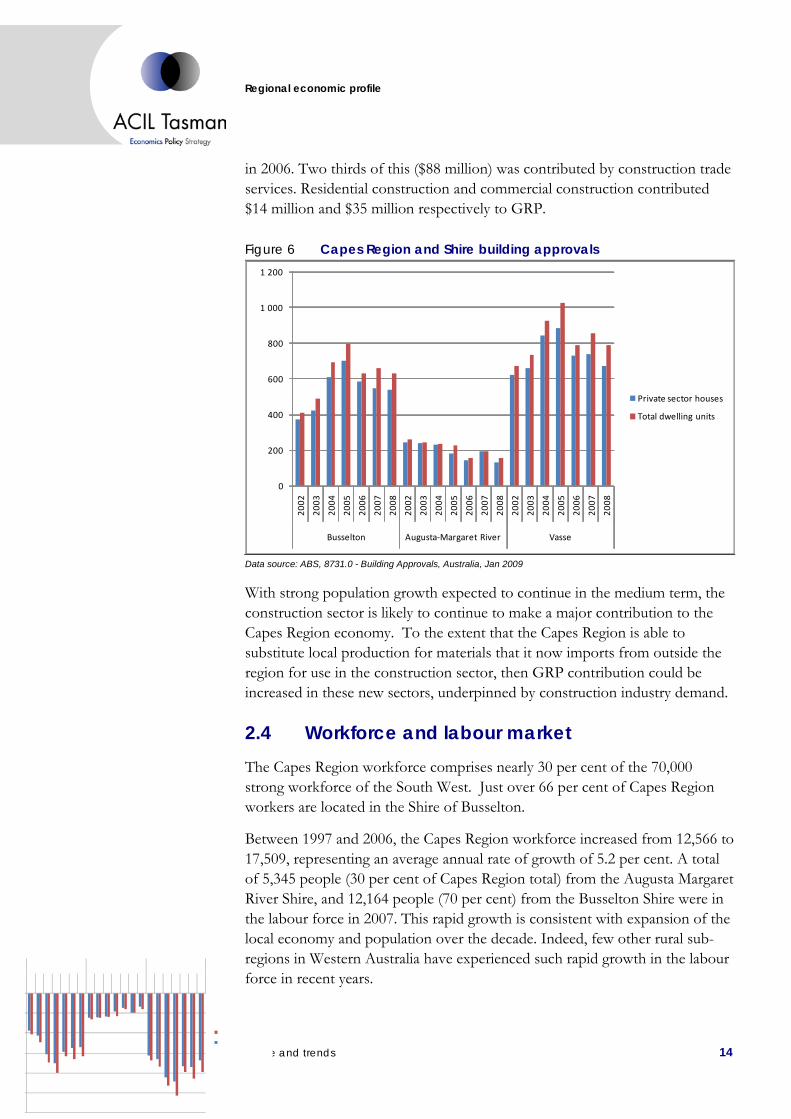
Figure 6 Capes Region and Shire building approvals
0
200
400
600
800
1 000
1 200
2002
2003
2004
2005
2006
2007
2008
2002
2003
2004
2005
2006
2007
2008
2002
2003
2004
2005
2006
2007
2008
Busselton Augusta-Margaret River Vasse
Private sector houses
Total dwelling units
Data source: ABS, 8731.0 - Building Approvals, Australia, Jan 2009
With strong population growth expected to continue in the medium term, the construction sector is likely to continue to make a major contribution to the Capes Region economy. To the extent that the Capes Region is able to substitute local production for materials that it now imports from outside the region for use in the construction sector, then GRP contribution could be increased in these new sectors, underpinned by construction industry demand.
2.4 Workforce and labour market The Capes Region workforce comprises nearly 30 per cent of the 70,000 strong workforce of the South West. Just over 66 per cent of Capes Region workers are located in the Shire of Busselton.
Between 1997 and 2006, the Capes Region workforce increased from 12,566 to 17,509, representing an average annual rate of growth of 5.2 per cent. A total of 5,345 people (30 per cent of Capes Region total) from the Augusta Margaret River Shire, and 12,164 people (70 per cent) from the Busselton Shire were in the labour force in 2007. This rapid growth is consistent with expansion of the local economy and population over the decade. Indeed, few other rural sub-regions in Western Australia have experienced such rapid growth in the labour force in recent years.

Regional economic profile
Profile and trends 15
Labour market data show that the general pattern within the South West and Vasse over the past decade was of strongly increasing employment (Figure 7).
Figure 7 Size of the labour force in Capes Region (Vasse) and the South West 1996-2006
0
10,000
20,000
30,000
40,000
50,000
60,000
70,000
80,000
90,000
100,000
1996 2001 2006
Vasse
South West
Data source: ABS Census of Population and Housing, Community profile.
2.4.1 Unemployment
The unemployment rate in the Capes Region has tended to lie below that of Western Australia but marginally above that of the South West Region as a whole, as shown in Figure 8.
The unemployment rate in the Shire of Augusta Margaret River in the March quarter of 2007 was 2.9 per cent. It is believed to be about the same at the end of 2007. In the Shire of Busselton it was 3.2 per cent, indicating an unemployment rate in the Capes Region of 3 per cent. By comparison, the unemployment rate in Western Australia was 3.3 per cent.
The strength of the Capes Region economy has been the critical driver of employment growth.

Regional economic profile
Profile and trends 16
Figure 8 Unemployment rates in Capes Region (Vasse), South West and Western Australia 1996-2006 (%)
0
1
2
3
4
5
6
7
8
9
10
1996 2001 2006
Vasse
South West
Western Australia
Data source: ABS Census of Population and Housing, Community profile.
2.4.2 Labour force participation
Labour force participation rates vary across the South West. In 2006 the Capes Region had the highest participation rate in the region, at 75 per cent, further emphasising both the strong economy and the tightness of supply within the local labour market. It may also reflect relatively high housing costs forcing unemployed people to move elsewhere.
Figure 9 Labour force participation rates in the Capes Region (Vasse), South West and Western Australia 1996-2006 (%)
56
57
58
59
60
61
62
63
64
1996 2001 2006
Vasse
South West
Western Australia
Data source: ABS Census of Population and Housing, Community profile.

Regional economic profile
Profile and trends 17
Figure 10 shows how labour force participation varied across different age cohorts in 2006. In the Capes Region participation rates in 2006 in the 15-54 age groups were the highest in the South West. Participation peaked at 84.9 per cent in the 45-49 age cohort, compared with 80.2 per cent in Western Australia as a whole.
Figure 10 Labour force participation rates by age in Capes Region (Vasse) and South West 1996-2006
0
10
20
30
40
50
60
70
80
90
15-1
9
20-2
4
25-2
9
30-3
4
35-3
9
40-4
4
45-4
9
50-5
4
55-5
9
60-6
4
65-6
9
70-7
4
75 +
Vasse
South West
Data source: ABS 2006 Census of Population and Housing, Community profile.
The labour force of the Capes Region is spread across a range of sectors. Figure 11 and Table 7 show the major industries in which the workforce of the Capes Region is employed.
Figure 11 Employment by industry (% of workforce): Capes Region (Vasse) and South West, 2006
Construction14%
Retail trade13%
Accommodation & food services
12%
Manufacturing10%
Agriculture, forestry & fishing
8%
Health care & social assistance
8%
Education & training
6%
Professional, scientific &
technical services4%
Other25%
Vasse
Construction13%
Retail trade13%
Accommodation & food services
7%Manufacturing13%
Agriculture, forestry & fishing
6%
Health care & social assistance
9%
Education & training7%
Public administration & safety
5%
Other27%
South West
Data source: Data source: Australian Bureau of Statistics 2006 Census

Regional economic profile
Profile and trends 18
Table 7 Employment by industry (% of workforce): Western Australia and Capes Region (2006)
Western Australia
Capes Region
Augusta Margaret
River
Busselton
Agriculture, Forestry & Fishing 3% 9% 13% 7%
Mining 4% 0% 0% 0%
Manufacturing 9% 9% 12% 8%
Electricity, Gas & Water Supply 1% 0% 0% 0%
Construction 9% 9% 8% 10%
Wholesale Trade 5% 3% 3% 2%
Retail Trade 15% 20% 17% 21%
Accommodation, Cafes & Restaurants 5% 13% 14% 12%
Transport & Storage 4% 3% 3% 3%
Communication Services 1% 1% 1% 1%
Finance & Insurance 3% 2% 1% 2%
Property & Business Services 11% 8% 7% 9%
Government Admin & Defence 6% 4% 4% 3%
Education 8% 7% 7% 7%
Health & Community Services 11% 10% 6% 11%
Cultural & Recreational Services 2% 1% 1% 1%
Personal & Other Services 4% 5% 8% 3%
Data source: Australian Bureau of Statistics 2006 Census
Retail trade is the largest sector of employment in the Capes Region, accounting for 20 per cent of all employment. The size of this sector is linked to the strong growth in the population and local economy. Other employers of note are: • accommodation and food services (13 per cent) • health and community services (10 per cent) • agriculture, forestry and fishing (9 per cent) • manufacturing (including wine and manufactured foods) (9 per cent) • construction (9 per cent) • property and business services (8 per cent) • education (7 per cent).
It is noteworthy that combined, health, community services and education sectors generate 17 per cent of employment in the region. While these sectors are dominated by government agencies and government funding, they nevertheless constitute major industries in the region – and major employers of professional people.
Accommodation and food services, and retail trade are linked in part to local demand, but are clearly major components of the region’s tourism sector.

Regional economic profile
Profile and trends 19
While agriculture, forestry and fishing is linked in part to traditional agricultural enterprises such as dairying, the emergence of viticulture, agroforestry and a range of food industries has been important. The relatively high levels of employment in manufacturing are linked to food processing (including employment in wineries) and a range of craft-based industries.
One of the major challenges facing regional Australia is the ageing of the workforce, with many employees within a decade or so of retirement. In the South West, there are a number of sectors where the ageing of the workforce is a significant issue, notably agriculture, forestry and fishing; transport; and a number of service sectors. Unlike many other regional areas, however, the Capes Region has been able to regenerate its workforce, and in most sectors does not face the imminent retirement of large numbers of people.
In the Capes Region relatively few industries had more than 20 per cent of the labour force over the age of 55 in 2006. The sector with the highest proportion of workers over 55 is agriculture, forestry and fishing, with more than 30 per cent in this age cohort. The only other sector with more than 20 per cent over 55 years was transport, postal and warehousing (24 per cent). All other sectors had relatively young workforces, with only the following approaching the 20 per cent over 55 threshold: • wholesale trade (18.6 per cent) • rental, hiring and real estate services (18.8 per cent) • professional, scientific and technical services (18.7 per cent) • health care and social assistance (18.7 per cent).
2.4.3 Occupations
The occupation shares in the workforce of the Capes Region are presented in Figure 12. It shows a profile for the Capes Region that is quite different to that of Western Australia and one that is heavily influenced by the profile in the Shire of Busselton. This is not surprising given the much larger size of the workforce in this Shire compared with Augusta Margaret River.
The most common occupations in the Capes Region are technicians and trades workers (18%), labourers (16%) and managers (16%) whilst in Western Australia the most common occupations are professionals (19%), technicians and trades workers (16%) and clerical and administrative workers (15%).
The occupations associated with the Capes Region reflect the skills requirements associated with an economy in which the services, manufacturing, tourism including retail trade, construction, and agriculture are the major industries.

Regional economic profile
Profile and trends 20
The most common occupation in the Capes Region is technicians and trades workers, reflecting the high levels of employment in sectors such as construction, manufacturing and mining.
In more general terms, the proportion of people in professional occupations was relatively low compared to the State average, though this is not unusual in regional areas. The proportion of labourers was high, again reflecting the particular industry mix of the Region. The significance of the Capes Region as a tourism destination resulted in a relatively high proportion of people working in sales.
Figure 12 Labour force by occupation in the Capes Region (Vasse), the South West and Western Australia (%)
Technicians and trades workers(b)
18%
Managers16%
Labourers16%
Professionals14%
Clerical and administrative
workers11%
Sales workers11%
Community and personal
service workers8%
Machinery operators and
drivers6%
Vasse
Technicians and trades
workers(b)20%
Managers13%
Labourers15%Professionals
13%
Clerical and administrative
workers12%
Sales workers10%
Community and personal service
workers8%
Machinery operators and
drivers9%
South West
Technicians and trades workers(b)
17%
Managers13%
Labourers11%
Professionals19%
Clerical and administrative
workers15%
Sales workers9%
Community and personal service
workers9%
Machinery operators and
drivers7%
Western Australia
Data source: Australian Bureau of Statistics 2006 Census

Regional economic profile
Profile and trends 21
2.4.4 Education and training
In 2006, the highest level of schooling in the South West was uniformly lower than the Western Australian average. The highest proportion of Year 12 qualifications in the South West was in the Capes Region where 39.3 per cent have completed Year 12 or equivalent. In the Capes Region, 28.8 per cent of have schooling to Year 10. The level of schooling is, in part, linked to the economic structure of the South West sub-regions, with sectors such as agriculture, construction, manufacturing and mining requiring qualifications that have in the past often seen students leave school at the end of year 10 to take up vocational education. Retail also tends to employ early school leavers.
Figure 14 shows the differences in educational attainment between the Vasse (Capes Region) and the rest of Western Australia. Using 2006 Census data from the Australian Bureau of Statistics, the figure shows the percentage of those who finished year 12.
The data firstly shows that both regions follow similar trends— younger people have higher educational attainment than the old.6
6 This trend is of course consistent with some evidence indicating that there has been a shift
in demand towards more skilled workers in Australia in the last twenty years, perhaps because of skilled-biased technical change and/or trade related factors (de Laine, Laplagne and Stone, 2000).
Nevertheless, it is also evident that the level of educational attainment in the Capes Region is significantly below that of the rest of WA, on average. This difference is evident against a backdrop of convergence in education across the two areas as people get older. Overall, this convergence suggests a widening gap in educational attainment between the Capes Region and the rest of WA, which will undoubtedly shape the face of employment in the region in years to come.

Regional economic profile
Profile and trends 22
Figure 13 Percentage of people that finished year 12, Capes Region and WA 2006
0%
10%
20%
30%
40%
50%
60%
70%
15-19 20-24 25-34 35-44 45-54 55-64 65-74 75-84 85 +
Capes Region WA
Data source: Data source: Australian Bureau of Statistics 2006 Census
The increase in the number of people earning a secondary education degree in the Capes Region may result from increases to minimum leaving age and integration of VET courses into secondary curricula.
In the Capes Region, 17.7 per cent of people have a certificate level III and IV VET qualifications, which is higher than the Western Australian average (15.4 per cent). Qualifications of this nature are often associated with trades and para-professional activities, and in the South West are linked to sectors such as manufacturing, construction, mining, health care and social assistance, and transport.
Across the entire South West Region, the proportion of the population with university bachelor level degrees or higher is lower than the Western Australian average (15.1 per cent). The proportion was highest in the Capes Region (11.9 per cent) where the relatively high proportion reflects in-migration of retirees, and lifestyle and business migrations, with bachelor degrees or higher qualifications in education, health and social assistance typical of a regional area.

Regional economic profile
Profile and trends 23
2.5 Population profile and trends
2.5.1 Population change
Figure 14 shows the rate of population change within the Capes Region and the South West as a whole.
Between 1996 and 2006 the Capes Region (Vasse) grew from 25,537 to 35,745 (40 per cent). During the same period, the population of the South West grew from 160,220 to 202,693 (26 per cent)
Figure 14 Population change in Capes Region (Vasse) and the South West, 1996-2006
0
50,000
100,000
150,000
200,000
250,000
1996 2001 2006
Vasse
South West
Data source: Data source: Australian Bureau of Statistics 2006 Census
2.5.2 Age profile
The age structure of the South West reflects the Region’s relatively complex population and economic geography (Figure 15).
The 0-14 year and 35-49 age cohorts are over-represented in all of subdivisions, a situation that is usual where young families are an important part of the age profile.
The 15-34 year age range is under-represented in all subdivisions, which is not uncommon in regional areas, where young people often leave to pursue education and other lifestyle opportunities in larger urban centres.

Regional economic profile
Profile and trends 24
Figure 15 Age structure of the Capes Region (Vasse) and South West 2006
0.0
1.0
2.0
3.0
4.0
5.0
6.0
7.0
8.0
9.0
0-4
10-1
4
20-2
4
30-3
4
40-4
4
50-5
4
60-6
4
70-7
4
80-8
4
Vasse
South West
Western Australia
Data source: Data source: Australian Bureau of Statistics 2006 Census
The under-representation is particularly evident in the 20-24 age cohort, with the Capes Region (and adjacent regions) all having 4.6 per cent or less of the population in the group, compared to the Western Australian average of 6.9 per cent.
The South West region as a whole tends to be marginally above the Western Australian profile in population beyond the age of 50, although this over-representation tended to become more pronounced beyond the age of 65. The ageing population in the Capes Region is more than likely due to two processes: • the Australia-wide phenomenon of ageing in-situ • the strong in-migration of retirees and lifestyle migrants relocating to high
amenity coastal and inland environments.
The level of in-migration to the South West is reflected in Table 5, which shows population mobility in each of the subdivisions.
2.5.3 Population mobility
In the Statistical Local Area (SLA) of Vasse (Capes Region), the level of population mobility is relatively high, with only 43.6 per cent living at the same address in 2006 as in 2001.
There is, however, considerable population movement within the two SLAs in the subdivision, with 21.5 per cent living at a different address in 2006 compared with 2001, but in the same local area (compared to 13.2 per cent for WA).

Regional economic profile
Profile and trends 25
This reflects considerable ‘churning’ within the local housing market, as both renters and owner-residents relocate within the Region. The relatively high level of internal movement is likely to be the outcome of two main factors: first, the desire on the part of some locals to upgrade their residence/location; and, second, tightening housing market leading to an increasing movement amongst renters as they adjust housing circumstances to better match incomes and rising rental prices.
Table 8 Population mobility in the South West 2001-06
Blackwood Bunbury Preston Vasse W. Aust
Same address as 2001 54.4 43.4 52.4 43.6 47.7
Same SLA as 2001, but different address 16.2 15.5 14 21.5 13.2
Different address in WA in 2001 19.7 27.1 23.2 21.8 21.7
Different address interstate in 2001 1.9 3.1 2.1 3.1 3.5
Overseas in 2001 1.7 3.3 1.5 2.7 5.5
Not stated 6.0 7.6 6.9 7.2 8.5
Data source: ABS 2001 and 2006
2.5.4 Incomes
The capacity to pay competitive wages and salaries is an important issue for both public and private sector businesses and organisations.
Competitive wages within a regional economy help to reduce the outflow of labour to other regions, and can help prevent high levels of turnover for individual enterprises. Figure 16 shows the changing median individual income in the Capes Region, South West and Western Australia.
In 1996, median incomes in the Capes Region were 88.6 per cent of the State median. By 2006, Capes Region median incomes increased to 94.2 per cent of the State average and 9 per cent higher than in the South West as a whole. The in-migration of higher income earners, together with a relatively innovative and prosperous local economy, helped improve the Capes Region’s median individual incomes.

Regional economic profile
Profile and trends 26
Figure 16 Median individual weekly income in the Capes Region (Vasse), South West and Western Australia, 1996-2006 ($/weekly)
0
100
200
300
400
500
600
1996 2001 2006
Vasse
South West
Western Australia
Data source: Data source: Australian Bureau of Statistics 2006 Census
The differentials in household incomes are shown in Figure 17. Between 1996 and 2006 the Vasse region has closed the household income gap relative to the South West. Household income for the Vasse region in 1996 was 91 percent of the South West and the current difference is nil. This is a generalised process of income growth since the household income gap has also been narrowed with respect to the State: in 1996 household income for the Vasse region was 80 percent of WA’s average and currently it is 90 percent.
Figure 17 Median household income Capes Region (Vasse), South West and Western Australia, 1996-2006 ($/weekly)
0
200
400
600
800
1,000
1,200
1996 2001 2006
Vasse
South West
Western Australia
Data source: Data source: Australian Bureau of Statistics 2006 Census

Regional economic profile
Profile and trends 27
2.5.5 Resident population of Capes Region settlements
The major population centres in the Shire of Busselton are the towns of Busselton and Dunsborough whilst Margaret River and Augusta are the primary population centres in the Shire of Augusta Margaret River. Other settlements identified by ABS are shown in Table 9.
Table 9 Estimated resident populations of selected Capes Region settlements, 2006
ERP Growth rate
2006 Current Potential
WAPC Planning Region South West 141,200 High High
Regional Centre Greater Bunbury 53,500 High High
Sub region Vasse (Capes Region) 38,073 High High
Sub-regional centre Busselton 15,400 High High
Major town Dunsborough 3,400 High Medium
Major town Margaret River 4,400 Medium Medium
Town Augusta 1,100 Medium Medium
Village Cowaramup 600 Medium Medium
Village Gracetown 300 Low Low
Village Karridale 300 Low Low
Village Walpole 300 Low Low
Village Witchcliffe 300 Low Medium
Village Yallingup 1,100 Low Low
Estimated resident population base
The WAPC assists in the process, and has published its most recent projections in its Population Report No. 6, Western Australia Tomorrow, released in 2005.
Subsequently, in 2008 the ABS finalised it s resident population estimates for 2006, which superseded the data for 2006 published by the WAPC.
The final 2006 estimates of resident populations in the local government areas in the South West are shown in Table 10. The Estimated Resident Population (ERP) is the ABS official measure of population, and is based on the concept of usual residence. It refers to all people who usually live in a location or region. In the Census year, the ERP is first calculated at the Census date (8 August for the 2006 Census), and is then backdated to calculate the ERP at 30 June of the Census year. After each Census, estimates for the preceding intercensal period are revised to ensure that the total intercensal increase agrees with the difference between the estimated resident populations at the two 30 June dates in the respective Census years.
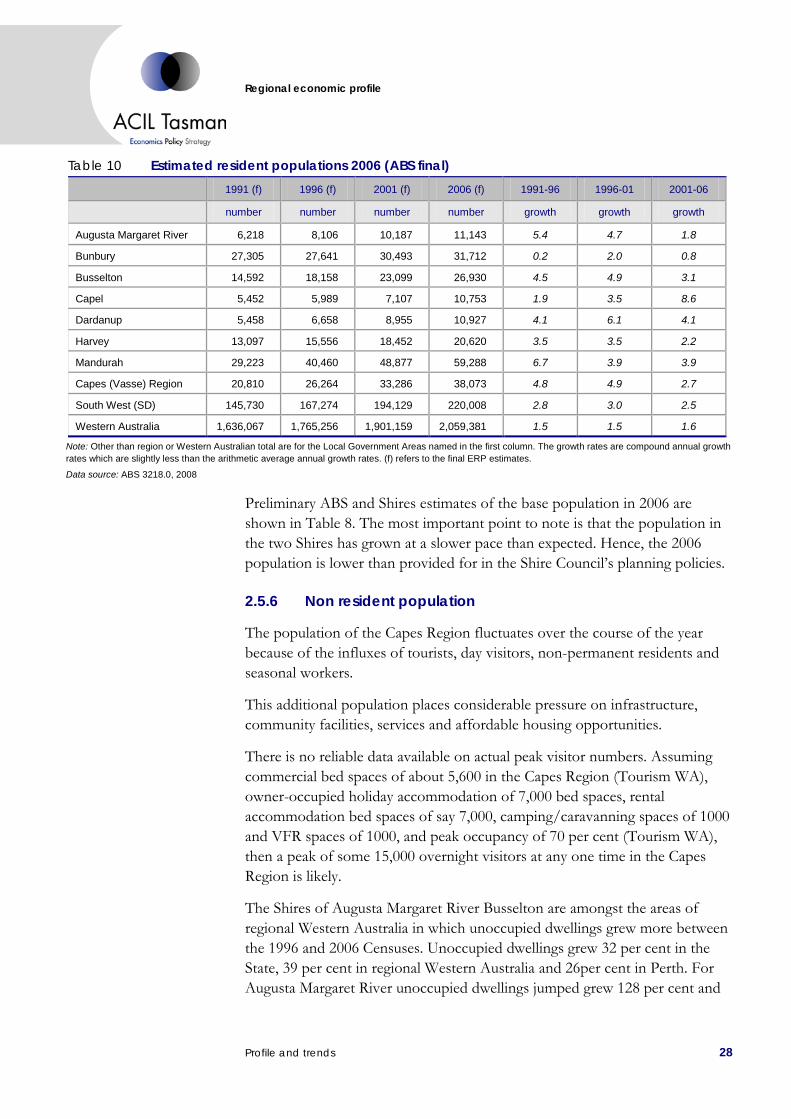
Regional economic profile
Profile and trends 28
Table 10 Estimated resident populations 2006 (ABS final)
1991 (f) 1996 (f) 2001 (f) 2006 (f) 1991-96 1996-01 2001-06
number number number number growth growth growth
Augusta Margaret River 6,218 8,106 10,187 11,143 5.4 4.7 1.8
Bunbury 27,305 27,641 30,493 31,712 0.2 2.0 0.8
Busselton 14,592 18,158 23,099 26,930 4.5 4.9 3.1
Capel 5,452 5,989 7,107 10,753 1.9 3.5 8.6
Dardanup 5,458 6,658 8,955 10,927 4.1 6.1 4.1
Harvey 13,097 15,556 18,452 20,620 3.5 3.5 2.2
Mandurah 29,223 40,460 48,877 59,288 6.7 3.9 3.9
Capes (Vasse) Region 20,810 26,264 33,286 38,073 4.8 4.9 2.7
South West (SD) 145,730 167,274 194,129 220,008 2.8 3.0 2.5
Western Australia 1,636,067 1,765,256 1,901,159 2,059,381 1.5 1.5 1.6
Note: Other than region or Western Australian total are for the Local Government Areas named in the first column. The growth rates are compound annual growth rates which are slightly less than the arithmetic average annual growth rates. (f) refers to the final ERP estimates.
Data source: ABS 3218.0, 2008
Preliminary ABS and Shires estimates of the base population in 2006 are shown in Table 8. The most important point to note is that the population in the two Shires has grown at a slower pace than expected. Hence, the 2006 population is lower than provided for in the Shire Council’s planning policies.
2.5.6 Non resident population
The population of the Capes Region fluctuates over the course of the year because of the influxes of tourists, day visitors, non-permanent residents and seasonal workers.
This additional population places considerable pressure on infrastructure, community facilities, services and affordable housing opportunities.
There is no reliable data available on actual peak visitor numbers. Assuming commercial bed spaces of about 5,600 in the Capes Region (Tourism WA), owner-occupied holiday accommodation of 7,000 bed spaces, rental accommodation bed spaces of say 7,000, camping/caravanning spaces of 1000 and VFR spaces of 1000, and peak occupancy of 70 per cent (Tourism WA), then a peak of some 15,000 overnight visitors at any one time in the Capes Region is likely.
The Shires of Augusta Margaret River Busselton are amongst the areas of regional Western Australia in which unoccupied dwellings grew more between the 1996 and 2006 Censuses. Unoccupied dwellings grew 32 per cent in the State, 39 per cent in regional Western Australia and 26per cent in Perth. For Augusta Margaret River unoccupied dwellings jumped grew 128 per cent and

Regional economic profile
Profile and trends 29
for Busselton 61 per cent. For the Capes Region as a whole, the number of unoccupied dwellings grew by 79 per cent.7
According to the 2005 CSIRO survey, most non-permanent residents used their home for residential purposes (35 per cent) while only 17 per cent used their properties for holiday accommodation. Only 4 per cent held their properties as an investment. Over half of the survey respondents suggested that they planned to retire to the Capes Region in the future.
Apart from tourists, both Shires are now home to both sea changers and tree changers, who choose to live in the region at least part of the year for lifestyle reasons while living and working elsewhere during the remainder of the year. A 2005 survey undertaken by CSIRO for Augusta Margaret River Shire identified that 40 per cent of properties within the Shire were owned by people who normally lived outside the region. Almost all lived permanently within Western Australia (90 per cent), while almost all non-permanent residents were older than the resident population, and earned higher incomes.
In the 2006 census the ABS reported that there were 12,571 households living in occupied private dwellings in the Capes Region. Of these 74 per cent were families (higher than the Australian average of 67 per cent), 22 per cent were lone person households and the remainder were group households.
In addition there were 5,000 unoccupied private dwellings, while there were 1,000 more occupied private dwellings than households, suggesting these households occupied more than one dwelling. On this basis ACIL Tasman estimates that one third of homes in the Region are owned by households with more than one home in the Capes Region, or owned by non-permanent residents.
7 Taken from Western Australia Statistical Indicators, December quarter 2007. ABS 2007.

Regional economic profile
Statistical analysis of the Capes Region economy 30
3 Statistical analysis of the Capes Region economy
There is little detailed economic information about the Capes Region, apart from employment data, that is publicly available at a sub-regional level. ABS Census employment data is one of only a few economic or survey datasets that are disaggregated sufficiently. Hence the analysis so far in this regional profile is based largely on ABS employment data.
ACIL Tasman has therefore used a number of analytic techniques to better understand the economy of the Capes Region and to analyse its competitive strengths and weaknesses.
ACIL Tasman has developed information on output and value added in the Capes Region, through the construction of detailed input-output tables based on ABS data. The input-output tables for the Capes Region economic development strategy comprise individual tables for: • Augusta Margaret River Shire • Busselton Shire • the Capes Region • South West Region • Western Australia.
These can be compared with the public information available at a national level.
In addition, ACIL Tasman has used two other analytical techniques to assess the economy of the Capes Region. These are: • Location quotients, which are used to determine concentrations of
employment and business enterprises that are higher or lower than the national and state employment and business structures.
• Shift-share analysis of employment changes, which assesses the total change in employment for each industry sector, and the different components (national share, industry composition, or regional shift) and is used to identify industries that are growing or shrinking both in absolute terms and relative to the nation and the state.
• Indices of regional specialisation • Diversity indices comparing the structure of one regional economy with
another.
The results of the analysis using these techniques are discussed in the following sections.

Regional economic profile
Statistical analysis of the Capes Region economy 31
3.1 Input-output analysis Input-output analysis is an accounting method which shows how the parts of a system are affected by a change in one part of that system.
Input-output analysis specifically shows how industries are linked together through supplying inputs for the output of an economy. This analysis relies on the development of input-output tables and multipliers (for jobs, earnings, and output) for each sector, subsector, and industry of the economy.
Input-output tables are used not only to calculate the impacts of a shock to the economy, but also used to show the strength of interactions (purchases and sales) between related sectors of the economy. Because of this, input-output analysis is used to evaluate the strength of the interrelationships among industries.
3.1.1 The Capes Region input-output table
The full Capes Region input-output table contains 38 separate industries, and in the excel spreadsheet version contains over 2,000 individual entries. Input-output tables can be difficult to interpret for those not familiar with them. To simplify interpretation, a more aggregated version (Table 11) of the Capes Region is presented in this report, while the full spreadsheet is available in Excel format.
In Table 11 the Capes Region input-output table has been aggregated to 19 industries.
Table 11 is a “transactions” table. It maps the flow of goods and services (represented in dollar amounts) between industries, primary inputs and final demand categories.
Total production and sales (Gross Regional Product at factor cost) in the Capes Region is $1.2 billion, of which local production and trade within the Region contributes close to $660 million annually.
Individual input-output tables for Augusta Margaret River and Busselton, the South West and Western Australia were prepared for this study.
3.1.2 Interpreting the Capes Region input-output table
Each row of the transactions table shows the sales of a Capes Region industry to local industries and to final demand. For example, row 1 of Table 11 represents the sales of the agriculture industry.

Regional economic profile
Statistical analysis of the Capes Region economy 32
Remembering that the figures in Table 11 are in millions of dollars, the first entry in the row (column 1) shows sales of $10 million worth of products from the Capes Region agriculture industry to itself.
Table 11 shows that the agriculture industry is an aggregation of a variety of sectors. It would not be unusual for sales to be recorded for the grains industry to beef cattle. Over and above this common occurrence, it is possible for intra-industry transactions to be recorded even in narrowly defined industries. This can occur, for example, from sales of breeding stock between like enterprises.
Moving further along, row 1, column 4 shows that the Capes Region agriculture sector recorded sales of $20 million to the wine sector within the Region. The total of all sales to local industries for agriculture comes to $43 million.
Capes Region agriculture also had significant sales of $25 million to local final demand (column 21) and $152 million to exports; which in the context of the Capes Region table, covers all sales outside of the Region. Column 23 contains total final demand, which is the sum of local final demand and exports, and is valued at $177 million. Finally, column 24 is total supply and is the value of all sales from the Capes Region agriculture industry, which comes to $220 million.
The columns of the input-output table give the inputs to each industry’s production process. Again, using agriculture (column 1) as an example, row 1 shows that the agriculture industry consumes $10 million worth of products from agriculture, this of course follows from the discussion above.
Row 2 shows that agriculture does not consume any of the output from the Capes Region mining industry, but consumes $1 million from construction, $4 million from wholesale and retail trade, $1 million from Accommodation, cafes and restaurants, $2 million from transport, and $1 million from property and business services. The total consumption from all industries, shown as total intermediate usage in row 20, comes to $21 million. The next group of inputs are the primary inputs. The first in this group, compensation of employees (row 21), accounts for $28 million of the industry’s costs. Gross operation surplus and mixed income account for $90 million, taxes less subsidies $4 million and imports $77 million. Row 25 – Capes Region production – represents the value of all inputs into the agriculture production process and comes to $220 million. The row and column totals match, indicating sales equal production.

33
Regional economic profile
Statistica
l ana
lysis of the Cap
es Region economy
Table 11 Aggregated input-output table, Capes Region USAGE 1 2 3 4 5 6 7 8 9 10 11 12 13 14 15 16 17 18 19 20 21 22 23 24
Agric
ultur
e, for
estry
and f
ishing
Minin
g
Food
man
ufactu
ring
Wine
, spir
its an
d tob
acco
prod
ucts
Texti
les cl
othing
and f
ootw
ear
Non-
metal
lic m
anufa
cturin
g
Metal
prod
ucts
Equip
ment
Othe
r man
ufactu
ring
Elec
tricity
gas a
nd w
ater
Resid
entia
l buil
ding
Cons
tructi
on
Who
lesale
and r
etail t
rade
Tour
ism
Tran
spor
t
Comm
unica
tion s
ervic
es
Finan
ce
Prop
erty
and b
usine
ss se
rvice
s
Serv
ices
Total
inter
media
te us
age
Loca
l fina
l dem
and
Expo
rts
Total
final
dema
nd
Total
supp
ly
SUPPLY
1 Agriculture, Forestry and Fishing 10 0 9 20 0 1 0 0 0 0 0 0 1 2 0 0 0 0 1 43 25 152 177 220
2 Mining 0 0 0 0 0 0 0 0 0 0 0 0 0 0 0 0 0 0 0 0 0 13 13 14
3 Food manufacturing 0 0 7 0 0 0 0 0 0 0 0 0 2 3 0 0 0 0 0 14 10 58 68 82
4 Wine, spirits and tobacco products (a) 0 0 0 34 0 0 0 0 0 0 0 0 0 9 0 0 0 0 0 44 7 397 403 447
5 Textiles, clothing and footwear 0 0 0 0 0 0 0 0 0 0 0 0 0 0 0 0 0 0 0 1 1 1 2 3
6 Non metallic manufacturing 0 0 0 0 0 3 0 0 1 0 2 5 2 0 0 0 0 2 2 18 2 9 11 29
7 Metal products 0 0 0 0 0 0 4 1 1 0 2 5 1 0 0 0 0 1 0 16 1 5 6 22
8 Equipment 0 0 0 0 0 0 0 0 0 0 0 0 1 0 0 0 0 0 0 3 3 8 11 14
9 Other manufacturing 0 0 0 0 0 0 0 0 0 0 1 1 0 0 0 0 0 1 1 4 12 20 32 37
10 Electricity, gas and water 1 0 1 0 0 0 0 0 0 1 0 0 1 1 0 0 0 1 1 9 9 6 15 24
11 Residential building construction 0 0 0 0 0 0 0 0 0 0 0 1 0 0 0 0 0 0 0 2 53 24 77 79
12 Construction 1 0 0 1 0 0 0 0 0 1 21 82 2 2 1 1 0 5 2 119 83 146 229 348
13 Wholesale and retail trade 4 0 3 5 0 1 1 1 2 0 2 7 16 6 8 2 0 10 6 75 182 51 233 308
14 Accommodation, cafes and restaurants 1 0 1 13 0 0 0 0 0 0 0 0 1 0 1 0 0 3 1 21 50 93 143 164
15 Transport 2 0 4 4 0 1 1 0 1 0 1 4 6 2 6 0 0 4 2 37 18 32 50 87
16 Communication services 0 0 0 0 0 0 0 0 0 0 0 0 4 1 2 1 1 4 3 16 9 1 9 26
17 Finance 0 0 0 0 0 0 0 0 0 0 1 2 1 0 0 0 16 3 1 25 6 63 69 94
18 Property and business services 1 0 2 6 0 2 1 1 1 0 4 15 31 7 11 2 5 91 14 196 188 109 298 493
19 Services 0 0 0 1 0 0 0 0 0 0 0 1 2 1 2 0 0 4 10 23 219 36 256 279
20 Total intermediate usage 21 2 29 85 1 8 8 3 7 3 36 123 71 34 30 7 23 128 45 666 877 1226 1719 2384
21 Compensation of employees 28 2 12 47 1 6 5 3 7 3 10 53 87 42 18 4 19 68 150 564 0 0 0 564
22 Gross operating surplus & mixed income 90 5 7 114 0 5 2 1 2 7 4 70 42 21 16 8 40 198 27 658 0 0 0 658
23 Taxes less subsidies on products 4 0 1 10 0 0 0 0 0 1 1 3 9 8 3 0 3 16 6 67 104 2 106 173
24 Imports 77 6 32 190 1 10 8 6 19 10 29 100 99 59 21 5 9 83 51 814 532 0 532 1346
25 Capes Region production 220 14 82 447 3 29 22 14 37 24 79 348 308 164 87 26 94 493 279 2769 1513 1228 2741 5510
Data source: ACIL Tasman

Regional economic profile
Statistical analysis of the Capes Region economy 34
3.2 Location quotient analysis
3.2.1 Location quotients – employment
Location quotients are a means of determining concentrations of employment that are higher or lower than might be expected given the national or state employment structure. Quotients of more than 1.0 indicate local specialisation (or concentration), and suggest that an industry is a basic (or ‘propulsive’) sector within the local or regional economy. A quotient of less than 1.0 suggests that an industry is not a significant driver of the economy.
It should be noted that these quotients are calculated from employment data based on employees’ place of residence. As such, the quotients shown here reflect concentrations of employees, rather than businesses or other establishments. Location quotients calculated on the basis of business enterprise locations are also included below.
From location quotient analysis using data from the 2006 Census, the industry sectors where the Capes Region has competitive strengths are identified in Figure 18 and Table 12 in the appendix8
8 Note that standard industry classifications are used and the industry name may be broader
that the segment present in the Capes Region (eg the “wine, spirits and tobacco products” industry is of course made up almost solely of the wine sector).
.

Regional economic profile
Statistical analysis of the Capes Region economy 35
Figure 18 Location quotient analysis – Capes Region employment 25.63
19.94
5.96
4.54
3.46
2.75
2.54
1.73
1.66
1.62
1.46
1.42
1.39
1.35
1.34
1.24
1.24
1.04
0 5 10 15 20 25 30
Wine, spirits & tobacco products
Dairy cattle
Other agriculture
Fruit & vegetable products
Non-bank finance
Accommodation, cafes & restaurants
Beef cattle
Beer & malt
Furniture
Services to agriculture; hunting & trapping
Other property services
Residential building construction
Dairy products
Retail trade & retail repairs
Other machinery & equipment
Personal services
Commercial fishing
Construction trade services
Location quotient Note: calculations performed by ACIL Tasman Data source: 2006 Australian Bureau of Statistics Census
From Figure 18 it is clear that in general the Capes Region is comparatively stronger in the agricultural industries with 10 of the 18 industries associated with the agriculture, food, forestry, and fishing sector. The wine, spirits and tobacco products and dairy cattle industries in particular are significantly over represented in the Capes Region.
The residential building sector is also over represented with associated industries such as non bank finance, other property services, residential building construction and construction trade services all returning a location quotient greater than 1.
3.2.2 Location quotients – business enterprises
The business sector of the Capes Region reflects the region’s increasingly diverse economy. While the Capes Region was dominated by farming enterprises more than 30 years ago (see Houghton, 2003), by 2006 its 4,881 business were spread across a range of sectors.
Agriculture, forestry and fishing still occupied an important position in the local economy, comprising 19.5 per cent of all business.
Of increasing importance was the construction sector (22.6 per cent), which reflects the rapid population and economic growth of the area.

Regional economic profile
Statistical analysis of the Capes Region economy 36
Also significant in an area where tourism is a fundamental part of the local economy was the accommodation, cafes and restaurants sector, comprising 5.3 per cent of businesses, compared to the national average of 2.8 per cent.
Manufacturing was also higher than the national average, with 5.7 per cent of all businesses in this sector. A major contributor to this is the growing number of craft-based enterprises and food processing firms in the Region.
In terms of the relative size of firms, the South West’s economy is based on small and medium enterprises
In the Capes Region, sole traders are dominant, with 2,995 of the subdivision’s 4,881 businesses (or 61.4 per cent) falling into this category.
The majority of these businesses were in construction, property and business services, and agriculture, forestry and fishing sectors. A further 21.7 per cent of enterprises employed between one and four staff, with concentrations in construction, agriculture, forestry and fishing, retail trade, and property and business services.
The Region also has a number of large employers, particularly in agriculture, forestry and fishing (with vineyards playing an important role), manufacturing (including wineries, food processing etc.), and accommodation, cafes and restaurants.
Location quotients were calculated for private enterprises in the Capes Region and the results are broadly consistent with the location quotients calculated on the basis of sectoral employment above.
In the Capes Region the highest location quotients are in the electricity, gas and water sector (2.3), closely followed by accommodation, cafes and restaurants (1.9). Other sectors with location quotients higher than 1.0 include: agriculture, forestry and fishing (1.8), and construction (1.4).
3.3 Shift share analysis Shift-share analysis is used to explain changes in a regional economy by breaking-down changes into three main sources: national share, industry share, and regional share.
The national share estimates the effects of total national growth or decline on industries in a region. In this study, employment is used as the variable of interest. For example, if employment in the region grew by 5 per cent over the period of time 2001-2006, the national share factor would show the effect of national employment growth over the 5 per cent local employment growth. In

Regional economic profile
Statistical analysis of the Capes Region economy 37
other words, this would show the effect of national employment growth on the local employment growth.
The industry share estimates how much of a regional change in employment can be attributed to national growth or decline in the industry in question. This share shows the effect of the national industry employment over the regional industry employment. Some industries will grow more quickly than others. Thus a region that specialises in ‘slow-growth’ sectors is likely to show a net loss of employment while conversely, a region favoured by a high proportion of ‘rapid-growth’ sectors will, most likely, show a positive net increase in employment.
Together the national share and the industry share show the changes that would have occurred in the regional economy if they corresponded exactly to national and industry trends.
When these two shares are subtracted from the actual shift in employment in the region, what is left is a net regional employment change not explained by general economic conditions (national share) or industrial trends (industry share.) This change – the regional share – reveals the effects of region specific factors on regional employment.
In shift-share analysis, the best target industries and clusters for economic development are typically those with the largest regional-share effect on growth. With multiple sectors or industries within a cluster they can be expected to differ in their regional share effects. These differences can reveal where to focus efforts to build and strengthen an industry or cluster.
Shift-share analysis of employment changes in the Capes Region for the period 2001 to 2006 shows the total change in employment for each industry sector, and the different components (national share or industry share).
The increase in the workforce in the Capes Region between 2001 and 2006 for the selected industries was 415. Changes at the national level contributed 551 of these jobs, while industry composition subtracted 391 jobs from the Region. However, local competitive advantage contributed an additional 255 jobs.
The 10 most significant increases in employment were in: • retail trade and retail repairs • accommodation, cafes and restaurants • education • community services • residential building construction • non-bank finance

Regional economic profile
Statistical analysis of the Capes Region economy 38
• government administration • wine, spirits and tobacco products • health services, and • other property services.
For the first two industries, the national and regional shift have the highest effect. In education, community services and non-bank finance the national effect is nil compared with the industry and regional shift. Residential and government administration have a strong component from the regional effect; while health services and wine and spirits have a strong national effect... The appendix provides detailed information and a shift-share table.
3.4 Summary of analysis In summary, the analysis shows that the Capes Region has a very dynamic economy. Services, manufacturing, tourism and construction are among the four most important economic activities. Services are labour intensive activities that provide a livelihood for the increasing population of the region.
The strength of the region is reflected in the long term employment and unemployment trends. Although the labour force has increased in the region as well as in the State, unemployment has steadily decreased. The existing pattern of labour force participation by age will continue in the next few years, the current working population will continue offering its services to the region given its dynamic growth as well as accommodating incoming population and re-balancing income of those affected by the ongoing economic downturn.
The economic strength of the Capes Region is clearly seen in the pattern of growth of individual and household incomes.

Regional economic profile
Technical appendix A-1
A Technical appendix
A.1 Location quotients The location quotient is the most commonly used economic base analysis method. The location quotient compares a local economy to a reference economy to identify regional specialisation.
Location quotients were initially developed as a method of determining whether a regional industry should be classified as importing, exporting or local. The logic being that an industry with a location quotient of 1 is able to meet the needs of the local economy, while a location quotient of greater than 1 indicates that the industry is capable of supplying product to customers outside of the region. A location quotient of less than 1 indicates that imports may be required to meet the needs of the local economy. See Box 1 for the location quotient formula.
Box 1 Location quotient formula
Location quotients ( iLQ ) are calculated using the following formula:
NNNN
LQi
rri
i = .
Where:
• riN represents employment in regional industry i;
• rN represents total employment in the region;
• iN represents employment in the state’s industry i; and
• N represents total state employment.
References
Forecasting Methods: Location Quotient Technique, Department of Urban and Regional Planning, Florida State University
Forecasting Methods: Economic Base Theory, Department of Urban and Regional Planning, Florida State University
Unlocking Rural Competitiveness: The Role of Regional Clusters, Center for Regional Development, Purdue University, 2007
Source: ACIL Tasman
For the purposes of this report, a location quotient greater than 1 indicates that the share of employment in the Capes Region is greater than the share of employment in Western Australia. Employment in that industry is therefore over represented in the Capes Region indicating there could be an industry

Regional economic profile
Technical appendix A-2
cluster which has led to greater employment in that industry than might be found elsewhere in Western Australia.
This analysis is not comprehensive as it may exclude emerging, small or niche industries.
Location quotients are useful for giving a picture of a region or local economy's strengths and weaknesses. However, they do not explain the sources of change over time or describe how the performance of a local economy differs from that of the nation.

A-3
Regional economic profile
Technical ap
pendix
Table 12 Location quotients: South West, Capes Region, Augusta Margaret River and Busselton (2006) South West Capes Region Shire of Augusta Margaret River Shire of Busselton
Dairy cattle 12.69 Wine, spirits & tobacco products 25.63 Wine, spirits & tobacco products 44.14 Wine, spirits & tobacco products 17.55 Coal 11.56 Dairy cattle 19.94 Dairy cattle 31.36 Dairy cattle 14.96 Sawmill products 10.77 Other agriculture 5.96 Other agriculture 8.22 Fruit & vegetable products 6.52 Wine, spirits & tobacco products 8.34 Fruit & vegetable products 4.54 Beef cattle 4.15 Other agriculture 4.98 Forestry & logging 4.64 Non-bank finance 3.46 Dairy products 3.59 Non-bank finance 3.61
Other agriculture 4.36 Accommodation, cafes & restaurants 2.75 Non-bank finance 3.11
Accommodation, cafes & restaurants 2.62
Meat & meat products 3.50 Beef cattle 2.54 Accommodation, cafes & restaurants 3.05 Furniture 2.13
Soft drinks, cordials & syrups 3.40 Beer & malt 1.73 Clothing 2.16 Other machinery & equipment 1.92
Beef cattle 2.82 Furniture 1.66 Services to agriculture; hunting & trapping 2.11 Beef cattle 1.84
Basic non-ferrous metal & prods 2.79 Services to agriculture; hunting & trapping 1.62 Commercial fishing 1.57 Beer & malt 1.80
Basic chemicals 2.77 Other property services 1.46 Beer & malt 1.55 Other property services 1.56 Dairy products 2.77 Residential building construction 1.42 Glass & glass products 1.38 Residential building construction 1.49 Other wood products 2.13 Dairy products 1.39 Residential building construction 1.27 Retail trade & retail repairs 1.42
Electricity supply 1.95 Retail trade & retail repairs 1.35 Other property services 1.22 Services to agriculture; hunting & trapping 1.40
Accommodation, cafes & restaurants 1.52 Other machinery & equipment 1.34 Retail trade & retail repairs 1.20 Personal services 1.27 Retail trade & retail repairs 1.21 Personal services 1.24 Personal services 1.18 Other manufacturing 1.25 Water supply; sewerage & drainage services 1.15 Commercial fishing 1.24 Services to transport; storage 1.11 Construction trade services 1.12 Road transport 1.13 Construction trade services 1.04 Community services 1.11 Rail, pipeline & other transport 1.11 Commercial fishing 1.09 Other property services 1.06 Sawmill products 1.03 Education 1.04 Meat & meat products 1.02 Residential building construction 1.01 Government administration 1.01 Community services 1.00
Note: Calculations performed by ACIL Tasman Data source: 2006 Australian Bureau of Statistics Census preliminary data

Regional economic profile
Technical appendix A-4
Table 13 Employment by industry and location quotients, Capes Region
Employment
Location quotients
2006 2001 % change 2006 2001
0101 Sheep 32 42 -24.46 0.37 0.39
0102 Grains 0 0 -100.00 0.00 0.00
0103 Beef cattle 240 328 -26.73 2.55 2.36
0104 Dairy cattle 224 250 -10.46 20.02 15.84
0105 Pigs 0 4 -100.00 0.00 0.74
0106 Poultry 0 0 -100.00 0.00 0.00
0107 Other agriculture 523 659 -20.64 5.99 6.14
0200 Ag Services 53 46 16.09 1.62 1.25
0300 Forestry and logging 8 34 -76.29 0.63 1.53
0400 Commercial fishing 26 30 -12.69 1.24 0.89
1101 Coal 0 0 -100.00 0.00 0.00
1201 Oil and gas 0 0 -100.00 0.00 0.00
1301 Iron ores 0 11 -100.00 0.00 0.15
1302 Non-ferrous metal ores 19 19 -0.59 0.07 0.10
1400 Other mining 0 7 -100.00 0.00 0.23
1500 Services to mining 0 7 -100.00 0.00 0.09
2101 Meat and meat products 42 6 553.41 0.94 0.16
2102 Dairy products 14 47 -70.38 1.39 2.63
2103 Fruit and vegetable products 30 0
4.55 0.00
2104 Oils and fats 0 0 -100.00 0.00 0.00
2105 Flour mill products and cereal foods 0 3 -100.00 0.00 0.55
2106 Bakery products 3 31 -90.35 0.10 1.03
2107 Confectionery 0 9 -100.00 0.00 2.70
2108 Other food products 3 4 -29.52 0.14 0.23
2109 Soft drinks, cordials and syrups 0 0 -100.00 0.00 0.00
2110 Beer and malt 11 10 13.33 1.73 1.53
2113 Wine, spirits and tobacco products (a) 688 605 13.65 25.72 23.42
2201 Textile fibres, yarns and woven fabrics 0 0 -100.00 0.00 0.00
2202 Textile products 3 16 -81.45 0.16 0.64
2203 Knitting mill products 0 0 -100.00 0.00 0.00
2204 Clothing 11 18 -39.48 0.66 0.84
2205 Footwear 0 0 -100.00 0.00 0.00
2206 Leather and leather products 0 0 -100.00 0.00 0.00
2301 Sawmill products 11 62 -82.37 0.72 3.13
2302 Other wood products 28 38 -25.40 0.74 0.92
2303 Pulp, paper and paperboard 0 0 -100.00 0.00 0.00
2304 Paper containers and products 0 0 -100.00 0.00 0.00
2401 Printing and services to printing 12 28 -57.07 0.25 0.47
2402 Publishing; recorded media and publishing 20 34 -41.76 0.37 0.59
2501 Petroleum and coal products 0 3 -100.00 0.00 0.20
2502 Basic chemicals 0 0 -100.00 0.00 0.00

Regional economic profile
Technical appendix A-5
Employment
Location quotients
2006 2001 % change 2006 2001
2503 Paints 0 0 -100.00 0.00 0.00
2504 Medicinal and pharmaceutical products, pesticides 0 0 -100.00 0.00 0.00
2505 Soap and other detergents 0 0 -100.00 0.00 0.00
2506 Cosmetics and toiletry preparations 0 3 -100.00 0.00 1.96
2507 Other chemical products 0 0 -100.00 0.00 0.00
2508 Rubber products 0 0 -100.00 0.00 0.00
2509 Plastic products 0 3 -100.00 0.00 0.11
2601 Glass and glass products 3 18 -83.53 0.42 1.59
2602 Ceramic products 8 8 6.58 0.41 0.42
2603 Cement, lime and concrete slurry 8 8 6.58 0.54 0.64
2604 Plaster and other concrete products 0 10 -100.00 0.00 0.71
2605 Other non-metallic mineral products 0 11 -100.00 0.00 0.65
2701 Iron and steel 14 47 -70.28 0.22 0.75
2702 Basic non-ferrous metal and products 0 18 -100.00 0.00 0.21
2703 Structural metal products 16 27 -40.47 0.33 0.60
2704 Sheet metal products 0 10 -100.00 0.00 0.62
2705 Fabricated metal products 3 14 -78.54 0.07 0.28
2801 Motor vehicles and parts; other transport equipment 3 13 -76.82 0.09 0.36
2802 Ships and boats 0 10 -100.00 0.00 0.23
2803 Railway equipment 0 0 -100.00 0.00 0.00
2804 Aircraft 0 0 -100.00 0.00 0.00
2805 Photographic and scientific equipment 3 4 -30.45 0.21 0.26
2806 Electronic equipment 0 0 -100.00 0.00 0.00
2807 Household appliances 0 0 -100.00 0.00 0.00
2808 Other electrical equipment 0 8 -100.00 0.00 0.44
2809 Agricultural, mining and construction machinery, lifting and material handling equipment 0 14 -100.00 0.00 0.26
2810 Other machinery and equipment 31 11 188.60 1.34 0.29
2901 Prefabricated buildings 0 10 -100.00 0.00 1.04
2902 Furniture 104 191 -45.68 1.67 2.11
2903 Other manufacturing 17 62 -72.63 0.88 2.53
3601 Electricity supply 21 25 -16.83 0.37 0.50
3602 Gas supply 0 0 -100.00 0.00 0.00
3701 Water supply; sewerage and drainage services 22 39 -44.14 0.50 0.94
4101 Residential building construction 331 195 69.76 1.43 1.34
4102 Other construction 94 93 0.90 0.54 0.69
4201 Construction trade services 715 682 4.78 1.04 1.10
4501 Wholesale trade and wholesale repairs 312 369 -15.36 0.56 0.59
5101 Retail trade and retail repairs 2439 2178 11.96 1.36 1.19
5701 Accommodation, cafes and restaurants 1552 1366 13.58 2.76 2.42
6101 Road transport 249 244 2.22 0.86 0.92
6201 Rail, pipeline and other transport 0 0 -100.00 0.00 0.00
6301 Water transport 0 3 -100.00 0.00 0.17

Regional economic profile
Technical appendix A-6
Employment
Location quotients
2006 2001 % change 2006 2001
6401 Air and space transport 0 5 -100.00 0.00 0.10
6601 Services to transport; storage 122 101 20.38 0.85 0.90
7101 Communication services 74 109 -32.16 0.49 0.60
7301 Banking 3 125 -97.60 0.02 0.93
7302 Non-bank finance 128 14 825.51 3.47 0.37
7401 Insurance 14 31 -55.03 0.18 0.32
7501 Services to finance, investment and insurance 64 39 64.76 0.55 0.42
7701 Ownership of dwellings 7 0
0.35 0.00
7702 Other property services 321 251 28.09 1.46 1.35
7801 Scientific research, technical and computer services 168 162 3.58 0.41 0.42
7802 Legal, accounting, marketing and business management services 259 256 1.21 0.69 0.65
7803 Other business services 242 238 1.59 0.65 0.64
8101 Government administration 438 334 30.98 0.71 0.69
8201 Defence 0 5 -100.00 0.00 0.08
8401 Education 887 727 21.98 0.88 0.81
8601 Health services 790 719 9.92 0.86 0.82
8701 Community services 390 232 68.35 0.92 0.75
9101 Motion picture, radio and television services 10 15 -33.99 0.28 0.36
9201 Libraries, museums and the arts 33 97 -65.96 0.62 1.31
9301 Sport, gambling and recreational services 111 94 18.18 0.76 0.62
9501 Personal services 292 283 3.26 1.25 1.12
9601 Other services 103 103 -0.01 0.38 0.43
Data source: ACIL Tasman analysis
A.2 Shift share analysis Shift-share analysis is used to explain changes in a regional economy by breaking-down changes into three main sources: national share, industry share, and regional share.
The national share estimates the effects of total national growth or decline on industries in a region, in this study, employment is used as the variable of interest. For example, if employment in the region grew by 5% over a period of time 2001-2006, the national share factor would show the effect of national employment growth over the 5 percent local employment growth. In other words, this would show the effect of national employment growth on the local employment growth.
The industry share estimates how much of a regional change in employment can be attributed to national growth or decline in the industry in question. This share shows the effect of the national industry employment over the regional industry employment. Some industries will grow more quickly than others.

Regional economic profile
Technical appendix A-7
Thus a region that specialises in ‘slow-growth’ sectors is likely to show a net loss of employment while conversely, a region favoured by a high proportion of ‘rapid-growth’ sectors will, most likely, show a positive net increase in employment.
Together the national share and the industry share show the changes that would have occurred in the regional economy if they corresponded exactly to national and industry trends.
When these two shares are subtracted from the actual shift in employment in the region, what is left is a net regional employment change not explained by general economic conditions (national share) or industrial trends (industry share.) This change – the regional share – reveals the effects of region specific factors on regional employment.
In shift-share analysis, the best target industries and clusters for economic development are typically those with the largest regional-share effect on growth. With multiple sectors or industries within a cluster they can be expected to differ in their regional share effects. These differences can reveal where to focus efforts to build and strengthen an industry or cluster.

Regional economic profile
Technical appendix A-8
Box 2 Shift share formula
Shift-share analysis can be written as the formula:
Actual shift in employment in cluster X - shift due to national change (national share) - shift due to industry change (industry share) = shift due to regional trends and conditions (regional share).
For any region j, employment growth for a particular period under investigation is
decomposed in the following way:
NS, the national share. The employment growth that region e experienced as a result of overall national trends
IS, the industry share component. That part of change attributable to the industrial composition or mix of the region,
RS the regional shift component. That part of change attributable to regional advantage or competitiveness.
The full equations require the following assumptions:
ei = regional employment in industry i
Ei = national employment in industry i
e = regional total employment in all industries
E = national total employment in all industries
t-1 = the initial period (2001) and t the end period (2006)
Thus: Δei ≡ ei,t - ei,t-1 ≡ NSi + IMi + RSi (1) NSi ≡ ei,t-1 (E i/ Et-1) (2) ISi ≡ ei,t-1 (Ei,t / E i,t-1 - Et / Et-1) (3) RSi ≡ ei,t-1 (ei,t / ei,t-1 - Ei,t / E i,t-1) (4)
ei,t ≡ ei,t-1 + (NSi + IMi + RSi) (5) References
Forecasting Methods: Shift-Share Technique, Department of Urban and Regional Planning, Florida State University
Unlocking Rural Competitiveness: The Role of Regional Clusters, Center for Regional Development, Purdue University, 2007
Source: ACIL Tasman

Regional economic profile
Technical appendix A-9
Table 14 Shift Share analysis, Capes Region 2006 2001 National
shift Industry shift Regional
shift Total
employment change
Retail trade and retail repairs 2,439.00 2,178.44 100.19 -114.31 274.68 260.56
Accommodation, cafes and restaurants
1,552.00 1,366.46 62.85 -50.47 173.17 185.54
Education 887.00 727.16 33.44 63.69 62.71 159.84
Community services 390.00 231.66 10.65 80.30 67.38 158.34
Residential building construction 331.00 194.99 8.97 110.10 16.95 136.01
Non-bank finance 128.00 13.83 0.64 -0.80 114.33 114.17
Government administration 438.00 334.40 15.38 79.60 8.62 103.60
Wine, spirits and tobacco products (a)
688.00 605.37 27.84 0.86 53.93 82.63
Health services 790.00 718.69 33.05 11.49 26.76 71.31
Other property services 321.00 250.61 11.53 37.50 21.36 70.39
Meat and meat products 42.00 6.43 0.30 0.60 34.67 35.57
Construction trade services 715.00 682.41 31.39 48.61 -47.40 32.59
Services to finance, investment and insurance
64.00 38.84 1.79 9.45 13.92 25.16
Services to transport; storage 122.00 101.34 4.66 24.88 -8.89 20.66
Other machinery and equipment 31.00 10.74 0.49 -4.53 24.30 20.26
Sport, gambling and recreational services
111.00 93.92 4.32 -7.09 19.84 17.08
Personal services 292.00 282.78 13.01 -31.40 27.61 9.22
Services to agriculture; hunting and trapping
53.00 45.65 2.10 -6.43 11.68 7.35
Scientific research, technical and computer services
168.00 162.20 7.46 5.36 -7.02 5.80
Road transport 249.00 243.59 11.20 16.28 -22.07 5.41
Other business services 242.00 238.21 10.96 -8.12 0.96 3.79
Legal, accounting, marketing and business management services
259.00 255.90 11.77 -20.11 11.44 3.10
Beer and malt 11.00 9.71 0.45 -0.33 1.17 1.29
Other construction 94.00 93.16 4.28 23.09 -26.54 0.84
Ceramic products 8.00 7.51 0.35 0.38 -0.23 0.49
Cement, lime and concrete slurry 8.00 7.51 0.35 1.75 -1.60 0.49
Other services 103.00 103.01 4.74 10.86 -15.61 -0.01
Non-ferrous metal ores 19.00 19.11 0.88 7.74 -8.73 -0.11
Other food products 3.00 4.26 0.20 0.48 -1.94 -1.26
Photographic and scientific equipment
3.00 4.31 0.20 -0.65 -0.86 -1.31
Cosmetics and toiletry preparations
0.00 3.19 0.15 -1.07 -2.27 -3.19
Water transport 0.00 3.21 0.15 0.49 -3.85 -3.21
Flour mill products and cereal foods
0.00 3.24 0.15 -1.32 -2.06 -3.24
Plastic products 0.00 3.24 0.15 -1.09 -2.30 -3.24

Regional economic profile
Technical appendix A-10
2006 2001 National shift
Industry shift Regional shift
Total employment
change
Petroleum and coal products 0.00 3.24 0.15 0.87 -4.25 -3.24
Commercial fishing 26.00 29.78 1.37 -12.30 7.15 -3.78
Pigs 0.00 3.97 0.18 -2.38 -1.78 -3.97
Electricity supply 21.00 25.25 1.16 2.31 -7.72 -4.25
Defence 0.00 4.94 0.23 -0.80 -4.37 -4.94
Motion picture, radio and television services
10.00 15.15 0.70 -2.89 -2.95 -5.15
Air and space transport 0.00 5.34 0.25 -4.70 -0.89 -5.34
Clothing 11.00 18.18 0.84 -4.90 -3.11 -7.18
Other mining 0.00 7.26 0.33 2.46 -10.06 -7.26
Services to mining 0.00 7.26 0.33 -1.83 -5.77 -7.26
Other electrical equipment 0.00 7.55 0.35 1.05 -8.94 -7.55
Confectionery 0.00 8.57 0.39 0.41 -9.37 -8.57
Other wood products 28.00 37.53 1.73 -4.05 -7.21 -9.53
Plaster and other concrete products
0.00 9.62 0.44 -2.67 -7.40 -9.62
Prefabricated buildings 0.00 9.65 0.44 6.01 -16.10 -9.65
Sheet metal products 0.00 9.66 0.44 -10.11 0.00 -9.66
Ships and boats 0.00 9.66 0.44 0.76 -10.87 -9.66
Motor vehicles and parts; other transport equipment
3.00 12.94 0.60 -1.27 -9.26 -9.94
Other non-metallic mineral products
0.00 10.73 0.49 6.50 -17.72 -10.73
Iron ores 0.00 10.80 0.50 -1.60 -9.70 -10.80
Sheep 31.00 41.81 1.92 -10.88 -1.85 -10.81
Structural metal products 16.00 26.88 1.24 1.55 -13.66 -10.88
Fabricated metal products 3.00 13.98 0.64 -2.69 -8.93 -10.98
Textile products 3.00 16.18 0.74 -4.51 -9.41 -13.18
Agricultural, mining and construction machinery, lifting and material handling equipment
0.00 13.91 0.64 -0.97 -13.57 -13.91
Publishing; recorded media and publishing
20.00 34.34 1.58 -3.22 -12.70 -14.34
Glass and glass products 3.00 18.22 0.84 -7.58 -8.48 -15.22
Printing and services to printing 12.00 27.95 1.29 -6.53 -10.71 -15.95
Insurance 14.00 31.13 1.43 -7.65 -10.91 -17.13
Water supply; sewerage and drainage services
22.00 39.39 1.81 0.92 -20.12 -17.39
Basic non-ferrous metal and products
0.00 18.25 0.84 -6.62 -12.47 -18.25
Forestry and logging 8.00 33.75 1.55 -15.80 -11.50 -25.75
Dairy cattle 224.00 250.16 11.51 -82.22 44.56 -26.16
Bakery products 3.00 31.10 1.43 -1.23 -28.30 -28.10
Iron and steel 14.00 47.11 2.17 -0.65 -34.63 -33.11
Dairy products 14.00 47.27 2.17 -22.71 -12.73 -33.27
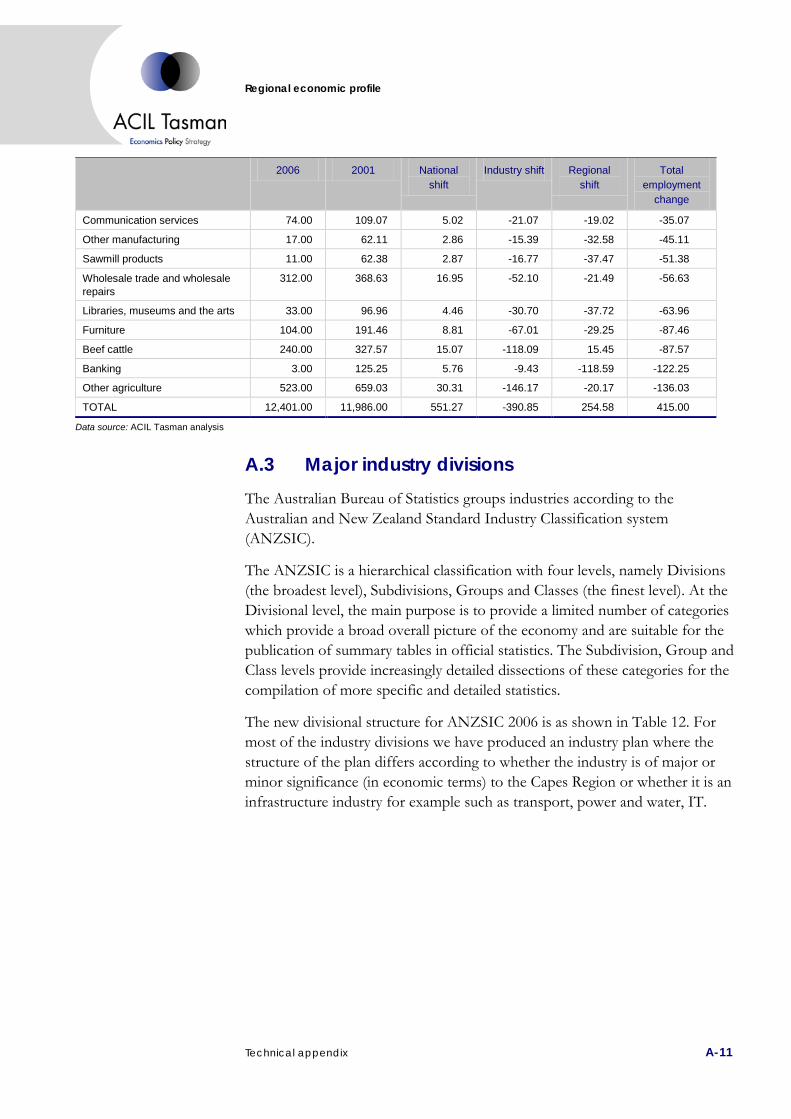
Regional economic profile
Technical appendix A-11
2006 2001 National shift
Industry shift Regional shift
Total employment
change
Communication services 74.00 109.07 5.02 -21.07 -19.02 -35.07
Other manufacturing 17.00 62.11 2.86 -15.39 -32.58 -45.11
Sawmill products 11.00 62.38 2.87 -16.77 -37.47 -51.38
Wholesale trade and wholesale repairs
312.00 368.63 16.95 -52.10 -21.49 -56.63
Libraries, museums and the arts 33.00 96.96 4.46 -30.70 -37.72 -63.96
Furniture 104.00 191.46 8.81 -67.01 -29.25 -87.46
Beef cattle 240.00 327.57 15.07 -118.09 15.45 -87.57
Banking 3.00 125.25 5.76 -9.43 -118.59 -122.25
Other agriculture 523.00 659.03 30.31 -146.17 -20.17 -136.03
TOTAL 12,401.00 11,986.00 551.27 -390.85 254.58 415.00
Data source: ACIL Tasman analysis
A.3 Major industry divisions The Australian Bureau of Statistics groups industries according to the Australian and New Zealand Standard Industry Classification system (ANZSIC).
The ANZSIC is a hierarchical classification with four levels, namely Divisions (the broadest level), Subdivisions, Groups and Classes (the finest level). At the Divisional level, the main purpose is to provide a limited number of categories which provide a broad overall picture of the economy and are suitable for the publication of summary tables in official statistics. The Subdivision, Group and Class levels provide increasingly detailed dissections of these categories for the compilation of more specific and detailed statistics.
The new divisional structure for ANZSIC 2006 is as shown in Table 12. For most of the industry divisions we have produced an industry plan where the structure of the plan differs according to whether the industry is of major or minor significance (in economic terms) to the Capes Region or whether it is an infrastructure industry for example such as transport, power and water, IT.

Regional economic profile
Technical appendix A-12
Table 15 ANZSIC Divisions 2006 Division title
A. Agriculture, Forestry and Fishing
B. Mining
C. Manufacturing
D. Electricity, Gas, Water and Waste Services
E. Construction
F. Wholesale Trade
G. Retail Trade
H. Accommodation and Food Services
I. Transport, Postal and Warehousing
J. Information Media and Telecommunications
K. Financial and insurance services
L. Rental, Hiring and Real Estate Services
M. Professional, Scientific and Technical Services
N. Administrative and Support Services
O. Public Administration and Safety
P. Education and training
Q. Health care and social assistance
R. Arts and recreation services
S. Other services
Source: Australian Bureau of Statistics