working paper changing tides in the sea of goodwill: a
TRANSCRIPT

Working Paper Changing Tides in the Sea of Goodwill: A Financial
Analysis of Veteran-Serving Nonprofits
October 2018
Douglas McCormick, Emma Moore, and Andrew Swick

Changing Tides in the Sea of Goodwill: A Financial Analysis of Veteran-Serving Nonprofits
1
1
AUTHORS Douglas McCormick is Managing Partner and Co-founder of HCI Equity Partners, a private equity investment firm. He is active in community service as the board chair of Bunker Labs. He is also a board member of Team Red, White, & Blue and the National Endowment for Financial Education. McCormick wrote Family Inc.: Using Business Principles to Maximize Your Family’s Wealth (Wiley, 2016), and he uses this content to empower the veteran community with financial literacy skills. His work has been cited or featured by media outlets such as The Wall Street Journal, The New York Times, USA Today, CNBC, PBS, NPR, and Time. Before founding HCI Equity Partners, McCormick worked at Thayer Capital Partners, Morgan Stanley & Co., and served as a Captain in the U.S. Army’s 25th Infantry Division. McCormick holds a Master of Business Administration from Harvard Business School and a Bachelor of Science in economics from the U.S. Military Academy at West Point, and he is a Henry Crown Fellow. Emma Moore is a Research Assistant with the Military, Veterans, and Society Program at the Center for a New American Security (CNAS). Prior to joining CNAS, she worked as an Executive Assistant for Narrative Strategies and as Program Manager for ProVetus, a veterans organization. She also interned with the U.S. Naval War College. She holds a Master of Arts in war studies from King’s College London. Andrew Swick was a Research Associate with the Military, Veterans, and Society Program at CNAS, where he focused on civil-military relations, defense reform, and issues facing military families and veterans. Swick graduated from the U.S. Military Academy in 2011 and subsequently served as an infantry
officer with the 101st Airborne Division. He is pursuing a master’s degree at the Georgetown School of Foreign Service. ACKNOWLEDGEMENTS The authors would like to thank the many individuals and organizations that have contributed to and inspired the development of this research, including Phillip Carter, Meredith Beck, Nancy Berglass, Chris Ford, and Margaret Harrell, among others. In addition, the authors extend their gratitude to the employees of GuideStar USA for providing essential assistance in accessing the wealth of data necessary for this report. Finally, the authors express their sincere appreciation for CNAS colleagues Loren DeJonge Schulman, Maura McCarthy, and Tristan Campos for their time and attention in supporting this report. ABOUT THE MILITARY, VETERANS, AND SOCIETY PROGRAM The Military, Veterans, and Society program addresses issues facing America’s service members, veterans, and military families, including the future of the All-Volunteer Force, trends within the veteran community, and civil-military relations. The program produces high-impact research that informs and inspires strategic action; convenes stakeholders and hosts top-quality events to shape the national conversation; and engages policymakers, industry leaders, Congress, scholars, the media, and the public about issues facing veterans and the military community.

Changing Tides in the Sea of Goodwill: A Financial Analysis of Veteran-Serving Nonprofits
0
0
1.0 INTRODUCTION AND EXECUTIVE SUMMARY As the United States enters its 18th year of war since 9/11, the shape of the country’s veteran community is rapidly transforming. The total number of American veterans is shrinking as the large, conscription-driven cohorts of World War II, Korea, Vietnam, and the Cold War fade away.1 At the same time, today’s smaller, volunteer-driven military is creating a new veteran cohort: one that has a different demographic profile and service experience than previous generations and that will increasingly dominate the veteran landscape. These demographic shifts have already caused changes within the veterans nonprofit community. A new crop of veterans nonprofits emerged in the years after 9/11, and they control a growing share of the nonprofit market. These newer organizations are offering discrete services and seeking distinctive forms of engagement with the post-9/11 veteran cohort.2 Collaborative infrastructure has emerged to knit together these veterans organizations, health care organizations, employers, and others supporting or serving veterans.3 Moreover, these post-9/11 organizations have new ways of doing business and are growing at rates substantially faster than the overall market. This report builds on the 2015 Center for a New American Security (CNAS) report “Charting the Sea of Goodwill,” which examined the landscape of veterans nonprofits through the lens of tax filings by those nonprofits.4 By applying a business analysis to individual and aggregated data regarding these tax filings, this paper identifies key attributes of the current veterans nonprofit market, showing long-term trends that exist for veteran-serving nonprofit organizations with respect to their size, wealth, and capabilities. Based on tax analysis, this report finds sharp divergence in the business characteristics of pre-9/11 and post-9/11 veterans nonprofits, including the following:
• While the overall veterans nonprofit market has only seen income growth of about 2.1 percent per year over the measured eight years, large post-9/11 organizations grew in excess of 15 percent per year – resulting in total growth over 200 percent.
• Large post-9/11 veterans organizations are achieving this growth at the expense of revenue
diversification, with 87 percent of all revenues derived from contributions alone. This compares with 46 percent of revenues derived from contributions for large pre-9/11 organizations.
• Large pre-9/11 organizations still represent 68 percent of the total income generated in the
veterans nonprofit market. Additionally, five of the six largest organizations by income fall into the pre-9/11 category. Total assets and net worth are even more skewed toward the pre-9/11 cohort, which controls 75 percent of the cumulative wealth of the community.
• While the pre-9/11 cohort controls most of the wealth, post-9/11 organizations save at a
rate almost 2.5 times greater than pre-9/11 organizations. Our analysis shows a strong correlation between organization size and the generation of capital surpluses, implying that subscale organizations are competitively disadvantaged.

Changing Tides in the Sea of Goodwill: A Financial Analysis of Veteran-Serving Nonprofits
1
1
• Measured by the ratio of program expenses to total spending listed on tax forms, post-9/11
veterans organizations also demonstrate greater efficiency than their pre-9/11 counterparts.
• We observe numerous differences in these cohorts, which we hypothesize influence differences in business models and the disparity of metrics outlined above. The differences include demographics, engagement models, fundraising capabilities, membership models, governance, and size.
The differences in the cohorts outlined above, combined with divergent population trends for pre-and post-9/11 veteran cohorts, may shift the competitive landscape. Post-9/11 organizations operate differently than legacy organizations and may benefit from market transformations. As the size and influence of veteran cohorts shifts, veteran-serving nonprofits will need to respond to changing needs, which may have social, political, and economic impact as well as the potential for increased competition and conflict in the market. Leaders throughout the veteran community – including organizational leaders, government leaders, philanthropic donors, and corporate sponsors – must consider how organizations meet and adapt to shifts in the marketplace and changing demographics to ensure continued high-quality support to veterans from pre- and post-9/11 organizations alike. This report, which does not assess programmatic impact, offers an initial financial analysis and a framework with which to identify business trends within the veteran-serving nonprofit space. 2.0 BACKGROUND Since 9/11, the evolution of the veteran population has presented new challenges and changing demands for veteran service providers. Currently, there are approximately 20 million veterans in the United States, and 2.4 million active and reserve service members.5 Since 9/11, more than 3 million current or former service members have deployed to Iraq, Afghanistan, or other theaters of conflict.6 In the next two decades, however, the veteran population is projected to contract by 30 percent, as the large conscription-fueled cohorts of World War II, Korea, Vietnam, and the Cold War age and pass.7 As these cohorts fade away, Persian Gulf War I-era and post-9/11 veterans will come to dominate the veteran landscape in numbers, organizational prominence, and political power.8 This younger cohort looks different from prior generations of American veterans: In demographic terms, it is more female, more ethnically and racially diverse, and more educated than previous generations, echoing broader trends toward greater diversity in society and in the military.9 In addition, current military personnel are more likely to be married than their civilian counterparts or previous military cohorts; thus, care and benefits for military spouses and families matter more than ever.10

Changing Tides in the Sea of Goodwill: A Financial Analysis of Veteran-Serving Nonprofits
2
2
Veteran Population
Source: U.S. Department of Veterans Affairs Historically, the largest and most consequential programs of the U.S. Department of Veterans Affairs (VA) have been focused on disability compensation for veterans, supporting veterans attending school with the G.I. Bill, and health care for disabled or indigent veterans. Going forward, the VA is broadening its portfolio to focus on economic opportunity and transition support for veterans of the All-Volunteer Force,11 as well as more support for marginalized populations, such as veterans with “bad paper” or those most at risk for homelessness or suicide. To do this, the VA has worked closely with the nonprofit sector.12 In recognition of the importance of engagement between the VA and nonfederal entities such as nonprofits supporting veterans, the VA has strengthened such partnerships.13 Many veteran-serving nonprofit organizations serve this community by cohort, and many of the organizations that emerged after 9/11 have specifically catered to the experiences and challenges of younger veterans. Post-9/11 veterans organizations have employed different business models. In general, they have smaller staffs, use more information technology (IT), own less real estate, and demonstrate different patterns of capital use and accumulation than their pre-9/11 predecessors. These organizations are able to operate with smaller staffs in part because they do not offer staff- or space-intensive services. These post-9/11 “new economy” organizations are generally experiencing faster income growth, faster wealth accumulation, and efficiencies of program delivery. These economic patterns for post-9/11 veterans organizations are likely to continue, further bolstered by benefits of scale, efficiency, and changing veteran demographics. Differences in veteran population and performance trends between pre- and post-9/11 organizations could see a shift in leadership depending on how pre-9/11 organizations transform themselves given demographic changes and whether or not post-9/11 organizations are able to scale their models.

Changing Tides in the Sea of Goodwill: A Financial Analysis of Veteran-Serving Nonprofits
3
3
Financial data over the past two decades – viewed through the lens of tax filings – suggests that a reshaping has occurred in the veteran organizational ecosystem. Within the veteran marketplace, there are causes and implications for market growth, market share, and disparity of prospects for the participants. Though the total veterans nonprofit community only grew by about 2.1 percent annually, large post-9/11 organizations – the “new economy” competitors – grew revenues by almost 16 percent annually, from $323 million to $1 billion in aggregate. As post-9/11 organizations have fared exceptionally well, they have done so in contrast to other market participants, with large legacy pre-9/11 organizations growing just 1 percent per year and small organizations (predominantly pre-9/11) experiencing revenue decreases of 2.5 percent per year.14 This dichotomy in growth rates has resulted in huge share gains for large post-9/11 organizations, which grew from 11 percent to 29 percent of the entire market revenue. Veteran-serving nonprofit organizations operate in their members’ interests and for the public good. However, there is value in understanding the business models and choices of veteran-serving nonprofits, insofar as these business models and choices have a great impact on the veterans these organizations serve. This paper endeavors to evaluate the veterans nonprofit space through the lens of financial data, assessing trends among veteran-serving nonprofits much as an investment analyst might evaluate industries and markets in the private sector. In applying this business framework to the veterans nonprofit ecosystem, we intend to accomplish the following:
1. Provide clarity regarding the current size and composition of the market. 2. Provide a framework to evaluate the competitive landscape, various business models being
employed in the space, and their relative strengths and weaknesses. 3. Provide nonprofit leaders (CEOs), funders (investors), and policymakers with business
model metrics to promote benchmarking related to indicators of organizational health, efficiency, and growth.
4. Provoke discussion among market constituents (policymakers, funders, and organization leaders) regarding implications of these trends in a dynamic market.
2.1 PREVIOUS RESEARCH
A great deal of research has been done on American philanthropy, as well as the economic activity of American nonprofit organizations. In 2016, American philanthropic giving totaled $390 billion, with the vast majority ($281.9 billion or 72 percent) coming from individual giving. Foundations and corporate giving made up $59.3 billion (15 percent) and $30.7 billion (8 percent) of the total, respectively.15 Historically, American charities and philanthropic giving have focused on education, the arts, religion, and medicine, evolving greatly in legal form, focus, and financial structure over the four centuries since the first European settlements of America.16 As philanthropy and nonprofit organizations have matured into sophisticated participants of the American economy, the field has professionalized. This area is now the subject of consulting practice and academic study, with a rich library of literature. However, very little of this literature has focused on the field of veteran-centric philanthropy. This may owe to the relatively small size of veterans philanthropy: The total market size for veterans

Changing Tides in the Sea of Goodwill: A Financial Analysis of Veteran-Serving Nonprofits
4
4
philanthropy is approximately $3.6 billion in annual revenue, a tiny fraction of what goes to universities, museums, hospitals, and houses of worship. Much of the research into veterans philanthropy divides into two collections. The first consists of case studies in giving or nonprofit activity, such as research documenting the work of the $247 million Iraq-Afghanistan Deployment Impact Fund over its life cycle, or collected case studies highlighting corporate and foundational philanthropy.17 The second collection contains normative frameworks for veteran philanthropy, such as groundbreaking work by Nancy Berglass and Margaret C. Harrell in defining veteran wellness and articulating nonprofit strategies to serve veterans.18 In 2015, CNAS published a new kind of study that looked at macroeconomic trends among veterans nonprofits through the lens of their tax data. This study, titled “Charting the Sea of Goodwill,” segmented the veterans organizational landscape by organizational type, tax code section, geographic location, and revenue level. The 2015 report found a clear division in business practices, tools of engagement, and demographics between pre- and post-9/11 organizations. Additionally, there was a growing divergence between needs and resources in the veterans and military nonprofit sector that was expected to grow over time, while the market experienced competition for increasingly scarce resources. This paper takes that analytical approach further, by taking a deeper dive into the organizational tax filings of veteran-serving nonprofit organizations, analyzing variables such as growth, efficiency, savings, and financial resources as well as labor and technology content across thousands of veteran-serving nonprofits. While commenting on the business practices of pre- and post-9/11 organizations, this report does not opine on the services or programs either group offers, the impact of these services, or any legislative agenda.
2.2 DATA AND METHODOLOGY This report examines data contained in organizational tax filings reported by nonprofits to the Internal Revenue Service (IRS) using one of several 990 forms based on revenue and organizational type.19 By law, the tax returns of nonprofit organizations are publicly available as a condition of their receiving tax-exempt status for their pursuit of a charitable purpose.20 This data is available in raw form from the IRS or in processed form from a number of data brokers or analysis centers. This paper obtained its organizational tax data from the GuideStar platform because of that platform’s ability to sort organizations by type, tax code section, geography, and National Taxonomy of Exempt Entities (NTEE) code, as well as GuideStar’s ability to produce organizational tax information in spreadsheet form that facilitated analysis. Following the methodology used by CNAS in “Charting the Sea of Goodwill,” this paper pulled tax data for organizations coding themselves with the NTEE code “W30.” Organizations with an NTEE code starting with “W” are organized for “public and societal benefit.” Within that major group are 20 subgroups, including “W30” for “military and veterans organizations.”21 The GuideStar database included more than 38,000 W30 organizations at the time of data collection in November 2017. To manage the scope of this paper, we limited our analysis to nonprofit organizations reporting at least $1 in revenue, resulting in a dataset of just under 7,000 organizations. We next excluded financial services institutions (such as mutual aid associations, providers of financial services and insurance for the military and veteran community) from the dataset because they distorted the revenue and asset information for the dataset as a whole. This resulted in a total dataset

Changing Tides in the Sea of Goodwill: A Financial Analysis of Veteran-Serving Nonprofits
5
5
of 6,951 nonprofit organizations – representing both the organizational diversity and revenue of the veterans nonprofit community. Additionally, to provide a clear examination of how these organizations compete in the market, we typically chose to group all chapters of large legacy veterans organizations in the aggregate, as single organizations. For historical reasons relating to governance and their unique tax code status as 501(c)(19) or 501(c)(23) organizations, the chapters or posts of what this paper will consider the “Big Four” – The American Legion, Veterans of Foreign Wars (VFW), Disabled American Veterans (DAV), and American Veterans (AMVETS) – are separately incorporated and governed nonprofit organizations that file separate tax returns. However, we believe that they perform in the veteran marketplace as integrated financial organizations, with interlocking governance structures, overlapping activities, and a single brand. For this report, chapters of these organizations were therefore assessed financially as a single entity under the name of their national organization. With this classification, our final data set consists of 1,428 veteran-serving nonprofits, including the aggregated “Big Four” veterans organizations and aggregated auxiliary organizations. Finally, in analyzing this financial data we used the most recent tax data available in the GuideStar system for each organization, spanning from 2013 to 2016 reported data. As of November 2017, about two-thirds of the examined organizations (including the individual chapter organizations) had only provided information through 2015. In addition, around 700 organizations provided IRS information for 2016, while the rest had not provided updated information since 2014 or earlier. While the decision to use the most recent forms for each organization rather than a common reference year prevents a direct “apples to apples” comparison, it makes more total relevant data available for analysis. As a result, the analysis in this report builds on the most updated financial data for each organization, without significantly skewing consistency across the dataset. The following analysis examines a number of financial metrics categorized by size and age to identify major trends and characteristics, specifically looking for differences between pre- and post-9/11 veterans organizations.22 Most of our analysis was based on the most current available data to compare ongoing trends, though we also used time series data to calculate growth from 2007, using 2015 constant dollars. 3.0 ANALYSIS As previewed above, this paper uses a business lens with which to assess the landscape of veteran-serving nonprofit organizations. This methodology identifies important economic trends affecting the marketplace as a whole and significant trends differentiating organizations within this large and varied veteran nonprofit marketplace. Some of the greatest disparities are observed by organizational age and size (measured by revenue), with distinct differences occurring across multiple metrics when assessed along these dimensions. Within this ecosystem, there is also significant concentration of revenue and resources among the largest organizations. The six largest organizations as defined by total income represent 59 percent of the total market revenue, with the remaining 1,422 organizations comprising 41 percent of market revenue (see: “Revenue Concentration”). Given this concentration and the fact that several large organizations can skew results and mask underlying trends within the community, we attempted to

Changing Tides in the Sea of Goodwill: A Financial Analysis of Veteran-Serving Nonprofits
6
6
isolate the results of these organizations where appropriate: In many sections, we examine the three largest organizations (The American Legion, VFW, and Wounded Warrior Project (WWP), which together make up nearly half of the revenue in this market, as shown below) separately. Also, while we often compared means and medians of veterans organizations in our analysis across the metrics described below, the reported numbers in this report all refer to the means of the organizations in each category.
Revenue Concentration
Source: GuideStar The sections below describe organizational financial data in terms of traditional business metrics such as revenue, growth, surplus, efficiency, and labor and technology content. These metrics are meant to describe the financial characteristics of these organizations, not their organizational performance or impact. Certain organizations are, because of their purpose or structure, more or less efficient, in business terms, than others. Therefore, comparing organizations on this basis alone is insufficient, nor does it convey normative conclusions regarding the value of any particular organization. Nonetheless, this financial data helps illuminate the contrasting business structures and models employed by the sector as a whole and also serves to highlight several important trends among veteran-serving nonprofit organizations.
3.1 SCALE AND GROWTH This paper assesses scale as measured by total reported revenue, listed on IRS Form 990 as “Total Income.”23 In these terms, pre-9/11 veteran-serving nonprofit organizations dominate the market. Pre-9/11 organizations represent approximately 68 percent of the total veterans nonprofit market by revenue and claim five of the six largest organizations defined by annual revenue. Among the 172 veterans organizations with annual revenue greater than $1 million, pre-9/11 organizations average

Changing Tides in the Sea of Goodwill: A Financial Analysis of Veteran-Serving Nonprofits
7
7
$26 million in annual income compared with an average of $10 million for post-9/11 organizations. There is a clear size and revenue advantage held by older veteran-serving nonprofit organizations.
Veterans Nonprofit Market Growth 2007-2015
(in millions of dollars and in annual percentage growth)
Source: GuideStar While pre-9/11 veteran-serving nonprofit organizations dominate in size, post-9/11 organizations are growing substantially faster. Total revenue in the overall market has grown about 2.1 percent per year in constant dollar terms over the eight-year measurement period.24 The overall philanthropy market has grown at a higher rate of 2.9 percent per year.25 Large pre-9/11 veteran-serving nonprofit organizations (including national headquarters, not aggregated here, for the VFW, The American Legion, DAV, and AMVETS) have grown more slowly than the market, at approximately 1 percent per year. Small organizations making less than $1 million in annual income (including chapters of the “Big Four,” which file tax returns independently of the parent organization and are analyzed here separately) have contracted at 2.5 percent per year and shrunk by almost $300 million cumulatively. It was not possible to compile historical financial data on all 7,000 organizations to break out individual growth rates for the chapters of large legacy organizations and remaining small groups; however, it can be reasoned that the performance of these pre-9/11 chapters is the predominant driver of this trend for the category, given they comprise 83 percent of the organizations in this category. At the same time, large post-9/11 veteran-serving nonprofit organizations with income of greater than $1 million annually are growing rapidly. These organizations posted compound annual growth rates in excess of 15 percent, resulting in total growth in excess of 200 percent or $700 million over the measurement period, with Wounded Warrior Project representing a significant share of that growth. Stated differently, the 104 post-9/11 organizations with annual revenue greater than $1 million represent more than 100 percent of the total growth of the market during this time

Changing Tides in the Sea of Goodwill: A Financial Analysis of Veteran-Serving Nonprofits
8
8
and have grown from just 11 percent of the revenue market in 2007 to 29 percent of the market in 2015.
3.2 SURPLUS Surplus (also expressed as savings) is an organization’s annual profit, defined as total revenue minus total expenses, and measures an organization’s ability to cover today’s expenses as well as future operations and long-term strategic investments.26 While a focus on the development of surpluses can overlook business models that require significant overhead costs to deliver impact, surplus generation can nonetheless be an indicator not only of an organization’s ability to both fundraise and deliver programs effectively, but also of its ability to overcome unexpected shortfalls, make investments for the future, and sustain itself.
Overall Surplus by Cohort
(in millions of dollars and percentage savings rate)
Source: GuideStar In the most recently reported data, large post-9/11 veteran-serving nonprofit organizations have an average savings rate – defined as surplus divided by revenue – of 12.4 percent, almost 2.5 times greater than large pre-9/11 organizations, whose savings rate is 5 percent. Illustrating the significance of post-9/11 organizations’ saving rates, the “Overall Surplus by Cohort” graph displays the difference in surplus between the two cohorts. When the three largest veterans organizations (The American Legion and VFW, which are legacy organizations, and WWP,27 a “new economy” organization) are not included, post-9/11 organizations are saving at a rate eight times higher than pre-9/11 organizations: 15.7 percent compared with 1.9 percent.
Changing Tides in the Sea of Goodwill: A Financial Analysis of Veteran-Serving Nonprofits
9
9
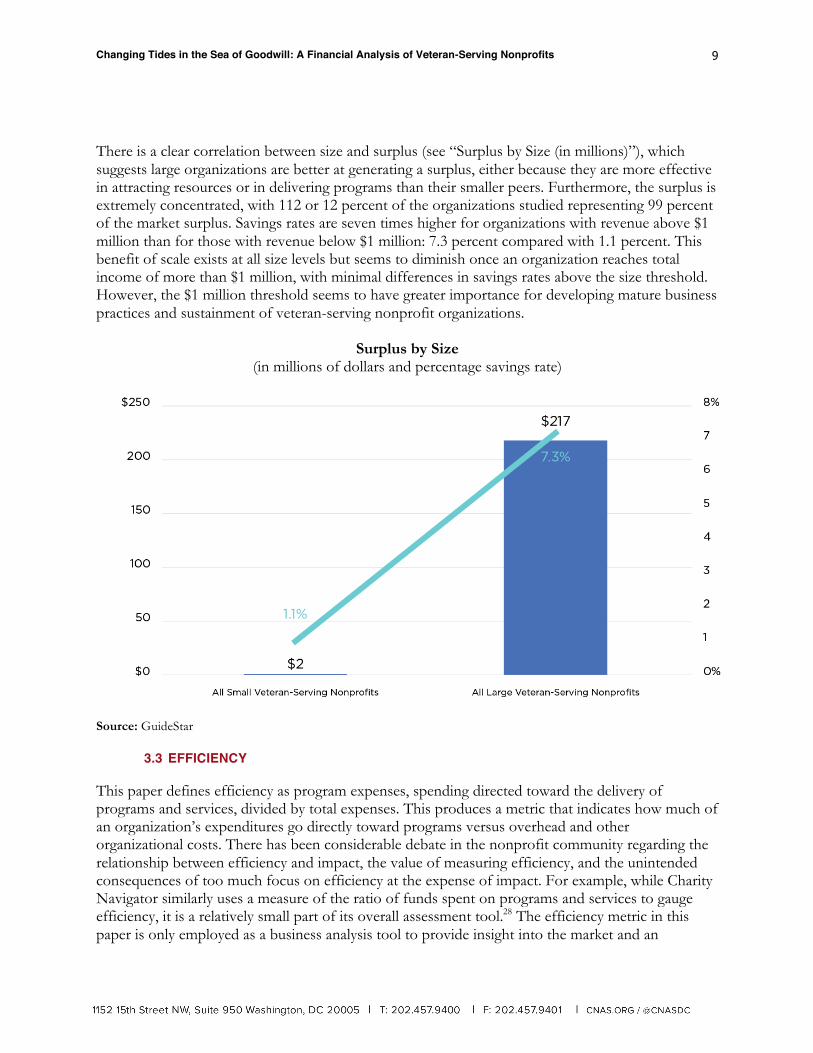
There is a clear correlation between size and surplus (see “Surplus by Size (in millions)”), which suggests large organizations are better at generating a surplus, either because they are more effective in attracting resources or in delivering programs than their smaller peers. Furthermore, the surplus is extremely concentrated, with 112 or 12 percent of the organizations studied representing 99 percent of the market surplus. Savings rates are seven times higher for organizations with revenue above $1 million than for those with revenue below $1 million: 7.3 percent compared with 1.1 percent. This benefit of scale exists at all size levels but seems to diminish once an organization reaches total income of more than $1 million, with minimal differences in savings rates above the size threshold. However, the $1 million threshold seems to have greater importance for developing mature business practices and sustainment of veteran-serving nonprofit organizations.
Surplus by Size (in millions of dollars and percentage savings rate)
Source: GuideStar
3.3 EFFICIENCY This paper defines efficiency as program expenses, spending directed toward the delivery of programs and services, divided by total expenses. This produces a metric that indicates how much of an organization’s expenditures go directly toward programs versus overhead and other organizational costs. There has been considerable debate in the nonprofit community regarding the relationship between efficiency and impact, the value of measuring efficiency, and the unintended consequences of too much focus on efficiency at the expense of impact. For example, while Charity Navigator similarly uses a measure of the ratio of funds spent on programs and services to gauge efficiency, it is a relatively small part of its overall assessment tool.28 The efficiency metric in this paper is only employed as a business analysis tool to provide insight into the market and an

Changing Tides in the Sea of Goodwill: A Financial Analysis of Veteran-Serving Nonprofits
10
10
individual organization’s business model rather than as a commentary about impact or services offered.
Efficiency by Cohort
Source: GuideStar Using this measure, post-9/11 veteran-serving nonprofit organizations demonstrate greater efficiency than their pre-9/11 counterparts, registering an efficiency rate of 77 percent versus 53 percent. Stated differently, post-9/11 organizations spend 24 cents more on their programs for every dollar spent than do pre-9/11 organizations. Differences in efficiency are illustrated further when broken out by cohort, (see “Efficiency by Cohort”) with the three largest organizations, The American Legion, VFW, and WWP, examined separately given their tendency to skew averages. When excluding these outliers, the overall trend remains intact: Post-9/11 organizations operate at 81 percent efficiency compared with pre-9/11 organizations at 64 percent. Notably, the two largest veterans organizations (The American Legion and VFW) have relatively low efficiency scores compared with the broader market. Causes of this reduced efficiency are subject to debate but could relate to organizational infrastructure required for scale, breadth of program offering, national mandate, and individual donor fundraising focus. Similar to the trend observed in the surplus metric, there is an “efficiency” penalty for smaller organizations (annual income of less than $1 million). Organizations earning more than $1 million operate at 70 percent efficiency, compared with 66 percent for sub-$1 million organizations.

Changing Tides in the Sea of Goodwill: A Financial Analysis of Veteran-Serving Nonprofits
11
11
3.4 ORGANIZATIONAL BUSINESS PRACTICE INDICATORS Across many categories, there are also clear indications of how pre- and post-9/11 organizations engage their members and society as a whole. In general, pre-9/11 organizations create communities by establishing a physical presence – often through real estate ownership, boasting millions in combined membership29 – and using paid employees to deliver services, while post-9/11 organizations encourage volunteer and member “self-service,” which encourages veterans to elect into services and assistance in the community by leveraging technology. Two specific examples of these different engagement models manifest themselves in metrics relating to labor content and investments in technology.
3.4.1 LABOR CONTENT The pre- and post-9/11 cohorts employ a strikingly dissimilar employment model. While pre-9/11 organizations generate 68 percent of the income, they employ 93 percent of the roughly 46,000 employees serving the community.30 When analyzed on the basis of how much income the organization generates, divided by the number of employees, the difference becomes even more pronounced. Large pre-9/11 organizations produce $46,481 in total income per employee; post-9/11 organizations generate $297,651 per employee – 6.4 times that of pre-9/11 organizations. The American Legion, VFW, and DAV together employ 77 percent of the entire community, with an average income per employee of $37,676. This likely reflects the large workforces employed by these organizations to represent veterans in VA benefits processes, as well as employees employed by each individually incorporated chapter or post across the country, of which there are thousands. In contrast, the WWP generates $439,028 per employee, making it comparatively 12 times more productive than The American Legion, VFW, and DAV as measured by dollars of income generated per employee. Examining the outliers separate from the cohorts, the divide between average income per employee is broken down in the graph “Income per Employee.” The observation regarding labor content by cohort remains intact, excluding these outliers, with large pre-9/11 organizations generating $88,465 in total income per employee compared with $254,562 for large post-9/11 organizations.

Changing Tides in the Sea of Goodwill: A Financial Analysis of Veteran-Serving Nonprofits
12
12
Income per Employee
Source: GuideStar
Similar to other metrics studied, smaller organizations perform worse in this area compared with the market. Organizations making less than $1 million in income generated $69,842 of income per employee compared with $120,699 for all other organizations, excluding the four outliers mentioned above. This suggests a real value to scale where fundraising is concerned, a lesson that is not unique to the veterans market. Other areas of philanthropy, such as religion and medical research, have long leveraged coordinated giving campaigns and allocation mechanisms to spread the costs of fundraising and reach the most givers.31
3.4.2 INVESTMENTS IN INFORMATION TECHNOLOGY The financial data produced by pre- and post-9/11 veterans organizations also illustrates different strategies regarding the use of technology. Post-9/11 veterans organizations spend substantially more on IT than their pre-9/11 counterparts, and the level of IT spending is highly correlated with size (i.e., large organizations spend more on IT in both absolute and relative terms), suggesting that IT capabilities are integral to scale for veteran-serving nonprofit organizations.
The amount of money spent on IT per employee is the most relevant metric to highlight these trends because it captures the relationship between labor and technology content between cohorts. Post-9/11 organizations spend $1,450 per employee on IT, more than 11 times more than pre-9/11 organizations, which spend just $127 per employee on IT. As in other metrics, large organizations such as The American Legion, VFW, and WWP skew these averages. WWP spends $2,612 per employee on IT, while The American Legion and VFW spend an average of $54 per employee.

Changing Tides in the Sea of Goodwill: A Financial Analysis of Veteran-Serving Nonprofits
13
13
Excluding these extreme outliers, the post-9/11 cohort still shows a greater propensity for using IT, with an investment rate of $1,096 per employee compared with $370 per employee for pre-9/11 organizations. Once again, there is a high correlation between level of investment and scale, with small organizations (those that make less than $1 million in revenue) spending just $331 per employee, while large organizations spend $629 per employee on IT.
3.5 FUNDING SOURCES AND FUNDRAISING EXPENSES Veteran-serving nonprofit organizations demonstrate different patterns of funding and fundraising depending on their organizational age and scale. These funding sources include contributions by individuals, government grants, investment income, sales, and program services revenue, among others. Pre-9/11 organizations enjoy substantially more diversified revenue sources and rely much less on contributions than post-9/11 organizations (see “Revenue Composition by Cohort”). The older cohort brings in 46 percent of its revenue from individual, corporate, and foundation contributions, as compared with 87 percent for post-9/11 organizations. The three largest veteran-serving nonprofit organizations continue to skew the averages based on their scale and metrics. The American Legion and VFW earn just 24 percent of their income from contributions, while WWP earns 94 percent of its revenue from giving. However, this trend exists outside of the three largest organizations, as other organizations such as The Mission Continues and IAVA generated 99 percent of income through institutional and individual contributions, compared with AMVETS, which generated just 44 percent of income through institutional and individual contributions.
Revenue Composition by Cohort
Source: GuideStar Different fundraising and promotional approaches go hand in hand with these different funding models. Promotional expenditures (defined as total fundraising and advertising expenses) differ

Changing Tides in the Sea of Goodwill: A Financial Analysis of Veteran-Serving Nonprofits
14
14
sharply across the market segments analyzed by this paper. Pre-9/11 organizations spend 25 percent of all contributions received on fundraising and marketing, while post-9/11 organizations spend just 15 percent. Excluding The American Legion, VFW, and WWP results in an even more extreme comparison, showing that pre-9/11 organizations spend 26 percent on promotional expenditures per dollar of contribution received compared with just 10 percent for the post-9/11 cohort. Facing inconsistent government funding, nonprofits have needed to pursue alternate revenue streams in order to raise money, which post-9/11 organizations appear to be doing via increased institutional grants from private and corporate funders.32 Furthermore, the largest organizations (with income greater than $10 million) spend 27 percent of all revenue on fundraising and marketing, compared with only 12 percent for all other organizations, suggesting that aggressive fundraising is necessary for organizations to achieve super-scale.
3.6 MEMBERSHIP MODELS AND GOVERNANCE STRUCTURES The financial and tax filing data collected for this paper, as well as data collected for the 2015 CNAS study on veterans nonprofits, show a stark difference between the membership and corporate models of pre-9/11 and post-9/11 veterans organizations. Pre-9/11 organizations generally reflect the tax code requirements of Internal Revenue Code sections 501(c)(19) and 501(c)(23), which are the sections written specifically to provide for veterans service organizations. Their membership consists exclusively of veterans, with chapters or headquarters separately incorporated at the local, state, and federal levels. Each chapter or headquarters is governed by a leadership structure made up mostly or exclusively of veterans, following the tax code requirements, that votes to elect leadership, amend bylaws, and approve resolutions. These organizations share a common brand, purpose, and some revenue, although they primarily have a local focus. By contrast, post-9/11 veterans organizations are nearly all nonprofit entities organized under Internal Revenue Code 501(c)(3). Although veterans are the majority or plurality of these groups’ memberships, post-9/11 organizations often explicitly welcome family members and nonveterans as well, differing from the narrow membership criteria of the pre-9/11 organizations. Another difference is governance, which shows post-9/11 organizations are generally governed by boards of directors that include veterans and nonveterans and often include corporate or public-sector leaders alongside nonprofit staff or founders. Moreover, the post-9/11 veteran-serving nonprofit organizations are generally vertically integrated organizations, albeit with some amount of local chapter activity run by volunteer or paid staff. Post-9/11 veterans organizations generally opt for more centralized leadership structures regarding fundraising, investments, financial reporting, and information technology, while allowing local leaders significant autonomy in program management. All of these differences contribute to how these organizations compete, serve their constituents or members, and navigate change. An additional difference is the membership model used by each cohort of organizations. Most pre-9/11 veterans organizations have “paid membership models” with strict eligibility requirements, often driven by a combination of organizational bylaws and tax code requirements. By contrast, many post-9/11 nonprofits have “freemium membership models” that allow a diverse array of people to engage as desired and do not require membership dues. These differing models have meaningful implications for revenue composition, member growth, and retention.

Changing Tides in the Sea of Goodwill: A Financial Analysis of Veteran-Serving Nonprofits
15
15
3.7 SIZE AND FINANCIAL RESOURCES
A number of metrics suggest that scale can be a competitive advantage in the veterans nonprofit marketplace. Surplus, efficiency, and fundraising cost data suggest that organizations earning less than $1 million in annual revenue appear less financially healthy and sustainable than larger organizations. However, another component of size is the extent to which organizations have accumulated assets: Pre-9/11 veterans organizations control 75 percent of the net worth (assets minus liabilities) in the market (see “Wealth Concentration”). The wealthiest three organizations (The American Legion, VFW, and DAV) control 52 percent of the wealth for the entire market. The benefits of age and size also seem to translate to measures of liquidity among veterans organizations, defined as liquid assets divided by annual total expenditures. On average, pre-9/11 organizations possess 16 months of liquidity, compared with post-9/11 organizations’ 12 months of liquidity. This finding contrasts with the surplus data showing substantially higher saving rates for the post-9/11 cohort but likely reflects the fact that pre-9/11 organizations have been accruing surpluses longer, albeit at slower rates.
Wealth Concentration
Source: GuideStar 4.0 OBSERVATIONS The financial data described above lays the foundation for a number of observations regarding the veteran-serving nonprofit organization marketplace. These observations relate primarily to the

Changing Tides in the Sea of Goodwill: A Financial Analysis of Veteran-Serving Nonprofits
16
16
organizations themselves and their business choices. This section outlines the significant observations that emerge from the data, as well as several important implications of this data.
4.1 POTENTIAL MARKET CHANGES Assuming the U.S. military remains the same size, the veteran population will continue to shrink over the next 20+ years as the large conscription-driven cohorts of World War II, Korea, Vietnam, and the Cold War fade away and are replaced in smaller numbers by more recent cohorts of veterans.33 This will likely drive major changes in the veteran-serving nonprofit landscape. First, the demographic changes will reduce the available membership base for veterans organizations, which will likely disproportionately affect pre-9/11 organizations. Second, this demographic change is likely to reduce the revenue base, especially for pre-9/11 organizations that are substantially dependent on membership contributions and giving from members and affiliated families. Many pre-9/11 organizations derive significant revenue (in direct proportion to the size of membership) from dues, direct member solicitations, sales of member merchandise, and advertisements to members. For example, these revenue categories comprised 68 percent of The American Legion National Headquarters’ revenue in 2017. As the remaining veteran population from World War II, Korea, and Vietnam rapidly decreases, these organizations should expect a proportional reduction in their revenue. If the shrinking veteran population impacts revenue, these organizations will have to compete for new sources of funding, such as corporate or foundation giving.
4.2 MARKET CHANGES FOR PRE-9/11 VETERANS ORGANIZATIONS Given many of the business model dynamics outlined above, responding to contracting membership and revenue is likely to be particularly challenging for pre-9/11 organizations and worthy of additional research and analysis. In the face of membership and operating losses, many pre-9/11 organizations may struggle to effectively size their operations to meet the new demand profile for two primary reasons. First, pre-9/11 veterans organizations deliver services predominantly through their paid employees, and any meaningful reduction in costs will likely require significant headcount reductions. In the private sector, these types of cost reduction measures are often challenging to implement and may result in dislocation of services and additional expenses such as severance, lease cancellation, or pension plan obligations. Second, dramatic reorganizations are challenging to implement in a distributed governance model similar to what The American Legion and VFW use. Their individual posts and chapters exercise significant autonomy and may legitimately choose to do what is best for the individual chapter rather than the national organization. How veterans organizations navigate the shrinking veteran population and changing engagement models will impact their business and governance models. The metrics presented earlier for the community may not adequately portray the magnitude of the challenge facing smaller pre-9/11 organizations or chapters. For example, The American Legion and VFW report a healthy aggregate surplus of $84 million, or 7 percent of total revenue. However, the performance of the underlying individual chapters demonstrates significant variability, which will likely force many of them to dramatically reduce costs or go out of business. Forty-six percent of the chapters studied in this report ran deficits for the most recent filing year totaling approximately $60

Changing Tides in the Sea of Goodwill: A Financial Analysis of Veteran-Serving Nonprofits
17
17
million. These deficits negatively impacted the liquidity (cash and investments) of struggling chapters. Money-losing chapters also show only 11 months of liquidity, compared with 17 months of liquidity for those chapters generating a surplus. Deficits are likely a leading indicator for chapter insolvency, and eventually, chapter disappearance. However, because pre-9/11 organizations overall have substantial liquidity, they will likely maintain solvency and viability for some time after their membership and revenue decreases by using these assets to fund deficits.
4.3 MARKET CHANGES FOR POST-9/11 ORGANIZATIONS Population change and continued competition within the veteran ecosystem could continue to benefit the post-9/11 cohort. The metrics described above demonstrate that large, post-9/11 organizations are experiencing faster growth, higher surplus margins, lower costs of fundraising, and greater efficiency in delivering programs. Overall, post-9/11 organizations tend to employ a less costly engagement model as measured by use of labor and information technology. These trends may lead to a competitive advantage compared with pre-9/11 organizations and smaller organizations regardless of cohort. Given the observed benefits of scale and the expected accumulation of wealth generated through surpluses of post-9/11 organizations, their capabilities may continue to grow if their services continue to appeal to younger veteran cohorts. To the extent that market shifts are occurring among the veteran-serving nonprofit market, post-9/11 organizations are already moving aggressively to make an impact through programming, chapter-based activities, advocacy in Washington, and other capabilities. The lack of real estate and staff that characterizes post-9/11 organizations does not yet appear to disadvantage them. However, these organizations tend not to deliver social services such as benefits counseling, employment assistance, or crisis intervention at the local level, services that demand pre-9/11 organizations employ more staff and use more real estate. Conversely, the ephemeral nature of post-9/11 organizations’ online presence could hurt them in the long term in the face of significant market changes, given their lack of consistent membership base, and these organizations must demonstrate meaningful impact in the community.
4.4 EFFECTS OF SCALE ON VETERANS ORGANIZATIONS The large number of veteran-serving nonprofit organizations across America is a testament to the long history of outstanding support that smaller organizations have provided to the community. However, the business and market trends outlined in this paper may challenge their continued viability. The metrics consistently indicate that organizations with less than $1 million in annual revenue are disadvantaged relative to their larger peers in areas such as efficiency, growth, savings, cost of fundraising, and cost of engagement. This uncompetitive position is likely to get worse, as the market contracts with the size of the veteran population.
4.5 POLITICAL CONSEQUENCES OF MARKET SHIFTS Significant shifts within the veterans nonprofit community may also result in important consequences for politics and public policy. Legacy veterans organizations such as the Big 6 (The American Legion, VFW, DAV, AMVETS, Paralyzed Veterans of America, and Vietnam Veterans of America) built and continue to exercise considerable lobbying capabilities in Washington to

Changing Tides in the Sea of Goodwill: A Financial Analysis of Veteran-Serving Nonprofits
18
18
advocate for veterans issues. It has yet to be seen whether a shrinking veteran population could produce a very different political landscape. These changes are likely to impact and shape coming debates over issues such as privatization in VA health care, especially given the extremely fraught political climate surrounding VA.
4.6 NEED FOR BETTER DATA The veteran community as a whole also suffers from a lack of quality data for the entire market. This lack of information hinders both policymakers and managers from making informed decisions. Analysis of the IRS data used for this report suggests poor accuracy in many reported fields such as employee count. In addition, for the research used in this paper, only 12 percent of the organizations studied had reported 2016 results at the time of the data collection (November 2017), with the remaining 88 percent having only reported results from 2015 or earlier. There is significant need for better reporting given that tax data is the only universally publicly available data for all veteran-serving nonprofits. In light of the need for better self-reported tax data, there is additional need for comprehensive reporting framework to establish metrics specific to the veteran-serving nonprofit space. To have data useful for funders, policymakers, and leaders, organizations should provide better-quality, more timely, and relevant information on which to make informed decisions. In the long run, better data leads to better assessment of business performance and veteran impact.
4.7 INSIGHTS FROM A LIMITED SHARE OF THE MARKET With over 38,000 discrete entities in the total veterans nonprofit marketplace, it is challenging to assess the market and develop effective policies, considering how fragmented and diverse it is. By focusing only on organizations with over $1 million in annual revenue, researchers can instead narrow the number of organizations under examination to just 172 while still capturing 93 percent of the revenue generated in the market. While this method overlooks small nonprofits that can still provide important, and often local, services, it can be a useful technique in developing broad policy proposals. Defining the veterans organization ecosystem in this manner dramatically simplifies the market while still providing deep insight into the important trends impacting the community.
4.8 RELATIVE SIZE OF THE VETERANS NONPROFIT MARKET Finally, the analysis conducted for this paper confirms previous research showing that veteran-serving nonprofit organizations constitute a relatively small segment of the overall charity market. Veterans nonprofit revenue, totaling $3.6 billion, makes up less than 1 percent of the overall charity market in the United States. While this paper explores how pre- and post-9/11 veterans organizations are competing with different success to grow revenue, this is not a zero-sum game. The impact of growing this market through better information, more awareness, and more capable organizations far outweighs any potential change in share among the pre- and post-9/11 cohorts. Many of the business model benefits seen in the post-9/11 cohort are having a positive impact in serving the veteran community and could also make veterans causes more attractive in the philanthropy market. As suggested in the CNAS report “A Continuum of Collaboration,” a broad

Changing Tides in the Sea of Goodwill: A Financial Analysis of Veteran-Serving Nonprofits
19
19
framework of private and public organizations – including both the VA and veterans nonprofits – remains necessary to fully serve the veteran community.34
5.0 CONCLUSION As of the most recently available IRS data, veteran-serving nonprofit organizations founded after 9/11 were growing substantially faster than those founded before 9/11. In business terms, these “new economy” organizations are taking significant market share and growing rapidly even as the overall veteran population shrinks. These organizations are competing with a different business model from their pre-9/11 peers – one that offers real competitive advantage, which can be tangibly observed through metrics such as faster income growth, faster wealth accumulation, less expensive methods of engagement, and efficiencies. However, this initial financial analysis speaks neither to the impact of veteran nonprofit services nor the alignment of these services to needs, both of which are areas ripe for future research. This research clearly portrays a market in transition. As the community evolves with the changing landscape and needs of today’s veterans, this type of business analysis can serve as a valuable tool for leaders, funders and policy makers as they navigate the changing tides in the Sea of Goodwill. 1 “Veteran Population,” U.S. Department of Veterans Affairs, August 2017, https://www.va.gov/vetdata/veteran_population.asp. 2 Matt Alderton, “Today’s veterans groups are not your granddad’s VFW,” USA Today, November 11, 2015, https://www.usatoday.com/story/news/nation/2015/11/11/new-generation-of-veterans-organizations/75516156/ 3 For more information on the changing needs of the veteran community, please see previous CNAS reports: Phillip Carter and Katherine Kidder, “A Continuum of Collaboration” (Center for a New American Security, April 2017), https://www.cnas.org/publications/reports/a-continuum-of-collaboration; and Phillip Carter, Katherine Kidder, Amy Schafer and Andrew Swick, “Onward and Upward” (Center for a New American Security, November 2016), https://www.cnas.org/publications/reports/onward-and-upward. 4 Katherine Kidder and Phillip Carter, “Charting the Sea of Goodwill” (Center for a New American Security, December 9, 2015), https://www.cnas.org/publications/reports/charting-the-sea-of-goodwill. 5 “Veteran Population,” U.S. Department of Veterans Affairs, August 2018, https://www.va.gov/vetdata/veteran_population.asp; and “2016 Demographics: Profile of the Military Community,” U.S. Department of Defense, 2016, http://download.militaryonesource.mil/12038/MOS/Reports/2016-Demographics-Report.pdf. 6 U.S. Department of Defense, “Contingency Tracking System, Ever Deployed Report,” as of November 30, 2017. 7 “Veteran Population,” August 2018. 8 Kristen Bialik, “The changing face of America’s veteran population,” Pew Research Center, November 10, 2017, http://www.pewresearch.org/fact-tank/2017/11/10/the-changing-face-of-americas-veteran-population/. 9 “War and Sacrifice in the Post-9/11 Era” (Pew Research Center, October 5, 2011), http://www.pewsocialtrends.org/2011/10/05/war-and-sacrifice-in-the-post-911-era. 10 “War and Sacrifice in the Post-9/11 Era.” 11 Rebecca Burgess, “Economic Opportunity, Transition Assistance, and the 21st-Century Veteran: The Case for a Fourth VA Administration” (American Enterprise Institute, March 20, 2018), http://www.aei.org/wp-content/uploads/2018/03/Economic-Opportunity-Transition-Assistance-and-the-21st-Century-Veteran.pdf; and Phillip Carter, “What America Owes Its Veterans,” Foreign Affairs (September-October 2017). 12 Vanessa Williamson, “Supporting Our Troops, Veterans and Their Families: Lessons Learned and Future Opportunities for Philanthropy; A Report on the Iraq Afghanistan Deployment Impact Fund (IADIF) of the California Community Foundation” (Iraq Afghanistan Deployment Impact Fund, November 2009), https://www.calfund.org/document.doc?id=215.

Changing Tides in the Sea of Goodwill: A Financial Analysis of Veteran-Serving Nonprofits
20
20
13 U.S. Department of Veterans Affairs, Understanding Public-Private Partnerships, Fact Sheet 01 (January 12, 2017), https://www.va.gov/ve/docs/understandingPublicPrivatePartnerships.pdf. 14 For purposes of this study, large organizations are defined as those with revenue in excess of $1 million and small organizations are those with revenue less than $1 million. 15 “2017 report on 2016 giving,” Giving USA, 2017, https://givingusa.org/wp-content/uploads/2017/06/Giving-USA-2017-Infographic.jpg. 16 Peter Dobkin Hall, “A Historical Overview of Philanthropy, Voluntary Associations, and Nonprofit Organizations in the United States, 1600-2000,” in The Non-Profit Sector: A Research Handbook – Second Edition, eds. Walter W. Powell and Richard Steinberg (New Haven, CT: Yale University Press, 2006), https://www.hks.harvard.edu/publications/historical-overview-philanthropy-voluntary-associations-and-nonprofit-organizations; and Peter Dobkin Hall, “Documentary History of Philanthropy and Voluntarism in the United States, 1600-1900.” 17 Williamson, “Supporting Our Troops, Veterans and Their Families: Lessons Learned and Future Opportunities for Philanthropy”; and Thomas Meyer, “Serving Those Who Served: A Wise Giver’s Guide to Assisting Veterans and Military Families” (Philanthropy Roundtable, 2013), https://www.philanthropyroundtable.org/docs/default-source/default-document-library/serving_those_who_served.pdf?sfvrsn=e46ca740_0. 18 Nancy Berglass, “Investing in the Best” (Center for a New American Security, April 11, 2012), https://www.cnas.org/publications/reports/investing-in-the-best; and Nancy Berglass and Margaret C. Harrell, “Well After Service: Veteran Reintegration and American Communities,” CNAS, April 11, 2012, https://www.cnas.org/publications/reports/well-after-service-veteran-reintegration-and-american-communities. 19 “Tax Information for Charitable Organizations,” Internal Revenue Service, 2018, https://www.irs.gov/charities-non-profits/charitable-organizations. 20 “Exempt Organization Public Disclosure and Availability Requirements,” Internal Revenue Service, 2018, https://www.irs.gov/charities-non-profits/exempt-organization-public-disclosure-and-availability-requirements. 21 “W30 – Military & Veterans Organizations,” National Center for Charitable Statistics, http://nccs.urban.org/sites/all/nccs-archive/html/PubApps/nteeSearch.php?gQry=w30. 22 Throughout this paper, the taxonomy of pre-9/11 and post-9/11 is used to describe the date of an organization’s founding, not the population served nor the generation cohort of an organization’s leadership. 23 “Revenue,” Investopedia, 2018, https://www.investopedia.com/terms/r/revenue.asp. 24 Revenue growth was calculated from 2007 through the most recent tax filing date available for all organizations with annual revenues in excess of $1 million. 25 “National Center for Charitable Statistics Data Archive,” Urban Institute, accessed January 2017, http://nccs-data.urban.org/index.php. 26 “Surplus,” Investopedia, 2018, https://www.investopedia.com/terms/s/surplus.asp. 27 In this analysis, Wounded Warrior Project tax information is from 2015, the most recent filing year when analysis was initiated. It is important to note that WWP experienced dramatic changes in revenue, staff, and contributions after a 2015 scandal alleging organizational mismanagement and lavish spending, resulting in a 20 percent loss in revenue 2015 to 2016 and an additional 30 percent loss in revenue 2016 to 2017. See Mark Hrywna, “WWP Revenue Declined 20% After Controversy,” The NonProfit Times, May 18, 2017, http://www.thenonprofittimes.com/news-articles/wwp-revenue-declined-20-controversy/; and Mark Hrywna, “Revenue, Program Spending Decline Again At Wounded Warrior Project,” The NonProfit Times, April 23, 2018, http://www.thenonprofittimes.com/news-articles/revenue-program-spending-decline-wounded-warrior-project/. 28 “How Do We Rate Charities’ Financial Health?,” Charity Navigator, 2018, https://www.charitynavigator.org/index.cfm?bay=content.view&cpid=35#Financial-Efficiency-Performance-Metrics. 29 The American Legion reports 2 million members: “Fast Facts,” The American Legion, https://www.legion.org/presscenter/facts. VFW reports “nearly 1.6 million VFW and VFW Auxiliary members”: “Fact Sheet,” VFW, June 2018, https://vfworg-cdn.azureedge.net/-/media/VFWSite/Files/Media-and-Events/Press-Room/VFWFactSheet.pdf?la=en&v=1&d=20180626T154754Z. DAV reports “more than 1 million members”: “About DAV,” DAV, https://www.dav.org/learn-more/about-dav/. By comparison, Pew Research reports there are 20.4 million veterans living in the United States. Bialik, “The changing face of America’s veteran population.”

Changing Tides in the Sea of Goodwill: A Financial Analysis of Veteran-Serving Nonprofits
21
21
30 As with all of the financial data employed in this paper, the number of employees per organization was obtained through IRS Form 990s as aggregated by GuideStar. Unfortunately, there are often reporting errors in these forms – including for the number of employees. These errors have been noted and corrected as possible. 31 Kidder and Carter, “Charting the Sea of Goodwill.” 32 Kidder and Carter, “Charting the Sea of Goodwill.” 33 “Veteran Population,” August 2017. 34 Carter and Kidder, “A Continuum of Collaboration.”