working paper 75 - v-dem.net · 1 keeping the democratic façade: contemporary autocratization as a...
TRANSCRIPT

I N S T I T U T E
Keeping the Democratic Façade:Contemporary Autocratization as a Game of Deception
Anna LührmannSta�an I. Lindberg
Working Paper SERIES 2018:75
THE VARIETIES OF DEMOCRACY INSTITUTE
August 2018

Varieties of Democracy (V-Dem) is a new approach to conceptualization and measurement of democracy. The headquarters – the V-Dem Institute – is based at the University of Gothenburg with 17 staff. The project includes a worldwide team with six Principal Investigators, 14 Project Managers, 30 Regional Managers, 170 Country Coordinators, Research Assistants, and 3,000 Country Experts. The V-Dem project is one of the largest ever social science research-oriented data collection programs.
Please address comments and/or queries for information to:
V-Dem Institute
Department of Political Science
University of Gothenburg
Sprängkullsgatan 19, PO Box 711
SE 40530 Gothenburg
Sweden
E-mail: [email protected]
V-Dem Working Papers are available in electronic format at www.v-dem.net.
Copyright © 2018 by authors. All rights reserved.
1
Keeping the Democratic Façade:
Contemporary Autocratization as a Game of Deception*
Anna Lührmann
V-Dem Institute
University of Gothenburg
Staffan I. Lindberg
V-Dem Institute
University of Gothenburg
* For helpful comments, we thank Scott Gates, Kyle Marquardt, Jan Teorell, and participants of the APSA General Conference (8/2017), the V-Dem Research conference (5/2018) the post-doctoral working group at the University of Gothenburg and the HU/Princeton workshop on constitutionalism, dissent and resistance (6/2018), where earlier versions of this paper were discussed. In particular, we are grateful to Rick Morgen who helped to better operationalize our idea of autocratization episodes. We also benefited immensely from Philipp Tönjes’ skillful research assistance. This research was supported by Riksbankens Jubileumsfond, Grant M13-0559:1, PI: Staffan I. Lindberg, V-Dem Institute, University of Gothenburg, Sweden; by Knut and Alice Wallenberg Foundation to Wallenberg Academy Fellow Staffan I. Lindberg, Grant 2013.0166, V-Dem Institute, University of Gothenburg, Sweden; ERC Consolidator Grant 724191, PI: Staffan I. Lindberg, V-Dem Institute, University of Gothenburg, Sweden; as well as by internal grants from the Vice-Chancellor’s office, the Dean of the College of Social Sciences, and the Department of Political Science at University of Gothenburg.
2
Abstract
Less than thirty years after Fukuyama and others declared liberal democracy’s eternal dominance,
a third wave of autocratization is manifest. Gradual declines of democratic regime attributes
characterize contemporary autocratization. Yet, we lack the appropriate conceptual and empirical
tools to diagnose and compare such elusive processes. Addressing that gap, this paper provides
the first comprehensive empirical overview of all autocratization episodes from 1900 to today
based on data from the Varieties of Democracy Project (V-Dem). We demonstrate that a third
wave of autocratization is indeed unfolding. It mainly affects democracies with gradual setbacks
under a legal façade. While this is a cause for concern, the historical perspective presented in this
paper shows that panic is not warranted: the current declines are relatively mild and the global
share of democratic countries remains close to its all-time high. As it was premature to announce
the “end of history” in 1992, it is premature to proclaim the “end of democracy” now.

3
Introduction
The decline of democratic regime attributes – autocratization – has emerged as a conspicuous
global challenge. Democratic setbacks in countries as diverse as Brazil, Burundi, Hungary, Russia,
Serbia, and Turkey have sparked a new generation of studies on autocratization.1
Two key issues are not yet settled in this reinvigorated field. First, scholars agree that
contemporary democracies tend to erode gradually and under legal disguise (e.g. Bermeo 2016,
Runciman 2018). Democratic breakdowns used to be rather sudden events – for instance military
coups – and relatively easy to identify empirically (Linz 1978). Now, multi-party regimes slowly
become less meaningful in practice (Lührmann et al. 2018) making it is increasingly difficult to
pin-point the end of democracy. Yet, in face of this emerging consensus we lack the appropriate
conceptual and empirical tools to systematically analyze such obscure processes.
The second key issue, partly a product of the first, is that analysts disagree about how
momentous the current wave of autocratization is. Some draw parallels to the breakdown of
democracies in the 1930s and the rise of anti-democratic demagogues (Levitsky and Ziblatt 2017,
Snyder 2017). Others maintain that the world is still more democratic (Mechkova et al. 2017),
developed (Runciman 2018) and emancipated (Norris 2017) than ever during the 20st century.
How wide and deep does the current autocratization trend cut?
This paper addresses these gaps with a three-pronged strategy. First, it provides a definition
autocratization as substantial de-facto decline of core institutional requirements for electoral
democracy. 2 This notion is more encompassing than the frequently used term democratic
backsliding, which suggests an involuntary reversal back to historical precedents.
Second, this paper offers a new type of operationalization that in a systematic fashion
captures the conceptual meaning of autocratization as episodes of meaningful change based on
data from the Varieties of Democracy Project (V-Dem). This new measure has three major
advantages: It measures what we actually want to study; it is sensitive to changes in the de-facto
implementation of democratic rules; and it is nuanced enough to also capture gradual
autocratization processes and thus avoid biasing the sample towards fast-moving changes.
1 See for example Altman and Perez-Liñan 2017, Bermeo 2016, Cassini and Tomini 2018, Coppedge 2017, Diamond 2015, Haggard and Kaufmann 2016, Levitsky and Ziblatt 2017, Lührmann et al. 2018, Mounk 2018, Runciman 2018, Snyder 2017, Wagemann and Tomini 2017 and Waldner and Lust 2018. 2 Our notion of democracy is based on Dahl’s (1971, 1998) famous conceptualization of electoral democracy as ‘polyarchy’, namely clean elections, freedom of association, universal suffrage, an elected executive, as well as freedom of expression and alternative sources of information.

4
Third, this paper employs the new measure in a systematic study that adds a historical
perspective on contemporary autocratization. The resultant findings are mixed. On the one hand,
we are the first to show that a “third wave of autocratization” affecting an unprecedented high
number of democracies is under way. This wave unfolds slow and piecemeal making it hard to
evidence. Ruling elites shy away from sudden, drastic moves to autocracy and continue to mimic
democratic institutions while gradually eroding their functions. This suggests we should heed the
call of alarm issued by some scholars.
On the other hand, the evidence here also show that we still live in a democratic era with
more than half of all countries qualifying as democratic. And, most episodes of contemporary
autocratization are not only slower, but also much slighter than their historical cousins, as of yet.
Thus, countries affected remain more democratic than their equivalents hit by earlier waves of
autocratization.
Below, we first pursue a review of the literature followed by a reconceptualization of
autocratization with accompanying operationalization, description of data, and coding procedures.
The fourth section presents a series of descriptive analyses of the three waves of autocratization,
followed by a section investigating types of democracy recessions. The final section introduces a
new metric – the rate of autocratization – as an indicator for the pace of such processes. We
conclude with a summary of the findings and avenues for future research.
I. State of the Art at Present
Many have noted that the optimism spurred by the force of the third wave of democratization
(Huntington 1992) was premature, including Fukuyama’s (1992) relegation of the reverse process
- autocratization – to the history books. A plethora of autocracies defied the trend (Svolik 2012)
or made some half-hearted reforms while remaining in the grey zone between democracy and
autocracy (Schedler 2013; Diamond 2002).
Yet, when assessments about “freedom in retreat” (Freedom House 2008) or “democratic
rollback” (Diamond 2008) emerged, they were frequently challenged. At the time, global measures
of democracy had merely plateaued and established democracies did not exhibit any serious
problems (Merkel 2010, Levitsky and Way 2015). Now evidence is mounting that a global reversal
is challenging a series of established democracies, including the United States who was
downgraded by Freedom House in 2018. Substantial autocratization have been recorded over the
last ten years in countries as diverse as Hungary, India, Russia, Turkey, and Venezuela (Lührmann
et al. 2018). An increasingly bleak picture is emerging on the global state of democracy (Diamond

5
2015; Levitsky and Ziblatt 2018; Kurlantzick 2013), even if some maintain that the achievements
of the third wave of democratization are still visible (Mechkova et al. 2017).
In view of this, Waldner and Lust (2018: 14) conclude that “[t]he study of [democratic]
backsliding is an important new research frontier”. A series of new studies on autocratization
seems to have generated an emerging consensus on one important insight: the process of
autocratization seems to have changed. Bermeo (2016: 6) for example suggests a decline of the
“most blatant forms of backsliding” – such as military coups and election day vote fraud.
Conversely, more clandestine ways of autocratization – harassment of the opposition, subversion
of horizontal accountability – are on the rise (Bermeo 2016:14; Diamond 2015). Svolik (2015)
similarly argues that the risk of military coups has declined over time in new democracies, while
the risk of autogolpes3 remains. Mechkova et al. (2017) showed that in the recent period between
2006 and 2016 autocratization mainly maimed aspects such as media freedom and the space for
civil society leaving the institutions of multiparty elections in place. Coppedge (2017) singled out
the gradual concentration of power in the executive as a key contemporary pattern of
autocratization – next to what he calls the more “classical” path of intensified repression.
“Executive aggrandizement” is the term Bermeo (2016: 10) uses for this process.
While the literature thus agrees that the process of autocratization has changed; it does not
yet offer a systematic way of measuring the new mode of autocratization. The new contributions
build on case examples (Levitsky and Ziblatt 2018), statistics on selected indicators of gradual
autocratization – i.e., military coups and electoral fraud (Bermeo 2016), opinion polls (Mounk
2018) or on changes in quantitative measures over a set time period (Diamond 2015, Lührmann
et al. 2018). Most existing comparative studies on the causes of autocratization (Svolik 2008,
Bernhard et al. 2001, Ulfelder and Lustik 2007, Przeworski et al. 2000) as well as descriptive
overviews (Merkel 2010, Erdmann 2011, Levitsky and Way 2015) are also biased in that they
include only cases of complete breakdown of democracies. Such binary approaches not only fail
to capture the often protracted, gradual and opaque processes of contemporary regime change
(Luedders and Lust 2018), but also exclude important variations: autocratization in democracies
that do not (yet?) lead to complete breakdown (e.g. Hungary) and reversals in electoral autocracies
that never became democracies (e.g. Sudan).
This is important because the archetypical type of dramatic reversals to closed autocracy
is becoming so rare – as are closed autocracies. While about half of all countries were closed
3 Autogolpes are “transitions to authoritarianism caused by the incumbent chief executive” (Przeworski et al. 2000: 21).

6
autocracies in 1980 but by 2017, they only make up 12 percent of regimes in the world.4
Contemporary autocrats have mastered the art of subverting electoral standards without breaking
their democratic façade completely (Schedler 2013; Levitsky and Way 2010). In effect, as of 2017
a majority of countries still qualify as democracies (56 percent) and the most common form of
dictatorship (32 percent) are the electoral autocracies (Lührmann et al. 2018: 68). This
contemporary dominance of multi-party electoral regimes made many analysists posit that
democracy as a global norm after the end of the Cold War (Norris 2013; Hyde 2011) continues to
shape expectations and behavior even of autocrats (Diamond 2018).
In this global context, it does not surprise that sudden reversals to authoritarianism have
grown out of fashion, because they typically involve the abolishment multi-party elections in a
coup. Such more visible forms of democratic norm violations carry high legitimacy cost (Schedler
2013). Obviously “stolen” elections have triggered mass protests leading up to the color
revolutions (Bunce and Wolchik 2010, Thompson and Kuntz 2009). Likewise, the international
community often sanctions political leaders who explicitly disrespect electoral results, and
international aid is often conditioned on a country holding multi-party elections (Kim and Kroeger
2017). For instance, after the Gambian elections in 2016, president Jammeh’s refusal to accepted
defeat was quickly met with a military intervention from neighboring countries – forcing him into
exile.5 The same seem to apply for military coups – which might explain the sharp drop of coups
in recent decades (Bermeo 2016).
More difficult to pinpoint as a clear violation of democratic standards, a transition to electoral
authoritarianism provides fewer opportunities for domestic and international opposition. Electoral
autocrats secure their competitive advantage through subtler tactic such as censoring and harassing
the media, restricting civil society and political parties and undermining the autonomy of election
management bodies. Aspiring autocrats have been shown to learn from each other (Hall and
Ambrosio 2017) and are borrowing tactics perceived to be less risky than abolishing multi-party
elections altogether.
Thus, both prior literature on autocratization as well as the global rise of multiparty elections
make it plausible that the current wave of autocratization unfolds in a more clandestine and gradual
fashion than its historical precedents.
4 Closed autocracies are typically defined in the literature as regimes where the chief executive is not subjected to de jure multiparty elections. Thus, this category includes monarchies, military regimes, as well as one-party states. 5 See New York Times. 2017. ‘As Gambia’s Yahya Jammeh Entered Exile, Plane Stuffed with Riches Followed.’ https://www.nytimes.com/2017/01/23/world/africa/yahya-jammeh-gambia-exile.html (access 30 Mar 2018).

7
This leads to the next question: If autocratization occurs more gradual does this also reduce
the magnitude of change? Bermeo (2016: 17) suggests it does. Others entertain more pessimism
in books titled for instance “How democracy dies” (Levitsky and Ziblatt 2017) and “How
democracy ends” (Runciman 2018). Yet, the recent literature on autocratization does not offer
fine-grained, systematic empirical comparisons on this issue either.
Thus, we find important contributions and emerging propositions in the extant literature on
contemporary autocratization. This paper seeks to fill three main gaps. First, a comprehensive
conceptualization of autocratization with an accompanying operationalization with high validity is
clearly needed to make future findings comparable. Second, we lack a comprehensive empirical
analysis diagnosing contemporary autocratization in historical perspective: (i) its extent and which
types of regimes are mostly affected compared to previous waves; (ii) the nature of how it is
enacted by rulers in comparative perspective; and (iii) its pace and magnitude of change. This paper
seeks to fill these gaps.
II. What Is, and Is Not, Autocratization?
Pace democratization, there are two seemingly opposed understandings of autocratization, similar
to the debate about whether democratization should be understood as a difference in kind
(countries moving across a qualitative threshold; see Przeworski et al., 2000), or in degree (gradual
moves away from pure dictatorship; see Collier and Adcock 1999, Lindberg 2006, 24-27). We now
face a similar condo durum with three commonly used terms for varying degrees of differences in
kind, of moving away from democracy: backsliding, breakdown of democracy, and
autocratization.6
We suggest that is preferable to conceptualize autocratization – the antipode of
democratization – as a matter of degree that can occur both in democracies and autocracies.
Democracies can lose democratic traits to varying degrees without fully, and long before breaking
down. For instance, it is still an open question if Orbán’s model of “illiberal democracy” in
Hungary will transmute into authoritarianism. And non-democratic regimes can be placed on a
long spectrum ranging from closed autocracies – such as North Korea or Eritrea – to electoral
autocracies with varying degrees of closeness to democracy - such as Nigeria before the 2015
6 While these are the most commonly used terms, it is important to note that others exist as well such as “democratic erosion” (Coppedge 2017), “de-democratization” (Tilly 2003), “democratic recession” (Diamond 2015) or “closing space” (Carothers and Brechenmacher 2014). For a more extensive list of terms used in the debate see Cassani and Tomini (2018: 4).
8
elections. Thus, even most autocracies harbor some democratic regime traits to different degrees
(e.g. somewhat competitive, but far from fully free and fair elections) and can lose them, such as
the 1989 military coup in Sudan when Omar Al-Bashir replaced an electoral autocracy with one of
Africa’s worst closed dictatorships.
The classic literature (e.g. Linz 1979) focuses on the breakdown of democracies even if some
also identified gradual erosion of democracy in this earlier period (Przeworski et al. 2000). Sudden
transitions dominated the moves away from democracy in the 1960s and 1970s making it a proper
label for moves away from democracy at the time. However, the concept of “breakdown” is useful
only for a subset of possible episodes of autocratization. First, it requires a crisp approach to the
difference between democracy and dictatorship to enable the identification of the point of
breakdown. That excludes studies of the protracted undermining of democratic institutions
encapsulated by autogolpe and unfinished degeneration of qualities in democracies, as well as the
waning away of partial democratic qualities in electoral authoritarian regimes. This is particularly
problematic for the contemporary period when instances of sudden autocratization – coups d’état
for instance – are rare.
Some scholars have suggested democratic backsliding to denote the diminishing of democratic
traits. For example, Bermeo (2016: 5) defines backsliding as “state-led debilitation or elimination
of any of the political institutions that sustain an existing democracy.” Waldner and Lust (2018:
5.3) understand backsliding as a “deterioration of entails a deterioration of qualities associated with
democratic governance, within any regime” (emphasis added). While we are sympathetic to
Waldner and Lust’s move away from an exclusive focus on democracies, we find the use of term
backsliding problematic for three reasons: First, democratic backsliding implies a decline “in terms of”
democracy and thus a conceptual extension beyond the democratic regime spectrum would border
to conceptual stretching (Sartori 1970). From our point of view, an already autocratic country
cannot undergo “democratic” backsliding into a deeper dictatorship. Second, the term suggests
that regimes slide “back” to where they were before whereas in reality they may develop in a new
direction, to a different form of authoritarianism for example (Runciman 2018: 3). Finally,
“sliding” makes it sound like an involuntary, unconscious process, which does not do justice to
conscious actions political actors take in order to change a regime. It simply invokes the wrong
kind of notion about the process.
Third, we suggest that the overarching, or superior in Sartori’s terms (1970), concept is
autocratization. Semantically, it signals that we study the opposite of democratization, thus

9
describing “any move away from [full] democracy” (Lindberg 2009: 12). 7 As an overarching
concept autocratization covers both sudden breakdowns of democracy á la Linz and gradual
processes within and outside of democratic regimes where democratic traits decline - resulting in
less democratic, or more autocratic, situations (Figure 1). This conceptualization enables us to
study both the pace and the methods of bringing a regime closer to a closed dictatorship, while
keeping the distinction between democratic recessions starting in democracies, democratic
breakdowns, and further consolidation of already authoritarian regimes.
To provide comprehensive definition of autocratization processes, we use the term
democratic recession to denote autocratization processes taking place in democracies, democratic
breakdown to capture when a democracy turns into an autocracy, and autocratic consolidation as
designation for gradual declines of democratic traits in already authoritarian situations.
Figure 1. Autocratization as Democratization in Reverse
III. Operationalization and Data
Contemporary political science puts a heavy emphasis on identification of causal factors, and some
distrust any analysis based on observational data. However, we cannot randomly assign either
autocratization nor its potential causes to countries. Whether we like it or not, we must rely on
observational data to depict, understand, and explain the current (worrying) trend of
autocratization. Taking one step back, any causal analysis is predicated on an accurate description
of the outcome: how do we know a autocratization process when we see it? What are the more
useful ways to decipher the dynamics and depict patterns, so as to facilitate descriptive inferences?
7 Cassani and Tomini (2018) define autocratization positively as a “process of regime change towards autocracy that makes politics increasingly exclusive and monopolistic, and political power increasingly repressive and arbitrary.” This definition differs from our approach to think about autocratization negatively - as a move away from democracy. We prefer our approach for two reasons. First, it is in-line with the common understanding of autocracy as non-democracy (e.g. Schedler 2013). Second, our approach allows us to understand autocratization and democratization as mutually exclusive, which allows us to operationalize them unambiguously.

10
While there is relatively satisfactory data on sudden breakdowns – for instance on military
coups (Powell and Thyne 2011) and dichotomous measures focusing on transitions from
democracy to autocracy recorded in extant datasets (e.g. Bernhard et al. 2001; Haggard and
Kaufmann 2016), we have lacked sufficiently nuanced yet systematic cross-national, times-series
data on various aspects of regimes to detail incremental autocratization processes.
This paper presents a novel approach identifying autocratization episodes – connected periods
of time with a substantial decline in democratic regime traits. We use V-Dem’s data (Coppedge et
al. 2017a, v7.1) on 178 countries from 1900 to the end of 2016, or 17,604 country-years.8 To
identify autocratization episodes, we rely on the Electoral Democracy Index (EDI, v2x_polyarchy).
The EDI captures to what extend regimes achieve the core institutional requirements in Dahl’s
(1971, 1998) famous conceptualization of electoral democracy as ‘polyarchy’ (Teorell et al. 2018).
For present purposes, V-Dem’s EDI has four key advantages. First, V-Dem data provides vast
temporal and geographical coverage with data reaching back to 1900. Second, the EDI reflects
how democratic a political regime is de-facto beyond the mere de-jure presence of political
institutions. And, it has a strong theoretical foundation in regime attributes that Dahl has identified
as core requirements for an electoral democracy.9 Finally, as a continuous index of de-facto levels
of democracy it is sensitive to gradual and slow-moving autocratization processes.
The EDI runs on a continuous scale from 0 to 1, with higher values indicating a more
democratic dispensation. We operationalize autocratization as a substantial decline on the EDI
(within one year or over a connected time period). A decline is substantial if it amounts to drop of
0.1 or more on the EDI. The choice of cut-off point on a continuous index is naturally arbitrary
but a change of 10% seems a reasonable and intuitive choice for the following reasons. This
relatively demanding cut-off point of 0.1 minimizes the risk of measurement error driving the
results since it requires more of an agreement among V-Dem coders that declines occurred among
the 40 components of the EDI to achieve this magnitude of difference on the EDI scale.10 The
8 Approximately half of the indicators in the V-Dem dataset are based on factual information from official documents such as constitutions. The remainder consists of expert assessments on topics like the quality of elections and de facto compliance with constitutional standards. On such issues, typically five experts provide ratings for the country, thematic area and time period for which they are specialists (Coppedge et al 2017b). 9 Lührmann et al. (2018) use V-Dem’s Liberal Democracy Index to identify democratic declines. The advantage of this alternative strategy is that it provides an early warning tool because liberal aspects of democracy often are the first to erode (see Coppedge 2017). However, the aim of this paper is different. Namely, we want to provide a heuristic device, which facilitates the analysis of questions such as how liberal constraints influence the likelihood of autocratization. Therefore, we need to operationalize autocratization in a way that is parsimonious and does not include liberal aspects of democracy. 10 V-Dem aggregates the expert assessments using Bayesian IRT model (Pemstein et al. 2017, Marquardt and Pemstein 2017). This model also provides an estimate of uncertainty reflecting mainly how much experts disagree. Almost all of the declines of 0.1 or more are visible even after considering this uncertainty estimate. The only exception are two episodes in Finland (1939-1940) and Niger (2013-2016), where the V-Dem data indicated a low level of certainty about
11
cut-off point should also be high enough to rule out inconsequential changes but low enough to
capture substantial yet incremental changes that do not amount to a full breakdown. A typical
example would be the series of declines in democratic qualities in Hungary from 2006 to 2016
adding up to drop of the EDI of 0.11. In appendix A4, we demonstrate the robustness of the main
findings of this paper to a higher cut-off point.
Episodes of autocratization have a start and an end. We proceed in two steps to identify
such episodes. First, we identify potential autocratization episodes, which are adverse regime
change of any magnitude. Second, we exclude all minor episodes with an overall change of less
than 10% of the EDI.
To identify all potential episodes, we devise a set of coding rules for start, continuation,
and end points. A potential autocratization episode starts with a decline on the EDI of 0.01 points
or more, from one year to the next. We chose this relatively low threshold in order to catch the
very beginning of incremental autocratization episodes.11 Second, the potential episode continues
as long as there is a continued decline. We allow a potential episode to contain up to three years
of stagnation (no further decline of 0.01 points on the EDI) in order to reflect the concept of
slow-moving processes that can move in fits and starts with a careful autocrat at the helm. The
potential autocratization period ends when there are no further declines on the EDI of 0.01 or
more over four years, or if the EDI increases by 0.02 points or more during one of those years
since the latter would indicate a potential democratization episode.12
Finally, we calculate the total magnitude of change from the year before the start of an
episode to the end, and we only include as manifest autocratization episodes those which add up
to a change of at least 0.1 on the EDI scale.13 These coding rules ensure that periods of some fits
and starts in what is often a protracted and messy process, are counted as one episode while at the
same time minimizing the risk that measurement error plays a role in determining when an episode
starts or finishes. Yet, Appendix A4 demonstrates that the main findings of this paper are robust
to modifications of the coding rules.
To illustrate the validity of the coding rules, consider ongoing autocratization in Turkey.
Our coding rules date the beginning of the shrinking of democratic space in Turkey to 2005 with
the declines. However, we cross-checked both cases with qualitative references and are confident that the changes should be considered as autocratization episodes. 11 Robustness checks with different thresholds yield similar results in regression analysis (see Appendix A4). 12 A lower threshold of 0.01 for ending episodes would for instance lead to the contemporary episode in Russia to be limited to the years 2000-2011, even though already the prior years and the years after 2011 saw major cumulative declines (-.026 between 1994 and 1999 and -0.528 from 2011-2016). Our current rules capture this protracted process as spanning from 1994-2016. 13 An alternative option would have been to use a rolling five-year average change on the EDI as for instance Coppedge (2017) has done. However, our strategy gives us a precise start or end point of more creeping processes.

12
a small decline of -0.019 in the V-Dem EDI; additional gradual declines in subsequent years and
steep annual declines from 2013 onwards (see Figure D1 in the Appendix).14 Changing the
threshold for the start of autocratization episodes to -0.02 would have moved the starting year to
2011. The qualitative case literature evidence that the gradual autocratization in Turkey started in
2005, or even earlier. Essen and Gumuscu (2016: 1590) claim that the Freedom and Justice Party
(AKP) started to use autocratic tactics such as intimating journalists immediately after its ascend
to power in 2002. Others suggest that the Turkish government mainly pursued a democratic
reform agenda in order to gain EU membership between 2002 to 2005 (Kubiek 2011). In 2005,
this emphasis gradually started to change when the EU turned its focus from verbal commitments
to the actual implementation of political reforms (Kubiek 2011: 918ff). Democratic reforms stalled
and political rights violations intensified, such as the police brutality against a peaceful march on
International Women’s Day and the controversial trail against the writer Orhan Pamuk.15 The
decline of democratic traits reflected in critical EU reports in 2008 and 2009 (Kubiek 2011: 919).
For many observers, the crack-down against civil society groups, media peaceful protesters in
relationship to Istanbul’s Gezi Park protests in 2013 was a clear indication that Turkey is on the
pathway to autocracy (Essen and Gumuscu 2016; Bashirow and Lancaster 2018). Admittedly, it is
difficult to precisely pin-point when autocratization started due to the gradual nature and opacity
of the processes. However, much points to 2005 as the year when the negative developments
started to supersede democratic process, lending support to our operationalization strategy based
on V-Dem data.
For some analyses, one obviously needs a clear-cut distinction between democracies and
autocracies. Following Lührmann et al. (2018), we define countries as democracies if they hold free
and fair and de-facto multiparty elections, and achieve at least a minimal level of institutional
guarantees captured by the EDI, with a theoretically driven operationalization.
IV. Diagnosing Autocratization from 1900 to 2016
Here we present the first ever comprehensive identification of the 202 autocratization episodes
taking place in 108 countries from 1900 to 2016 (Table A1 in the Appendix) leaving only 67 states
unaffected (Table A2 in the Appendix).16 Seven countries experienced autocratization solely due
14 Between 2004 and 2012 the EDI drops from 0.69 to 0.57 (-0.11 over eight years) and in 2016 it reaches the low-point of 0.34 (-0.16 over four years since 2012). 15 See Kubiek (2011: 918ff) and Human Rights Watch. 2006. https://www.hrw.org/world-report/2006/country-chapters/turkey. 16 This count includes only countries still in existence in 2016.

13
to foreign invasion during the two World Wars.17 Thus, 74 countries never autocratized in their
history without being subjugated by a foreign power but this count includes 27 countries classified
as autocracies in 2016 such as North Korea and Angola who seem to be caught in an “autocracy
trap” and due to the “floor effect” never had much possibility to become worse. The remaining
47 “non-autocratizers” are classified as democracies in 2016. This group consists mainly of
countries with a long democratic history, such as Sweden and Switzerland, or that democratized
recently, such as Bhutan and Namibia.
Roughly two-thirds the autocratization episodes (N=140, 69 percent) took place in already
authoritarian states. Noteworthy are the many (57) episodes of autocratization in Africa, most of
which occurred in electoral autocracies where autocratization dissipated initial democratic gains.
For instance, three autocratization episodes in Sudan (1958-1959; 1969; 1989-1990) followed
military coups disposing presidents elected in less-than perfect elections.
About a third of all autocratization episodes (N=62) episodes started under a democratic
dispensation. Almost all of the latter (N=53, 85 percent) led to the country turning into an
autocracy. Only nine of the autocratization episodes affecting democracies have been deflected to
preserve democracy. Yet, three of these nine episodes were ongoing in 2016 and the eventual
outcome is unknown: Moldova, Poland, and Brazil. This should give us great pause about specter
of the current third wave of autocratization. Very few episodes of autocratization starting in
democracies have ever been stopped before countries become autocracies.
The third wave of autocratization is real and endangers more democracies. Huntington famous identification of three democratization waves was accompanied by two
reverse waves, the first from 1922 to 1942 and a second from 1960 to 1975 decimating the number
of democracies (Huntington 1992). Our new measure of autocratization episodes picks up these
two reverse waves and clearly shows that a third wave of autocratization is now manifest (Figure
2).18 The thick black line represents the share of countries that were affected by autocratization
each year. The green and blue-dashed lines indicate how many of these were democracies and
autocracies, respectively when the episode began. There were 40 autocratization episodes starting
17 Albania, Romania, Belgium, Denmark, France, Netherlands and Norway. 18 Some scholars (see Doorenspleet 2000) posit that the three -wave metaphor is an artefact of newly independent countries appearing in the sample. In the V-Dem data colonies are include as separate observations, thus such concerns apply to a lesser extent than for other datasets. Nevertheless, following Doorenspleet’s suggestions we show that the three reverse waves are also manifest when basing the graphical analysis on the total number of observations and not on the share of countries (Figure AC.2; Appendix AC). Others distinguish between a third and fourth wave of democratization (Mc Faul 2002). However, the more common approach is the distinction in three waves of democratization, which we adhere to here.

14
before the end of World War II in the first wave; 99 episodes during the second reversed wave
between 1946 and 1990 at the end of the Cold War; and the remaining 64 episodes started in the
third wave. A breakdown of these episodes by region is found in Appendix B.
Figure 2. The Three Waves of Autocratization
One observation immediately stands out from Figure 2. Whereas the first reversed wave affected
both democracies and autocracies, and the second reversal period almost only autocracies, the
current period is characterized by democratic recession: Almost all autocratization episodes affect
democracies. This is the first time that systematic difference has been shown, and it presents a
source of concern especially given the finding reported above that few such episodes stop short
of decent into authoritarianism.
The present third wave of reversal may still be picking up. It is affecting 15 countries in
2016. Overall, post-communist Eastern European countries account for 16 mainly protracted,
autocratization episodes in the third wave, showing a similarity to the second wave where gains in
newly independent countries fading away – exemplified by the gradual autocratization processes
in Russia, Hungary, and Poland.
Yet, another way of diagnosing the current trend is to look at the share of countries that
are democracies, and how large a share of these that are affected by autocratization. That is what
is presented in Figure 4.
15
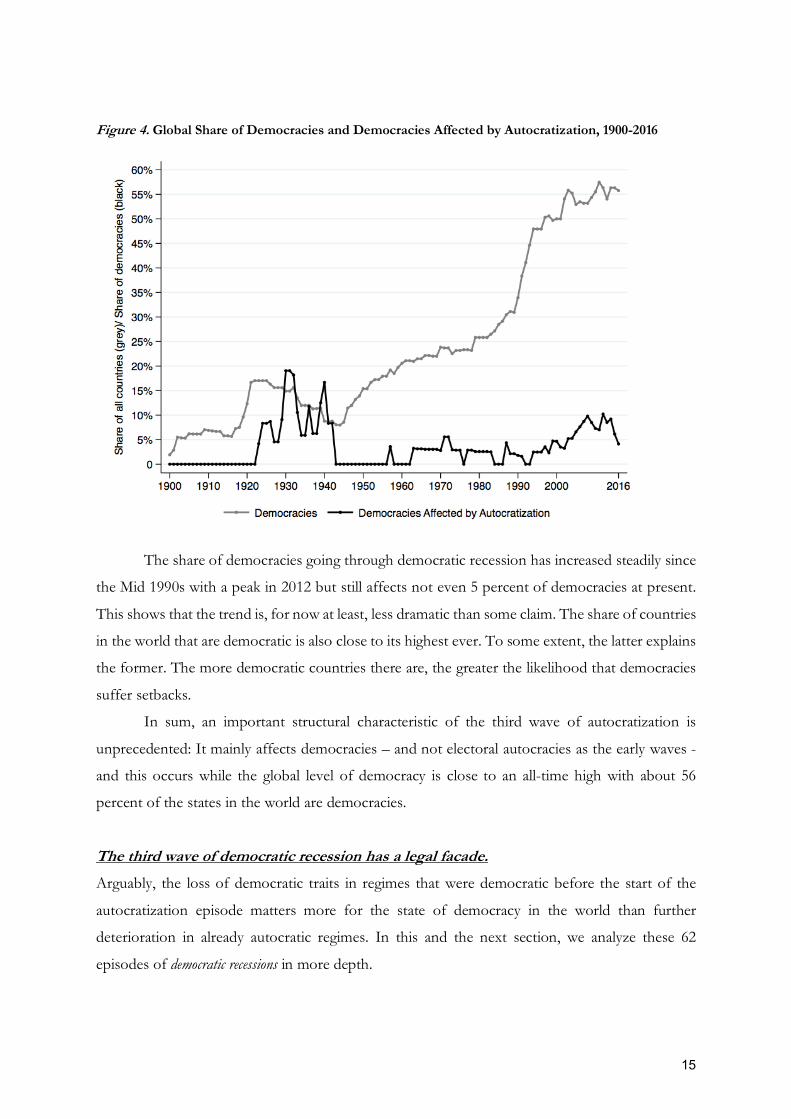
Figure 4. Global Share of Democracies and Democracies Affected by Autocratization, 1900-2016
The share of democracies going through democratic recession has increased steadily since
the Mid 1990s with a peak in 2012 but still affects not even 5 percent of democracies at present.
This shows that the trend is, for now at least, less dramatic than some claim. The share of countries
in the world that are democratic is also close to its highest ever. To some extent, the latter explains
the former. The more democratic countries there are, the greater the likelihood that democracies
suffer setbacks.
In sum, an important structural characteristic of the third wave of autocratization is
unprecedented: It mainly affects democracies – and not electoral autocracies as the early waves -
and this occurs while the global level of democracy is close to an all-time high with about 56
percent of the states in the world are democracies.
The third wave of democratic recession has a legal facade. Arguably, the loss of democratic traits in regimes that were democratic before the start of the
autocratization episode matters more for the state of democracy in the world than further
deterioration in already autocratic regimes. In this and the next section, we analyze these 62
episodes of democratic recessions in more depth.

16
The literature suggests that incumbents behind the current processes of autocratization are
using mostly legal means and that illegal power grabs have become less frequent. We test this
proposition by distinguishing between four different types of autocratization strategies based on
how explicitly they alter the power of the chief executive.19 The results are reported in Figure 5.
The analysis uses original data covering all autocratization episodes affecting democracies from
1900 to 2016, clustering around the three reversal waves.20
Figure 5. Access to and Extension of Chief Executive Power during Democratic Recessions
Note: 17 episodes are included in the first wave; 12 in the second wave and 33 in the third wave.
The first wave of reversals is almost completely dominated by the “classic” from of
autocratization tactics of illegal access to power (53 percent of episodes), such as a military coup or
foreign invasion, and by a major extension of the chief executive’s power (41 percent). The latter includes
“autogolpes” where the incumbent suddenly expands his power as for instance President Terra
19 The four mutually exhaustive and exclusive categories are: 0 “Illegal access to power”; 1 “Legal access to power and a major extension of the Chief Executive’s power beyond the temporal or substantial scope previously envisioned in the legal framework such as the establishment of a new constitution, the application or threat of force”; 2 “Legal access to power, and a minor formal extension of the Chief Executive’s power beyond the temporal or substantial scope previously envisioned in the legal framework, i.e. constitutional changes (such as extension of term limits or presidential powers) sanctioned by the constitutional court, the parliament or in a referendum; or a temporary application of emergency law at national level”; 3 “Legal access to power and no formal extension of the Chief Executive’s power beyond the temporal or substantial scope previously envisioned in the legal framework”. 20 The coding process proceeded in three steps: First, we used V-Dem data to identify whether or not the appointment of the Head of the Executive involved force (v2expathhs/v2expathhg; Coppedge et al. 2017b). Second, taking into account this information, a research assistant coded the four sub-categories based on standard references such as Nohlen (2010) and Lentz (1999) as well as case specific literature. Third, we verified the coding choices in particular with regards to borderline cases. Table A1 in the appendix shows the categorization of individual episodes. Detailed case narratives including sources are available on request.

17
did in Uruguay in 1933. Even Hitler came to power using legal means and then drastically expanded
his power with the “Ermächtigungsgesetz” (Enabling Act) in 1933.
In the second wave of autocratization the illegal access peaked with the many military coups
in Latin America and Europe, and this tactic accounted for two-thirds of all autocratization
episodes in this wave of reversals. Incumbent changing the accustomed legal order only in minor
ways – for instance through extending their term limits was used only twice in the first and second
waves. A completely new tactic also emerges in this second wave: Legal access to power without making
any major, formal changes to the office of the chief executive, but still infringing on democratic norms
and practices to pull the regime towards autocracy. It only happened once in the second reversal
wave (Dominican Republic; 1987-1990) but was then a significant precursor to what was to come.
The current period of autocratization is unique in that the new modal tactic is legal access
and no formal change of how much power the chief executive has or how long he is allowed to stay
in office. This type accounts for 41 percent in the third reversal wave with prominent cases of
such gradual deterioration in Hungary and Poland. Furthermore, several incumbents changed the
formal scope of their office only in minor ways (used in six episodes so far during the ongoing wave
of autocratization, for example in Russia and Turkey). Such incremental tactics are harder to detect,
and now together account for a majority, or 63 percent, of the episodes compared to only 17
percent in the second and 6 percent in the first reversal waves. Aspiring autocrats have clearly
found a new set of tools to stay in power, and that news has spread.
The third wave of democratic recessions is gradual In terms of pace, we can, again for the first time, show that 75 percent of all autocratization
episodes across the entire time period were relatively short, taking five years or less. Only 10
percent are highly protracted with a duration of eight years or more, with the record of 23 years in
Russia from 1994 to 2016.
We have developed another new metric to measure the rate of autocratization in a more
informative way than just the number of years: maximum annual depletion rate. This metric captures
how fast democratic traits decline during an autocratization episode in terms of changes from one
year to the other on the V-Dem EDI. Using the maximum allows us to distinguish between
episodes where a period of gradual declines combines with a sudden decline in democratic traits,
and stretches that consist of gradual declines only. The advantage of maximum depletion rate is
that a high value indicates that the episode encompassed a sudden and radical change where as a
low value indicates an autocratization process that was incremental throughout. For ease of
interpretation, we report maximum depletion rate values as a percentage of 1 (the highest possible

18
score on EDI). Thus, if the maximum change in the EDI from one year to the next during an
autocratization episode was -0.1, the corresponding autocratization rate is 10 percent.
For instance, the autocratization episode in Germany from 1923 to 1935 started with ten
years of gradual declines during the Weimar Republic - amounting to a 7% change on the EDI.
Yet, the main characteristic of this episode was Hitler’s accession to power in 1933 and subsequent
sudden breakdown of the democratic system in 1934. This is reflected by a high maximum
depletion rate of 27%. Conversely, chapters such as Turkey from 2005 to 2016 and Russia from
1994 to 2016, involve only gradual changes – reflected by relatively low depletion rates of 7%
(Turkey) and 9% (Russia). Alternative measures of pace such as the average depletion rate, the
annual depletion rate and the decay rate, do not fully capture the difference between these two
patterns. However, we include those as robustness tests to the subsequent empirical analysis (see
detailed discussion in Appendix C and E).
Figure D.2 in Appendix D shows a box plot comparing democratic recessions during the
three reversal waves using this new metric. The median autocratization rate was at 30 percent
during the first two waves and dropped to 10 percent in the third wave.21 At the bottom end of
the scale with a 3.4 percent maximum depletion rate we find with the extremely gradual
autocratization process in Sri Lanka from 1977 to 1983, followed by Hungary’s spell from 2006 to
2016 at 3.7 percent. The most sudden breakdowns occurred after the German invasion during
World War II in the Netherlands (47 percent) and the Czech Republic (46 percent).
21 It is important to note that the decline of the autocratization rate is not just a mere function of the shift to quasi-legal forms of autocratization reported in the prior section: Autocratization has become more gradual across all types of autocratization - even if the autocratizer comes to power illegally or majorly extents his power (see Figure D3 in Appendix D).
19
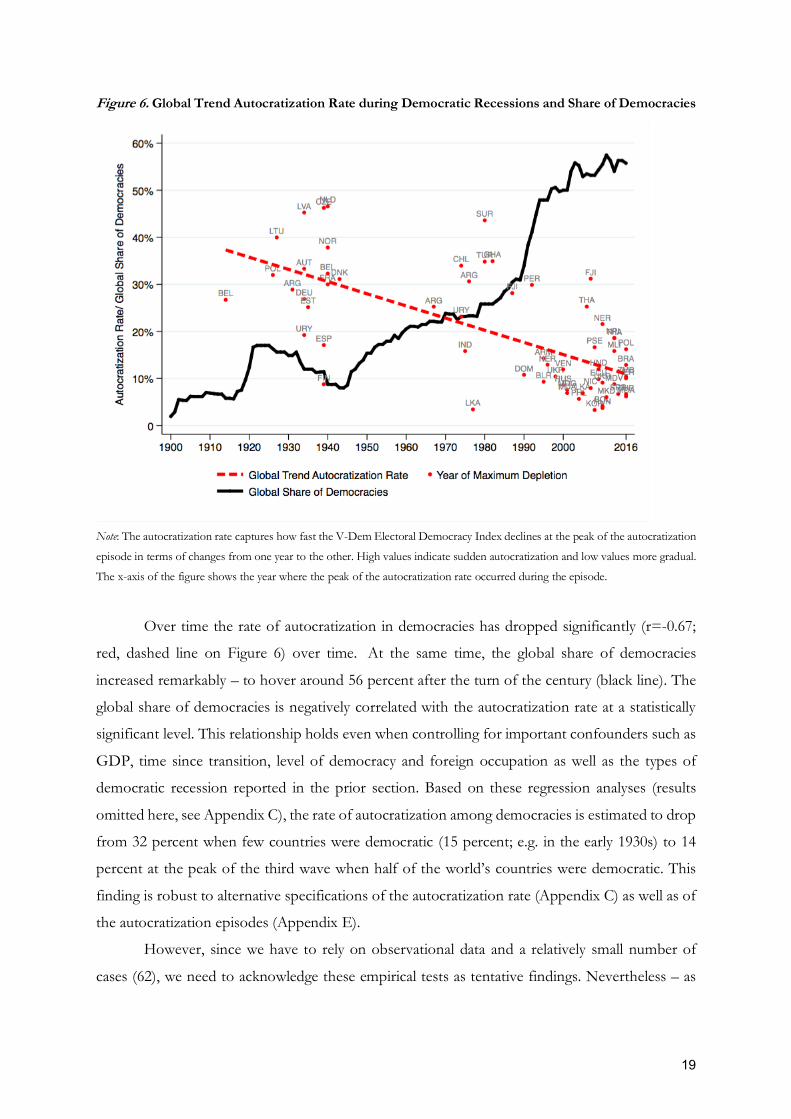
Figure 6. Global Trend Autocratization Rate during Democratic Recessions and Share of Democracies
Note: The autocratization rate captures how fast the V-Dem Electoral Democracy Index declines at the peak of the autocratization
episode in terms of changes from one year to the other. High values indicate sudden autocratization and low values more gradual.
The x-axis of the figure shows the year where the peak of the autocratization rate occurred during the episode.
Over time the rate of autocratization in democracies has dropped significantly (r=-0.67;
red, dashed line on Figure 6) over time. At the same time, the global share of democracies
increased remarkably – to hover around 56 percent after the turn of the century (black line). The
global share of democracies is negatively correlated with the autocratization rate at a statistically
significant level. This relationship holds even when controlling for important confounders such as
GDP, time since transition, level of democracy and foreign occupation as well as the types of
democratic recession reported in the prior section. Based on these regression analyses (results
omitted here, see Appendix C), the rate of autocratization among democracies is estimated to drop
from 32 percent when few countries were democratic (15 percent; e.g. in the early 1930s) to 14
percent at the peak of the third wave when half of the world’s countries were democratic. This
finding is robust to alternative specifications of the autocratization rate (Appendix C) as well as of
the autocratization episodes (Appendix E).
However, since we have to rely on observational data and a relatively small number of
cases (62), we need to acknowledge these empirical tests as tentative findings. Nevertheless – as
20
discussed in the literature review - there are reasonable intuitions for why a global rise of
democracy should be expected to have a dampening effect on the rate of autocratization.
This development results opposite expectations for the further prospects of democracy. On
the one hand, autocratization has become more obscure and therefore one can suspect less likely
to produce triggers for mobilization of pro-democratic forces. On the other hand, autocratization
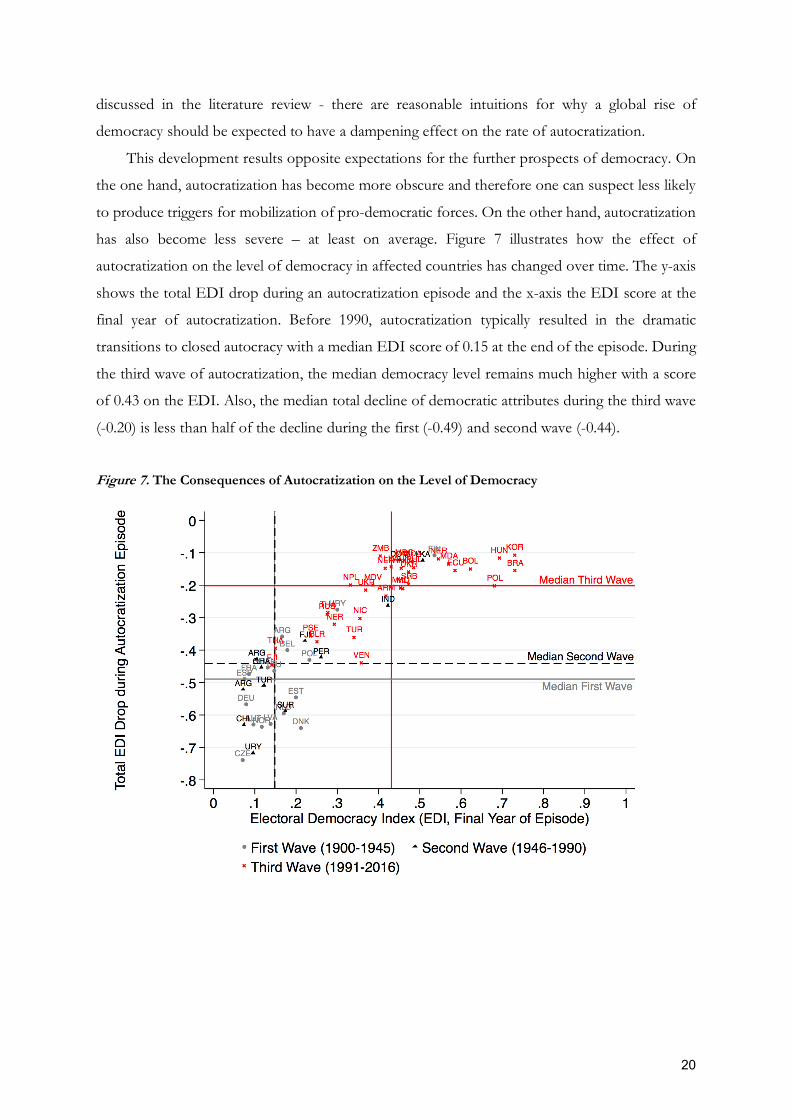
has also become less severe – at least on average. Figure 7 illustrates how the effect of
autocratization on the level of democracy in affected countries has changed over time. The y-axis
shows the total EDI drop during an autocratization episode and the x-axis the EDI score at the
final year of autocratization. Before 1990, autocratization typically resulted in the dramatic
transitions to closed autocracy with a median EDI score of 0.15 at the end of the episode. During
the third wave of autocratization, the median democracy level remains much higher with a score
of 0.43 on the EDI. Also, the median total decline of democratic attributes during the third wave
(-0.20) is less than half of the decline during the first (-0.49) and second wave (-0.44).
Figure 7. The Consequences of Autocratization on the Level of Democracy

21
Conclusion: The Third Wave of Autocratization
This paper presents the first systematic empirical analysis of contemporary autocratization in
historical perspective. The paper, first, contributes with a new method to identify not only sudden
but also gradual autocratization episodes, providing a comprehensive empirical overview of
adverse regime change from 1900 to today across the democracy-autocracy spectrum.
Second, we provide evidence that contemporary declines of democracy amount to a third
wave of autocratization. A key finding is that the present reverse wave – starting after 1990 - mainly
affects democracies, unlike prior waves. What is especially worrying about this trend is that
historically, very few autocratization episodes starting in democracies has been stopped short of
turning countries into autocracies.
Furthermore, we present a series of descriptive tests corroborating key claims found in the
extent literature but not tested before on systematic evidence: Contemporary autocratizers mainly
use legal and gradual strategies to undermine democracies. Based on original data, we show that
about 72 percent of all contemporary democratic recessions – autocratization episodes starting in
democracies – are led by incumbents who came to power legally and typically by democratic
elections. Conversely, during the first and second reverse wave most democratic recessions
included an illegal power grab, such as a military coup. Whereas autocratizers during the first and
second wave took clearly recognizable moves such as issuing a new non-democratic constitution
or dissolved the legislature, 40 percent of contemporary autocratizers do not change the formal
rules. Thus, also the way incumbents undermine democracy has become more informal and
clandestine.
Finally, we devise a new metric – the autocratization rate – capturing how fast regimes lose
their democratic quality from one year to the other measured as a percentage change of the highest
possible value of V-Dem’s EDI. We can then show that autocratization has become much more
gradual than before. Its maximum rate declined from a median of about 30 percent in the first
wave to about 10 percent in the third wave. This trend is strongly correlated with the changes in
the global share of democratic regimes. As democracy spread around the global in the 1990s and
2000s, autocratization became more gradual. While this trend stands up to regression analysis with
the inclusion of confounders, we are careful not to draw too strong inferences from that empirical
test, since we are relying on observational data and a relatively small number of cases.
By now, most regimes – even autocracies - hold some form of multiparty elections. Sudden
and illegal moves to autocracy tend to provoke national and international opposition. The tests we
present suggest that contemporary autocratizers have learned their lesson and thus now proceed

22
in a much slower and much less noticeable way than their historical predecessors. Thus, while
democracy has undoubtedly come under threat, its normative power still seems to force aspiring
autocrats to play a game of deception.
Consequently, states hit by the third wave of autocratization remain much more democratic
than their historical cousins. On the one hand, this gives hope that the current wave of
autocratization might be milder than the first and second waves. On the other hand, the third wave
may still be picking up. It has affected 15 countries in 2016 and more are on the threshold. For
these countries, two scenarios are plausible: Because autocratization is more gradual, democratic
actors may remain strong enough to mobilize resistance. This happened for instance in South
Korea in 2017, when mass protests forced parliament to impeach the president, which stopped
the ongoing autocratization episode (Shin and Moon 2017: 130). Conversely, initial small steps
towards autocracy brought other countries – such as Turkey, Nicaragua, Venezuela and Russia –
on a slippery slope deep into the authoritarian regime spectrum. Future research needs to
investigate what distinguishes these two scenarios and how autocratization can be stopped and
reversed. Yet, one conclusion is clear: As it was premature to announce the “end of history” in
1992, it is premature to proclaim the “end of democracy” now.

23
References
Altman D. and A. Pérez-Liñán. 2017. Explaining the Erosion of Democracy: Can Economic
Growth Hinder Democracy?. V-Dem Working Paper 42. V-Dem Institute.
Bashirow G. and C. Lancaster. 2018. End of moderation: the radicalization of AKP in Turkey,
Democratization, 25:7, 1210-1230.
Bermeo, N. 2016. On Democratic Backsliding. J of Democracy, 27(1): 5-19.
Bermeo, N. 2003. Ordinary People in Extraordinary Times – The Citizenry and the Breakdown of Democracy.
Princeton University Press.
Bernhard, M., T. Nordstrom, and C. Reenock. 2001. Economic Performance, Institutional
Intermediation, and Democratic Survival. J of Politics 63(3): 775-803.
Bunce, V. and S.Wolchik. 2010. Defeating Dictators. Electoral Change and Stability in Competitive
Authoritarian Regimes. World Politics 62(1), 43-86.
Carothers, T. and S. Brechenmacher. 2014. Closing Space. Democracy and Human Rights Support
under Fire. Carnegie Endowment for International Peace.
Cassani, A. and L. Tomini. 2018. Reversing regimes and concepts: from democratization to
autocratization. European Political Science. Online First.
Cheibub, J.. 2014. Constitutional Foundations of Democratic Consolidation. APSA-CD, 12(2): 1-
8.
Collier, D. and R. Adcock. 1999. Democracy and dichotomies: A pragmatic approach to choices
about concepts. Annual Review of Political Science, 2(1), 537–565.
Coppedge, M. 2017. Eroding Regimes: What, Where, and When?. V-Dem Working Paper 57. V-
Dem Institute.
Coppedge, M., J. Gerring, S. I. Lindberg, S.-E. Skaaning, J. Teorell, D. Altman, M. Bernhard, M.
S. Fish, A. Glynn, A. Hicken, C. H. Knutsen, J. Krusell, A. Luhrmann, K. L. Marquardt, K.
McMann, V. Mechkova, M. Olin, P. Paxton, D. Pemstein, J. Pernes, C. S. Petrarca, J. von
Römer, L. Saxer, B. Seim, R. Sigman, J. Staton, N. Stepanova and S. Wilson. 2017a. "V-Dem
Dataset v7."
Coppedge, M., J. Gerring, S. I. Lindberg, S.-E. Skaaning, J. Teorell, D. Altman, M. Bernhard, S.
Fish, A. Glynn, A. Hicken, C.-H. Knutsen, A. Lührmann, K. L. Marquardt, K. McMann, V.
Mechkova, P. Paxton, D. Pemstein, L. Saxer, B. Seim, R. Sigman and a. J. Staton. 2017b. V-
Dem Codebook v7.
Coppedge, M., J. Gerring, S. I. Lindberg, S.-E. Skaaning, J. Teorell, J. Krusell, K. L. Marquardt, V.
Mechkova, D. Pemstein, J. Pernes, L. Saxer, N. Stepanova, E. Tzelgov, Y.-t. Wang and S.

24
Wilson. 2017c. V-Dem Methodology v7.
Cornell, A., J. Moller and S. Skaaning. 2017. “The Real Lessons of the Interwar Years”. J of
Democracy 28(3): 14-28
Dahl, R. 1971. Polyarchy: Participation and opposition. Yale University Press.
Dahl, R. 1998. On Democracy. New Haven, CT: Yale University Press.
Diamond, L. 2018. The Liberal Democratic Order in Crisis. The American Interest.
https://www.the-american-interest.com/2018/02/16/liberal-democratic-order-crisis/
Diamond, L. 2015. Facing up to the Democratic Recession. J of Democracy 26 (1): 141-155
Diamond, L. 2008. The democratic rollback. Foreign Affairs 87 (2), 36–48.
Doorenspleet, R. 2000. Reassessing the Three Waves of Democratization. World Politics, 52 (3),
384-406
Erdmann, G. 2011. Decline of Democracy. Comparative Governance and Politics 1: 21-58
Esen, B. and S. Gumuscu. 2016. Rising competitive authoritarianism in Turkey, Third Worl
Quarterly, 37:9, 1581-1606.
Fukuyama, F. 1992. The End of History and the Last Man. Free Press.
Gandhi, J. 2008. Political Institutions under Dictatorship. New York: Cambridge University Press.
Geddes, B. 1999. What Do We know About Democratization after Twenty Years?. ARPS 2: 115-
44.
Haggard, S. and R. Kaufmann 2016. Dictators and Democrats. Masses, Elites and Regime Change.
Princeton University Press.
Hall, S. and T. Ambrosio. 2017. Authoritarian learning: a conceptual overview. East European Politics
33(2): 143-161.
Hyde, S. 2011. The pseudo-democrat's dilemma. Why election observation became an international norm. Ithaca:
Cornell University Press.
Huntington, S. 1992. The Third Wave. Oklahoma: Norman.
Kadera, K., M. Crescenzi, and M. Shannon. 2003. Democratic Survival, Peace, and War in the
International System. American Journal of Political Science 47 (2).
Kurlantzick, J. 2013. Democracy in Retreat. Yale Univ. Press.
Nam K., A. Kroeger. 2017. Rewarding the introduction of multiparty elections. European Journal of
Political Economy. 49: 164-181.
Levitsky, S. & L. Way. 2015. The Myth of Democratic Recession. J of Democracy 26(1): 45–58.
Levitsky S. and Ziblatt, D. How Democracies Die. Penguin Random House.
Lindberg, S. 2009 (ed.). Democratization by Elections. Johns Hopkins University Press.
Lindberg, S. 2006. Democracy and Elections in Africa. Baltimore, MD: Johns Hopkins University Press.

25
Linz, J. 1978. The Breakdown of Democratic Regimes. Johns Hopkins University Press.
Lueders, H. and E. Lust, "Multiple Measurements, Elusive Agreement, and Unstable Outcomes
in the Study of Regime Change," Journal of Politics 80 (2): 736-741.
Lührmann, A., M. Tanneberg and S Lindberg. 2018. Regimes of the World (RoW): Opening New
Avenues for the Comparative Study of Political Regimes. Politics and Governance 6(1), 60-77.
Lührmann, A., V. Mechkova, S. Dahlum, L.Maxwell, M. Olin, C. Petrarca, R. Sigman, M.Wilson
and S. Lindberg. 2018. State of the world 2017: autocratization and exclusion?, Democratization.
Mainwaring, S. and A. Perez-Liñan. 2013. Democracies and Dictatorships in Latin America: Emergence,
Survival, and Fall. Cambridge University Press.
Marquardt, K., and D. Pemstein. 2017. IRT models for expert-coded panel data. V-Dem Working
Paper No. 41.
McFaul, M. 2002. The Fourth Wave of Democracy and Dictatorship. World Politics 54 (January
2002): 212-244
Mechkova, V, A. Lührmann and S. Lindberg. 2017. How much backsliding? Journal of Democracy
28(4): 162-169.
Merkel, W. 2010. Are Dictatorships Returning? Revisiting the ‘Democratic Rollback’ Hypothesis.
Contemporary Politics 16 (1): 17-31.
Norris, P. 2017. Is Western Democracy Backsliding? Diagnosing the Risks Journal of Democracy
(online exchange)
Norris, P. 2013. Does the world agree about standards of electoral integrity? Evidence for the
diffusion of global norms. Electoral Studies 32 (4): 576–588.
Mounk, Y. 2018. The people vs. democracy. Harvard University Press.
Pemstein, D., K. Marquardt, E. Tzelgov, Y. Wang, J. Krusell and F. Miri. 2017. “The V-Dem
Measurement Model: Latent Variable Analysis for Cross-National and Cross-Temporal Expert-
Coded Data”. University of Gothenburg, Varieties of Democracy Institute: Working Paper No.
21, 2nd edition.
Powell, J. and C. Thyne. 2011. Global Instances of Coups from 1950-Present. Journal of Peace
Research 48(2): 249-259.
Przeworski, A. et al., 2000. Democracy and Development. Cambridge University Press.
Sartori, G. 1970. Concept misformation in comparative politics. American Political Science Review,
64(4), 1033–1053.
Schedler, A. 2013. The politics of uncertainty: Sustaining and subverting electoral authoritarianism.
OUP Oxford.
Shin, G. and R. Moon. 2017. South Korea After Impeachment. Journal of Democracy 28 (4), 117-131.

26
Snyder, T. 2017. On Tyranny. Tim Dugan Books.
Svolik, M. 2015. Which democracies will last? Coups, incumbent takeovers and the dynamic of
democratic consolidation. BJPS 45(4): 715-738.
Svolik, M. 2012. The Politics of Authoritarian Rule. Cambridge: Cambridge University Press.
Svolik, M. 2008. Authoritarian Reversals & Democratic Consolidation. APSR, 102:153-68.
Runciman, D. 2018. How Democracy Ends. Profile Books.
Teorell, J. 2010. Determinants of Democratization. Explaining Regime Change in the World, 1972–2006.
Cambridge University Press
Teorell, J., M. Coppedge, S. Skaaning and S. Lindberg. 2018. "Measuring Polyarchy Across the
Globe, 1900-2017." Studies in Comparative International Development.
Tilly, C. 2003. Inequality, Democratization, and De-Democratization. Sociological Theory, 21(1): 37-
43.
Thompson, M. and P. Kuntz. 2009. More than the Final Straw: Stolen Elections as Revolutionary
Triggers. Comparative Politics 41: 253–272.
Tomini, L. and C. Wagemann. 2017. Varieties of contemporary democratic breakdown and
regression: A comparative analysis. EJPR.
Ulfelder, J and M. Lustik. 2007. Modeling Transitions to and From Democracy. Democratization
14(3): 351-38
Waldner, D. and E. Lust. 2018. Unwelcome Change: Coming to Terms with Democratic
Backsliding. Annu. Rev. Polit. Sci. 21(5): 5.1-5.21

27
APPENDICES:
A Third Wave of Autocratization Is Here: What Is New About It? Appendix A. Tables of autocratization episodes and countries without autocratization experience
Appendix B. Regional breakdown of autocratization episodes
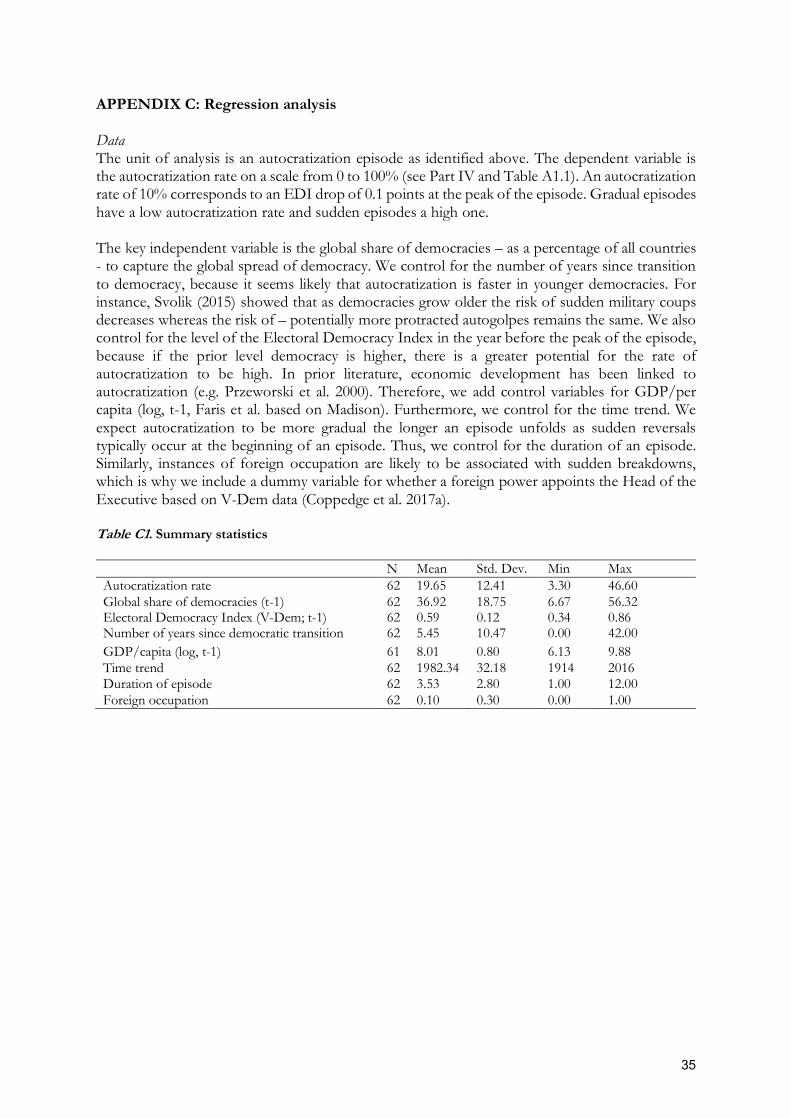
Appendix C. Regression analysis
Appendix D. Additional Figures
Appendix E. Robustness Tests with Alternative Episode Specifications

28
APPENDIX A: Autocratization Episodes
Table A.1 Autocratization Episodes Starting in Democracies Country Begin End EDI
before EDI end
Rate Access to and Extension of Chief Executive Power
FIRST WAVE Argentina 1930 1931 0.52 0.17 28.89 Legal Access/Major Extension Austria 1930 1935 0.73 0.10 33.33 Legal Access/Major Extension Belgium 1914 1915 0.58 0.18 26.73 Illegal Access to Power Belgium 1940 1941 0.59 0.13 32.28 Illegal Access to Power Czech Republic 1930 1940 0.81 0.07 46.28 Illegal Access to Power Denmark 1940 1944 0.85 0.21 31.14 Illegal Access to Power Estonia 1929 1936 0.75 0.20 25.18 Legal Access/Major Extension Finland 1939 1940 0.64 0.54 8.77 Legal Access/Minor Extension France 1939 1941 0.56 0.09 30.00 Legal Access/Major Extension Germany 1923 1934 0.65 0.08 26.92 Legal Access/Major Extension Latvia 1934 1935 0.77 0.14 45.30 Legal Access/Major Extension Lithuania 1924 1927 0.61 0.15 39.99 Illegal Access to Power Netherlands 1940 1941 0.76 0.17 46.60 Illegal Access to Power Norway 1940 1942 0.75 0.12 37.84 Illegal Access to Power Poland 1926 1931 0.66 0.23 32.00 Illegal Access to Power Spain 1936 1940 0.56 0.07 17.11 Illegal Access to Power Uruguay 1933 1934 0.58 0.30 19.24 Legal Access/Major Extension SECOND WAVE Argentina 1966 1967 0.53 0.11 25.28 Illegal Access to Power Argentina 1975 1977 0.59 0.07 30.65 Illegal Access to Power Chile 1973 1974 0.71 0.07 33.98 Illegal Access to Power Dom. Rep. 1987 1990 0.57 0.45 10.78 Legal Access/No Formal Extension Fiji 1987 1988 0.59 0.22 28.16 Illegal Access to Power Ghana 1981 1982 0.57 0.12 34.94 Illegal Access to Power India 1971 1976 0.69 0.42 15.83 Legal Access/Minor Extension Peru 1990 1995 0.68 0.26 29.90 Legal Access/Major Extension Sri Lanka 1977 1983 0.63 0.51 3.42 Legal Access/Major Extension Suriname 1980 1981 0.76 0.17 43.62 Illegal Access to Power Turkey 1980 1981 0.63 0.12 34.83 Illegal Access to Power Uruguay 1963 1976 0.81 0.10 23.15 Illegal Access to Power THIRD WAVE Armenia 1994 1997 0.65 0.42 14.27 Legal Access/Minor Extension Belarus 1995 2001 0.63 0.25 9.31 Legal Access/Minor Extension Bolivia 2006 2014 0.77 0.62 4.13 Legal Access/Major Extension Brazil 2012 2016 0.89 0.73 12.88 Legal Access/No Formal Extension Ecuador 2008 2009 0.74 0.59 9.86 Legal Access/Major Extension Fiji 2006 2009 0.59 0.14 31.21 Illegal Access to Power Honduras 2005 2010 0.61 0.46 11.98 Illegal Access to Power Hungary 2006 2015 0.81 0.69 3.73 Legal Access/No Formal Extension Macedonia 2005 2013 0.66 0.45 6.04 Legal Access/No Formal Extension Madagascar 1996 2001 0.59 0.46 7.60 Legal Access/No Formal Extension Maldives 2012 2016 0.59 0.39 8.76 Legal Access/No Formal Extension Mali 2012 2013 0.67 0.46 15.84 Illegal Access to Power Moldova 2001 2005 0.61 0.48 6.90 Legal Access/No Formal Extension Moldova 2012 2016 0.71 0.57 6.19 Legal Access/No Formal Extension Nepal 2012 2013 0.53 0.33 18.63 Illegal Access to Power Nicaragua 2003 2016 0.66 0.36 7.96 Legal Access/Minor Extension Country Begin End EDI
before EDI end
Rate Access to and Extension of Chief Executive Power
Niger 1996 1997 0.57 0.42 12.93 Illegal Access to Power Niger 2005 2010 0.62 0.29 21.57 Illegal Access to Power

29
Niger 2013 2016 0.67 0.55 10.02 Legal Access/No Formal Extension Palestine 2005 2008 0.59 0.24 16.65 Legal Access/Major Extension Philippines 1999 2007 0.63 0.49 5.66 Illegal Access to Power Poland 2013 2016 0.89 0.68 16.23 Legal Access/No Formal Extension Russia 1994 2016 0.57 0.28 8.60 Legal Access/Minor Extension Serbia 2009 2016 0.67 0.47 6.71 Legal Access/No Formal Extension South Korea 2007 2014 0.84 0.73 3.30 Legal Access/No Formal Extension Sri Lanka 2004 2008 0.57 0.43 6.87 Legal Access/No Formal Extension Thailand 2003 2006 0.56 0.28 25.29 Illegal Access to Power Thailand 2013 2015 0.55 0.15 18.57 Illegal Access to Power Turkey 2005 2016 0.70 0.34 6.62 Legal Access/Minor Extension Ukraine 1997 2004 0.59 0.37 10.43 Legal Access/No Formal Extension Ukraine 2010 2012 0.63 0.47 9.11 Legal Access/No Formal Extension Venezuela 1999 2016 0.80 0.36 11.92 Legal Access/Major Extension Zambia 2014 2016 0.52 0.41 10.39 Legal Access/No Formal Extension
Note: The Electoral Democracy Index (EDI) ranges from 0 (not democratic) to 1 (fully democratic). The autocratization rate captures the maximum EDI depletion during an autocratization episode as a percentage of its highest value (1). High values indicate a sudden autocratization episode and low values a gradual one.

30
Table A.1.2 Autocratization Episodes Starting in Autocracies Country Begin End EDI before EDI end FIRST WAVE Albania 1938 1940 0.21 0.05 Argentina 1943 1944 0.31 0.10 Bolivia 1932 1935 0.19 0.08 Brazil 1930 1931 0.23 0.10 Bulgaria 1934 1935 0.21 0.10 Chile 1925 1926 0.30 0.18 Costa Rica 1917 1918 0.34 0.21 Cuba 1906 1907 0.32 0.20 Cuba 1929 1934 0.31 0.19 Dom. Rep. 1916 1917 0.28 0.13 Dom. Rep. 1930 1931 0.29 0.13 Ecuador 1936 1936 0.26 0.16 Greece 1935 1937 0.39 0.05 Honduras 1905 1906 0.19 0.09 Hungary 1919 1919 0.26 0.13 Hungary 1940 1945 0.35 0.18 Italy 1921 1929 0.38 0.06 Myanmar 1942 1943 0.24 0.11 Philippines 1938 1943 0.27 0.08 Portugal 1925 1927 0.26 0.05 Romania 1938 1940 0.22 0.12 Spain 1923 1924 0.24 0.07 SECOND WAVE Afghanistan 1974 1978 0.19 0.09 Algeria 1966 1966 0.20 0.09 Argentina 1950 1956 0.42 0.16 Bangladesh 1974 1976 0.45 0.14 Country Begin End EDI before EDI end Bangladesh 1982 1983 0.43 0.20 Benin 1965 1966 0.34 0.18 Benin 1970 1973 0.28 0.10 Bolivia 1958 1965 0.30 0.14 Bolivia 1980 1981 0.25 0.11 Brazil 1962 1965 0.44 0.15 Burkina Faso 1966 1967 0.43 0.19 Burundi 1965 1967 0.22 0.10 Burundi 1988 1988 0.22 0.10 CAR 1962 1966 0.27 0.09 Cambodia 1970 1971 0.30 0.14 Cambodia 1973 1980 0.24 0.08 Chad 1972 1976 0.21 0.09 China 1949 1950 0.20 0.08 Colombia 1948 1950 0.28 0.16 Comoros 1975 1975 0.26 0.13 Congo 1962 1968 0.34 0.09 Cuba 1952 1953 0.44 0.19 Cuba 1959 1961 0.27 0.09 Czech Republic 1950 1950 0.20 0.08 DRC 1965 1970 0.31 0.09 Dom. Rep. 1964 1964 0.44 0.17 Ecuador 1963 1964 0.39 0.14 Ecuador 1970 1973 0.38 0.15 Egypt 1952 1954 0.27 0.06 Equatorial Guinea 1969 1973 0.25 0.04 Ghana 1961 1967 0.38 0.16 Ghana 1972 1973 0.38 0.12

31
Greece 1966 1968 0.44 0.08 Guatemala 1954 1956 0.40 0.10 Guyana 1967 1981 0.47 0.26 Honduras 1955 1955 0.28 0.15 Honduras 1972 1973 0.30 0.15 Hungary 1947 1950 0.28 0.13 Indonesia 1957 1961 0.61 0.16 Iraq 1958 1963 0.23 0.08 Kuwait 1976 1977 0.28 0.09 Kuwait 1986 1987 0.27 0.08 Laos 1959 1965 0.33 0.18 Laos 1975 1976 0.24 0.07 Lesotho 1969 1969 0.37 0.19 Liberia 1980 1981 0.24 0.10 Libya 1969 1970 0.22 0.08 Madagascar 1973 1973 0.26 0.15 Malawi 1965 1965 0.29 0.09 Malaysia 1964 1970 0.33 0.15 Mali 1964 1969 0.26 0.11 Mauritania 1979 1979 0.20 0.10 Myanmar 1962 1963 0.46 0.08 Nepal 1960 1961 0.26 0.11 Niger 1974 1975 0.21 0.10 Nigeria 1983 1984 0.41 0.20 Pakistan 1978 1979 0.29 0.11 Panama 1946 1947 0.32 0.18 Panama 1964 1969 0.41 0.09 Country Begin End EDI before EDI end Peru 1948 1949 0.33 0.10 Peru 1968 1969 0.44 0.10 Philippines 1969 1973 0.43 0.08 Vietnam 1964 1965 0.32 0.16 Rwanda 1973 1974 0.27 0.10 Seychelles 1977 1978 0.35 0.10 Sierra Leone 1967 1968 0.42 0.19 Somalia 1969 1970 0.37 0.08 South Korea 1961 1962 0.32 0.16 South Korea 1972 1972 0.31 0.14 Sudan 1958 1959 0.29 0.09 Sudan 1969 1969 0.25 0.10 Sudan 1989 1990 0.39 0.09 Swaziland 1973 1974 0.21 0.10 Syria 1949 1951 0.34 0.15 Syria 1958 1959 0.33 0.09 Syria 1963 1970 0.28 0.08 Tanzania 1965 1967 0.33 0.22 Thailand 1976 1977 0.29 0.12 Togo 1961 1962 0.29 0.19 Togo 1964 1968 0.27 0.09 Turkey 1954 1960 0.45 0.24 Uganda 1964 1972 0.42 0.09 Uganda 1985 1986 0.25 0.13 Venezuela 1949 1949 0.46 0.11 Zambia 1968 1974 0.32 0.21 Zanzibar 1964 1965 0.20 0.02 THIRD WAVE Algeria 1992 1993 0.41 0.18 Azerbaijan 1993 1995 0.40 0.26 Bangladesh 2007 2007 0.54 0.23 Bangladesh 2014 2016 0.50 0.37

32
Burundi 1994 1996 0.41 0.20 Burundi 2006 2016 0.46 0.19 CAR 2003 2004 0.35 0.21 Comoros 1999 2000 0.49 0.23 Congo 1993 1998 0.48 0.18 Croatia 2016 2016 0.82 0.71 Egypt 2013 2015 0.37 0.18 Fiji 2000 2000 0.61 0.33 Gambia 1993 1995 0.50 0.12 Guinea-Bissau 2003 2003 0.47 0.28 Guinea-Bissau 2012 2013 0.50 0.24 Haiti 1992 1992 0.38 0.21 Haiti 2000 2005 0.44 0.24 Lesotho 1995 1995 0.62 0.31 Lesotho 1999 1999 0.58 0.32 Liberia 2004 2004 0.39 0.25 Libya 2014 2014 0.53 0.29 Macedonia 1999 1999 0.62 0.50 Madagascar 2009 2010 0.50 0.23 Nepal 1999 2003 0.42 0.22 Pakistan 1999 2000 0.44 0.22 Rwanda 1994 1995 0.31 0.11 Country Begin End EDI before EDI end Sierra Leone 1998 1998 0.46 0.24 Tajikistan 1992 1994 0.36 0.18 Thailand 1991 1991 0.39 0.24 Thailand 1993 1993 0.38 0.24 Ukraine 2014 2015 0.50 0.35 Yemen 2013 2016 0.40 0.13

33
Table A.2 Countries never Experiencing an Autocratization Episode DEMOCRACIES IN 2016 AUTOCRACIES IN 2016 Country EDI 2016 Country EDI 2016 Australia 0.88 Angola 0.32 Barbados 0.71 Bosnia and Herzegovina 0.34 Bhutan 0.54 Cameroon 0.36 Botswana 0.68 Djibouti 0.28 Canada 0.87 Eritrea 0.08 Cape Verde 0.84 Ethiopia 0.25 Cyprus 0.81 Gabon 0.43 El Salvador 0.66 Guinea 0.44 Georgia 0.76 Iran 0.23 Iceland 0.84 Jordan 0.27 Ireland 0.84 Kazakhstan 0.26 Israel 0.73 Montenegro 0.46 Ivory Coast 0.58 Morocco 0.31 Jamaica 0.82 Mozambique 0.48 Japan 0.78 North Korea 0.09 Kenya 0.53 Oman 0.19 Kosovo 0.51 Palestine/Gaza 0.14 Kyrgyzstan 0.51 Papua New Guinea 0.49 Lebanon 0.54 Qatar 0.09 Mauritius 0.79 Saudi Arabia 0.02 Mexico 0.67 Singapore 0.45 Mongolia 0.68 Somaliland 0.47 Namibia 0.75 South Sudan 0.18 New Zealand 0.86 Turkmenistan 0.15 Paraguay 0.62 Uzbekistan 0.20 Senegal 0.72 Vietnam 0.25 Slovakia 0.80 Zimbabwe 0.32 Slovenia 0.86 Solomon Islands 0.63 South Africa 0.73 Sweden 0.90 Switzerland 0.88 São Tomé and Príncipe 0.70 Taiwan 0.80 Timor-Leste 0.68 Trinidad and Tobago 0.73 Tunisia 0.75 United Kingdom 0.87 United States 0.85 Vanuatu 0.68

34
APPENDIX B. Regional Breakdown of Autocratization Episodes
Figure B.1 shows the proportion of countries affected by each wave by region. The first wave of autocratization diminished much - but not all - of the advances from the first wave of democratization in Europe, Central Asia and Latin America. In Asia-Pacific, Africa, and the MENA region there was not much of democratic progress to reverse at that point. The first wave of reversals also affected democratic and autocratic countries to almost the same degree. Figure B.1 Regional Distribution of Autocratization Episodes
The 1960s’ and 70s’ second wave of autocratization mainly affected countries in Africa
and Asia-Pacific that were electoral autocracies. The few democracies that were swept away during the second wave were mainly Latin American countries suffering from military coups, such as Argentina (1966, 1976) and Chile (1973), but also India in 1975. In India, Prime Minister Indria Gandhi’s autogolpe commenced a two-year interruption of the democratic regime due to extensive use of emergency powers including the suspension of elections. Western Europe and North America (apart from the military coup in Greece in 1967) as well as Eastern Europe and Central Asia were less affected by the second wave. Western countries remained democracies whereas the Eastern Europe and much of Central Asia remained subdued to the Soviet empire.
35
APPENDIX C: Regression analysis Data The unit of analysis is an autocratization episode as identified above. The dependent variable is the autocratization rate on a scale from 0 to 100% (see Part IV and Table A1.1). An autocratization rate of 10% corresponds to an EDI drop of 0.1 points at the peak of the episode. Gradual episodes have a low autocratization rate and sudden episodes a high one. The key independent variable is the global share of democracies – as a percentage of all countries - to capture the global spread of democracy. We control for the number of years since transition to democracy, because it seems likely that autocratization is faster in younger democracies. For instance, Svolik (2015) showed that as democracies grow older the risk of sudden military coups decreases whereas the risk of – potentially more protracted autogolpes remains the same. We also control for the level of the Electoral Democracy Index in the year before the peak of the episode, because if the prior level democracy is higher, there is a greater potential for the rate of autocratization to be high. In prior literature, economic development has been linked to autocratization (e.g. Przeworski et al. 2000). Therefore, we add control variables for GDP/per capita (log, t-1, Faris et al. based on Madison). Furthermore, we control for the time trend. We expect autocratization to be more gradual the longer an episode unfolds as sudden reversals typically occur at the beginning of an episode. Thus, we control for the duration of an episode. Similarly, instances of foreign occupation are likely to be associated with sudden breakdowns, which is why we include a dummy variable for whether a foreign power appoints the Head of the Executive based on V-Dem data (Coppedge et al. 2017a). Table C1. Summary statistics N Mean Std. Dev. Min Max Autocratization rate 62 19.65 12.41 3.30 46.60 Global share of democracies (t-1) 62 36.92 18.75 6.67 56.32 Electoral Democracy Index (V-Dem; t-1) 62 0.59 0.12 0.34 0.86 Number of years since democratic transition 62 5.45 10.47 0.00 42.00 GDP/capita (log, t-1) 61 8.01 0.80 6.13 9.88 Time trend 62 1982.34 32.18 1914 2016 Duration of episode 62 3.53 2.80 1.00 12.00 Foreign occupation 62 0.10 0.30 0.00 1.00
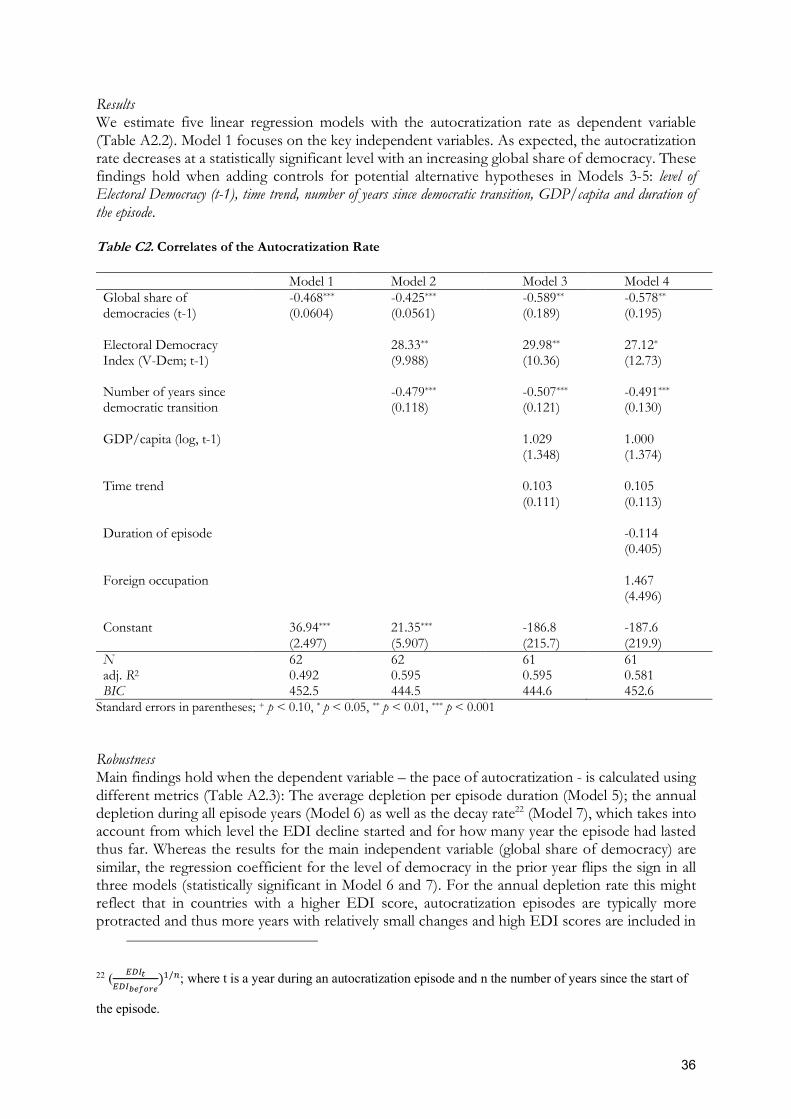
36
Results We estimate five linear regression models with the autocratization rate as dependent variable (Table A2.2). Model 1 focuses on the key independent variables. As expected, the autocratization rate decreases at a statistically significant level with an increasing global share of democracy. These findings hold when adding controls for potential alternative hypotheses in Models 3-5: level of Electoral Democracy (t-1), time trend, number of years since democratic transition, GDP/capita and duration of the episode. Table C2. Correlates of the Autocratization Rate Model 1 Model 2 Model 3 Model 4 Global share of -0.468*** -0.425*** -0.589** -0.578** democracies (t-1) (0.0604) (0.0561) (0.189) (0.195) Electoral Democracy 28.33** 29.98** 27.12* Index (V-Dem; t-1) (9.988) (10.36) (12.73) Number of years since -0.479*** -0.507*** -0.491*** democratic transition (0.118) (0.121) (0.130) GDP/capita (log, t-1) 1.029 1.000 (1.348) (1.374) Time trend 0.103 0.105 (0.111) (0.113) Duration of episode -0.114 (0.405) Foreign occupation 1.467 (4.496) Constant 36.94*** 21.35*** -186.8 -187.6 (2.497) (5.907) (215.7) (219.9) N 62 62 61 61 adj. R2 0.492 0.595 0.595 0.581 BIC 452.5 444.5 444.6 452.6
Standard errors in parentheses; + p < 0.10, * p < 0.05, ** p < 0.01, *** p < 0.001
Robustness Main findings hold when the dependent variable – the pace of autocratization - is calculated using different metrics (Table A2.3): The average depletion per episode duration (Model 5); the annual depletion during all episode years (Model 6) as well as the decay rate22 (Model 7), which takes into account from which level the EDI decline started and for how many year the episode had lasted thus far. Whereas the results for the main independent variable (global share of democracy) are similar, the regression coefficient for the level of democracy in the prior year flips the sign in all three models (statistically significant in Model 6 and 7). For the annual depletion rate this might reflect that in countries with a higher EDI score, autocratization episodes are typically more protracted and thus more years with relatively small changes and high EDI scores are included in
22 ( !"#$!"#%&'()&
)+/-; where t is a year during an autocratization episode and n the number of years since the start of
the episode.
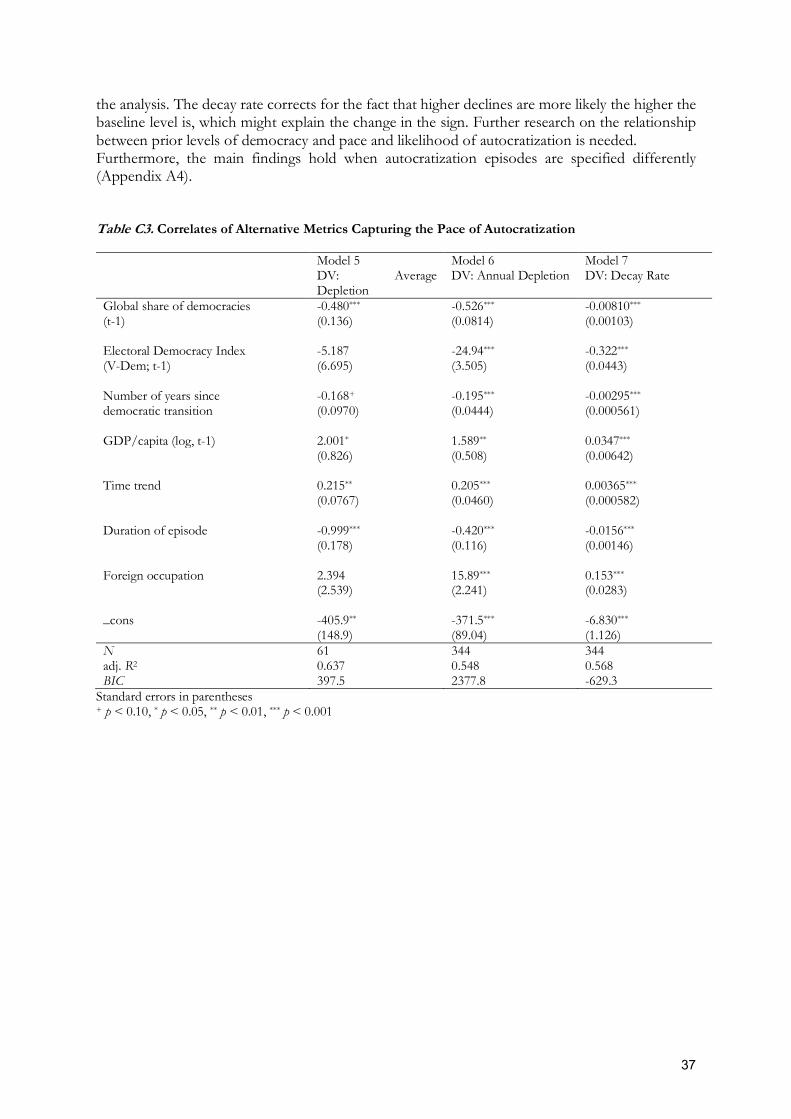
37
the analysis. The decay rate corrects for the fact that higher declines are more likely the higher the baseline level is, which might explain the change in the sign. Further research on the relationship between prior levels of democracy and pace and likelihood of autocratization is needed. Furthermore, the main findings hold when autocratization episodes are specified differently (Appendix A4).
Table C3. Correlates of Alternative Metrics Capturing the Pace of Autocratization
Model 5 DV: Average Depletion
Model 6 DV: Annual Depletion
Model 7 DV: Decay Rate
Global share of democracies -0.480*** -0.526*** -0.00810*** (t-1) (0.136) (0.0814) (0.00103) Electoral Democracy Index -5.187 -24.94*** -0.322*** (V-Dem; t-1) (6.695) (3.505) (0.0443) Number of years since -0.168+ -0.195*** -0.00295*** democratic transition (0.0970) (0.0444) (0.000561) GDP/capita (log, t-1) 2.001* 1.589** 0.0347*** (0.826) (0.508) (0.00642) Time trend 0.215** 0.205*** 0.00365*** (0.0767) (0.0460) (0.000582) Duration of episode -0.999*** -0.420*** -0.0156*** (0.178) (0.116) (0.00146) Foreign occupation 2.394 15.89*** 0.153*** (2.539) (2.241) (0.0283) _cons -405.9** -371.5*** -6.830*** (148.9) (89.04) (1.126) N 61 344 344 adj. R2 0.637 0.548 0.568 BIC 397.5 2377.8 -629.3
Standard errors in parentheses + p < 0.10, * p < 0.05, ** p < 0.01, *** p < 0.001

38
APPENDIX D: Additional figures
Figure D1. The Development of Democracy in Turkey from 1900-2016
Figure D2. Box Plot Autocratization Rate across the Waves of Autocratization (Democratic Recessions only)
Note: The autocratization rate captures how fast the V-Dem Electoral Democracy Index declines from one year to the other at the peak of the autocratization episode. High values indicate sudden autocratization and low values more gradual. The first wave of autocratization includes episodes beginning between 1900 to 1945 (N=17); the second wave of autocratization from 1946 to 1990 (N=12) and the third wave from 1991 to 2016 (N=39).

39
Figure D3. Average Autocratization Rate by Wave and Type of Access to and Extension of Chief Executive Power (Democratic Recessions only)
Note: 17 episodes are included in the first wave; 12 in the second wave and 33 in the third wave.

40
APPENDIX E: Robustness Tests with Alternative Episode Specifications
In the following, we test if the key findings of our paper are robust to alternative specifications of the autocratization episodes. In Appendix E.1 we report the findings for using a more conservative overall cut-off point for qualifying as autocratization episode – an overall decline of 0.12 on the EDI on the needs to be reached instead of 0.1 as in the main paper. E.2 reports the results allowing for four years of stagnation instead of three. E.3 we discuss the effects of using a higher threshold for the starting point of autocratization episodes (a decline of 0.02 instead of 0.01). E.1 Higher threshold to qualify as autocratization episode (overall EDI decline of more than 0.12) With 173 the number of autocratization episodes in this specification is lower than the 202 using the original specification (Table A.4.1.1). Figure A4.1.1 shows the three waves of autocratization as the original Figure 5 in a similar way – with the only exception that the peaks of the waves are less pronounced (e.g. only about 12% of countries affected at max in the second wave instead of almost 14% in the main specification). Also, the autocratization rate decreases in a similar way using this episode specification as the original one (A4.1.2). Overall, the correlation between time and the autocratization rate is with -0.69 slightly stronger as when using the original model specification. Similarly, the regression results reported in the main text hold with this model specification (Table A4.1.2). Table E1.1: Number of Autocratization Episodes by Wave and Type Autocratic Before Democratic Before Total First Wave 15 16 31 Second Wave 71 12 83 Third Wave 30 29 59 Total 116 57 173
Figure E1.1: The Three Waves of Autocratization
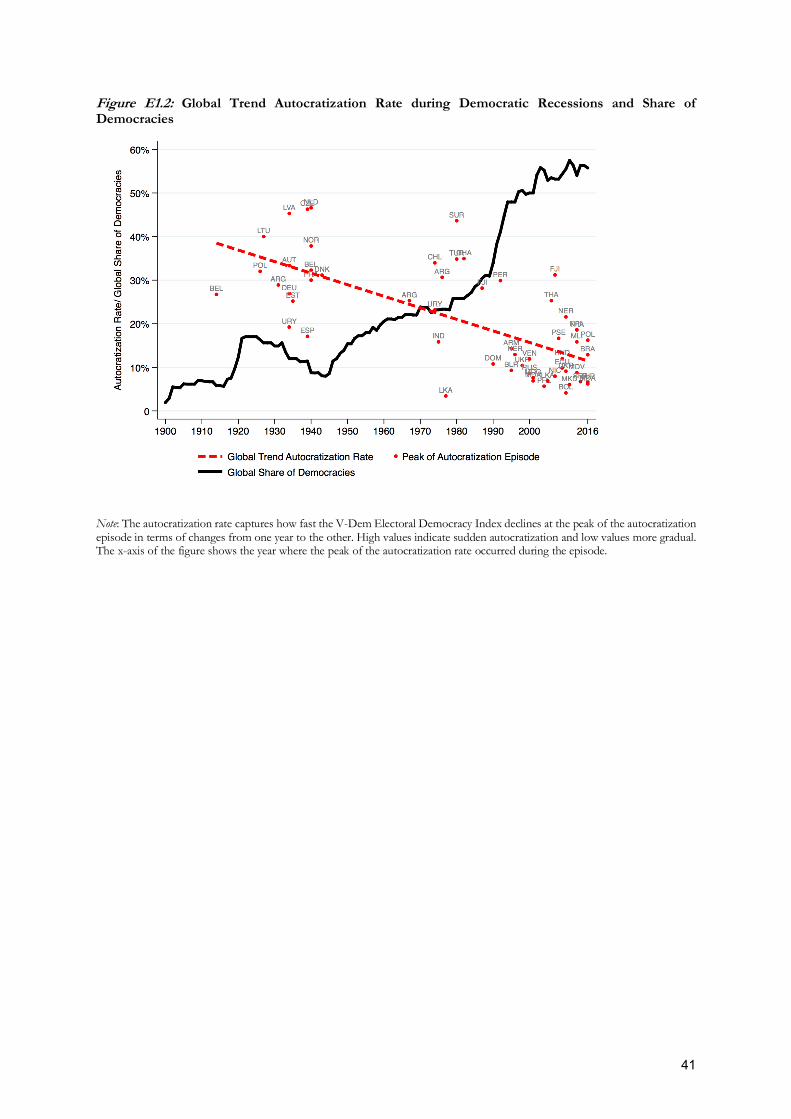
41
Figure E1.2: Global Trend Autocratization Rate during Democratic Recessions and Share of Democracies
Note: The autocratization rate captures how fast the V-Dem Electoral Democracy Index declines at the peak of the autocratization episode in terms of changes from one year to the other. High values indicate sudden autocratization and low values more gradual. The x-axis of the figure shows the year where the peak of the autocratization rate occurred during the episode.

42
Table E1.2: Correlates of the Autocratization Rate Model 1 Model 2 Model 3 Model 4 Global share of democracies (t-1) -0.482*** -0.438*** -0.577** -0.579** (0.0612) (0.0585) (0.183) (0.189) Electoral Democracy Index 31.99** 34.37** 34.62* (V-Dem; t-1) (10.16) (10.37) (13.04) Number of years since democratic -0.407** -0.436*** -0.439** transition (0.122) (0.124) (0.132) GDP/capita (log, t-1) 1.909 1.897 (1.433) (1.474) Time trend 0.0939 0.0920 (0.108) (0.110) Duration of episode -0.0629 (0.402) Foreign occupation -0.756 (4.440) _cons 38.13*** 20.03** -177.5 -173.5 (2.481) (6.070) (209.3) (214.1) N 57 57 56 56 adj. R2 0.521 0.608 0.617 0.601 BIC 412.2 406.7 405.3 413.3
Standard errors in parentheses + p < 0.10, * p < 0.05, ** p < 0.01, *** p < 0.001

43
E.2: Allowing for four instead of three years of stagnation during an autocratization episode With 199 the number of autocratization episodes in this specification is about the same as the 202 using the original specification (Table A.4.2.1). Figure A4.2.1 shows the three waves of autocratization as the original Figure 5 in a similar way – with the minor exception that the peaks of the waves are more pronounced (e.g. more than 14% of countries affected at max in the second wave instead of almost 14% in the main specification). Also, the autocratization rate decreases in a similar way using this episode specification as the original one (A4.2.2). Overall, the correlation between time and the autocratization rate is with -0.67 about the same as when using the original model specification. Similarly, the regression results reported in the main text hold with this model specification (Table A4.2.2). Table E2.1: Number of Autocratization Episodes by Wave and Type Autocratic Before Democratic Before Total First Wave 22 17 39 Second Wave 84 11 95 Third Wave 31 34 65 Total 137 62 199
Figure E2.1: The Three Waves of Autocratization

44
Figure E2.2: Global Trend Autocratization Rate during Democratic Recessions and Share of Democracies
Note: The autocratization rate captures how fast the V-Dem Electoral Democracy Index declines at the peak of the autocratization episode in terms of changes from one year to the other. High values indicate sudden autocratization and low values more gradual. The x-axis of the figure shows the year where the peak of the autocratization rate occurred during the episode.
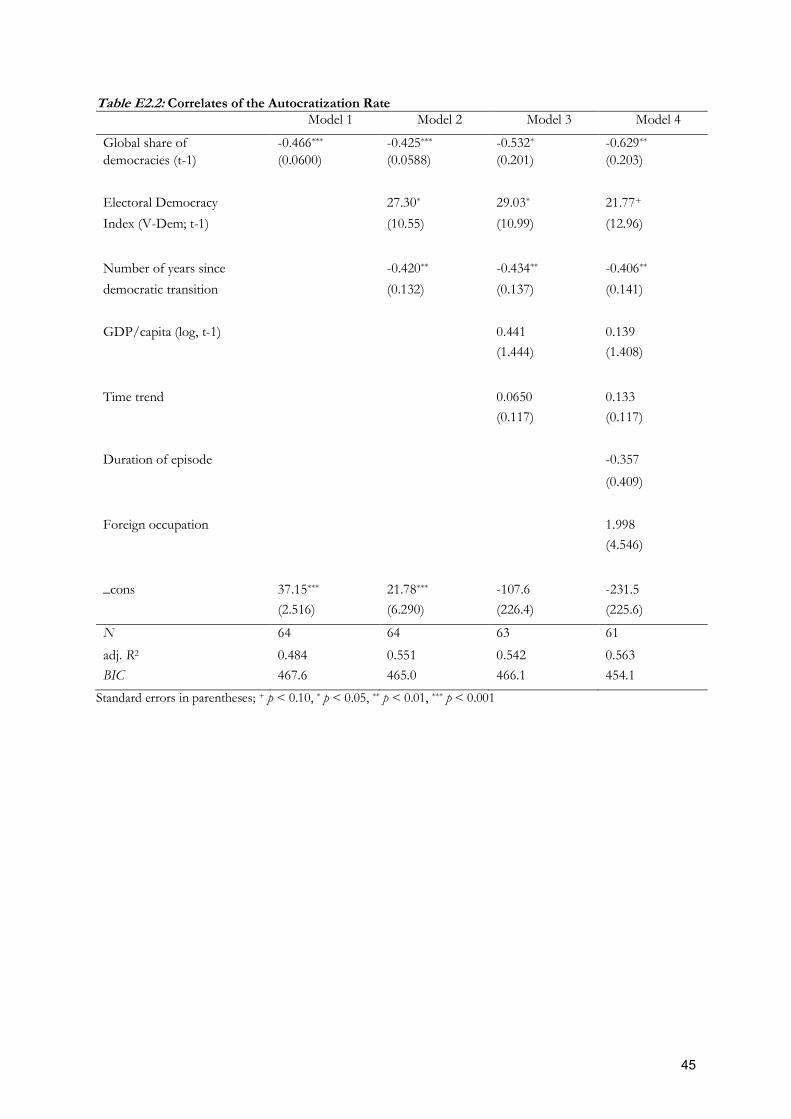
45
Table E2.2: Correlates of the Autocratization Rate Model 1 Model 2 Model 3 Model 4
Global share of -0.466*** -0.425*** -0.532* -0.629** democracies (t-1) (0.0600) (0.0588) (0.201) (0.203)
Electoral Democracy 27.30* 29.03* 21.77+ Index (V-Dem; t-1) (10.55) (10.99) (12.96)
Number of years since -0.420** -0.434** -0.406** democratic transition (0.132) (0.137) (0.141)
GDP/capita (log, t-1) 0.441 0.139 (1.444) (1.408)
Time trend 0.0650 0.133 (0.117) (0.117)
Duration of episode -0.357
(0.409)
Foreign occupation 1.998 (4.546)
_cons 37.15*** 21.78*** -107.6 -231.5 (2.516) (6.290) (226.4) (225.6)
N 64 64 63 61
adj. R2 0.484 0.551 0.542 0.563 BIC 467.6 465.0 466.1 454.1
Standard errors in parentheses; + p < 0.10, * p < 0.05, ** p < 0.01, *** p < 0.001

46
E.3: Lower starting threshold for episodes - a decline of 0.02 instead of 0.01 on the EDI With 195 the number of autocratization episodes in this specification is slightly lower than the 202 using the original specification (Table A.4.3.1). In particular, only 55 instead of 62 cases of democratic recession are identified with this specification – which makes sense as a higher starting threshold is likely to exclude some of the more gradual episodes typical for democratic contexts. Nevertheless, Figure A4.3.1 shows the three waves of autocratization in a similar way as the original Figure 5– with the exception that the peaks of the waves are less pronounced (e.g. less than 12% of countries affected at max in the second wave instead of almost 14% in the main specification). Also, the autocratization rate decreases in a similar way using this episode specification as the original one (A4.3.2). Overall, the correlation between time and the autocratization rate is with -0.67 about the same as when using the original model specification. Similarly, the regression results reported in the main text hold with this model specification (Table A4.3.2). Table E3.1: Number of Autocratization Episodes by Wave and Type Autocratic Before Democratic Before Total First Wave 20 17 37 Second Wave 82 11 93 Third Wave 38 27 65 Total 140 55 195
Figure E3.1: The Three Waves of Autocratization

47
Figure E3.2: Global Trend Autocratization Rate during Democratic Recessions and Share of Democracies
Note: The autocratization rate captures how fast the V-Dem Electoral Democracy Index declines at the peak of the autocratization episode in terms of changes from one year to the other. High values indicate sudden autocratization and low values more gradual. The x-axis of the figure shows the year where the peak of the autocratization rate occurred during the episode.

48
Table E3.2: Correlates of the Autocratization Rate
Model 1 Model 2 Model 3 Model 4
Global share of -0.486*** -0.436*** -0.705*** -0.703*** democracies (t-1) (0.0645) (0.0588) (0.191) (0.198)
Electoral Democracy 30.91** 33.58** 33.11* Index (V-Dem; t-1) (10.31) (10.51) (13.32)
Number of years since -0.493*** -0.531*** -0.531*** democratic transition (0.121) (0.123) (0.131)
GDP/capita (log, t-1) 1.359 1.348 (1.431) (1.468)
Time trend 0.169 0.168 (0.112) (0.115)
Duration of episode -0.0452 (0.409)
Foreign occupation -0.0242 (4.470)
_cons 37.50*** 20.41** -316.1 -314.7 (2.561) (6.114) (217.6) (222.7) N 55 55 54 54 adj. R2 0.508 0.623 0.635 0.619 BIC 403.0 394.2 392.1 400.0
Standard errors in parentheses; + p < 0.10, * p < 0.05, ** p < 0.01, *** p < 0.001