working paper 381 strengthening india-nepal economic relations · 5000 commodities. in january...
TRANSCRIPT

1
Working Paper 381
Strengthening India-Nepal Economic
Relations
Nisha Taneja
Shravani Prakash
Samridhi Bimal
Sakshi Garg
Riya Roy
July 2019
INDIAN COUNCIL FOR RESEARCH ON INTERNATIONAL ECONOMIC RELATIONS

i
Table of Contents
Acknowledgements ............................................................................................................ ii
Abstract ............................................................................................................................. iii
1. Trade Patterns and Potential .................................................................................... 3
2. Issues Facing India’s Exports to Nepal .................................................................... 6
3. Issues Facing India’s Imports from Nepal ............................................................. 11
(i) Import Potential from Nepal ............................................................................... 11
(ii) Underutilisation of the Tariff Rate Quota ........................................................... 11
(iii) High ROO Criteria under Trade Treaty ............................................................. 12
(iv) Non-Tariff Measures Facing Nepal’s Exports to India ...................................... 13
4. Physical Barriers to Cross-Border Movement of Goods ...................................... 14
5. India’s FDI in Nepal ................................................................................................. 15
6. Policy Recommendations ......................................................................................... 18
References ......................................................................................................................... 22
Appendices ........................................................................................................................ 24
List of Tables
Table 1: India’s Trade with Nepal (US$ Million)..................................................................... 3
Table 2: India’s Top 10 Exports to Nepal ................................................................................. 4
Table 3: Top Items Imported into India from Nepal (Values in US$ Million) ......................... 4
Table 4: Total Additional Trade Potential between India and Nepal (US$ Million) ................ 6
Table 5: India’s Additional Export Potential to Nepal ............................................................. 6
Table 6: Items with Highest Export Potential from India to Nepal (Values in US$ Million) .. 7
Table 7: Comparison of Applicable Rate of Duty under SAFTA and Indo-Nepal Bilateral
Agreement ................................................................................................................... 9
Table 8: Nepal’s Top Import Partners..................................................................................... 10
Table 9: Top Items with Import Potential from Nepal (US$ million) .................................... 11
Table 10: India’s Imports of TRQ Products from Nepal (Metric Tonnes) and Quota
Utilisation (%) ........................................................................................................... 12
Table 11: India’s Cumulative FDI in Nepal (Values in USD million) ................................... 15
Table 12: Stock of FDI by Countries and Sectors in Mid-July 2016 ...................................... 16
Table 13: India’s Sector-wise FDI in Nepal (Values in USD million) ................................... 17
ii
Acknowledgements
We gratefully acknowledge the support provided by the Ministry of Commerce, Government
of India for this study. The interactions held with several stakeholders during consultations in
New Delhi and Kathmandu provided in-depth understanding of issues related to the subject.
We would especially like to thank South Asia Watch on Trade, Economics and Environment
(SAWTEE), Nepal for their constant support and valuable inputs at different points in time.
iii
Abstract
India and Nepal have traditionally shared a unique relationship of friendship and economic
cooperation. The relationship is characterized by an open and people-friendly border and is
built on shared historical, cultural, linguistic, ethnic links between people residing in India and
Nepal.
With Nepal being a priority under India ‘Neighborhood First’ policy, strengthening the
economic relationship holds immense significance and potential for both the countries. India
is Nepal’s largest export market, the biggest source of its imports and the top investor of foreign
capital stock. India also provides Nepal transit facility through its territory to access sea ports
for trading with rest of the world.
Given this, the main objective of this paper is to suggest policy measures which can increase
bilateral trade and investment between India and Nepal. We analyse the bilateral trade patterns
and estimate the maximum additional trade potential. We discuss a wide range of issues of
importance pertaining to bilateral trade, including tariffs, levy of an agricultural reform fee,
under-utilization of the tariff rate quota, non-tariff measures, issues related to ROO and
physical barriers to cross-border movement of goods. We also analyse the trend and changing
sectoral composition of India’s investment in Nepal. We discuss barriers and opportunities for
Indian investment in Nepal. The paper concludes by charting a way forward for bolstering
economic cooperation between the two countries by listing down recommendations for
enhancing trade, addressing non-tariff barriers, upgrading infrastructure to improve
connectivity and enhancing Indian FDI in Nepal.
_________
Key words: India-Nepal, Bilateral Trade, Bilateral Investment, Trade in Services, Non-Tariff
Barriers
JEL classification: F10, F13, F15, F50, F53, P45
Author’s email: [email protected]; [email protected]; [email protected]
_________
Disclaimer: Opinions and recommendations in the report are exclusively of the author(s) and not of any other
individual or institution including ICRIER. This report has been prepared in good faith on the basis of information
available at the date of publication. All interactions and transactions with industry sponsors and their
representatives have been transparent and conducted in an open, honest and independent manner as enshrined
in ICRIER Memorandum of Association. ICRIER does not accept any corporate funding that comes with a
mandated research area which is not in line with ICRIER’s research agenda. The corporate funding of an ICRIER
activity does not, in any way, imply ICRIER’s endorsement of the views of the sponsoring organization or its
products or policies. ICRIER does not conduct research that is focused on any specific product or service provided
by the corporate sponsor.

1
Strengthening India-Nepal Economic Relations
Nisha Taneja, Shravani Prakash, Samridhi Bimal, Sakshi Garg and Riya Roy
India and Nepal have historically shared strong trade and commercial relations as neighbours
in the South Asia region. Even during the three decades when Nepal faced continuous political
uncertainty that created several barriers to trade and investment, India remained the country’s
closest commercial partner. India is Nepal’s largest export market, the biggest source of its
imports, the top investor of foreign capital stock and the largest donor of foreign aid. India also
provides Nepal transit facility through its territory to access sea ports for trading with rest of
the world, since Nepal is a landlocked country bordered by India on three sides.
The cross-border flow of goods between India and Nepal is governed by three legal
instruments:
Bilateral Trade Treaties
Trade between the two countries is governed by the Bilateral Trade Treaty signed in 1971 (and
revised in 1991, 1993, 1996, 2002 and 2009), under which India and Nepal offer tariff and
other duty concessions on primary and manufactured products imported from each other’s
territory. The key features of these treaties are as follows:
(i) For primary products, both countries provided duty-free access on imports of 14 primary
products on a reciprocal basis from each other in 1991, and expanded the list to 16 products
under the 2009 treaty. However, for import of certain agriculture goods, Nepal levies an
Agriculture Reform Fee. This fee is levied at the rate of 5 percent for 384 items and 8
percent for 9 items.
(ii) In the case of manufactured products, Nepal provides India a rebate in the chargeable
customs duty based on ad valorem. This rebate is 5 percent of the applicable tariff rate of
up to 30 percent and 3 percent of applicable tariff rate of more than 30 percent. India
receives the rebate on the Nepal’s MFN rates for imports and henceforth, it will be referred
as the bilateral rate of duty. However, such rebate is not applicable to the goods attracting
specific duty.
India’s duty concessions to Nepal, on manufactured goods have varied over time. The rules of
origin criteria have played an important role in determining the extent of concessions offered
by India to Nepal. Under the 1971 treaty, India allowed duty-free access to items manufactured
in Nepal with 90 per cent Nepalese/Indian material content for import to India (subsequently
reduced to 80 per cent in 1991 and then further to 50 per cent in 1993). In 1996, India provided
duty-free access to all products manufactured in Nepal1 on the basis of a Certificate of Origin
and no value-added criteria. The 2002 revision of the treaty re-introduced two conditions for
duty free access of Nepalese products into India – (1) a value addition norm of 30 per cent, and
1 Except three items that were on the sensitive list-namely alcoholic liqueurs, perfumes and cigarettes and
tobacco
2
(2) requirement that the manufacturing process should lead to a change in classification at the
four-digit level of the Harmonised Commodities Description and Coding System. In addition,
a tariff rate quota was imposed on four items (vegetable ghee, acrylic yarn, copper products
and zinc oxide) under which duty-free access was allowed only up to a specified limit beyond
which MFN tariff was applicable. In the 2009 treaty, the tariff rate quota for copper products
was increased by 2,500 metric tons.
South Asian Preferential Trade Agreement (SAPTA)
The South Asian Preferential Trading Agreement (SAPTA) was an initiative taken by the South
Asian Association for Regional Cooperation (SAARC) to augment trade between the Asian
countries through preferential treatment. The agreement came into effect in December 1995
after the conclusion of its first round of negotiations. Overall, it had four rounds of negotiations
based on the ‘request and offer’ approach. Under this approach, the exporting countries
presented a country-specific list of items (currently being traded as well as potential) on which
the party seeks preferential treatment. The importing countries would make an offer on the
items from the request list and indicate the extent of concessions. The tariff concessions were
guided by the Margin of Preference (MoP). With the help of this approach, each consequent
round aimed at increasing the number of products covered and at deepening tariff concessions.
At the end of the fourth round of the negotiations, tariff concessions were exchanged for around
5000 commodities.
In January 2006, SAPTA was superseded by the South Asian Free Trade Agreement (SAFTA).
According to Article 22 (Para 1 and 2) of the Agreement on South Asian Free Trade, the
concessions granted under SAPTA were to be available to the countries until the Trade
Liberalisation Programme under SAFTA was completed. Nepal is yet to undertake complete
tariff liberalisation under SAFTA due to which the concessions given under SAPTA are not
discontinued. Thus, it leaves the status of SAPTA ambiguous.
South Asian Free Trade Agreement (SAFTA)
India and Nepal also offer concessions to each other under the South Asian Free Trade
Agreement (SAFTA). Under the SAFTA agreement, Nepal is expected to offer zero duty to
all products except on 1062 items (HS 6-digit level) on the sensitive list. However, Nepal is
yet to complete its tariff liberalisation and currently offers zero duty on only a limited number
of items. Thus, India is yet to receive zero duty access into Nepal on all items but on the
sensitive list items.
The main objective of this paper is to suggest policy measures which will increase bilateral
trade and investment between India and Nepal. The key questions posed are as follows:
What additional trade potential is available for the two countries to tap into for enhancing
bilateral trade and in what commodities?
What further tariff concessions can India demand from Nepal for its exports, especially in
terms of reducing the number of items on Nepal’s SAFTA sensitive list applicable to India?

3
What are the anomalies under the bilateral agreement and SAFTA? How can these be
corrected?
How can the bilateral treaty of trade be modified to make it more relevant to current trends?
Is the Tariff Rate Quota still relevant?
What other steps can India take to improve Nepal’s market access into India in terms of
addressing the non-tariff barriers facing Nepalese exports to India?
What steps can India take to improve its market access to Nepal in terms of addressing non-
tariff barriers faced by Indian exporters?
What measures can help enhance India’s investment flows into Nepal?
The study makes use of “mixed methods”, based on secondary sources and primary information
collected through stakeholder’s consultations. Secondary sources include published papers,
reports, books, customs tariff manuals, government policies, agreements, regulations and
protocols. Secondary data on India’s trade with Nepal has been collected from the Directorate
General of Foreign Trade (DGFT), Ministry of Commerce and World Integrated Trade Systems
(WITS) Database published by the World Bank. Stakeholder consultations were conducted
with importers, exporters, freight forwarders, clearing agents, government officials and
academics on various issues at different points in time during 2017-18, both in India and Nepal.
The paper is organized as follows. Section 1 of the paper analyses the bilateral trade patterns
of India and Nepal along with their maximum additional potential. Section 2 examines the
issues faced by India’s export to Nepal and section 3 examines the issues facing India’s imports
from Nepal. Section 4 analyses the physical barriers to cross-border movement of goods
between India and Nepal. It is followed by section 5 which focuses on India’s FDI in Nepal.
Finally, section 6 provides the concluding observations and the way forward.
1. Trade Patterns and Potential
India has had a trade surplus with Nepal since 2002-03 which has been growing over the years.
The average trade balance ratio increased from 40% in the period 2002-03 to 2009-10 to 75%
in the period 2010-11 to 2017-18, reflecting India’s expanding trade surplus (Table 1). The
growing trade deficit has been a major cause of concern for Nepal. A point worth noting is that
there is has been a sharp drop in number of items exported from Nepal to India.
Table 1: India’s Trade with Nepal (US$ Million)
Year Export to
Nepal
Import from
Nepal Total trade Trade Balance
Trade Balance
Ratio (%)
2002-03 350 282 632 69 11%
2003-04 669 286 955 383 40%
2004-05 743 346 1,089 397 36%
2005-06 860 380 1,240 480 39%
2006-07 927 306 1,233 621 50%
2007-08 1,507 629 2,136 879 41%
2008-09 1,570 496 2,066 1,074 52%
2009-10 1,533 453 1,986 1,081 54%

4
Year Export to
Nepal
Import from
Nepal Total trade Trade Balance
Trade Balance
Ratio (%)
2010-11 2,168 513 2,682 1,655 62%
2011-12 2,722 550 3,272 2,172 66%
2012-13 3,089 543 3,632 2,546 70%
2013-14 3,592 530 4,122 3,062 74%
2014-15 4,559 640 5,199 3,919 75%
2015-16 3,930 471 4,401 3,460 79%
2016-17 5,454 445 5,899 5,009 85%
2017-18 5,518 414 5,932 5,104 86%
Source: Directorate General of Foreign Trade, Ministry of Commerce
In 2017-18, India’s top exports to Nepal at the HS-6 classification of items included petroleum
oil and oils from bituminous minerals, semi-finished products of iron or non-alloy steel, wholly
milled rice, light oils and cement clinkers (Table 2).
Table 2: India’s Top 10 Exports to Nepal
Hs Code Commodity Values in US$
Million
271019 Other petroleum oils and oils obtained from bituminous
minerals etc.
870
720719 Other products containing by wt<0.25% of carbon 396
100630 Semi/wholly milled rice w/n polished/glazed 199
271012 Light oils and preparations: 197
252310 Cement clinkers 182
871120 Motor cycle etc with reciprocating internal combustion
piston engine of cylinder capacity>50 cc to 250 cc
176
271119 Other in gaseous state : 172
842952 Machinery with a 360 degree. Revolving super-structure 137
271600 Electrical energy 128
300490 Other medicine put up for retail sale 114
Source: Directorate General of Foreign Trade, Ministry of Commerce and Industry
In 2017-18, India’s top imports from Nepal at the HS-6 classification of items included
flavoured water, cardamoms, articles of plastic, tea, fabrics, etc (Table 3).
Table 3: Top Items Imported into India from Nepal (Values in US$ Million)
HS
Code
Commodity 2017-2018
220299 Other sweetened flavoured waters 59
090831 Cardamoms: neither crushed nor ground: 47
392690 Other articles of plastics 31
090240 Other black tea (and other partly fermented tea : 26
531010 Unbleached woven fabrics of jute/other textile bast fibres 18
721720 Wire of iron/non-alloy steel,plated/coated with zinc 17
630510 Sacks and bags for packing,made of jute or of heading no.5303 17

5
HS
Code
Commodity 2017-2018
380610 Resin and resin acids: 17
230690 Oil-cake and other residues resulting from extraction of other oil-seed and
oleaginous fruits
14
721041 Corrugated products, otherwise plated or coated with zinc 13
Source: Directorate General of Foreign Trade, Ministry of Commerce and Industry
We have also attempted to estimate the maximum additional trade potential that exists between
India and Nepal. Trade potential is defined as the trade that could be achieved at an “optimum
trade frontier” in the case of open and frictionless trade possible given current trade, transport
and institutional technologies or practices (Drysdale et al., 2000; Kalirajan, 2000; Armstrong,
2007). There exists a gap between potential and actual trade, which is associated with various
socio-political and institutional factors that may be hindering the actual trade to grow to the
upper limit of the production frontier. It is of significant importance to know the trade potential
that exists between two countries so that they can engage in negotiation processes or undertake
reforms to minimize or partially mitigate the effect of existing restrictive measures to trade
growth.
Following the methodology followed in Taneja et al (2013), we estimate additional trade
potential using the “trade possibilities approach”. Trade possibilities are determined by the
exporting country’s supply capabilities and importing countries demand capabilities. We define
trade possibilities to exist in items that the two countries can import from each other instead of
from elsewhere in the world. In order to identify items having trade potential and assess the
magnitude of trade possibilities (referred to as trade potential) between the two countries,
products having trade potential are identified as those with (a) adequate demand in the receiving
country and (b) adequate supply capabilities in the source country.
Potential trade for any commodity is given by Min (SE, MI) - ET where SE, MI and ET are
supplier’s global exports, receiver’s global imports and existing trade between the supplier and
the receiver. The exercise is conducted by first posing India as a supplier and then by posing
Nepal as the supplier country.2
The results of the exercise show the existence of an estimated additional trade potential of
around US$4 billion if the two countries were to import from each other what they import from
the rest of the world (Table 4). Of this total trade potential, India’s export potential to Nepal
accounted for US$ 3.71 billion and its import potential from Nepal accounted for US$ 0.17
billion (Table 4).
2 Estimation has been done for the year 2016.
6
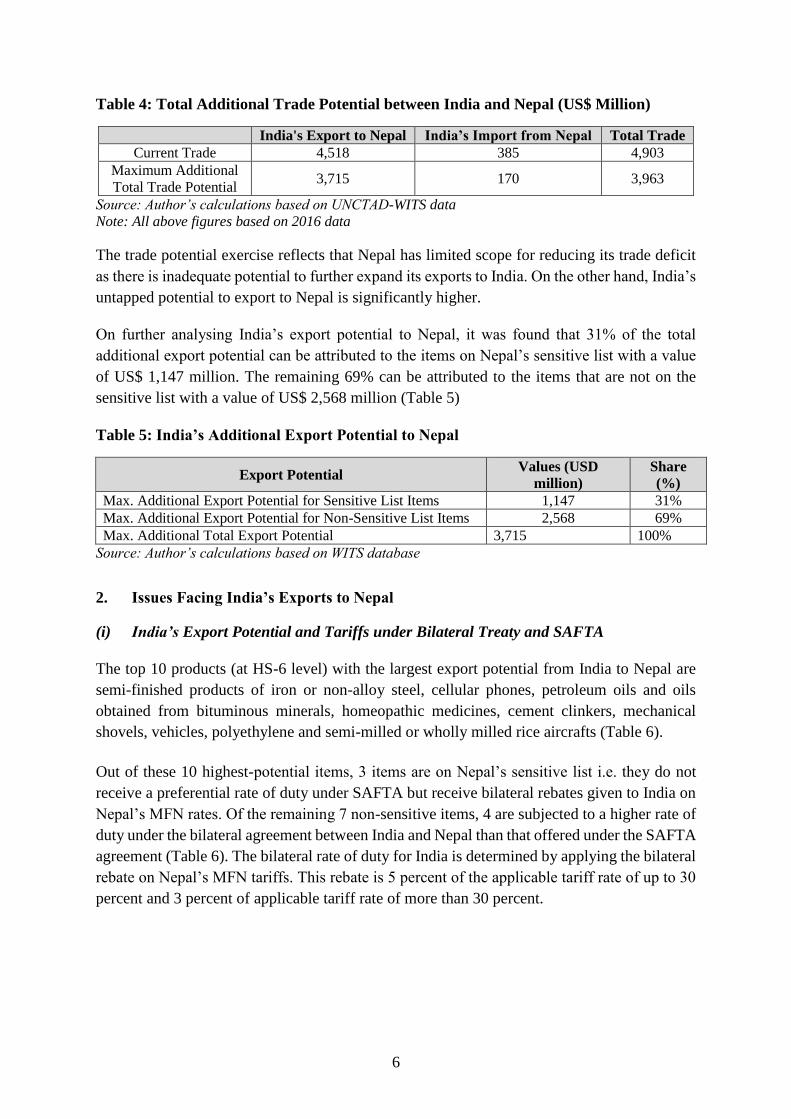
Table 4: Total Additional Trade Potential between India and Nepal (US$ Million)
India's Export to Nepal India’s Import from Nepal Total Trade
Current Trade 4,518 385 4,903
Maximum Additional
Total Trade Potential 3,715 170 3,963
Source: Author’s calculations based on UNCTAD-WITS data
Note: All above figures based on 2016 data
The trade potential exercise reflects that Nepal has limited scope for reducing its trade deficit
as there is inadequate potential to further expand its exports to India. On the other hand, India’s
untapped potential to export to Nepal is significantly higher.
On further analysing India’s export potential to Nepal, it was found that 31% of the total
additional export potential can be attributed to the items on Nepal’s sensitive list with a value
of US$ 1,147 million. The remaining 69% can be attributed to the items that are not on the
sensitive list with a value of US$ 2,568 million (Table 5)
Table 5: India’s Additional Export Potential to Nepal
Export Potential Values (USD
million)
Share
(%)
Max. Additional Export Potential for Sensitive List Items 1,147 31%
Max. Additional Export Potential for Non-Sensitive List Items 2,568 69%
Max. Additional Total Export Potential 3,715 100%
Source: Author’s calculations based on WITS database
2. Issues Facing India’s Exports to Nepal
(i) India’s Export Potential and Tariffs under Bilateral Treaty and SAFTA
The top 10 products (at HS-6 level) with the largest export potential from India to Nepal are
semi-finished products of iron or non-alloy steel, cellular phones, petroleum oils and oils
obtained from bituminous minerals, homeopathic medicines, cement clinkers, mechanical
shovels, vehicles, polyethylene and semi-milled or wholly milled rice aircrafts (Table 6).
Out of these 10 highest-potential items, 3 items are on Nepal’s sensitive list i.e. they do not
receive a preferential rate of duty under SAFTA but receive bilateral rebates given to India on
Nepal’s MFN rates. Of the remaining 7 non-sensitive items, 4 are subjected to a higher rate of
duty under the bilateral agreement between India and Nepal than that offered under the SAFTA
agreement (Table 6). The bilateral rate of duty for India is determined by applying the bilateral
rebate on Nepal’s MFN tariffs. This rebate is 5 percent of the applicable tariff rate of up to 30
percent and 3 percent of applicable tariff rate of more than 30 percent.

7
Table 6: Items with Highest Export Potential from India to Nepal (Values in US$ Million)
HS Code (at
6 digit)
HS Code
(at 8
digit)
Product Description
Export Potential
( in USD
million) in 2016
Included in
Sensitive
List1
SAFTA Rates MFN
Bilateral Rate of
Duty for India (MFN
Rate minus Rebate)
720719 72071900 Containing by weight less than 0.25 % of carbon 217.43 No 5 5 4.75
851712 85171200 Telephone sets, including telephones for cellular 192.21 No Free Free -
271019
27101910 Petroleum oils and oils obtained from bituminous
(kerosene)
131.44 Yes
Per KL Rs. 2000 Per KL Rs. 2000 -
27101920 Aviation Turbine Fuel Per KL Rs. 2100 Per KL Rs. 2100 -
27101930 High Speed Diesel Per KL Rs. 2000 Per KL Rs. 2000 -
27101940 Light Diesel Oil Per KL Rs. 440 Per KL Rs. 440 -
27101950 Fuel oil (Furnace oil) 5 5 4.75
27101960 Base Oil (to be used in the manufacturing of lubricants) 30 30 28.502
27101970 Jute batching Oil and textile oil 15 15 14.25
27101980 Lubricating Oil 30 30 28.50
27101991 Spindle Oil 15 15 14.25
27101992 Transformer Oil 15 15 14.25
27101993 Mineral Turpentine Oil 15 15 14.25
27101994 Rubber Processing Oil 20 20 19.00
27101995 White Oil 15 15 14.25
27101999 Other 30 30 28.50
300390
30039010 Other; Homeopathic Medicaments (Pure Ayurvedic and
Yunani)
101.80 No
9 10 9.503
30039040 Battisa, Drakshasab, Trifala... 9 10 9.50
30039090 Other 14 15 14.253
252310 25231000 Cement clinkers 63.93 Yes Per MT Rs. 2400 Per MT Rs. 2400 -

8
HS Code (at
6 digit)
HS Code
(at 8
digit)
Product Description
Export Potential
( in USD
million) in 2016
Included in
Sensitive
List1
SAFTA Rates MFN
Bilateral Rate of
Duty for India (MFN
Rate minus Rebate)
842959 84295900 Mechanical shovels, excavators and shovel loaders ... 60.36 No 5 5 4.75
870323 87032300 Other vehicles, with spark-ignition internal combustion 50.27 Yes 80 80 77.60
390120 39012000 Polyethylene having a specific gravity of 0.94 45.62 No 6 10 9.50
100630 10063000 Semi-milled or wholly milled rice, whether or not 42.63 No 9 10 9.504
880230 88023000 Aeroplanes and other aircraft, of an unladen weigh 41.51 No 6 10 9.505
Source: Author’s calculations based on Nepal’s Customs Tariff Manual
Note: 1- Nepal’s sensitive list as given by SAARC Secretariat. 2- Under partial exemption of customs duty, only 15% customs duty is charged on import of base oil of sub-heading HS Code 27101960 when imported by the registered
industry with the purpose of producing grease and lubricating oil 3- Under partial exemption of customs duty, only 5% customs duty is charged on medicines falling under chapter 30 (HS Code 3009010 and HS Code 3009090) 4- Full consumption in the customs duty is granted for the good (HS Code 100630) when imported from India. However, an Agriculture Reform Fee (@8%) is charged for this
good 5- Aircraft of subheading HS Code 88023000 imported by the airline service operator or the company licensed by the Civil Aviation Authority.

9
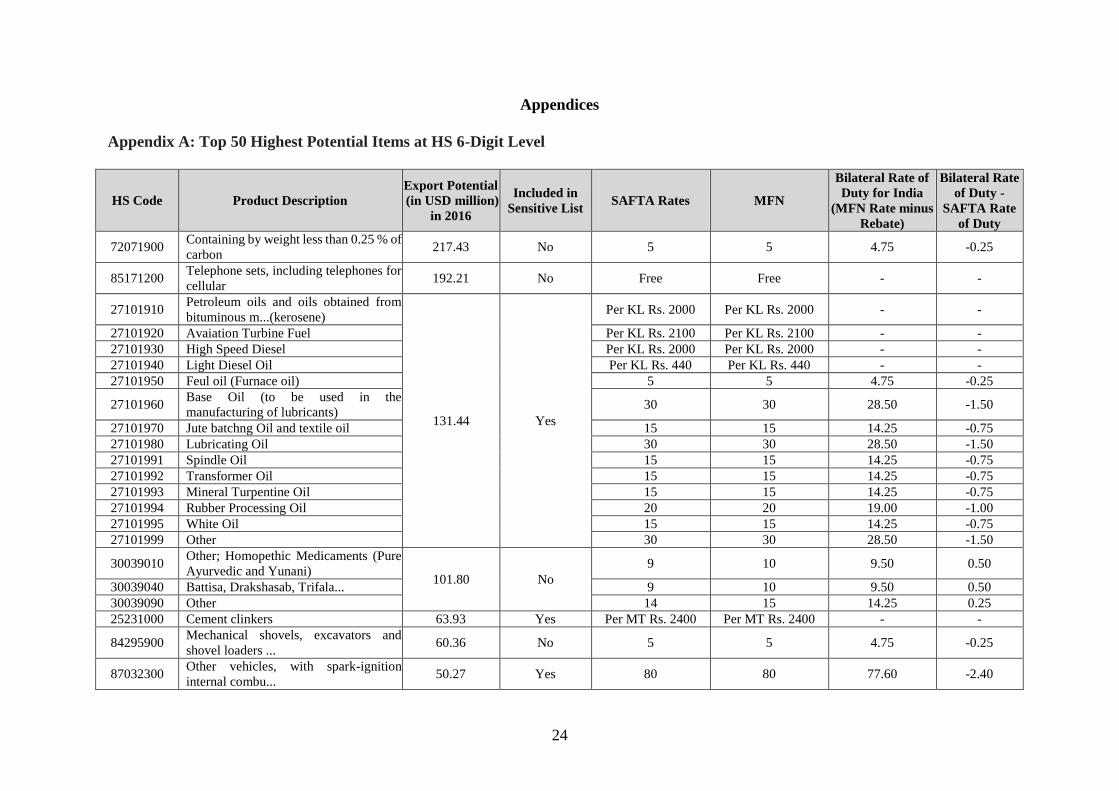
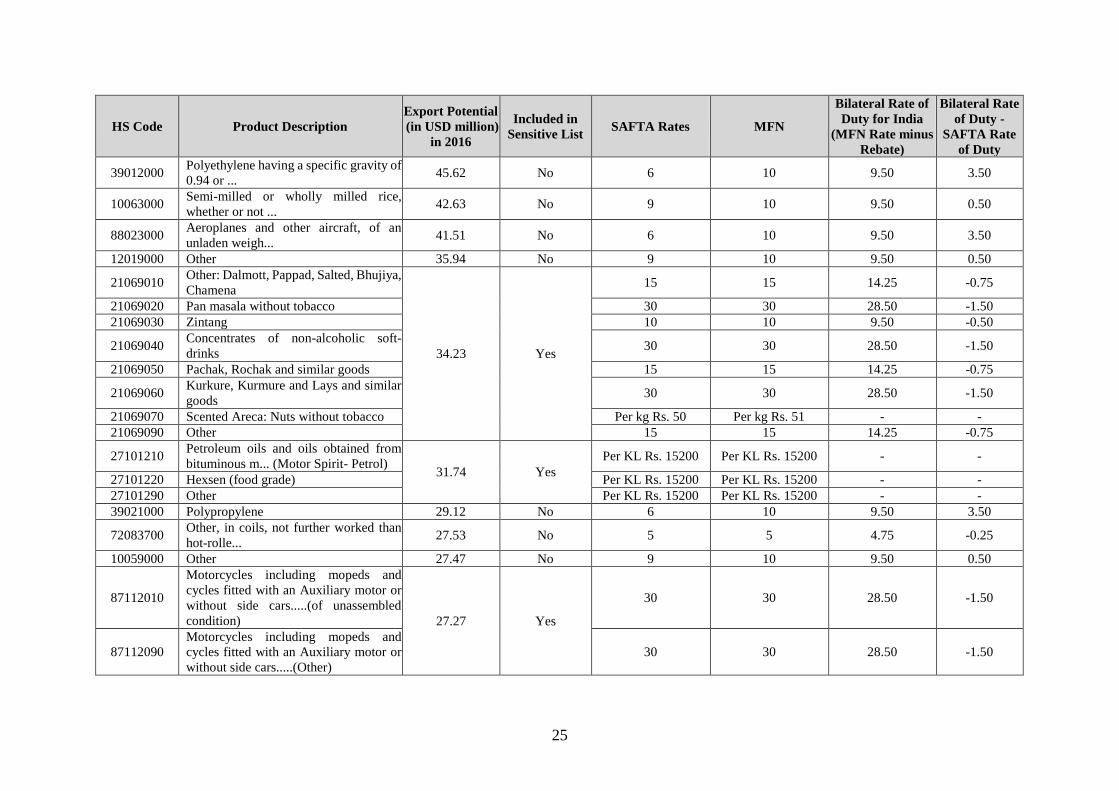
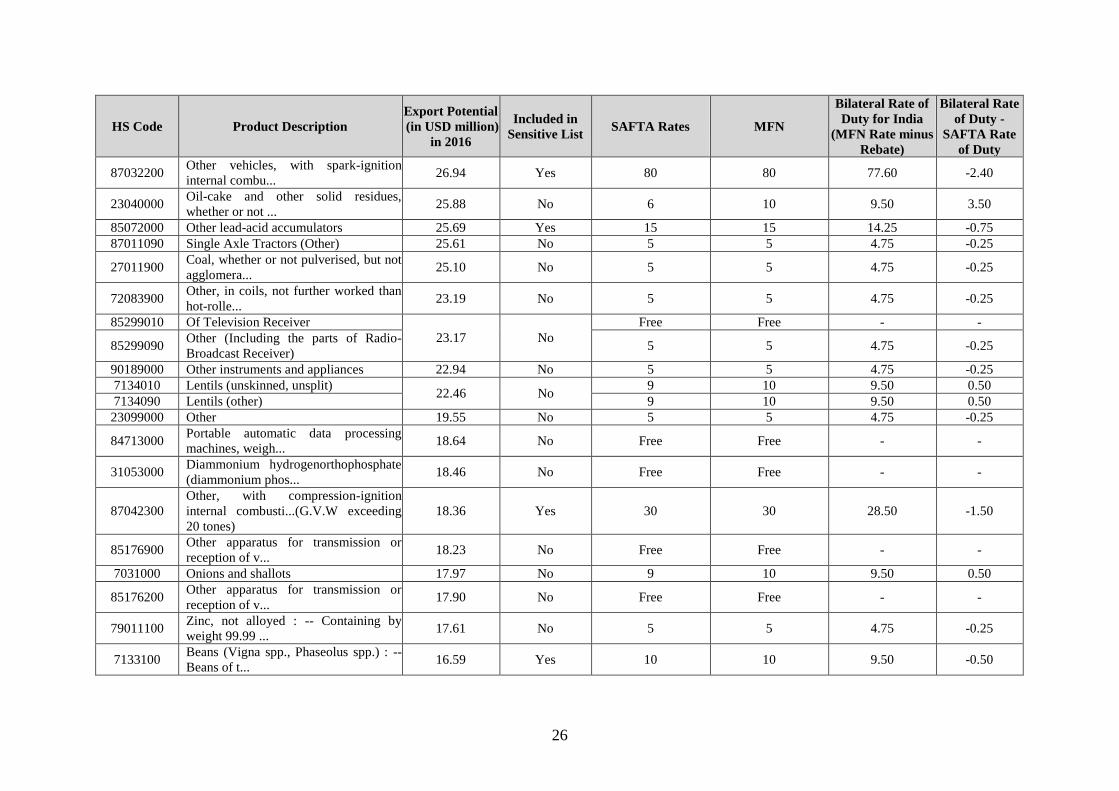
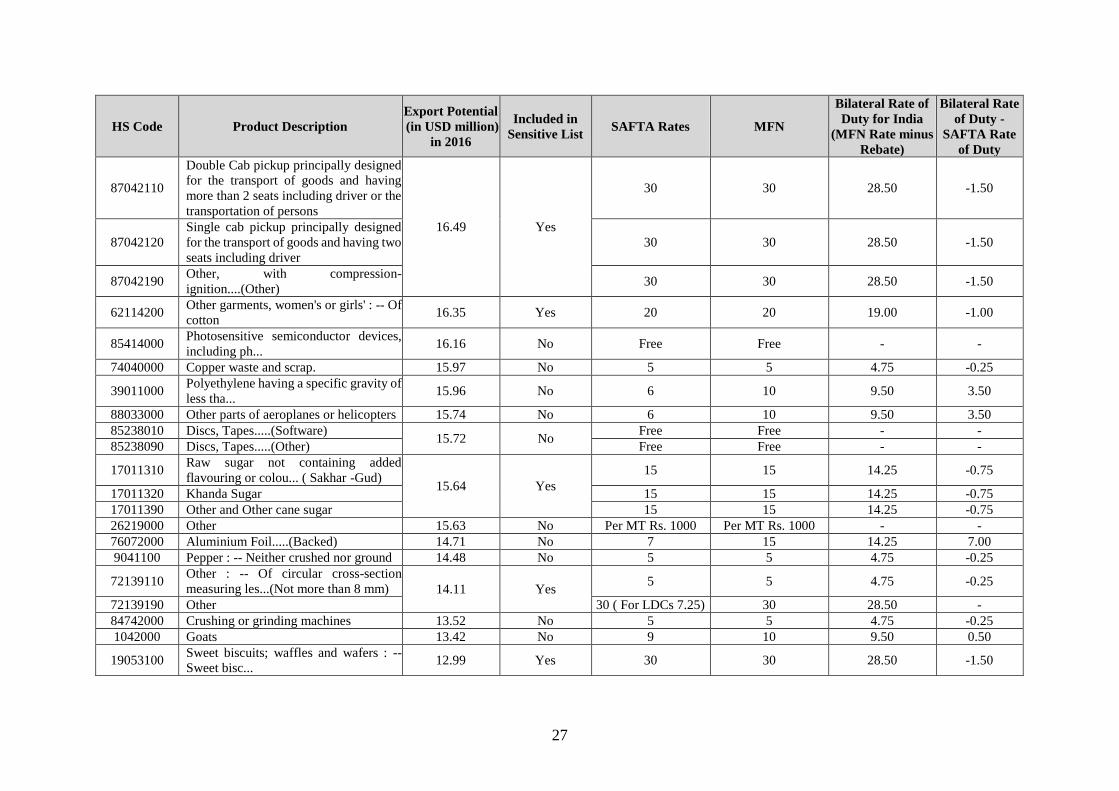
The exercise of identifying items with the highest potential was extended to include top 50
items at the HS-6 level of classification. These items when expanded at the 8-digit level covered
83 items (Appendix A). An examination of the tariff rates applicable to these 83 items with
export potential items from India to Nepal indicates that there is an “anomaly” in the imposition
of tariff rates under SAFTA and the Indo-Nepal bilateral trade treaty. For 17 items, the duty
applicable under the bilateral trade treaty is higher than the SAFTA rate (Table 7). This
anomaly needs to be addressed so that India gets the benefits of SAFTA under its bilateral trade
agreement.
Table 7: Comparison of Applicable Rate of Duty under SAFTA and Indo-Nepal
Bilateral Agreement
Tariff Rates Number of Items
Zero Duty 9
Specific Duty 10
SAFTA Duty is more than Bilateral Rate of Duty 47
Bilateral Rate of Duty is more than SAFTA Duty 17
Total 83
Source: Author’s calculations based on Nepal’s Customs Tariff Manual
Note: The top 50 items at the HS-6 digit level have been further disaggregated at the HS-8 digit level
which resulted into a total of 83 tariff lines.
(ii) Levy of the Agricultural Reform Fee
While the Bilateral Trade Treaty provides duty free access to each other’s primary products as
the agreed list, Government of Nepal levies Agriculture Reform Fee at the rate of 5% on import
of primary products from India. When Nepal became a member of the World Trade
Organisation (WTO) in 2004, it had made a commitment to eliminate the duty in 10 years.
However, this fee continues to be levied. Since 2014, the Government of India has been raising
the issue of eliminating ‘Other Duties and Charges’ (ODCs) during the Intergovernmental
Committee Meeting (IGC). But Nepal had sought an extension to eliminate tax citing the
adverse impact of a devastating 2015 earthquake on the economy (The Himalayan Times,
2018).
India could negotiate the removal of this duty in future, at least on the agricultural items on
which customs duty has been exempted under the bilateral trade treaty.
(iii) Competition from Chinese Exports
There is a general perception that India faces a looming threat from the growing dominance of
China in Nepal’s domestic markets. However, data shows that even though China’s share in
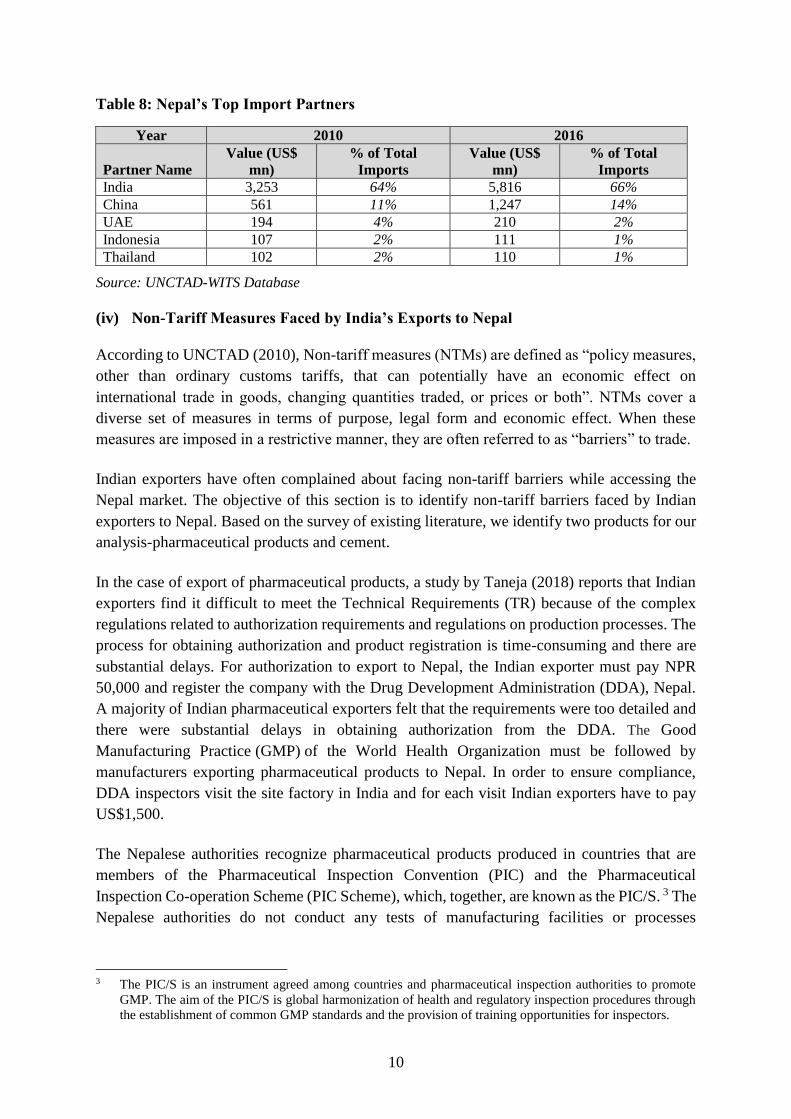
Nepal’s imports increased from 11% in 2010 to 14% in 2016, India’s share also increased from
64% to 66% during the same period. Therefore, India continues to be the largest exporter of
goods to Nepal (Table 8). It can be seen that both India and China competed to take away
market share from other exporters like UAE, Indonesia and Thailand who saw a drop in their
share of Nepal’s imports (Table 8).
10
Table 8: Nepal’s Top Import Partners
Year 2010 2016
Partner Name
Value (US$
mn)
% of Total
Imports
Value (US$
mn)
% of Total
Imports
India 3,253 64% 5,816 66%
China 561 11% 1,247 14%
UAE 194 4% 210 2%
Indonesia 107 2% 111 1%
Thailand 102 2% 110 1%
Source: UNCTAD-WITS Database
(iv) Non-Tariff Measures Faced by India’s Exports to Nepal
According to UNCTAD (2010), Non-tariff measures (NTMs) are defined as “policy measures,
other than ordinary customs tariffs, that can potentially have an economic effect on
international trade in goods, changing quantities traded, or prices or both”. NTMs cover a
diverse set of measures in terms of purpose, legal form and economic effect. When these
measures are imposed in a restrictive manner, they are often referred to as “barriers” to trade.
Indian exporters have often complained about facing non-tariff barriers while accessing the
Nepal market. The objective of this section is to identify non-tariff barriers faced by Indian
exporters to Nepal. Based on the survey of existing literature, we identify two products for our
analysis-pharmaceutical products and cement.
In the case of export of pharmaceutical products, a study by Taneja (2018) reports that Indian
exporters find it difficult to meet the Technical Requirements (TR) because of the complex
regulations related to authorization requirements and regulations on production processes. The
process for obtaining authorization and product registration is time-consuming and there are
substantial delays. For authorization to export to Nepal, the Indian exporter must pay NPR
50,000 and register the company with the Drug Development Administration (DDA), Nepal.
A majority of Indian pharmaceutical exporters felt that the requirements were too detailed and
there were substantial delays in obtaining authorization from the DDA. The Good
Manufacturing Practice (GMP) of the World Health Organization must be followed by
manufacturers exporting pharmaceutical products to Nepal. In order to ensure compliance,
DDA inspectors visit the site factory in India and for each visit Indian exporters have to pay
US$1,500.
The Nepalese authorities recognize pharmaceutical products produced in countries that are
members of the Pharmaceutical Inspection Convention (PIC) and the Pharmaceutical
Inspection Co-operation Scheme (PIC Scheme), which, together, are known as the PIC/S. 3 The
Nepalese authorities do not conduct any tests of manufacturing facilities or processes
3 The PIC/S is an instrument agreed among countries and pharmaceutical inspection authorities to promote
GMP. The aim of the PIC/S is global harmonization of health and regulatory inspection procedures through
the establishment of common GMP standards and the provision of training opportunities for inspectors.
11
associated with products from PIC/S member countries. Because India is not a member of the
PIC/S, the authorities in Nepal conduct inspections of manufacturing facilities.
In the case of export of cement, it was reported that Nepal has instituted a complete ban on the
import of Portland Pozzolana Cement (PPC) grade cement manufactured by ACC Ltd. The ban
was imposed on the basis of the ‘fly ash’ component of the cement. The PPC cement by ACC
Ltd had ‘fly ash’ component equivalent to 30.1% which is more than the limit of 15 to 25% as
stipulated by the Nepal Bureau of Standards (NBS). However, ACC Ltd’s cement is in
accordance to the BIS standards which allows the ‘fly ash’ content to vary between 15 to 35%
(IGC, 2016).
3. Issues Facing India’s Imports from Nepal
(i) Import Potential from Nepal
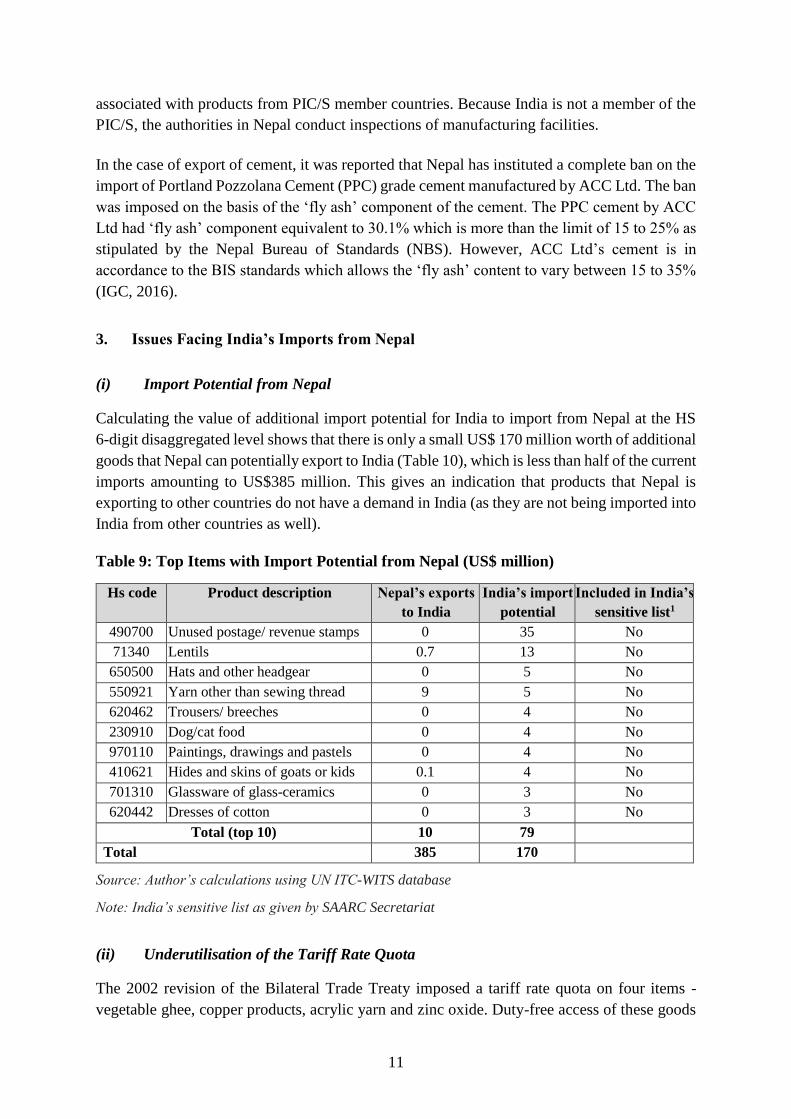
Calculating the value of additional import potential for India to import from Nepal at the HS
6-digit disaggregated level shows that there is only a small US$ 170 million worth of additional
goods that Nepal can potentially export to India (Table 10), which is less than half of the current
imports amounting to US$385 million. This gives an indication that products that Nepal is
exporting to other countries do not have a demand in India (as they are not being imported into
India from other countries as well).
Table 9: Top Items with Import Potential from Nepal (US$ million)
Hs code Product description Nepal’s exports
to India
India’s import
potential
Included in India’s
sensitive list1
490700 Unused postage/ revenue stamps 0 35 No
71340 Lentils 0.7 13 No
650500 Hats and other headgear 0 5 No
550921 Yarn other than sewing thread 9 5 No
620462 Trousers/ breeches 0 4 No
230910 Dog/cat food 0 4 No
970110 Paintings, drawings and pastels 0 4 No
410621 Hides and skins of goats or kids 0.1 4 No
701310 Glassware of glass-ceramics 0 3 No
620442 Dresses of cotton 0 3 No
Total (top 10) 10 79
Total 385 170
Source: Author’s calculations using UN ITC-WITS database
Note: India’s sensitive list as given by SAARC Secretariat
(ii) Underutilisation of the Tariff Rate Quota
The 2002 revision of the Bilateral Trade Treaty imposed a tariff rate quota on four items -
vegetable ghee, copper products, acrylic yarn and zinc oxide. Duty-free access of these goods

12
imported from Nepal into India was allowed only up to a specified quota limit, beyond which
MFN tariff is applicable. The quota, however, has remained grossly underutilised (Table 11).
For example, in 2007-08, the utilised quota was 45.3 per cent for copper products, 47.5 per
cent of vegetable ghee, 20.3 per cent for acrylic yarn and zero for zinc oxide (Taneja and
Chowdhury, 2010). In 2017, the utilised quota was 23 per cent for acrylic yarn, 12 per cent for
copper products and zero of vegetable ghee and zinc oxide (Table 11). In 2001-02, these “TRQ
products” accounted for 29.7 per cent of India’s imports from Nepal but by 2016, the combined
share of these products has decreased to just 5 per cent.
Table 10: India’s Imports of TRQ Products from Nepal (Metric Tonnes) and Quota
Utilisation (%)
2010 2012 2014 2015 2017
Items Volum
e
Quota
used* Volume
Quota
Used* Volume
Quota
Used* Volume
Quota
Used* Volume
Quota
Used*
Veg Fats 0 0% 0 0% 0 0% 0 0% 0 0%
Acrylic 1600 16% 200 2% 2700 27% 4600 46% 2300 23%
Zinc Oxide 0 0% 0 0% 0 0% 0 0% 0 0%
Copper
Product
2800 28% 1000 10% 2000 20% 2200 22% 1200 12%
Source: Author’s calculations using World Integrated Trade Solutions
Note: *The applicable quotas (in Metric Tons): Vegetable Fats – 100,000 MT, Acrylic Yarn – 10,000
MT, Zinc Oxide -2,500 MT, and Copper Products – 10,000 MT (2500 MT after 2009)
Given the low quota utilization rates India may consider removing the quota requirement.
(iii) High ROO Criteria under Trade Treaty
India’s imports from Nepal are governed by two preferential agreements: The Treaty of Trade
between the Government of India and the Government of Nepal and the Duty-Free Tariff
Preference (DFTP) Scheme for LDCs. Under the Treaty of Trade, Nepalese exports to India
are subjected to a change in classification, at four-digit HS Level and that the total value of
materials, parts or produce originating from non-Contracting Parties or of undetermined origin
used, does not exceed 70% of the FOB price of the articles produced. Under the DFTP Scheme,
the imports from Nepal have to go through a change in tariff heading at the six-digit HS level
between the imported raw materials and the finished products. In addition, the process should
have generated a value addition of 30% in the exporting country. Thus while the domestic
content requirement is the same under both the Agreements, the change of heading requirement
at a 4-digit HS classification level is more stringent than the requirement of a change in tariff
heading at the 6-digit level under the DFTP scheme.
On comparing India’s preferential treatment to Nepal with that offered by China, it is found
that China, under the Duty-free Treatment, subjects Nepal to either a change of tariff
classification at four-digit HS level or an ad valorem percentage of no less than 40%. It does
not apply both the criteria simultaneously as in case of India. Whereas the goods listed in the
“Product Specific Rules” (PSR) are not subject to the said criterion. If goods have not been
wholly obtained or produced in the beneficiary country, but meet the product-specific rules

13
issued by the General Customs Administration of China, they are considered to originate from
the beneficiary countries. So far, no such rules have been issued (UNCTAD, 2016).
Nepal has been demanding a relaxation of India’s stringent Rules of Origin criteria of domestic
value addition to a maximum of 25% based on the 10th WTO Ministerial Conference held in
Nairobi in 2015. The Nairobi Decision on Preferential Rules of Origin for LDCs sets out a set
of multilaterally agreed guidelines to help make it easier for LDC exports to qualify for
preferential market access granted by WTO members in favour of LDCs. One of the decisions
regarding requirements for the assessment of sufficient or substantial transformation requires
members to consider allowing the use of non-originating materials up to 75% of the final value
of the product. These mutually agreed guidelines are to be further discussed in following
conferences and are yet to be made mandatory for countries.
(iv) Non-Tariff Measures Facing Nepal’s Exports to India
Nepalese exporters have often complained about facing non-tariff barriers while accessing the
Indian market. Based on the survey of existing literature, we find that exporters do not find it
difficult to meet standards but there are problems related to information flows and procedural
and infrastructural bottlenecks. We list down the following key impediments that reportedly
hamper Nepal’s exports to India4:
Lack of Awareness- For agricultural items such as medicinal plants, it has been found that
neither exporters in Nepal nor importers in India are aware about the requirement or the
regulations related to pest risk analysis.
Dependence on Government Laboratories for Testing: Even though there are several National
Accreditation Board for Testing and Calibration Laboratories (NABL) accredited and the Food
Safety and Standards Authority of India (FSSAI) notified private laboratories in India, for cross
border trade there is dependence on only Government laboratories. This results in undue delays
in testing and adds to the transaction costs.
Lack of Testing Facilities: There are limited number of testing facilities, particularly close to
the land borders. As a result of this, samples have to be sent to Kolkata which adds to the
transaction cost and time of trading.
Lack of EDI Facilities: So far, EDI is operational between India and Nepal only in Jogbani and
Raxaul. Single-window systems at national levels have enabled greater coordination among
agencies, thereby reducing transaction costs for traders. The FSSAI has been included in the
single-window system and has introduced risk profiling to enable the system to identify high-
risk consignments electronically. In general, EDI can enhance risk profiling and are a
prerequisite for single-window systems. Thus, the absence of EDI and Single Window inhibits
4 The impediments discussed in this section are based on Taneja (2018) that examines NTMs in exports from
Nepal to India in selected products of significance such as tea, cardamom, and medicinal and aromatic plants.
14
risk profiling and random checking of consignments which is a major infrastructure
impediment.
Lack of Coordination among the Agencies: While NABL had accredited laboratories in Nepal,
FSSAI has not notified these laboratories. Lack of coordination among regulatory agencies has
led to this problem.
We can infer that most of the issues arise from lack of information on regulations and standards
and inadequate infrastructure for measuring and certifying quality, rather than protection by
India. It therefore becomes necessary to address burdensome NTMs by distinguishing between
real and perceived complaints, thereby focusing the attention of policy makers on genuine
issues; dealing with the misperceptions of traders; and, ultimately, bridging the gap between
perceptions and objective evidence.
4. Physical Barriers to Cross-Border Movement of Goods
India has 27 trading points with Nepal along the Indo-Nepal border. However, the Land
Customs Stations at these border points lack adequate infrastructure which acts as an
impediment to the Indo-Nepal bilateral trade. Logistic bottlenecks have long caused delays and
inefficiencies for freight transport between Nepal and India. These barriers impact both
countries.
Even as infrastructure plays an important role in facilitating bilateral trade, only a limited
number of studies have been conducted to gauge the gaps. Out of 27 trading points identified
in the India-Nepal treaty (2009), limited studies have been carried out covering only two land
customs stations namely Panitanki-Kakarbhitta and Raxaul-Birgunj. By contrast, there have
been a number of studies which have been carried out on Nepal’s transit through India covering
containerised rail cargo. The detailed studies have helped the two governments of India and
Nepal to resolve a number of issues related to transit trade.
A study by CUTS (2016) analysed the infrastructural bottlenecks present at the Panitanki–
Kakarbhitta LCS. At the LCS trade is conducted by traditional processes with no trade-
supporting infrastructure like weighment bridge, cold storage, etc. Lack of capacity, adequate
personnel, coordination and cooperation between various agencies and outdated infrastructure
hampers the overall performance. The LCS also lacks testing facilities which necessitates test
to be done in faraway Kolkata.
At the Raxaul-Birgunj border an Integrated Check Post for handling road cargo became
operational in 2018. Bose (2018) points out that while this has led to shorter queues of trucks
at the outskirts of Raxaul town, cargo clearance continues to get delayed as the shipping bills
reach a few days after the arrival of cargo. There is ambiguity about the old LCS, as Bose
(2018) reports that some cargo carrying oil and cement continues to get cleared at the old LCS,
necessitating movement of trucks through Raxaul town. Also it is not clear whether the new
ICP has adequately addressed all the infrastructure problems.
15
Thus, of the 27 trading points there is not enough information on the infrastructure gaps at these
points. It is important to examine the trade flows through these points, assess the adequacy and
quality of infrastructure at these points and suggest how these can be upgraded.
5. India’s FDI in Nepal
India was amongst the only investors in Nepal during the 1970s and 80s, when total FDI flows
to Nepal were minimal or even negative, averaging $0.5 million annually. India’s investments
stepped up significantly in the 1990s, although total flows remained small, averaging $8.3
million per annum during 1990-2000. Indian FDI fell during the 2000-2009 period, but
increased nearly three times after 2010. The total FDI into Nepal also increased from a US$
19.1 million per annum during 2001-10 to average around US$ 92 million per annum during
2011-17 (UNCTAD, 2018a).
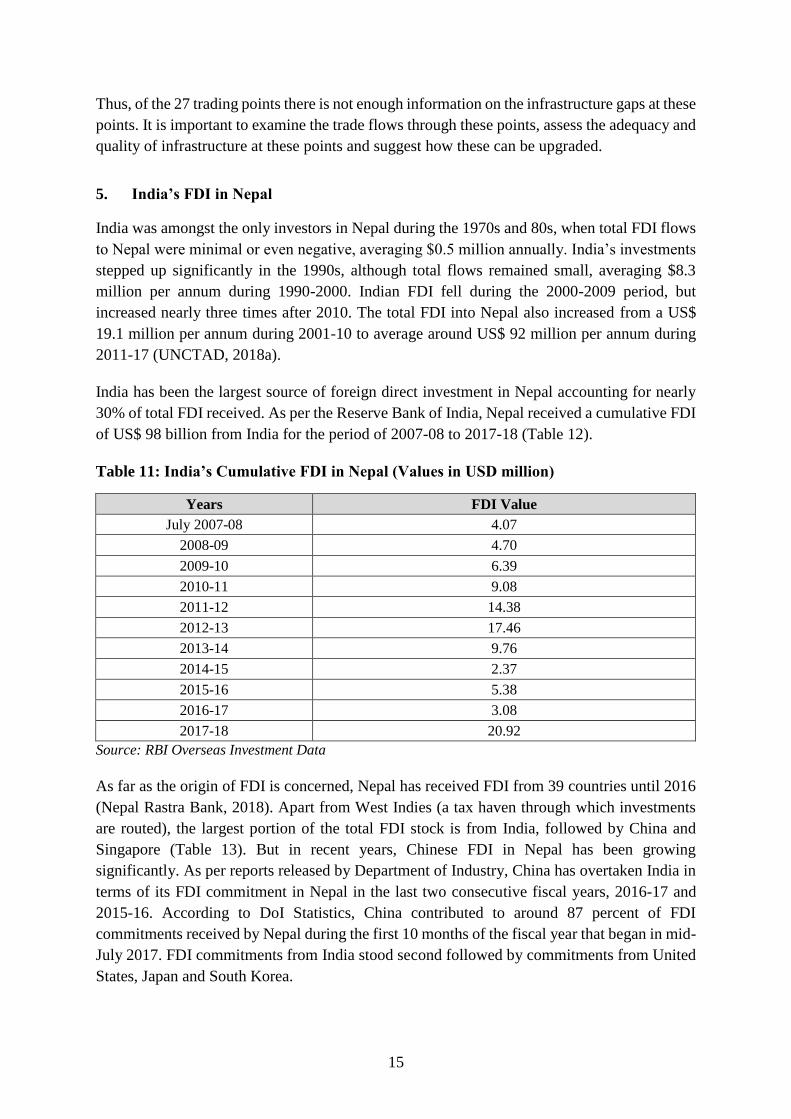
India has been the largest source of foreign direct investment in Nepal accounting for nearly
30% of total FDI received. As per the Reserve Bank of India, Nepal received a cumulative FDI
of US$ 98 billion from India for the period of 2007-08 to 2017-18 (Table 12).
Table 11: India’s Cumulative FDI in Nepal (Values in USD million)
Years FDI Value
July 2007-08 4.07
2008-09 4.70
2009-10 6.39
2010-11 9.08
2011-12 14.38
2012-13 17.46
2013-14 9.76
2014-15 2.37
2015-16 5.38
2016-17 3.08
2017-18 20.92
Source: RBI Overseas Investment Data
As far as the origin of FDI is concerned, Nepal has received FDI from 39 countries until 2016
(Nepal Rastra Bank, 2018). Apart from West Indies (a tax haven through which investments
are routed), the largest portion of the total FDI stock is from India, followed by China and
Singapore (Table 13). But in recent years, Chinese FDI in Nepal has been growing
significantly. As per reports released by Department of Industry, China has overtaken India in
terms of its FDI commitment in Nepal in the last two consecutive fiscal years, 2016-17 and
2015-16. According to DoI Statistics, China contributed to around 87 percent of FDI
commitments received by Nepal during the first 10 months of the fiscal year that began in mid-
July 2017. FDI commitments from India stood second followed by commitments from United
States, Japan and South Korea.

16
Table 12: Stock of FDI by Countries and Sectors in Mid-July 2016
(Values in Rs million)
S. No. Countries Agriculture Industry Service Total
1 West Indies - - 62,780 62,780
2 India 104 16,905 10,245 27,254
3 China - 9,201 1,643 10,844
4 Singapore 113 6,286 736 7,135
5 Ireland - - 5,805 5,805
6 Australia - - 3,832 3,832
7 South Korea 16 2,770 119 2,905
8 Bangladesh - - 2,510 2,510
9 UK - 223 2,108 2,331
10 USA 127 785 1,416 2,328
11 Others 35 4,449 5,473 9,956
Total 395 40,618 96,666 1,37,678
Source: Nepal Rastra Bank (2018)
Looking at the sector-wise composition India’s investments in Nepal, 65% of the total was
invested in the services sector and 33% in the manufacturing sector. Indian investment in the
agriculture sector has continued to be negligible. To assess the trend in the sectoral-distribution
of FDI, we analyse the data on FDI flows from 2008 to 2018, by dividing into two periods -
2008-09 to 2012-13 (period 1) and 2012-13 to 2017-18 (period 2). We see that within the
services sector, Wholesale, Retail Trade, Restaurants and Hotels account for the maximum
share at 21% and is followed by Financial, Insurance, Real Estate and Business Services with
a share of 17% (Table 14). The manufacturing sector received the second highest investment.
However, the share of manufacturing sector actually fell from 39% in period 1 to 26% in period
2 (Table 14). From the firm-level data on overseas investment released by RBI, it can be seen
that although the number of firms investing in Nepal was roughly the same in the two periods;
the size of investments in period 2 was much smaller (Appendix B). The share of wholesale
retail trade and hotels and restaurants also fell by more than half. But the share of financial
services grew spectacularly from 1% to 37%, a large part of which can be attributed to the US$
14 billion investment made by the State Bank of India in period 2 (Appendix C).

17
Table 13: India’s Sector-wise FDI in Nepal (Values in USD million)
Period 1
2008-09 to 2012-13
Period 2
2012-13 to 2017-18
Cumulative
2008-09 to 2017-18
Sectors FDI Share
(%) FDI
Share
(%) FDI
Share
(%)
Manufacturing 20 39 11 26 31 33
Wholesale, Retail Trade,
Restaurants and Hotels 14 28 5 12 20 21
Financial, Insurance, Real
Estate and Business Services 0 1 16 37 16 17
Electricity, Gas and Water 5 10 5 12 10 11
Construction 9 16 0 0 9 9
Community, Social and
Personal Services 3 6 4 9 7 7
Agriculture and Mining 0 0 1 3 1 1
Transport, Storage and
Communication Services 0 0 0 0 0 0
Total FDI 52 100 42 100 94 100
Source: Overseas Investment Data, Reserve Bank of India
Barriers and Opportunities for Investment in Nepal
Until now, the flow of Indian FDI into Nepal was significantly driven by the bilateral trade
agreement that incentivised several Indian companies to establish their commercial presence
in Nepal to exploit the investment-trade nexus. The geographical proximity as well as shared
historical and cultural ties have also made the flow of foreign investment more amenable
(Adhikari 2013). The low labour costs and gradual liberalization of Nepal’s trade and economic
policies resulting in low tariff rate structure have been an added advantage for Indian firms
(Jha, 2010).
However, the political uncertainty and slow growing economy posed as disincentives for
investments. FDI flows from India to Nepal are subjected to various policy-related barriers
like lack of harmony between different FDI governing authorities, problems with respect to
land acquisition, disruptive activities of labour unions, tax concerns such as no tax rebates on
profits that get reinvested, rampant corruption, infringements of copyright, trademark and
patent of international brands and insufficient infrastructure. In 2011, India and Nepal initiated
a Bilateral Investment Promotion and Protection Agreement (BIPA). The purpose of the
agreement was to stimulate foreign investments by reducing political risks and to enhance
bilateral investments. However, the BIPA between India and Nepal was rather seen as a
hindrance to FDI investments and was never ratified. In March 2017, India unilaterally
denounced the BIT and terminated it (UNCTAD, 2018b). The termination was based on India’s
decision to bring out a new BIT model in 2015 to replace the existing Bilateral Investment
Promotion and Protection Agreements (BIPAs) (Mishra, 2017)
In the last few years, the Government of Nepal has adopted multiple open and liberal policies
to lure foreign investors. The Industrial Enterprises Act and Foreign Investment and
Technology Transfer Act (FITTA) of 1992 initially paved the way towards inward FDI

18
throughout the Nepalese economy. However, the FITTA had several shortcomings and was not
compatible with the changing scenarios of global FDI investments which prevented FDI flows
to reach their potential values. The GoN introduced new Foreign Investment Policy, 2015 by
replacing the policy of 1992 with an objective of making the economy more dynamic and
competitive. In contrast to the old policy, the new policy has clearly defined the term “foreign
investment” and “technology transfer”. There are provisions to facilitate FDI through the
access to foreign exchange, facilities and exemptions, access to credit, hiring foreign workers,
acquisitions of land, and industrial security and business promotion. It assures equal treatment
to foreign investors, no nationalization of the investment, and withdrawal of their principal
investment and its earnings. The provision of mediator and dispute settlement has also been
incorporated in this policy.
Recently, GON has also adopted the concept of facilitating foreign investment in Special
Economic Zone (SEZ) to promote the country’s exports (Special Economic Zone Authority
Nepal 2018). The SEZ Authority Act – 2016 envisions the establishment of SEZ Authority to
construct or maintain physical infrastructure in the SEZ; monitor and regulate industries
established in the SEZ; and provide one stop service. Foreign investors are allowed and given
tax holidays and other concessions to establish, operate and manage the special economic zone.
6. Policy Recommendations
From the above assessment of the trends and issues facing trade and FDI flows, it can be seen
that India has been Nepal’s closest economic and commercial partner, but emerging issues need
to be addressed in order for the two countries to engage beneficially in future. The following
recommendations could help the two countries:
The following is a summary of the main recommendations for the way forward:
Recommendations for Enhancing Trade:
a. Address the Ambiguity under SAPTA: The concessions under SAPTA were to cease
following the completion of the SAFTA process. As Nepal is yet to complete the tariff
liberalization process under SAFTA, it leaves the status under SAPTA ambiguous. This
ambiguity needs to be addressed.
b. Address the Anomaly in Tariff Concessions between Bilateral Agreement and SAFTA:
India can negotiate with Nepal to seek concessions on items in which the tariff duties are
higher under the bilateral treaty than under SAFTA.
c. Remove the TRQ: India should consider removing the TRQ on four items namely acrylic
yarn, vegetable fats, zinc oxide and copper products as the quotas are underutilized.
d. Acceding to Request by Nepal for Minimum 25% Value Addition May be Postponed:
The WTO is in the process of reviewing the use, and application of preferential rules of
origin for LDCs. In June 2018, the WCO has published a practical guide on the Nairobi
Ministerial decision on rules of origin for LDCs. India should examine these
developments before acceding to Nepal’s request.

19
e. Change the CTC Requirement from 4-digit to 6-digit under Bilateral Treaty: India
should consider changing the requirement for change of tariff classification under the
bilateral treaty from a 4 digit to 6 digit change of tariff heading. The change of tariff
heading at the 6 digit level is a less stringent requirement and India is already offering it
under the DFTP scheme.
Recommendations for addressing Non-Tariff Barriers faced by Nepal:
f. Bridging the Information Gap: India could initiate information campaigns and
workshops to reduce information asymmetry that presently exists in areas such as Pest
Risk Analysis (PRA) on agricultural products.
g. Spread Awareness about Accredited Laboratories: India could spread awareness
among exporters, importers, and regulators about all of the available public and private
accredited laboratories in India- especially in states neighbouring Nepal. Governments
can develop marketing and communication strategies to familiarize traders with the
various NABL-accredited and FSSAI-notified laboratories.
h. Establish a Non-tariff Barrier Resolution Mechanism: India and Nepal should
establish a nontariff barrier resolution mechanism to enhance transparency.
i. Establish a Bilateral Institutional Mechanism: India and Nepal should establish a
bilateral institutional mechanism to coordinate and expedite the FSSAI’s notification
of the partner country laboratories accredited by the NABL. This process would help
ensure that food products imported into India are tested only on a random basis and
help catalyze food trade, particularly agricultural trade.
j. Implement Trade Facilitation Measures: Introduce electronic data interchange, risk
management systems, and single windows at border points to enable realization of
potential gains from coordination and efficiency.
Recommendations for Addressing Non-Tariff Barriers Faced by India:
k. India Should Become a Member of PIC and PIC/S: The Indian Department of
Pharmaceuticals should apply for membership of the Pharmaceutical Inspection
Convention (PIC) and the Pharmaceutical Inspection Co-operation Scheme (PIC Scheme),
commonly referred to as PIC/S. The aim of PIC/S is the global harmonization of health
and regulatory inspection procedures through the establishment of common GMP
standards and the provision of training opportunities for inspectors. The Nepalese
authorities recognize pharmaceutical products without tests produced in countries that are
PIC/S members. Thus, becoming a member of the PIC/S would allow India to export to
Nepal without the need for the DDA, Nepal to conduct inspections and tests of Indian
manufacturing facilities. This will make the process of exporting pharmaceutical products
simpler, more efficient and less time-consuming.
l. Harmonise Standards and Regulations: India and Nepal should harmonise their
standards and regulations to avoid ambiguity. The inconsistency in standards Mandated
by Nepal Bureau of Standards and Bureau of Indian Standards has had repercussions on

20
India’s exports of cement to Nepal. The aligning of standards in future to international
best practices will facilitate higher exports.
Recommendations for Upgrading Infrastructure:
m. Address Infrastructure Gaps at Land Customs Stations: There are major infrastructure
deficiencies at the Panitanki LCS with no provision for weighment bridge, cold storage
or EDI facilities. Even though the Integrated Check Post has become operational at
Raxaul, it is not clear whether it addresses all the infrastructure deficiencies which were
there at the old LCS at Raxaul.
n. Need for Gap Assessment in Infrastructure at the LCS along the India Nepal border:
To enhance the infrastructure at the 27 LCSs that India has with Nepal, it is imperative
to conduct a thorough study of the existing infrastructure and conduct a gap analysis of
both hard and soft infrastructure. The existing studies do not cover all elements of
infrastructure and are also limited in their coverage as this limited information is available
only for two LCSs namely Raxaul-Birgunj and Panitanki-Kakarbhitta.
Recommendations for Enhancing FDI from India to Nepal
o. Bilateral Investment Treaty: India should sign a bilateral investment treaty as the current
bilateral investment treaty stands terminated.
p. Capitalize on Trade-Investment Nexus: There is a need to incentivise more trade-
creating investment from India into Nepal. More FDI from India, especially in
manufacturing sectors can help increase the export capacity and potential for Nepal to
export to India and to rest of the world. This will also help Nepal in lowering its trade
deficit with India.
q. Develop SEZs in Nepal: Nepal's SEZ Act has opened the door for Indian investors to set
up and develop SEZs in Nepal. Indian investors can choose to set up SEZs near the Indo-
Nepal border in order to establish proximity with the Indian states (KNN, February 2016).
Further, SEZs can be established near existing ICDs with Nepal to enhance the movement
of goods between the two countries (SEZ Brochure, GON). Developing SEZs in Nepal
would help to attract Indian investors with ample incentives to make exports from there.
Prospective Indian investors can also utilise the provision to acquire a six-month non-
tourist visa to conduct a research or a feasibility study for an SEZ. Indian investors can
receive a residential visa if investments are more than USD 10 million in the SEZ (Nepal
Investment Guide, 2018).
r. Establish Dispute Resolution Mechanism: An innovative and well-defined dispute
settlement mechanism must be put in place to build a strong business environment
between the two countries.
Recommendation for a More Comprehensive Partnership
s. The multi-dimensional cross-border flows between India and Nepal have resulted in
several bilateral treaties of cooperation that need to be updated periodically. Given that
21
enhancing trade in goods, hydropower and services as well as foreign direct investment
are of equally high importance in future, it is recommended that the various treaties be
subsumed into one single Comprehensive Partnership. This will go beyond the existing
treaties on trade in goods to include services trade, power trade, FDI, trade facilitation,
among others.
22
References
Adhikari, R. (2013). India Nepal Bilateral Trade, Presentation made at the “International
Conference on Regional Trade and Economic Cooperation in South Asia”, 2-3 May
2013, New Delhi.
Armstrong, S. (2007). Measuring Trade and Trade Potential: A Survey. Asia Pacific
Economic Papers.
Asian Development Bank. (2019). Identification of Potential Export Items Facing Sanitary
and Phytosanitary Measures and Technical Barriers to Trade in the SASEC Subregion:
Sub regional Diagnostic Study.
Bose, R.P. (2018). Delays continue to plague trade at Raxaul-Birgunj integrated checkpost.
Available at https://www.thehindubusinessline.com/news/delays-continue-to-plague-
trade-at-raxaul-birgunj-integrated-checkpost/article24305433.ece
CUTS International and Centre for Policy Research. (2016). Non-Tariff Measures to Food
Trade in India: A Case Study of Selected Ports. New Delhi.
Drysdale, P., Huang, Y. and Kalirajan, K.P. (2000). China’s Trade Efficiency: Measurement
and Determinants’, in P. Drysdale, Y. Zhang and L. Song (eds), APEC and liberalisation
of the Chinese economy, Asia Pacific Press, Canberra:259–71.
IGC. (2016). Meeting of India-Nepal Inter-Governmental Committee on Trade, Transit, and
Cooperation to Control Unauthorised Trade held. Available at
https://www.nicci.org/pdf/Agreed-Minute-on-28-29-June-2016.pdf
Investment Board of Nepal. (2018). Nepal Investment Guide. Government of Nepal.
Available at
https://www.ibn.gov.np/uploads/files/repository/Nepal%20Investment%20Guide%20
2018.pdf
Jha, H.B. (2018). Indian investment in Nepal: Challenges and opportunities, The Himalayan
Times, February 25, 2010.
Kalirajan, K. (2007). Regional Cooperation and Bilateral Trade Flows: An Empirical
Measurement of Resistance. The International Trade Journal, 21:2, 85 – 107.
Mishra (2017). India to trade partners: Sign new bilateral investment treaties by 31 March.
LiveMint. 11 January 2017.
Nepal Rastra Bank. (2018). A Survey Report on Foreign Direct Investment in Nepal.
Available at https://www.nrb.org.np/red/publications/study_reports/Study_Reports--
A_Survey_Report_on_Foreign_Direct_Investment_in_Nepal).pdf

23
Special Economic Zone Authority. (2018). Concept of Special Economic Zone. Available at
https://www.seznepal.gov.np/content.php?id=4
Taneja, N. and Chowdhury, S. (2010). Role of Treaties in Facilitating Nepal's Trade with
India. Economic and Political Weekly, Vol. 45, Issue No. 07.
Taneja, N., Mehra, M., Mukherjee, P., Bimal, S. and Dayal, I. (2013). Normalizing India
Pakistan Trade. Working Paper No. 267. Indian Council for Research on International
Economic Relations, New Delhi.
The Himalayan Times. (2018). India’s budget could adversely affect Nepal’s Agro Sector.
UNCTAD (2010). Non-Tariff Measures: Evidence from Selected Developing Countries and
Future Research Agenda. Available at https://unctad.org/en/Docs/ditctab20093_en.pdf
UNCTAD. (2016). Handbook on the Special and Preferential Tariff Scheme of China for Least
Developed Countries. Available at
https://unctad.org/en/PublicationsLibrary/itcdtsbmisc76_en.pdf
UNCTAD. (2018a). World Investment Reports, Geneva.
UNCTAD. (2018b). Investment Policy Hub. Available at
https://investmentpolicyhubold.unctad.org/
Taneja, N. (2018). A Granular Approach to Addressing Nontariff Barriers: India’s Trade with
Bangladesh and Nepal. In Kathuria, S. (Ed.) A Glass Half Full: The Promise of
Regional Trade in South Asia. South Asia Development Forum. Washington, DC:
World Bank.
World Customs Organisation. (2018). Practical Guide to the Nairobi Ministerial Decision on
Rules of Origin for LDCs. Available at http://www.wcoomd.org/-
/media/wco/public/global/pdf/topics/key-issues/revenue-package/practical-guide-to-
the-nairobi-ministerial-decision-on-rules-of-origin-for-ldcs_en.pdf?db=web
World Trade Organisation. (2015). Preferential rules of origin for least developed countries.
Ministerial Conference Tenth Session. 15-19 December 2015 Available at
https://www.wto.org/english/thewto_e/minist_e/mc10_e/nairobipackage_e.pdf
24
Appendices
Appendix A: Top 50 Highest Potential Items at HS 6-Digit Level
HS Code Product Description
Export Potential
(in USD million)
in 2016
Included in
Sensitive List SAFTA Rates MFN
Bilateral Rate of
Duty for India
(MFN Rate minus
Rebate)
Bilateral Rate
of Duty -
SAFTA Rate
of Duty
72071900 Containing by weight less than 0.25 % of
carbon 217.43 No 5 5 4.75 -0.25
85171200 Telephone sets, including telephones for
cellular 192.21 No Free Free - -
27101910 Petroleum oils and oils obtained from
bituminous m...(kerosene)
131.44 Yes
Per KL Rs. 2000 Per KL Rs. 2000 - -
27101920 Avaiation Turbine Fuel Per KL Rs. 2100 Per KL Rs. 2100 - -
27101930 High Speed Diesel Per KL Rs. 2000 Per KL Rs. 2000 - -
27101940 Light Diesel Oil Per KL Rs. 440 Per KL Rs. 440 - -
27101950 Feul oil (Furnace oil) 5 5 4.75 -0.25
27101960 Base Oil (to be used in the
manufacturing of lubricants) 30 30 28.50 -1.50
27101970 Jute batchng Oil and textile oil 15 15 14.25 -0.75
27101980 Lubricating Oil 30 30 28.50 -1.50
27101991 Spindle Oil 15 15 14.25 -0.75
27101992 Transformer Oil 15 15 14.25 -0.75
27101993 Mineral Turpentine Oil 15 15 14.25 -0.75
27101994 Rubber Processing Oil 20 20 19.00 -1.00
27101995 White Oil 15 15 14.25 -0.75
27101999 Other 30 30 28.50 -1.50
30039010 Other; Homopethic Medicaments (Pure
Ayurvedic and Yunani) 101.80 No
9 10 9.50 0.50
30039040 Battisa, Drakshasab, Trifala... 9 10 9.50 0.50
30039090 Other 14 15 14.25 0.25
25231000 Cement clinkers 63.93 Yes Per MT Rs. 2400 Per MT Rs. 2400 - -
84295900 Mechanical shovels, excavators and
shovel loaders ... 60.36 No 5 5 4.75 -0.25
87032300 Other vehicles, with spark-ignition
internal combu... 50.27 Yes 80 80 77.60 -2.40
25
HS Code Product Description
Export Potential
(in USD million)
in 2016
Included in
Sensitive List SAFTA Rates MFN
Bilateral Rate of
Duty for India
(MFN Rate minus
Rebate)
Bilateral Rate
of Duty -
SAFTA Rate
of Duty
39012000 Polyethylene having a specific gravity of
0.94 or ... 45.62 No 6 10 9.50 3.50
10063000 Semi-milled or wholly milled rice,
whether or not ... 42.63 No 9 10 9.50 0.50
88023000 Aeroplanes and other aircraft, of an
unladen weigh... 41.51 No 6 10 9.50 3.50
12019000 Other 35.94 No 9 10 9.50 0.50
21069010 Other: Dalmott, Pappad, Salted, Bhujiya,
Chamena
34.23 Yes
15 15 14.25 -0.75
21069020 Pan masala without tobacco 30 30 28.50 -1.50
21069030 Zintang 10 10 9.50 -0.50
21069040 Concentrates of non-alcoholic soft-
drinks 30 30 28.50 -1.50
21069050 Pachak, Rochak and similar goods 15 15 14.25 -0.75
21069060 Kurkure, Kurmure and Lays and similar
goods 30 30 28.50 -1.50
21069070 Scented Areca: Nuts without tobacco Per kg Rs. 50 Per kg Rs. 51 - -
21069090 Other 15 15 14.25 -0.75
27101210 Petroleum oils and oils obtained from
bituminous m... (Motor Spirit- Petrol) 31.74 Yes
Per KL Rs. 15200 Per KL Rs. 15200 - -
27101220 Hexsen (food grade) Per KL Rs. 15200 Per KL Rs. 15200 - -
27101290 Other Per KL Rs. 15200 Per KL Rs. 15200 - -
39021000 Polypropylene 29.12 No 6 10 9.50 3.50
72083700 Other, in coils, not further worked than
hot-rolle... 27.53 No 5 5 4.75 -0.25
10059000 Other 27.47 No 9 10 9.50 0.50
87112010
Motorcycles including mopeds and
cycles fitted with an Auxiliary motor or
without side cars.....(of unassembled
condition) 27.27 Yes
30 30 28.50 -1.50
87112090
Motorcycles including mopeds and
cycles fitted with an Auxiliary motor or
without side cars.....(Other)
30 30 28.50 -1.50
26
HS Code Product Description
Export Potential
(in USD million)
in 2016
Included in
Sensitive List SAFTA Rates MFN
Bilateral Rate of
Duty for India
(MFN Rate minus
Rebate)
Bilateral Rate
of Duty -
SAFTA Rate
of Duty
87032200 Other vehicles, with spark-ignition
internal combu... 26.94 Yes 80 80 77.60 -2.40
23040000 Oil-cake and other solid residues,
whether or not ... 25.88 No 6 10 9.50 3.50
85072000 Other lead-acid accumulators 25.69 Yes 15 15 14.25 -0.75
87011090 Single Axle Tractors (Other) 25.61 No 5 5 4.75 -0.25
27011900 Coal, whether or not pulverised, but not
agglomera... 25.10 No 5 5 4.75 -0.25
72083900 Other, in coils, not further worked than
hot-rolle... 23.19 No 5 5 4.75 -0.25
85299010 Of Television Receiver
23.17 No
Free Free - -
85299090 Other (Including the parts of Radio-
Broadcast Receiver) 5 5 4.75 -0.25
90189000 Other instruments and appliances 22.94 No 5 5 4.75 -0.25
7134010 Lentils (unskinned, unsplit) 22.46 No
9 10 9.50 0.50
7134090 Lentils (other) 9 10 9.50 0.50
23099000 Other 19.55 No 5 5 4.75 -0.25
84713000 Portable automatic data processing
machines, weigh... 18.64 No Free Free - -
31053000 Diammonium hydrogenorthophosphate
(diammonium phos... 18.46 No Free Free - -
87042300
Other, with compression-ignition
internal combusti...(G.V.W exceeding
20 tones)
18.36 Yes 30 30 28.50 -1.50
85176900 Other apparatus for transmission or
reception of v... 18.23 No Free Free - -
7031000 Onions and shallots 17.97 No 9 10 9.50 0.50
85176200 Other apparatus for transmission or
reception of v... 17.90 No Free Free - -
79011100 Zinc, not alloyed : -- Containing by
weight 99.99 ... 17.61 No 5 5 4.75 -0.25
7133100 Beans (Vigna spp., Phaseolus spp.) : --
Beans of t... 16.59 Yes 10 10 9.50 -0.50
27
HS Code Product Description
Export Potential
(in USD million)
in 2016
Included in
Sensitive List SAFTA Rates MFN
Bilateral Rate of
Duty for India
(MFN Rate minus
Rebate)
Bilateral Rate
of Duty -
SAFTA Rate
of Duty
87042110
Double Cab pickup principally designed
for the transport of goods and having
more than 2 seats including driver or the
transportation of persons
16.49 Yes
30 30 28.50 -1.50
87042120
Single cab pickup principally designed
for the transport of goods and having two
seats including driver
30 30 28.50 -1.50
87042190 Other, with compression-
ignition....(Other) 30 30 28.50 -1.50
62114200 Other garments, women's or girls' : -- Of
cotton 16.35 Yes 20 20 19.00 -1.00
85414000 Photosensitive semiconductor devices,
including ph... 16.16 No Free Free - -
74040000 Copper waste and scrap. 15.97 No 5 5 4.75 -0.25
39011000 Polyethylene having a specific gravity of
less tha... 15.96 No 6 10 9.50 3.50
88033000 Other parts of aeroplanes or helicopters 15.74 No 6 10 9.50 3.50
85238010 Discs, Tapes.....(Software) 15.72 No
Free Free - -
85238090 Discs, Tapes.....(Other) Free Free - -
17011310 Raw sugar not containing added
flavouring or colou... ( Sakhar -Gud) 15.64 Yes
15 15 14.25 -0.75
17011320 Khanda Sugar 15 15 14.25 -0.75
17011390 Other and Other cane sugar 15 15 14.25 -0.75
26219000 Other 15.63 No Per MT Rs. 1000 Per MT Rs. 1000 - -
76072000 Aluminium Foil.....(Backed) 14.71 No 7 15 14.25 7.00
9041100 Pepper : -- Neither crushed nor ground 14.48 No 5 5 4.75 -0.25
72139110 Other : -- Of circular cross-section
measuring les...(Not more than 8 mm) 14.11 Yes 5 5 4.75 -0.25
72139190 Other 30 ( For LDCs 7.25) 30 28.50 -
84742000 Crushing or grinding machines 13.52 No 5 5 4.75 -0.25
1042000 Goats 13.42 No 9 10 9.50 0.50
19053100 Sweet biscuits; waffles and wafers : --
Sweet bisc... 12.99 Yes 30 30 28.50 -1.50

28
HS Code Product Description
Export Potential
(in USD million)
in 2016
Included in
Sensitive List SAFTA Rates MFN
Bilateral Rate of
Duty for India
(MFN Rate minus
Rebate)
Bilateral Rate
of Duty -
SAFTA Rate
of Duty
India's Maximum Export Potential for Top 50 Items
at 6-digit 1772
India's Maximum Total Export Potential to Nepal 3715
Share of the Maximum Export Potential for Top 50
items at 6-digit 48%
Source: UNCTAD Database WITS; Nepal Customs Tariff Manual

29
Appendix B: Major FDI investors in Nepal's Manufacturing sector
(Values in USD million)
FDI Value Period 1
2008-09 to 2012-13
Period 2
2013-14 to 1017-18
Aether Energy Private Limited 0.34 ~
Ambey Capital Private Limited 0.50 ~
Ambuja Cements Limited 5.17 ~
Balaji Agro Pvt Ltd 0.67 0.17
Bhilwara Energy Limited 3.35 ~
Gmr Energy Limited 2.18 0.33
Gmr Energy Ltd 0.72 ~
Il&Fs Infrastructure Development Corporation Ltd. 0.00 ~
Kansai Nerolac Paints Limited 2.97 ~
Parle Biscuits Pvt Ltd 1.70 0.42
Patel Energy Resources Limited 1.73 0.29
Pest Control (India) Pvt,Ltd. 0.03 ~
Pristine Holdings Private Ltd 0.20 ~
Sethia Credit P Ltd 0.03 ~
Shivashakti Bio Planttec Ltd 0.11 ~
Uma Cement International 0.71 0.81
Al Sameer Exports Pvt. Ltd ~ 0.16
Avone System And Controls ~ 0.06
Britannia Industries Ltd ~ 2.09
Corset Wholesale Ltd ~ 0.07
Essilor India Pvt Ltd ~ 0.15
Future Tyres Private Limited ~ ~
Advance Nutritions (P) Ltd ~ 2.07
Il&Fs Energy Development Company Limited ~ 0.46
Kamna Industries Private Ltd ~ 0.46
Miraj Business Development Private Limited ~ 0.20
Miraj Multicolour Private Limited ~ 0.29
MirajTradecom Private Limited ~ 0.20
Nams Chemicals Private Limited ~ 0.05
Patel Energy Resources Ltd ~ 0.09
Power Grid Corporation Of India Limited ~ 1.15
R. M. Chemicals Private Limited ~ 0.65
Skylark Feeds Pvt Ltd ~ 0.31
Starkey Laboratories India Pvt Ltd ~ 0.18
Source: Overseas Investment Data, Reserve Bank of India

30
Appendix C: Major Indian FDI investors in Nepal's Financial, Insurance and Business
Services sector in USD million (2008-09 to 2017-18)
FDI Value Period 1
2008-09 to 2012-13
Period 2
2013-14 to 2017-18
One Ad Display Pvt Ltd 0.06 ~
Feedback Ventures Pvt. Ltd. 0.11 ~
Storm Communications Pvt. Ltd. 0.03 ~
Ceragem India Pvt Limited 0.13 ~
Life Insurance Corporation Of India Ltd ~ 0.73
Pyro Telecom Solutions Pvt Ltd ~ 0.03
Puresoftware Private Limited ~ 0.11
State Bank Of India ~ 14.31
Care Ratings Ltd ~ 0.33
Source: Overseas Investment Data, Reserve Bank of India

31
LATEST ICRIER’S WORKING PAPERS
NO. TITLE AUTHOR YEAR
380 A STUDY OF THE FINANCIAL
HEALTH OF THE TELECOM
SECTOR
RAJAT KATHURIA
MANSI KEDIA
RICHA SEKHANI
JUNE 2019
379 TOTALISATION/PORTABILITY
OF SOCIAL SECURITY
BENEFITS: IMPERATIVES FOR
GLOBAL ACTION
ANWARUL HODA
DURGESH K. RAI
JUNE 2019
378 INDIA-MYANMAR BORDER
TRADE
NISHA TANEJA
TIN HTOO NAING
SANJANA JOSHI
THIYAM BHARAT SINGH
SAMRIDHI BIMAL
SAKSHI GARG
RIYA ROY
MANALI SHARMA
JUNE 2019
377 THE ROLE AND CHANGING
PARADIGM OF INDIA’S
ASSISTANCE TO NEPAL:
CASE OF THE EDUCATION
SECTOR
TANU M. GOYAL JUNE 2019
376 WHAT EXPLAINS INDIA’S
POOR PERFORMANCE IN
GARMENTS EXPORTS:
EVIDENCE FROM FIVE
CLUSTERS?
SAON RAY MAY 2019
375 INCLUSIVE GROWTH IN
INDIA – LEARNING FROM
BEST PRACTICES OF
SELECTED COUNTRIES
SURESH CHAND
AGGARWAL
DIVYA SATIJA
SHUHEB KHAN
MAY 2019
374 STRATEGY FOR FINANCIAL
INCLUSION OF INFORMAL
ECONOMY WORKERS
SEEMA SHARMA
ARNAB BOSE
HIMANSHU SHEKHAR
ROHIT PATHANIA
MAY 2019
373 BURDEN OF DISEASE AND
CLIMATE INTERACTIONS: AN
ILLUSTRATIVE STUDY OF
SURAT CITY, INDIA
AMRITA GOLDAR
MEENU TEWARI
FLAVY SEN
APRIL 2019
372 TRADE EFFECTS OF
STANDARDS
HARMONIZATION IN THE EU:
IMPROVED ACCESS FOR
NON-EU PARTNERS
ANIRUDH SHINGAL
MALTE EHRICH
APRIL 2019
32
About ICRIER
ICRIER, one of India’s leading think tanks, was established in August 1981 as a not-for-profit
research organisation to provide a strong economic basis for policy making. Under the current
Chairperson, Dr. Isher Judge Ahluwalia, ICRIER has continued and reinforced the pursuit of
its original vision and in the process significantly expanded the scope of its research activities.
ICRIER is ably supported by a Board of Governors, which includes leading policy makers,
academicians, opinion makers and well-known representatives of the corporate world.
ICRIER’s success lies in the quality of its human capital. Led by Dr. Rajat Kathuria, Director
& Chief Executive, ICRIER’s research team consists of highly qualified professors, senior
fellows, fellows, research associates and assistants and consultants.
ICRIER conducts thematic research in the following eight thrust areas:
1. Macroeconomic Management, Financial Liberalisation and Regulation
2. Global Competitiveness of the Indian Economy – Agriculture, Manufacturing and Services
3. Challenges and Opportunities of Urbanisation
4. Climate Change and Sustainable Development
5. Physical and Social Infrastructure including Telecom, Transport, Energy and Health
6. Skill Development, Entrepreneurship and Jobs
7. Asian Economic Integration with focus on South Asia
8. Multilateral Trade Negotiations and FTAs
International conferences, seminars, public policy workshops, public lectures and publications
form an integral part of ICRIER’s outreach activities. ICRIER maintains a wide network of
resource persons from India and abroad. It strives to attract well-qualified researchers, provides
them a stimulating and scholarly work environment and encourages researchers to work in
teams. ICRIER’s research is widely cited by both academia and the popular press, and has over
the years provided critical inputs for policy making.