working no. rural money-wage and
TRANSCRIPT

Working Paper No. 239
RURAL POVERTY, MONEY-WAGE RATES AND CEREAL PRICES IN INDIA
Centre for Development St* Ulloor
Thimwananthapuram 695 011
August 1990

hral povtr&-,.-qo;?ey-waa~ r+&rrs and cereal prices in In-
In?rorJllrt t o . ~ - - - - - - - . -
The debate 1 a overt:. Lr Zndia, as evolved over
trly three de :ades, has f ocu ed attentio~ on thr e issues: Has
ae been a discernible tirile trend in the incidence of rural
m t y ? What has beer, the pat tarn i n short-run fluctuations?
ris tke n a t t e r n of inter-temporal movement to be explained?
k s e , 19891. T5c short-run I luctu;lti.ons in the incidence of
m t y hava been very significant and have been characterised to ! ,near cyclical [Mellor and Desai, 1985; Ghose, 19891. In
olaining t h i s ne3r cyclical f ; -uc tua t ion ?n observed inverse
clationshlw bet wee;^ rzral poverty and agricultural production
u.for I o y been calied upori tc play an important role. Such an
fplrnatio: haa , ho~:~ctvct , ioc.-: i~nder severe criticism in the
r c e n t past on tyro c o u n t s : Fir'scly, the relationship was found to
!(reah VI. ..ascnt 2;: rhe level of states. Secondly, no proper
:fickle-down ' mecha:lisrnr; could be idcntif ied. Thus, the
.*lanation has incrzasingly turned to the rather strong and
eisive cf fect of price fluctuations [Gaiha, 19891 . This is the
: m ~ d context within which the present paper is situated.
T h e first concern of the paper is with the observed
ar cyclical fluctuations in t h e incidence of poverty in India.
le attcnpt a t t h i s level is 1.0 undarstand the nature of
lrctuations through characteristics specific to these !
\wtuatic. .s , that is, through ctarscteristic, specific to cycles

and then to take up the question of inter-tempor~l xovonentr
again thro* gh these very charae tcris t j.cs . Such an approach put8
the exercises of inter-temporal compzrisons carried out over tb
years by various researchers in a certain perspective bringing
out the reasons for disagreement among them in clear terms.
The second concern is with an explanation of the
cyclical pattern in terms of movements of money wages of rural
labour relative to cereal prices. This, in a sense, t ~ k e s tb
discussion to the realm of trickle-down mechanisms. But in this,
the mechanism itself comes to the fore leaving the plane of
agricultural production in the background.
A critique of the economic theory and the lrlethod cf
statistical analysis underlying the voluminous literature on
subject is the spirit of this paper. The critique itself is 0n1.Y
implicit. There is no att .npt made any -ere in the paper I@
explicate it. The paper keeps to the empirical level all through
but with a strong emphasis on realism of anlaysis. Howevx, tlla
influence of Marx and Ralecki in their approach to cconornic an4
social issues related to the distribution of social product ad
class conflict, and the influence of classicals and Bradley ir
their approach to statistical methods need hardly be nzntioned.

2. Cyclical .fluctuations and 'trends' in the incidence of rural povert:
The measure of incidence of rural poverty used here is
the Head-Count Ratio as "there is very little divergence in the
pattern of intertemporal movement between the two indices" (Head-
Count Ratio and the Sen ir9ex) [Ghose, 1989, p.3081. The
weaknesses of these measures of poverty are well-known and are
not discussed here [c. f . Sen, 1981; Kakwani, 19801 .
Following Mellor and Desai (1985) and Ghose (19891, the
fluctuations in the incidence of poverty may be taken to be near
cyclical over the period from 1956/57 to 1977/78. Any cyclical
fluctuations can be fully characterised by phase lengths and rate
of change over the phases. Following blellor and Desai (1985, - -
Table 18.11, it may be seen that the whole period from 1956/57 to
1977/78 corsists of two sub-periods: the first sub period from
1956/5 ' i co 1971/72 and the second sub-period from 1971/72 to
1977.'?e. Both the sub-periods are characterised bj near cyclical
fluctuations. The first sub-period of 15 years consists of three
phases of equal length (five years each) and the rate of change
varied between 3.00 to 3.60 2er cent per year. :he second sub-
period of six years is again characterised by near cyclical
fluctuations and consists of two phases of equal lengths (of
three years) the rate of change being 3.00 a d 3.67 per cent
respectively over the two phases. Whatever smrll deviations from
the cyclical behaviour within sub-periods was owing to the
s lightly differing rates of change over difLerent phases and was

not owing to the deviations in phase lengths. But between sub-
periods the phase lengths thamsolves have changed keeping tln
rate of change within the bounds.
(Table 1)
Having characterised the growth pattern, one can pass
on to inter-temporal comparison. As the growth pattern is
characterised as cyclical fluctuation comparison should be r ide
over comparable periods or comparable points. Either one should
take two or more com~lete phases and estimate growth rates or
take comparable points on an estimated cyclical function ad
compute growth rates. For the first sub-period the appropriate
thing to do would be to compare points on phase I with points or
phase 111, that is, points at a distance of 10 years, which would
show that there is .practic-lly no change in the incidence of
poverty . .
Between sub-periods, comparisons are not sinple of
unambiguous because the phase lengths are different. Here the
unambiguous way of going about it is to compare peaks with perks
or troughs with troughs. The conclusion, then, would be that the
bottom 40% of the population was below the poverty line (PL)
during 1956/57 to 1971/72. Of the next 15% (not necessarily r
fixed group through this period) which was going above and below
the PL over 1956/57 to 1971/72 about 5% had permanently m o d
above the PL after 1971/72. This is all that can be said at this

stage of the analysis going by the characterisation of the
fluctuat2-- 1 in the incidence cf poverty as cyclical.
Before going to the explanatory frame, one may attempt
a very brief review of the estimation piocedures adopted by many
researchers in the field. Wher the variation is characterised by
cyclical fluctuations, estimating trend of any sort following the
parametric method can be highly misleading. The estimated
coefficients will be subject to change depending upon the number
of phases of unequal length, or the parts of phases of the cycles
included. In the above case, if phases 1 to 3 are taken one
would arrive at one result; the result would be different when
phase 4 is also included; the result would be altogether
different when lower part of phase 1, phase 2 and upper part of
phase 3 are taken. This more or less explains the main reason
for disagre~aent among Esrdhan (1974) , Minhas (19741, La1 (1976 ) .
and Plannlng Commission (198C). Within the limitations indicated
above, t??= Planning Commission dstimate seems to be on a firmer
ground as it takes four phases over two complete cycles into
rccoun t .
8. Cyclical fluctuations of wage incomes
Going by Ghose ( 1 9 8 9 ) , 60% of the bottom population in
rural India is wholly or partly dedpendent on page incomes.
Then, in explaining the cyclical fluctuations in dhe proportion
af population below the PL the behaviour of wage Fncornes has an
important role to play. The factors governing per capita wage

incomes may be summarised in terms of the following formula:
Per wage rura hous
capita annual Annual number 5 income of worker-population of days of Daily 1 labour = ratio x employment in x wage: eholds agriculture rate
There are two dimensions to the variation of per capita annual
wage income both of which operate through the three factors
depicted on the R.H. S. of the formula. Firstly, there is the
temporal movement of these three factors which result i n a
certain temporal movement of the per capita wage incoat.
Secondly, at any given point of time for a given average per
capita wage income there is a distribution of the rural
households over wage income classes. This again comes about as 8
result of the variation of the three factors across the
households. It is the PL operating on the second, namely the
distribption, which determines the population below the PL. It
is the 'i combined effect of the temporal movement and the
variations over the households of these three factors which makes
for the cyclical fluctuation of the population below the PL.
This broadly defines the subject of this section.
As regards the temporal movement of worker-populatioR,
ratio, Unni's (1988) exhaustive study has shown that there is no
clearcut long term increase in the ratio at the all India level
or at the level of individual states.' At the all-India level
the ratio was 48 - 2 in 1956-57, 46.2 in 1964-65, 48.2 in 1974-75
and 44.1 in 1977-78. Among the states Uttar Prkdesh, Orissa ad
Kerala showed perceptible decline over the four points of t*
6

whereas all the other states conformed to the all-India pattern.
The concnncr.Bs seems to be that there was no clearcut long term
trend but only ainor ycar to ycar fluctuations linked to the
f1uctuatio:ns ir. agricultural output : a bad year draws more women
and chiidren into the labour force and a good year witnesses the
reversal of it.
.Again, going by the findings of Unni (1988) there does
not seem to be any trend in the annuai number of days of
employment per worker. The relationship seems to be with good or
bad agricultural years : a good agricultural year providing
employment for a larger n h b e r of days and a bad agricultural
fear providing employment for a smaller number of days. Among
a l l the states only Uttar Pradesh and Rajasthan showed some
difference from the all-India patterc : Uttar Pradesh showed a
steady increase over 1964-65, 1974-75 and 1977-78 for both male
and female agricultural Labourers whereas Rajasthan showed an
increase for female labourers ~d a peak in 1974-75 for male
labourers.
A s is evident, the first two factors, namely the
worker-population ratio and the annual number of days of
employment per worker, showed opposite tendencies. In a bad
Year, whereas the worke~population ratio showed a tendency to
increase, the number of aays of employment showed a tendency to

fall. Now an examination of the net effect of the two factors,
which may be terined as he number of days of employment t0
population ratio, is called for. The data which are provided in
Table 2 show that between the two, the number of days of
employment per worker was the dominating factor. The bad
agricultural year of 1974-75 pushed the number of days of
employment to population ratio down for both male and female a t
the all-India as well as at the level of most states. The
exceptions were Bihar, Rajasthan and Uttar Pradesh. The case of
Rajasthan and Uttar Pradesh only go to show the dominance of the
number of days of employment per worker in clear terms as they
were the exceptions with regard ,to this very variable as
indicated above. Bihar stood out because of the highest increase
among all the states in female worker-population ratio between
1964-65 and 1974-75 and in number of days of employment per male
worker between 1974-75 and 1°77-78. Based 0". the tendencies in
worker-population ratio, the number of days of employment per
worker and their net effect, an explanation cannot be provided
for the cyclical behaviour of per-capita wage incomes. All that
can be said is that a dip occurred in the number of days of
employment to population ratio in a bad agricultural year. That
leaves only the movement of wage rates for an explanation.
(Table 3 !
Turning to the movement of wage rates (in real term)
of male agricultural labourers,* it may be seen that (Table 3)

the fluctuations are nearly cyclical. 'Periods of increases are
invari~b1r followed by pericds of declines the whole process
repeating with a certain regularity* The phase lengths were
nearly five years till 1971/72. (In 1971/72, although the sign
itself was negative in eight of the states the magnitudes in six
out of the eight states were below 4%). Since then the lengths
of the phases had become shorter with lengths of three years or
less for the downward phase and four years for the upward phase.=
It only needs to be recalled that these phases correspond rather
well to the phases of movement of the incidence of poverty (last
column of Table 3 ) .
(Table 4 )
Turning to the rates of change in the wage rates'over
the different phases (Table 4 ) , it may be seen that till 1974/75
the rate of decline within a phase was proportionately large
relatitle to the rate of increa~t during the preceding phase. The
only exception to this pattern was Kerala and punjab. This
underwent a change after 1974/75. The rate of decline became
proportionately smaller re1a"ive to the preceding rate of
increase since then. Further, since 1971/72 the lengths of the
declining phases themselves became shorter relative to the
lengths of the increasing phases. Thus, the increases in the
wage rates, owing to both a change in the phase lengths and
change in the rate, became larger relative to the declines
preceding it. This, then, seems to be the reason for the

downward shift o'f the peak in the incidence of poverty disucssd
in section 2 above.
Going by the hhase lengths and proximate rates of
change the relationship betken the cyclical fluctuations in the
incidence of poverty and the rkal wage rates seems to be inverse
and fairly close. When the hqgnitude of this relationship war,
measured by the Pearson's coefficient of correlation for the
period 1957-58 to 1973-74 the sign turned out to be negative for
every state (last row of Table 4). The strength of the
relationship, as measured by a 9'' test, curned out to be
significant for all the states except kamilnadu and Punjab. This
completes the discussion of the f i h t dimension referred to
above. The reasons for the variation of the value of r or i t 8
lower value in some cases cannot be settled here and are left
open.
As already indicated, it is the second dimension which
establishes the link betQpen the movement of the incidence of
poverty and the movement of real wage rate. The link is the !
distribution of rural labou3 households over wage-income classes
mediated through the variation in the worker-population ratio,
the number of days of employment per worker and family size.
This is powerfully brought out; by Parthasarathy and Rao (1973).
What ought to be noted in this context is the concentration of
around 24% of the households in the per . caita income class of
Rs.351-450 (where the poverty line is Rs.450 per capita). Given
10
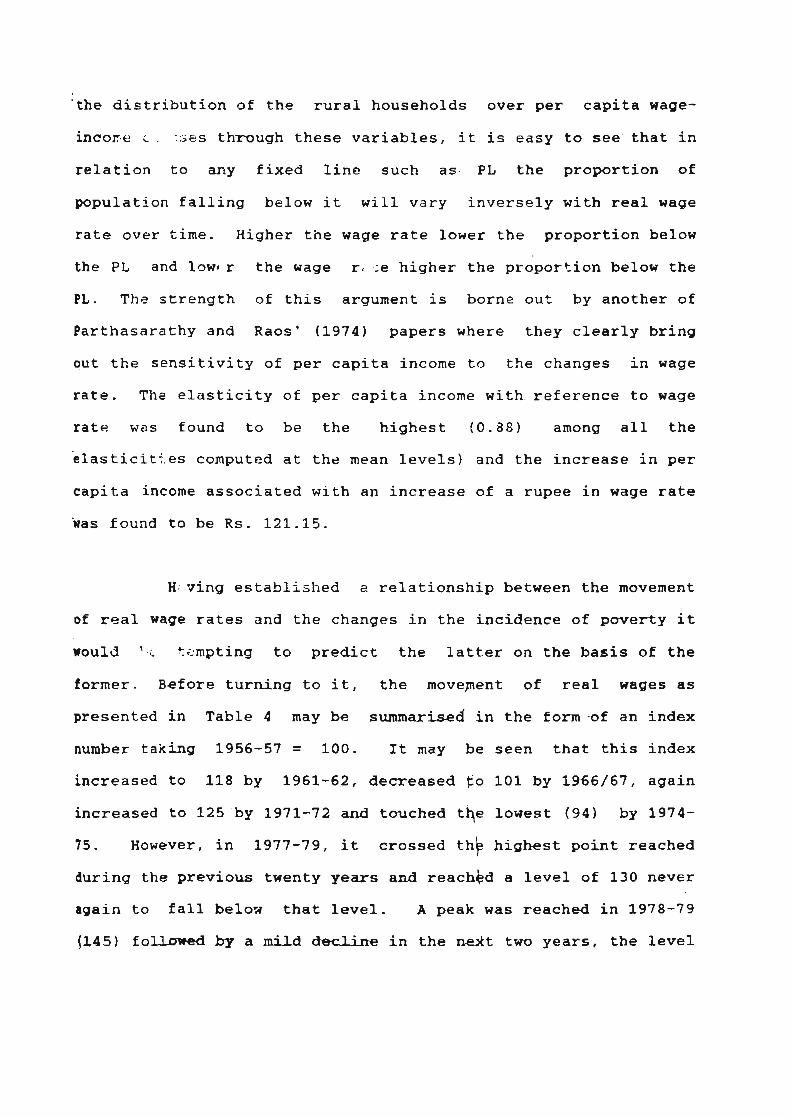
"the distribution of the rural households over per capita wage-
inco~e L . . :ses through these variables, it is easy to see' that in
relation to any fixed line such as. PL the proportion of
population falling below it will vary inversely with real wage
rate over time. Higher the wage rate lower the proportion below
the PL and low( r the wage rl ,;e higher the proportion below the
PL. The strength of this argument is borne out by another of
Parthasarathy and Raos' (1974) papers where they clearly bring
out the sensitivity of per capita income to the changes in wage
rate. The elasticity of per capita income with.reference to wage
rate was found to be the highest (0.88) among all the
e1asticitj.e~ computed at the mean levels) and the increase in per
capita income associated with an increase of a rupee in wage rate
was found to be Rs. 121.15.
H, ving established a relationship between the movement
of real wage rates and the changes in the incidence of poverty it
would ' . c tempting to predict the latter on the basis of the
former. Before turning to it, the movepent of real wages as
presented in Table 4 may be summarised in the form-of an index
number taking 1956-57 = 100. It may be seen that this index
increased to 118 by 1961-62, decreased to 101 by 1%6/67, again
increased to 125 'by 1971-72 and touched tbe lowest ( 94 ) by 1974-
75. However, in 1977-79, it crossed thb highest point reached
during the previous twenty years- and reached a level of 130 never
again to fall below that level. A peak was reached in 1978-79
(1451 fol&med by a mild declirte in the d t two years, the level

dropping to 132 by 1980-81. From then on the increase was sharp
and by 1984-85 the level was over 70 percent higher than the
level in 1956-57.
Turning now to the question of prediction of incidence
of poverty, although the years in which the peaks and troughs
occur may be predicted with accuracy - the troughs falling in
1971-72 and 1978-79 and the peaks falling in 1974-75 and 1980-81
- the predicted values of the incidence of poverty will be
different from the actuals because the relationship is mediated
through the worker-population ratio and the annual number of day#
of employment .a As changes in wage rates get translated into
changes in per capita incomes through these factors, in order to
gain a given absolute increase in per capita income more than
proportionate increases i n wage rates will be required farther
below the values of worker-population ratio and the number of
days of employment are from their respective mean values.
This more or less completes one stage of analysis.
Starting with the near cyclical fluctuations of the incidence of
poverty the discussion has passed on to the near cyclical
fluctuation of the real wage rates establishing the necessary
links on the way. Now, the question is no more the cyclical
fluctuations in the incidence of poverty but that of the cyclical
fluctuations in the real wage rates. But the movement of real
wage rates is in essence the movement of money wage rates in
relation to prices. This is taken up in the next section.

A careful examinatio., of the temporil movement of money
wages of agricultural labourers as reported in the Agricultural
Wages in Xndia showed that this movement is -of a specific type.O
A close look at the signs of annual percentage changes of money
wages for the thirteen states showed that there were only a few
aegative signs - less than 10%. Among the annual percentage
changes bearing negative signs there were a few with magnitudes
above t w o percent; mostly they w e r e close to zero. This goes to
rhow that money wages of agriculfural 'labourers are downward
s t i cky .
Turning to the magnitudes' of the annual percentage
bhanges, it was observed that consecutively low figures over four
or five years were followed by high figures over the next two to
three years. It may be inferred that moneywages tended to
stagnate or increase slowly over a period of .four to five years
to be followed by sharp increases in the nex? two to three
years.6 This pattern was seen to have repeated over the last
thirty years or so. This is sununarised in Table 5 . As is
evident, there is a remarkable uniformity across the states of
*India as far as the pattern is concerned. The diff erenoes b- the
magnitudes are also not very large as the coefficient of
variation is w e l l below 40 pement for a l l the phases. And these
differencm are mainly owing to the behavloux of money wage rates
in Gujarat, Karnataka, Madhya. Pradesh, Maharashtra and Orissa
over certain periods the reasons for which shall become evident,
to some extent, when the discussion of prices are takenup.
Overall the movement of money wages of agricultural labourers may
then be characterised by a step-mwement.
(Table 5)
Now, the question is why do money wage rates of
agricultural labourer? increase in a step-movement? To answer
that question an cxa'hination of the movement of retail prices of
cereals needs be taken Lp. There are two reasons for taking the 1
prices of cereals instead of the often used Consumer Price Index
for Agricultural ~aboureis (CPIAL) . Firstly, what the labourern I
perceive especially during a period of rising prices, are the
prices of those commodfties which are dominant i n their
consumption basket. And if wage bar'gains take place at all they $
will be in terms of these pr' 7es. Secondly, CPIAL is a state
level index and its apblicability to phrticular regions within 8
state i s suspect.
The movement of prices of cereals has bean
characterised by cyclical fluctuations with some regularity and 8
strong trend element. The prices decxine rather slowly from r
peak through one or two years and then stagnate or increase
slowly over a period of four to five yeprs. During the next two
to three years the prices incrcease rpther sharply and reacha
peak. This pattern has repeated o*,r t)le last thirty years. So,
the movement itself had been marked dy clear peaks and trough.

This is suwnarised in Table 6. From the late fifties through the
sixties the cyclical fluctuations were rather pronounced and the
distance between two peaks was close to ten years.? In the
seventies a marked change had come about. Firtly, the distance
between the peak of the late sixties and that of 1974-75 was
shorter - less than seven years - compared to the distance
between the previous two peaks. Secondly, the decline that
followed the peak of 1974-75 was prolonged - the trough.was reached four to five years after the peak compared to one to two
years earlier. The increase that came later was also milder as
was indicated by the peak of 1981-83 which was 50% higher'than
the peak of 1974-75 only in one state. So much was common to the
movement of all cereal prices in all the states. But there were
some differences as well.
(Table 6)
The differences in the movement of prices were between
those of coarse cereals and rice and wheat. Firstly, beyond
1974-75 there were no clearly marked peaks in the prices of
coarse cereals. The levels reached during 1974-75 had not been
reached till 1985. They were either stagnating or declining
which was different from the movement of prices of rice and wheat
which were showing peaks again around 1983-85, although the peaks
themselves were at levels moderately higher than those of 1974-
75. The more pronounced differences were to be observed till
1967-69. Whereas the peaks for the prices of rice and wheat were

clearly marked the coarse cereal prices showed pronounced year to
year f luct!~ations. This is evi.lent from the xcurrence of peaks
between 1957 and 1961 and between 1965 and 1969 as is shown in
Table 6.
Putting the pattern of movement of money wage rates and
prices of cereals together, it may be argued that the sharp
upward movement of prices of cereals create the necessary
conditions for the labourers to bargain for a raise ir. the money
wage rates. And increases do come about as was indicated by the
timing of the sharp increases in money wage r a t e s . These
increases were always around the peaks of prices. It needs tobe
emphasised that the money wage response was tc the price
increases rather than the levels themselves. This is borne out
by the fact that the money wage rates did show sharp increases i n
the late seventies and early eighties when the level of prices
themselves were below the levels reached in the early to mid-
seventies in many states. However, the increases in money wage
rates were not fully compensating the increases in cereal prices
as would be evident from a comparison of the rates in Tables 5
and 6.9 SO, during this phase of rising prices of cereals the
real wages tend to decline leading to their downward phase. The
real wages begin their upward movement sometime durinc the phase
of declining prices because the money :wages were downward sticky
(recall the step-movement). The increase in real wages couldbe
quite sharp depending upon the decline in prices.

This more 3r less provides an explanation for, (i) the
cyclical fluctuations Zn r e a l wages (and in turn the cyclical
fluctuations in the incidence of poverty); (ii) the downward
shift of the peak in the incidence of poverty in the seventies,
and (iii) the differences in the behaviour of xroney wage rates in
Gujarat, Karnataka and some other states referred to above. The
explanation is through the behaviour of cereal prices tc9Bether
with t h s money wage rates. As to (ii), it may be recalled that
the upward phase preceding the peak of 1974-75 was short.
Although the rate of increase itself was sharp the short duration
could not push the real wages far down. The sharp upward
movement 3f prices, however, created the necessary conditions for
a sharp increase in money wages during this period - the highest
in most of the states. The decline in prices that followed was
sharp and the declining. phase itself was longer. These three
factors ' ogether effectively raised the real wages and
consequently brought the trough in the incidence of poverty down.
The p r i c z increases of the early eighties could not erode these
gains nai3ly because the upward phase of prices (which was sharp)
was accompanied by an increase in money wages and the increase in
prices itself in comparison with the earlier peak of 1974-75 was
moderate.
The pattern of money wage increases in Gujarat,
Karnataka, Madhya Pradesh .... etc. till 1971/72 referred to
earlier could also be explained in terms of the behaviour of
cereal prices in these states. These are the states in which the

share of coarse cereals in the total consumption of cereals was
fairly high and wage bargains in nost parts of these states must
be taking place in terms ' of the movement of prices of coarse
cereals. This movement of prices was marked by certain
peculiarities till the late. sixties which had already been
highlighted. The peculiarity was the lack of clearly marked
phases as* reflected in the occurrence of peaks between 1957 to
1961 and 1965 to 1969. The associated increases in money wage
rates were also spread out not conforming to the phases marked in
Table 5.
5. Concludina Observations
Cyclical fluctuations in the incidence of poverty, real
wages, and cereal prices are closely related. The whole process
is set off by the fluctuations in the price of cereals which art
the staple food of the agricultural labourers. The sharp
increases in cereal prices bring down the real wages leading to
an increase in the incidence of poverty. The fall in t h e price
makes for an increase in the real wages leading to a decrease in
the incidence of poverty. The key links establishing the
relationship between real wages and incidence of poverty are the
distribution of rural households over wageincome classes and the
elasticity of per capita income with respect to wage rates.
Both real wages and incidenc~ of poverty are, i n a
sense, derived variables and cannot throw any light on the

mechanisms making 'or their cyclical fluctuations. This
mechanism is the moncy wags recponse to the movement of cereal
prices - sharp increases in prices leading to a sharp increase in money wages and the downward ~tickiness of wages in the face of
decline and relative stagnancy in prices. This is the central
mechanism operating on the wage-price plane or the plane of
distribution of social product and the mechanism itself is the
wage bargain.
The fluctuations in the price of cereals themselves are
generated ultimately by the pattern of growth of output of
cereals which are obviously marked by certain regularities. What
are the factors making for this regularity, are they basically
natural factors - for instance, rainfall, or is the influence of
the very same price factor rather strong are some of the
questions cL importance in thic context.

Footnotes
She talks in terms of earner-population ratio. But in her own words, ' "earner-population ratios for rural labour households are a close approximation to worker-population ratios. ...." (Unni, 1988, p:A-60) For the sake of completion one needs to mention wage rates of female labourers. But given the pattern of novement of the ratio between the two (See Jose, 1988) , the argument of this paper remains unaffected.
Ideally the sixth phase of the cycle. should have been from 1978/79 to 1981/52. But lack of data necessitated a slight modification.
The predicted values will have a downward bias beyond 1977- 78. A rough computation showed that the predicted values for 1977-78 and 1983 were 35.2 and 23.7 respectively as against the actual values of 39.1 and 32.8 respectively.
Agricultural Wacres in India (AWI) data are often questioned on various grounds (Lal, 1976; Rao, 1972). There are two carefully written theses in the Centre for Development Studies, Trivandrum, India (Baby, A.A., 1986; Sridhar, V. 1987) which have examined the merits of these criticisms and concluded that for inter-temporal comparisons they are the best data.
The sharpness of the pattern is greatly blunted when aggregated data is used. To see it in all its sharpness one should examine the data at the district level for individual operations as is carried out by Baby, A.A. and Sridhar, V. in the theses referred to in footnote 4.
The pattern comes out much better when phases are worked out! separately for each state (and districts within the state!)
There is a problem of kind payment of wages. In the AWI these are reported in cash equivalents. But such payments do not seem to constitute a major component of the wages. If they had been then the price cycles should have got transmitted as cycles i n money wages which are not to be found .

m31e 1 cyclic- iq&g&-Incideace .of .Rural Pomrtv in India _------------------------------------------------------- Phase Phase Change in the (gercen- Phase length Rate of No. centage of 1 population change
in poverty (years) ( % I --------------------------------.--------------- (1) (2) (3) (4) (.5 -------------------------- ------------------ 1 1956-57 to 54% to 39% 5 3.00
1961-62
5 1974-75 to 50% to 39% 3 3.67 1977-78 ___---------------------------------- -----------
Source: Mellor and Desai (19851, Table 18.1 for columns 2. and 3 Note: The end-point of the first phase and the starting-point
of the second phase have been changed from 1960/61 to 1961/6,2.
Ts%le 2 Number of Dafts of Employment to Population Ratio for
Rural Labour Households
Number of Days of Employment to Population Ratio --------------------------------------------.
State Male Female 1964-65 1974-75 1977-78 1964-65 1974-75 1977-78
--------9----------------,,,
~11-Xndia 192 178 206 90 . 89 92 Andhra Pradesh 199 181 194 129 110 121 Bihar 173 173 246 60 73 83 Gu jarat 243 189 210 155 129 110 - Karnataka 199 186 137 171 . - Kerala 134 111 125 70 53 58 Madhya Fradesh 193 189 232 107 103 136 Maharasttra 207 202 207 129 145 133 Orissa 201 149 200 67 60 71 Pun jab ' 234 190 219 40 51 48 Ra jasthan 177 218 171 96 111 97 Tamilnadu . 167 135 174 98 90 100 Uttar Pradesh 166 185 196 48 65 56 West Bengal 237 197 222 49 53 47
Source: Computed from Unni, Jeemol (19881, Tables 2 and 4.

Table 3
E A&&g&pb~irboa Signs of the lopual Perwtane.Cbasures& Bal WL o ran llklcl and Incidence 3f Pooertfi --------------------------------------------------------------____ --
Signs cf annual changer of Real wages a t ag r i cu l tu ra l labourers by d t a t e s Sip: If h Year ----------------------------------------------------------------.---- dlrlti d 1
lndhra Assan Bihar Cujarat Iarna- Xerala Madhva Yaba- Orissa Pnnjab hril- Vttar l k t t duct @f Pradesh taka Pradesh r a sh t r a - nadu P r a h b Mqal 1111. ------------------------------------------------------- ----- a
4
1956-5: . . ,. .. . . . . . . . . . . . . .. .. . . . . .. 1957-58 t - - 4 t + + - - + - + - 1958-53 + - - + + + + - - t - + 1959-60 + - + + + z - - + - + + 1962-61 + - + - + + - + + + - + + 1961-62 + - + - + t - + + t - + + t
-----------------I_--
1961-63 - - - - 4 + - - - + + + - t
1963-64 - - - - - - - - - - - - 4 t
1965-6! - - - - - - - - - - t - + + 1965-66 - + - + + + - - - + - + + t 1966-67 - - - - - - - - - . , i + T
4 -------- - ---- 1967-68 t + .. + + t + t - + + t - I
1968-69 - + + + - - + + .. + + + + 1969-70 + t + - - - + + .. + - - + 1971-7 I t - + . t + + + - + + + + - --------------------------------U_- - -......ILL
1971-72 - - - t t + - - - - - + + 1372-73 - - - - - - - - - - - - -
.1
1973-?4 - - - - - - - - - - - - x
1974-75 - - - - - - - - - - - - - I* ----
1975-76 z t + + + + + + + t + + ,, 1916-77 + + + + t + + + + + - + + .. !977-78 b + - - + + - + - - - + .. - 1978-19 t - - + + + + + + + + + + I$ ----- -197943 - - - - + + - - - - + - -
I.
1940-11 + - - + + - - - - - - *I --------- 7"
1981-12 + t + t + + + + d + - t - .. 191243 + + t L t + + + r + - A - ,, 1983-14 + + + + - - + t '+ + - + + .. 194 1-8 5 t + + + + + + + + t + + + .. -- f
Source: Jose (1988). :able 181 and Chcs-o lI9891, Table 1.
Rote : Phen a s ing le obser ta t ion r a s rissing i n t e r p o l a t i o n was r e so r t ed to.

Average Acnua1 Pe.csi i tage chance of Real Wages of Agr icu l tura l Labourers ;K;!e! o------------------. -------------------------------- -----------------------.. -------------------------------------
i*:::agts 5j j j t a teo ........................................................................................................... Phase A3dbrs Assar Bihzr Gujarat Earca- !erala Hadhya Haha- l r i s s a Punjsb 2arii U t t u Pes t
k a d e s t tat.; Pra6esh r a s h t n ladu ?sadesh 3etgaI .----------.------------------------------------------------------------------------------------------------------------- I'b'57 to 3 . 2 -0 .9 4 4.9 3 .2 3 . 5 3 . 9 3 .6 4.2 3 . 9 1.2 ?.7 1 .9 I i i i 2
....................................................................................................................... 1 -C.39 -?.59 - - @ . 4 5 -0 .92 -I!.?? -0 .64 -0.45 -0.52 -0 .34 -0 .25 -0.43 -0.68 ..--------------------------------------------------------------------------------------------------------------------
brrt: 1. Jose (1985) Tablas i2A and 12B; 2 . Ahl . l . .? l ia 1 1 3 7 8 ! , Table ] ! a !
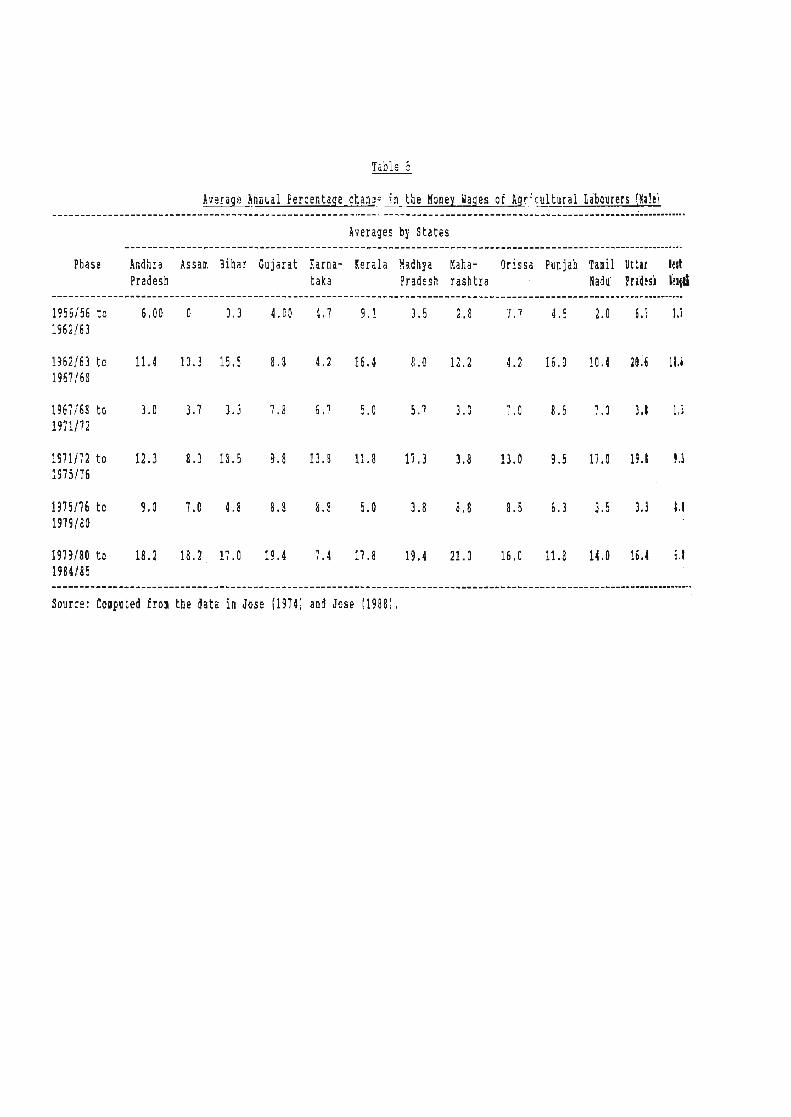
Table 5
Average AnnuaI Percentace cham: !n the Money #ages o t Agt;cultural Labourers !Na!eJ
Averages by States ------------------------------------------------------------------------------------------*---*----
Phase Andhrs Assar Bihar Gujarat Earna- Xerala Nadhlja laha- rJrfssa Punjab Taril Uttar I& Przdesh taka Pradesh rashtra Badu' Prt'td leiia
-----------------------------------------------------------------------------------------------------*--.------.-. 1956156 t c 6 0 0.3 4 . 0 9 4.7 9.! 3.5 2,8 7.7 4.5 2.0 6,? 13 1462!03
197?/80 tc 18.2 18.2, 17.0 lp.4 7.4 17.8 19.4 21.0 16.0 11.8 1 4 . 0 16,1 ;.I 1984185 -----------------------------------------------------------------------------------------------------------..----. Source: Computed fron the data in Jose (1974) and Jose !1988!,

; --
0--
1 -
:=
-
I -c
l
I
I
w
I
I a
I
I
rn
I
I
UY
I
I
D-
I
I
I
I
I
I
I
I
I
I
I
I
I
1
I
I
I
I
II
II
II
I
I
1
I
I
I
I
1
I 1
I
I
I
I
I
I
I
I
I C
.-.
I C
C
I
CL
IW
I w-
I m
~n
I Q
I-
I c-."
1-
00
I
I
I
I
I
I
I
I
I
1
I
I
1 b
4.
4 I
WC
I .ow
1 %OW
I
0-0
. I
... am
1
00
-a
l I-.-
I
I
1
I
I
I
I
I
I
I
I w
.-.
I
-I.-.
I ro
w I
\D
ID
I
--I
-.a
I -a -
I I
CIP
-
I .7
.-
I
I
I
I
I
I
I
I
I
I
I
C-.I
b-.
I I
-*
1
-
I
nY
l
aD
1-
1
.a
I
I
I
I
I
I
1
1
I I
I
I*
I I
I NW I W
U
I.
. I
-.
I W
QI I 'm
w
I
-I
A
If
. I
..
I m
<II I
*L
O*
I
I
--
I
WI
N
I
01
CI
I
-I
.
I
Cn
l
c-.
I
--I -
I
I
I
I I
I I
I w
I
OI
W I
W.L
L
I.
. I.
I
I w
-
I W
OD
I
-1
-
I
CI
w
I
01
D
J
I
-I
-
I
=I
-3
I -
I
I
I
I
. -- -
1 -
Ez
-7
.
? P =-
? =:'- -! =
r =
l
Ct
l
IC
-I
C
cf
-
-c
.
-- i
~z
ike
i L
I '"
I.-?
" I"
cr
:=
:"
':
zz
:~
~
;E
m :
--
I-
I --
1
-Y
I r
I L
, I
Y
I -
I
CI
I
1 --
I
YX
lO
n%
l-
Wl
V
I
1 p
.rd
I P
lP
I
m,
: 5
1
-d
m
I
I -
1w
c I
C1
I4
1
1
-c
(
I
I -P,
I
a1
I-
8
or I
*
I
I
I
I -mJ
I
-1
*
I
I
1
I
I
;c ;
-
1-
4
I
I
a
I
I
I
: g:
I
rn
10
)
I
I
rn
I
I
I
1
I
1
0-I.n
I
I
IW
1
I
I
1
I
1
03
I
I
I
13
I
I
I
I
: "-
I
I
I
I
I
I
I
I
I
I
I
I
1
I
I
I
I
I
I
I
I
I
I
I
1
I
1
1
I
I
I
1
I
! I
I
I
i I -
I N
I
I
1
. 1
I
I -.-
- I 1
1
I -
Il
l
lo
11
ll
11
lw
.4
D1
I
I
I
I
I
I
I
I
1C
,.
cl
l1
11
11
11
11
11
l1
11
I
I
I
I
I
I --am
I
I
I I
I
1
I
I
I
I
I
I
I
I
I
I
I
I
I
I
I
I
1
I I
I
I
I
I
I
I
I
I
I
I
I
I
I
I
I
I
I
I
I
I
I
I
I
I
I
1
I
t I
I
I
I
I .-
I
I
I
I
I
I
I
I
I
I
SL
I
I
I
I
I
I
I
I
I
I
I
I
I
I
I --
I
Crc
-.
I~
-~
~~
~~
~-
~-
CI
Y~
I~
*I
LC
..
IM
MI
~L
I
I arb
o&
w8
wa
@-
-8
--
1w
wh
-w
1e
wI
\o
rD
8w
a
I
I QIL~
I m
- I m
~n
I m
u. I m
n, I m
m I
~n
~n
I
I cn-
I c
nm
I
I I-.-
I ,-.a
1 c
- l +
--a
l
ca
w l
-I-
. 1
a-
4 1
-0
I
WC
O
1-
0
I
I
I
I
I
I
I
I
I
I
I
I
I
I
I
I
I
I
I
I I
I
I
I
I
I
I
I
I
I
I
I
I
I
I
I
I
I
I
I
I
I -
1
I
I
I
I
I
I
I
I
I I I
I
I
I
I
I
I
: -2
I C
C
I I-.-
1 *-
.-
I .--*..
I C
.w
I .-.
& I -*-
I
a--
I
I
.-.*
- I
I
I F-. .-
I s
o w
1~
w1
~-
1*
w1
wa
1w
~1
-r
o1
ww
I~
u~
I-
~
I
I
0. -
I ~
1.
n
I
--q
rn
I
-a
m I -3-
I 4
~1
I -a
m I -3-
I a
>a
- I 0
1-
I
I
ua
-2
I
.m-
I --
I 0-
I o
m I o
w I e>-
I -
4 I w
--I I
-a-
I
I
I
I
I
I
I
I
I
I
I
I
I
I
I
I
I
I
I
I
I
I
I
I
I
I
I
I
1
t.
I
I
I
I
I
I
I
I
I
I
I
1 ur
I
I
I
I
I
1
I
I
I
I
I
I -
I .-
--
I
I
C.
.I
LU
I~
CI
C1
C1
I~
C1
l-
~l
*-
C1
~C
lL
- I
l row
I l - l
l WW I --
l ee I
l
SO
W I
W-
I U
JW
I
I -2 4
1
4 I
-a
4 I 4
4 I
4-
.a
I -3-2
I 4
.d
I
4-
4 I -ah-> I
-a
-a
I
I
rn
h
I
cm I
rn
m I a- I -
m
I 0
.b
I --
I me
n I
-rC
-
I
w~
n
I
1
I
I
I
1
I
I
I
I
I
I
I
I
I
I
I I
I
I
I
I
I
I
I
I
I
I
I
I
I
I
I
I
1
I
I
I
I
1
I -
I
I
1
1
I
m
1
I
I
I
I
I
I
2.5 I
.- I
I
I
I
I
1-
I
W
I
I
-I
W
I
-0
N
I
WI
W
8
*A
I
P
I
I
I
I
I
I
I
I
I
I
I
I
I
I
I
I
I
I
I
I
I
I
I
I
I
I
I
I
I
I
I
I
I
I
I
I
I
I
I
I
I
I
I
I
I
I I
I
I
I
I
I
I
I
I
I
I
I
I
I
I
I
I
I
I
I
1
I
I
I
I
I
I
I
I
I
I
I
I
I
I
I
I
I
I
I
I
1
I
I
I
I
I
I
I
I
I
I I
I
I
I
I -
I
I
I
I'
I
IY
I
I
I
I
I
1 -4
I
I
I
I
l cllm
l
I
I
I
I
I -
I
I
I
I
I.
. I
I
I
I
I*
*
1
I
I
11
11
11
l1
1l
~0
1l
11
1l
1l
11
11
11
1
I
I
I
I
I
.-- I
1
I
I
I
I
I
I
I
I
.I
I
I
I
I
1
I
I
I
I
.I
I
I
I
I
I
I
I
I
I I
-1
1
I
I
1 I
I
I
I
I
I
I
I
I
I
I
I
I
I
I
I
I
I
I
I
I
I
I
I
I
e I
I
I
I
I I
I
I
I I
I
I
I I
I I
-
I I
# W
C J
I I C
I I
I -3
-
I U
W I D
w I +
I-
I --
I C
nw
;
\O:e
1
0-
I
I urn I w
4 lo
- I s
nm
I ---A
I -
0
I m
8
..
I
..
I
-.
I.
-
I.
.
I.
. I
..
I
..
I
-.
I -
I Q
IQ
I
1m
~1
~~
1~
m1
~0
1-
4~
10
~1
4b
31
~0
1~
0
I
-1
--I
I
.-I
-1
-
I
-1
.-
I -..
I
I -
I
I
C-.
I
-1
&
I
NI
W
I
+&
I
-I
-
1
-2
1
W
I
I
- I
DD
I
OI
-
I
-I
-
I
UI
-
I
-.,I
ar
I
1.
8
-. .
I
.I
.
I .
I
.I
-
1 -
I .
I.
I
I0
I
PI
C
AI
<
&I
-
41
4
1
-1
W
I
-1
C
I
I
--
I
-I
-
I
--I
'-
1
I
.-I
--I
.-
I
..,.. I
I
I
I
I
I
I
1
I
I
I
I I
I
I
I
I
I
I I
I
I I
I
I
I
I
I I
IC
-
II
LI
I
1 l
wI
C.
--
I
1-
1-
:
IC
I --
I -a.
I am I
0s
-
I
cm
-
I o
*w
I
--a
I
08
0 I m
--1
I p
o
IW
I ""
I
..
I.
.t
..
lr
-I
..
I.
.l
..
I.
.~
.
I --
I P
+
I
I --
I ua-
I
~S
O
I ~m
I --
I -4-
I --
I mw
I
I
.- I
I
.-.I
--I
--
1
--I
--I
--I
.-I
--
I
1 N
I
CI
-
I
L.
1
-1
4
1
-8
-
I
-I
,a
I
I0
I
-1
W
I
.*I
- 1
C
"I
c
rl
-
1
,I ,
I
1.
I
I
.I
.
I @
-I .
I .
I
.I
.
I.
1
I
cll
I
&I
-
1
-a
t
--
1
01
W
I
-1
rn
I
I
- I
--I
-1
-
1
I
.--I
'-
1
I
-1
"-
I
I
I
I
I
I
I
I
I
I
I
I I
1
I
I
I I
I I
I I
I
I
I
I
I
I I
1-
I I
1-
l
ea
I+
.
Ib
-
I I
I
1
1 -.-
I I
I
w-
~-
~I
W~
I~
~~
W~
~C
..
~I
O~
IO
.)
PI
N~
I C
I ""
I
I.
I.
.I
..
I.
.I
..
I -10
a
I 4
-
I -6
I o
o I O
C) I -
-I
Lh
z:
Lh
-: ;D
L
I -
lI"
1I
-1
I
--I
-1
-
1
I
-.I
I
.m,
I
ml
W
I -
I
01
-
41
U
I
-I
-
1
0
I
I.
I
O
II
-
1
01
.
I
-1
-
1
Yl
-
1.
I
10
I
VI
I
t-.t
-I
4
1
OI
-
I .
I .
I C
. I
--
I
*-I
-1
*
I
-1
.-I
-1
W
I *
I -
I
I
I
=I
I
'-
I
I
I
I
1-
1
-1
-1
I
u
1 I
I
I
I
I
I
I
I
I
I
I
I
I
I
I
I
I
I
I
I

----------------------------------------------------------..---------------------------------------------------.--- {I! ( 2 ! ! 3 I i 4 1 i 5 ) !6 ' i?! IS! I!/ (it! ----_----_------------------------------.--__-----_-__-------------.----------------------.-..-..-
Andhra Pradesh 1957 1365 i9E8 l!?5 1981 4.5(26.2) 7.t119.81 !6.2i19.3! l.l~l!,l~ !Ayderabadl 1958 1966 !97G 1978 -12.8 -17.2 -10.8 -1.1 ------------------------------------------------------------------------------------------------------------------ Yadhza Pradesh 1957 - 1?69 1314 !9#1 - 6.t(!2.1! 26.0!56.61 0 !If.!] IYjain) 1961 - 1916 1578 - - -9.3 -1.4 -9,1 . --------------------------------------------------------------------------..-----------------------------------.-..- Karna t aka i959 1965 - i973 !921 10.3135.7) - 14.1(37.81 2.6l!l,ll (Raichur 1 1961 1966 !315 - -i8.9 - -8.3 -6.1 ------------------------------------------------------------------------------------------------------------.-.-.-.- U t t a r Pradesh - _ 1967 1974 1983 - 5.5131.8) 3.1117.1) i ! Jhans i l - - lC68 1976 - - - -43.3 -16.7 ---------------------------------------------------------------------------------------------------------------....- Taa i lnadu 1960 1965 1369 1975 1983 3 4 . 2 7.:!34.21 16.7[48.9! !.ll!?.ll !Cciabatore) 1963 1966 1970 1918 - -6.5 -34.6 -10.1 -11,2! ---------------------------------------------------------------------------------------------------------------.-..- Gu j a r a t - - 1967 1915 I985 - - 10.1 (15.71 1.3iIl,4 IRajkot) - - 1971 1376 - - -6.6 -31.1 --------------------------------------------------------------------------------------------------------------------
Bajrs
Andhra Pradesh 1957 1965 - 19?5 1983 5.2131.3) - 12.0(10.11 4.5(1.ll (Ayderabad) 1'158 1966 - 1976 - -21 .7 -18.5 -13.1 ----------------------------------------------------------------------------------------------------------.----.-..- PJujarst. - - 196? 1915 1991 - - 11.7 116.21 IJ?!!Jl ( Ih redabad i - - !911 1976 - - -6.1 -41.1 ................................................................................................................. Naharash t ra 195' 1955 - 197 5 - 15.0(77.9! 6 . 6 dtcliliy ihhrednagarl 1958 1967 - 1979 -16.0 - -8.2 .-!,I
Tar i lnadu 1961 I965 1969 1975 1981 8.9131.31 9.2 (29.0) 16.7(48.9) 1.1111.11 !Salem1 1963 1966 19?3 1978 - -9.3 -23.1 -22,5 -11.1 - - - - - - - - - - - - - - - - - - - - - - - - - - - - - - - - - - - - - - - - . Yarnataka 1361 i956 - 1975 1981 26.7i57.1) - 5.7!9.8) 2.1144.!! (Kc la r ) 1363 1970 - 1978 - -10.0 -6.0 -13.1 -----------------------------------------------------------------------------------------------------------------.. NsChys Pradesh 1961 1967 19?1 1311 - 33.6i55.0) 7.1 (11.01 1.111!.1 !Sagar) 1963 - 1971 1976 - - -6.4 - 3 6 , 5 -19s
1 ----------------------------------------------------------------------------------------------------------------..- Source: N i n i s t r f of Agri:ulture, ~ icu~tura l -? r jc~~s_- in~-I .nd ia t ~ a r i o u s i s sues )
l o t e : I. P r i c e d a t a a r e t aken f o r ane c e n t r e in each s t a t € . 2. The lower f i g u r e s in c2lnmns 2 to 6 a r e t h e trcaghs and t h e cor responding f i a u r e s in colurns ? to 11 ae
the averam annual octccnt.anc d o c l i n ~ .

Ahluwalia , M I S . 1978
~Bardhan, P.K. 1974
Bardhan, P.K. and Srinivasan, T. N. t eds) (1974)
Ghose, A.K. 1989
Government of India
Jese, A.V. 1974
Xokwani, N.C. 1980
La1, Deepak, 1976
Rural 1 ~verty and agricultural performance in India, Jounral of Development Studies, Vo1.14, No.3.
Trends in Aaricultural Waaes in Kerala : 1960-80., M.Phi1 Dissertation submitted to the Jawaharlal Nehru University, New Delhi (unpublished).
On the incidence of poverty in rural India in the sixties, in P.K. Bardhan and T.N. Srinivasan (eds) , 1974.
Poverty and Income Distribution in India, Calcutta, Statistical Publish- ing Society.
Poverty, agricultural production and prices in rural India - a reformulation, camb_r_idqe. JournaL of Economics, Vo1.13, No.2.
Rural poverty and relative prices in India , Cambr id-~se--_J_uUrnal- _q$. Eco.nom3c.g, Vo1.13, No.2.
AariculturaJ-Wacres in India, Directorate of Economics and Statistics, Ministry of Agriculture, Delhi.
Agricultural Prices in --r.nS!&!, Directorate of Economics and Statistics, Ministry of Agriculture, Delhi.
Trends in real wage rates of agricultural labourers, - Economic - - .- - - - -- - and . - Pol-iti-cal Weekly, Vo1 .9, No. 13, Review of Agriculture, March 30.
Agricultural Wages in India, Economic and..__P_sl..i._t.i-cal-- ..Weekly, Vo1- 23, No. 2 6, Review of Agriculture, June 2 5 ,
Income Inequality and,4,4PPooverFty : Metho-ds of-E.sti_m.at.ion-.. an.-.Po.l-icy .A~?~li-cqt_i_qns, New York, Oxford University Press.
Agricultural growth, real wages and the rural poor in India, Economic and Political Weekly, 701.11, No.26, June ---- 26.

Mellor, J.W. and Desai, G.M. 1985
Mellor, J.V. and Desai, G.M. (eds) 1985
Minhas, B.S. 1974
Parthasarathy, G. and Rao, G.D.R. 1973
Parthasarathy, G., Rao, S.V. and Rao, G.D.R. 1974
Planning Commission, Govt. of India 1980
Rao, V.M. 1972
Sen, A . 1981
Sridhar, V. 1987
Unni, Jeemol 1988
Agricultural Change and rural poverty: e synthesis, in Mellor, J.W. and Desai , G.M. (eds) 1985
Auricultural Chanqe and Rural Poverty : Variations on a Th-eme by Dharm Narain, Baltimore, Johns Hopkins University Press.
Rural Poverty, land distribution and development strategy: facts, in P.K. Bardhan and T.N. Srinivasan {eds) , 1974.
Emmpl oyment and unemployment among rural 1 aborlr households, - Economic ant Political Wee&, 'Jo1.8, No.52, Dec. 29 ---.-.-.-
Character of poverty among rural labour: A study of West Godavari District, &comic -end Pol_it&caA Weekly, Vo1.9, No.13, March 30.
Sixth .- Five - ..... .- Year .Plan ,.. l980-85, New Delhi.
Agricultural Wages in India - a reliability analysis, ~ndian..Journal ,of Aaric~-Lt~r_a1.--~c-oonomA-c_s_, Val -27, Noe 3, July-September.
Poverty and Famines: A n Essay on - Entitlement and Deprivation, Oxford, Clarendon Press.
Acfricul tural Wage-s in Tam&J-nadu: 1950-5% to 1,980-81, M. Phil Dissertation submitted to the Jawaharlal Nehru University, New Delhi (unpublished)
Agricultural labourers in rural labour households, 1956-57 to 1977-78 : Changes in employment, wages and incomes, E_cnmi.c --.,- and . Poli tical Weekly, Vo1 .23, No.26, Review of Agriculture, June 25.
This work is licensed under a Creative Commons Attribution – NonCommercial - NoDerivs 3.0 Licence. To view a copy of the licence please see: http://creativecommons.org/licenses/by-nc-nd/3.0/