working for nothing: the supply of volunteer labor
TRANSCRIPT
Working for Nothing: TheSupply of Volunteer LaborThe Harvard community has made this
article openly available. Please share howthis access benefits you. Your story matters
Citation Freeman, Richard Barry. 1997. Working for nothing: The supply ofvolunteer labor. Journal of Labor Economics 15(1) Part 2: S140-S166.
Published Version doi:10.1086/209859
Citable link http://nrs.harvard.edu/urn-3:HUL.InstRepos:4632239
Terms of Use This article was downloaded from Harvard University’s DASHrepository, and is made available under the terms and conditionsapplicable to Other Posted Material, as set forth at http://nrs.harvard.edu/urn-3:HUL.InstRepos:dash.current.terms-of-use#LAA

National Opinion Research Center
Working for Nothing: The Supply of Volunteer LaborAuthor(s): Richard B. FreemanSource: Journal of Labor Economics, Vol. 15, No. 1, Part 2: Essays in Honor of Yoram Ben-Porath (Jan., 1997), pp. S140-S166Published by: The University of Chicago Press on behalf of the Society of Labor Economistsand the National Opinion Research Center.Stable URL: http://www.jstor.org/stable/2535404Accessed: 24/12/2009 16:00
Your use of the JSTOR archive indicates your acceptance of JSTOR's Terms and Conditions of Use, available athttp://www.jstor.org/page/info/about/policies/terms.jsp. JSTOR's Terms and Conditions of Use provides, in part, that unlessyou have obtained prior permission, you may not download an entire issue of a journal or multiple copies of articles, and youmay use content in the JSTOR archive only for your personal, non-commercial use.
Please contact the publisher regarding any further use of this work. Publisher contact information may be obtained athttp://www.jstor.org/action/showPublisher?publisherCode=ucpress.
Each copy of any part of a JSTOR transmission must contain the same copyright notice that appears on the screen or printedpage of such transmission.
JSTOR is a not-for-profit service that helps scholars, researchers, and students discover, use, and build upon a wide range ofcontent in a trusted digital archive. We use information technology and tools to increase productivity and facilitate new formsof scholarship. For more information about JSTOR, please contact [email protected].
The University of Chicago Press and National Opinion Research Center are collaborating with JSTOR todigitize, preserve and extend access to Journal of Labor Economics.
http://www.jstor.org

Working for Nothing: The Supply of Volunteer Labor
Richard B. Freeman, Harvard University, National
Bureau of Economic Research, and London School of Economics
Volunteer activity is work performed without monetary recompense. This article shows that volunteering is a sizeable economic activity in the United States, that volunteers have high skills and opportunity costs of time, that standard labor supply explanations of volunteering account for only a minor part of volunteer behavior, and that many volunteer only when requested to do so. This suggests that volunteer- ing is a "conscience good or activity"-something that people feel morally obligated to do when asked, but which they would just as soon let someone else do.
Millions of Americans work part-time for nothing. They volunteer time to churches, charities, cultural organizations, hospitals, or colleges, raising funds or helping those institutions carry out their functions. While some may think of volunteers as society ladies who give an hour or two a week to the Junior League, much volunteer activity comes from employed persons with high productivity and opportunity costs of time-prime- age college-educated workers.
What induces people to volunteer? How important are substitution and income effects in the decision to volunteer? Should we think of volunteering as standard consumer behavior, or does it depend on "some- thing extra" along the lines of Ben-Porath's (1980) "F-(family, friends, firms)-connection" analysis?
In this article I examine these questions using the May 1989 Current Population Survey, which includes a supplement on volunteering that
Alida Castillo-Freeman provided efficient research assistance and valuable in- sights from her volunteer work experiences.
[Journal of Labor Economics, 1997, vol. 15, no. 1, pt. 2] ( 1997 by The University of Chicago. All rights reserved. 0734-306X/97/1501-0013$01.50
S140

Volunteer Labor S141
asked some 78,000 respondents about volunteer activities;' and the 1990 Independent Sector's Gallup Survey of Giving and Volunteering in the United States,2 which contains detailed questions on volunteer and chari- table activity of some 2,200 respondents. I find that standard labor supply substitution behavior, which predicts that people will volunteer less when the opportunity cost of time (wages) is high-explains only a minor part of differences in volunteer activity among individuals with similar demographic characteristics. Many people volunteer in response to a re- quest to do so. Their behavior is not "volunteering" in the dictionary sense of offering one's services freely but rather its opposite: acceding to requests. From this perspective, volunteering and other charitable activity that people do largely when asked are "conscience goods": public goods to which people give time or money because they recognize the moral case for doing so and for which they feel social pressure to undertake when asked, but whose provision they would just as soon let someone else do.
I. The Facts about Volunteering
Volunteer activity is work performed without monetary recompense. It creates social output that would otherwise require paid resources. Since people volunteer without pay, they must receive greater utility from the first hour of volunteering than from working for wages or from leisure. In equilibrium, they equate the marginal utility from the last hour of volunteering with the marginal gain from work or leisure. Volunteer behavior raises questions about tastes and social pressures that do not arise in standard analyses of work for pay. If most labor supply was
' The Current Population Survey (CPS) is the standard U.S. monthly survey of households. Each month it includes a special supplement on certain topics. The May 1989 CPS contained a short Supplement on Volunteer Activity. There were two previous such supplements on volunteering. It consisted of questions about time volunteered and the charitable organization to which the person volun- teered, as described in U.S. Bureau of Labor Statistics (1990). The primary volun- teer question is given in the text. The Statistical Abstract publishes summary statistics from the supplement (see U.S. Bureau of the Census 1994, table 614). The main virtue of this data set is that it links volunteering to standard labor force questions, to family structure, and for the outgoing rotation group to usual weekly earnings and usual hours worked. Because the CPS is a large sample, moreover, it provides the largest number of observations on volunteering for the United States.
2 Gallup Survey on Charitable Giving and Volunteering is conducted for the Independent Sector every 2 years. This survey contains detailed questions on volunteering and charitable contributions and is the best available data set con- taining information on both statistics. The survey procedures are described in Hodgkinson and Weitzman (1991), and tabulations are published in that docu- ment and in U.S. Statistical Abstract.
S142 Freeman
voluntary (as in some religious communes), we would certainly investi- gate it in a different way.
How much volunteering is there in the United States? Is volunteering sufficiently important to merit more than footnote attention from econ- omists?
To answer these questions, I have estimated the amount of volunteering in the United States from the May 1989 Current Population Survey, which contained a special module on volunteering; and the 1990 version of the biannual Gallup Survey of Charitable Giving and Volunteering, which is the main source of information on individual charitable activity in the country. Tabulations of volunteering from the Gallup Survey (U.S. Bureau of the Census 1991, table 624) show over twice as much time volunteered as do tabulations of volunteering from the CPS, posing a sizeable data problem at the outset.
The Current Population Survey data on volunteering are derived from the following questions:
Lead in: Now we would like to ask a few questions about unpaid volunteer work. This is the work that persons often volunteer to do without being paid at hospitals, churches, civic, political and other organizations.
Last week did do any unpaid volunteer work? Even though did not do any unpaid volunteer work last
week, did do any unpaid volunteer work over the past 12 months?
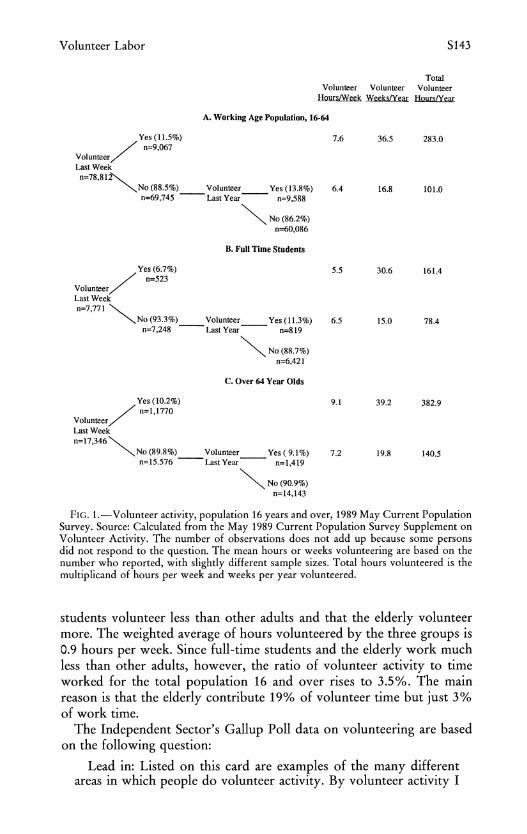
Figure 1 summarizes the CPS data on volunteering for persons aged 16 and over divided into three groups: adults aged 16-64 who are not full-time students, full-time students, and 65+-year-olds. Among the 16- 64-year-old adults, 11.5% reported volunteering the previous week; they volunteered for 7.6 hours per week on average over the previous year, giving 0.9 hours of volunteer time per person. The CPS also shows that 13.8% of those who did not volunteer the previous week volunteered at some time in the year, averaging 16.8 weeks of volunteering at 6.4 hours per week. The amount of time the population reports that they volun- teered over the year is, moreover, consistent with the amount last weeks' volunteers reported for the past week: hours volunteered per year by those who volunteered last week and those who did not average to 44.8 hours per person, or 0.9 hours per week (= 44.8/52 weeks).
How do these estimates compare to the time spent at work? In the May 1989 CPS 73% of the 16-64-year-old nonstudent population reported working the previous week, averaging 41.3 hours per week. This gives an average of 30.1 hours worked per person. The ratio of volunteer time to work time for 16-64-year-old adults exclusive of full-time students was thus 2.2% (= 0.9/30.1).
The tabulations for students and the elderly in figure 1 show that
Volunteer Labor S143
Total Volunteer Volunteer Volunteer
Hours/Week Weeks/Year Hours/Year
A. Working Age Population, 16-64
Yes (11.5%) 7.6 36.5 283.0 /n=9,067
Volunteer/ Last Week
n=78,8 12 No (88.5%) Volunteer Yes (13.8%) 6.4 16.8 101.0 n=69,745 Last Year n=9,588
No (86.2%) n=60,086
B. Full Time Students
Yes (6.7%) 5.5 30.6 161.4
/n=523 Volunteer/ Last Week n=7,771 \
\ No (93.3%) Volunteer Yes (11.3%) 6.5 15.0 78.4 n=7,248 Last Year n=819
No (88.7%) n=6,421
C. Over 64 Year Olds
Yes (10.2%) 9.1 39.2 382.9
/n=1, 1770) Volunteer/ Last Week n=17,346\
\ No (89.8%) Volunteer Yes ( 9.1%) 7.2 19.8 140.5 n=15.576 Last Year n=1,419
No (90.9%) n=14,143
FIG. 1. -Volunteer activity, population 16 years and over, 1989 May Current Population Survey. Source: Calculated from the May 1989 Current Population Survey Supplement on Volunteer Activity. The number of observations does not add up because some persons did not respond to the question. The mean hours or weeks volunteering are based on the number who reported, with slightly different sample sizes. Total hours volunteered is the multiplicand of hours per week and weeks per year volunteered.
students volunteer less than other adults and that the elderly volunteer more. The weighted average of hours volunteered by the three groups is 0.9 hours per week. Since full-time students and the elderly work much less than other adults, however, the ratio of volunteer activity to time worked for the total population 16 and over rises to 3.5%. The main reason is that the elderly contribute 19% of volunteer time but just 3% of work time.
The Independent Sector's Gallup Poll data on volunteering are based on the following question:
Lead in: Listed on this card are examples of the many different areas in which people do volunteer activity. By volunteer activity I

S144 Freeman
Hours/Week Yes (15.5%) 5.8 /n=342
Volunteer/ Last Week Hours/Month n=2,202 Yes (28.5%) 16.3
No (84.5%) n=531 n=1,860 - Volunteer /
Last Month\ Yes (20.9%) No (71.5%) n=278 n=13,296 -Volunteer
Last Year \ \No (79.1%)
n=1,051
FIG. 2.-Volunteer activity, population 16-64, 1990 Gallup Survey for Independent Sector. Source: Tabulated from 1990 Gallup Survey of Giving and Volunteering in the United States. For comparability with the CPS, I have excluded "Informal Volunteering"- that is, volunteer time that is spent directly helping someone rather than given to an organization.
mean not just belonging to a service organization but actually work- ing in some way to help others for no monetary pay. In which, if any, of the areas listed on this card have you done some volunteer work in the past 12 months?
As noted, these data show greater volunteer activity than does the CPS. My tabulations of the Gallup Survey, summarized in figure 2, report a much greater proportion of persons volunteering over the year than in the CPS. In the Gallup Survey 15.5% volunteered last week; 24.1% volun- teered last month but not less week (= .845 X 28.5); and 12.6% volun- teered last year but not last week or last month (= .845 X .715 X 20.9), for a proportion volunteering last year of 52.2%. But there is one area in which hours volunteered per adult are comparable between the two surveys: in the amount of time volunteered last week. Proportionately more persons report volunteering last week in the Gallup than in the CPS, but they report fewer volunteer hours than people in the CPS.3 As a result, hours volunteered in the population are 0.9 per week in both surveys.
The difference between the surveys thus lies primarily in the proportion of persons reporting that they volunteered last month or last year. The high annual hours volunteered in the Independent Sector's published summaries of the Gallup Survey are obtained by combining these figures with hours volunteered last month, on the possibly erroneous assumption
3 The Gallup Survey contains two questions on hours volunteered. The question on hours volunteered last week is coded in categories, whereas the question on usual hours volunteered is given in actual numbers. I use usual hours volunteered in my analyses, unless it is not reported, in which case I supplement it with the mean of the categorical hours volunteered last week.
Volunteer Labor S145
that persons who volunteer over the year give as many hours in a month as do persons who volunteered last month.
What might explain the difference in the proportions volunteering over the year? As the questions about volunteering are similar,4 the most plau- sible reason for the difference would seem to be the context in which they appear-which sometimes influences survey responses (Schuman and Presser 1981). The Gallup Poll focuses on charitable activity. Its numerous questions about giving and volunteering may have led people to remember more fully their volunteering or to label certain actions attending a Parent-Teacher Association meeting or church activity-as volunteering that they might otherwise have seen in a different light. By contrast, the CPS questionnaire on volunteering supplements a standard labor force survey, which does not highlight charitable activity, and thus might yield lower figures for this reason.
Which set of estimates offers a better guide to the amount of volunteer activity? The responses to questions about last week's volunteering, on which the CPS and Gallup surveys agree, are potentially more accurate than responses to questions about last year's activities. Thus, my best assessment is that volunteering augments work hours by 3% -4% in a week, though the magnitude could be as high as the 7% implied by the Independent Sector's estimates.
In any case, volunteering is a substantial economic activity economy- wide and critical to the charitable or nonprofit sector that accounted for 7% of U.S. national income in 1990 (Hodgkison et al. 1994, p. 4). Eighty percent of volunteering is in the nonprofit "independent sector," where volunteer time is one-quarter of labor input. Charitable organizations like the Heart Association, Cancer Society, United Cerebral Palsy Associ- ation, and Muscular Dystrophy Associated report that they use between 2 and 3 million volunteers, largely for fund-raising activities; the Boy Scouts rely on over a million volunteers; while the Red Cross estimates that it had roughly 1.4 million volunteers per year from the mid-1970s to the early 1980s. Valuing volunteer hours by total compensation of employees in the national income implies that it was worth roughly $116 billion dollars in 1991.5 Without volunteering, the country would need a much larger public sector or would lose considerable charitable, cultural, and educational activities.
4 The Gallup survey allows for informal volunteering, such as assisting a neigh- bor, that the CPS excludes. This is relatively modest in the Gallup survey and thus does not account for the difference between the Gallup and CPS estimates of volunteering.
5 In 1991 employee compensation was $3,291 billion dollars (U.S. Bureau of the Census 1993, table 666). Three percent of this is $99 billion; 4% is $132 billion. I give the average of these figures in the text. My figures are lower than those of the Independent Sector (Hodgkinson et al. 1994, table 1.4) because I have used a more conservative estimate of hours volunteered than they do.
S146 Freeman
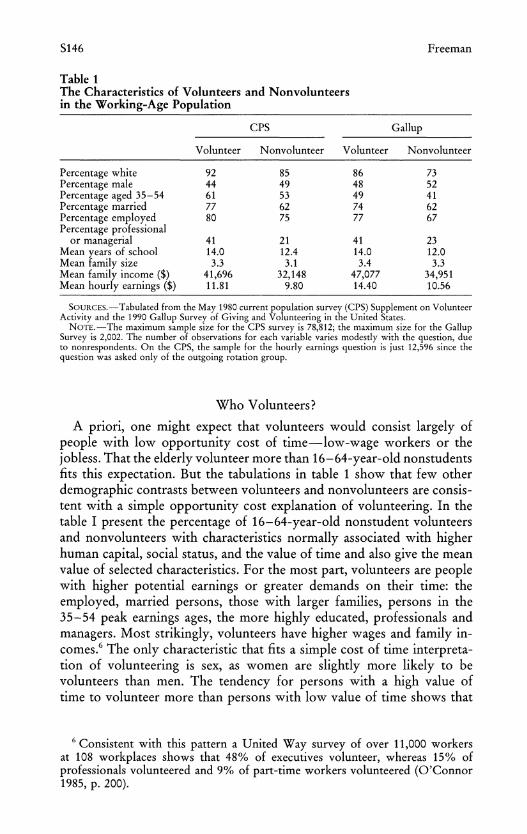
Table 1 The Characteristics of Volunteers and Nonvolunteers in the Working-Age Population
CPS Gallup
Volunteer Nonvolunteer Volunteer Nonvolunteer
Percentage white 92 85 86 73 Percentage male 44 49 48 52 Percentage aged 35-54 61 53 49 41 Percentage married 77 62 74 62 Percentage employed 80 75 77 67 Percentage professional
or managerial 41 21 41 23 Mean years of school 14.0 12.4 14.0 12.0 Mean family size 3.3 3.1 3.4 3.3 Mean family income ($) 41,696 32,148 47,077 34,951 Mean hourly earnings ($) 11.81 9.80 14.40 10.56
SOURCES.-Tabulated from the May 1980 current population survey (CPS) Supplement on Volunteer Activity and the 1990 Gallup Survey of Giving and Volunteering in the United States.
NOTE.-The maximum sample size for the CPS survey is 78,812; the maximum size for the Gallup Survey is 2,002. The number of observations for each variable varies modestly with the question, due to nonrespondents. On the CPS, the sample for the hourly earnings question is just 12,596 since the question was asked only of the outgoing rotation group.
Who Volunteers?
A priori, one might expect that volunteers would consist largely of people with low opportunity cost of time-low-wage workers or the jobless. That the elderly volunteer more than 16-64-year-old nonstudents fits this expectation. But the tabulations in table 1 show that few other demographic contrasts between volunteers and nonvolunteers are consis- tent with a simple opportunity cost explanation of volunteering. In the table I present the percentage of 16-64-year-old nonstudent volunteers and nonvolunteers with characteristics normally associated with higher human capital, social status, and the value of time and also give the mean value of selected characteristics. For the most part, volunteers are people with higher potential earnings or greater demands on their time: the employed, married persons, those with larger families, persons in the 35-54 peak earnings ages, the more highly educated, professionals and managers. Most strikingly, volunteers have higher wages and family in- comes.6 The only characteristic that fits a simple cost of time interpreta- tion of volunteering is sex, as women are slightly more likely to be volunteers than men. The tendency for persons with a high value of time to volunteer more than persons with low value of time shows that
6 Consistent with this pattern a United Way survey of over 11,000 workers at 108 workplaces shows that 48% of executives volunteer, whereas 15% of professionals volunteered and 9% of part-time workers volunteered (O'Connor 1985, p. 200).
Volunteer Labor S147
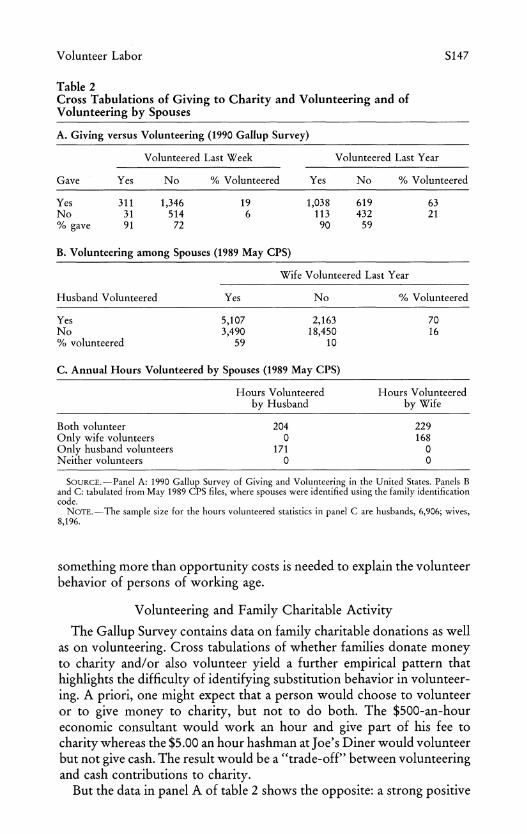
Table 2 Cross Tabulations of Giving to Charity and Volunteering and of Volunteering by Spouses
A. Giving versus Volunteering (1990 Gallup Survey)
Volunteered Last Week Volunteered Last Year
Gave Yes No % Volunteered Yes No % Volunteered
Yes 311 1,346 19 1,038 619 63 No 31 514 6 113 432 21 % gave 91 72 90 59
B. Volunteering among Spouses (1989 May CPS)
Wife Volunteered Last Year
Husband Volunteered Yes No % Volunteered
Yes 5,107 2,163 70 No 3,490 18,450 16 % volunteered 59 10
C. Annual Hours Volunteered by Spouses (1989 May CPS)
Hours Volunteered Hours Volunteered by Husband by Wife
Both volunteer 204 229 Only wife volunteers 0 168 Only husband volunteers 171 0 Neither volunteers 0 0
SOURCE.-Panel A: 1990 Gallup Survey of Giving and Volunteering in the United States. Panels B and C: tabulated from May 1989 CPS files, where spouses were identified using the family identification code.
NOTE.-The sample size for the hours volunteered statistics in panel C are husbands, 6,906; wives, 8,196.
something more than opportunity costs is needed to explain the volunteer behavior of persons of working age.
Volunteering and Family Charitable Activity
The Gallup Survey contains data on family charitable donations as well as on volunteering. Cross tabulations of whether families donate money to charity and/or also volunteer yield a further empirical pattern that highlights the difficulty of identifying substitution behavior in volunteer- ing. A priori, one might expect that a person would choose to volunteer or to give money to charity, but not to do both. The $500-an-hour economic consultant would work an hour and give part of his fee to charity whereas the $5.00 an hour hashman at Joe's Diner would volunteer but not give cash. The result would be a "trade-off" between volunteering and cash contributions to charity.
But the data in panel A of table 2 shows the opposite: a strong positive
S148 Freeman
relation between volunteering last week or last year and contributing to charities. Persons who donate to charity are roughly three times as likely to volunteer as persons who do not donate to charity. Ninety percent of volunteers donate to charity compared to 72% of those who did not volunteer last week and 59% of those who did not volunteer last year. The tendency for volunteers to contribute and contributors to charity to volunteer is found in the 1973 National Survey of Philanthropy (Morgan, Dye, and Hybels 1977), and in other Gallup surveys of giving and volun- teering, and thus appears to be a robust relation. It is not an association due to covariation with any measurable variable.7
The tendency for the same people to volunteer and donate money to charity raises the possibility that there are large differences in "tastes" for charity: Mrs. Do-Gooder gives money and time whereas Mrs. Oeconi- micus does neither. Alternatively, it may be that there are omitted social factors that are associated with the decision to volunteer/donate money. One possibility is that volunteers have more information about a charity and thus give more than nonvolunteers with the same taste but different information. Another possibility (in line with ensuing analysis in this article) is that friends or relatives may ask someone to give money and also to volunteer to a charitable activity, with the result that tastes aside, that person may do both while someone whose friends/relatives do not ask them neither volunteer nor donate.
The CPS contains information on another aspect of volunteering where one might find substitution-between the volunteer time of one member of the household and that of another member. In this case the "naive" substitution pattern would be for one family member to volunteer while the other works in the market or in the household. An opportunity-cost- of-time model would predict, moreover, that the household member with the higher wage would volunteer less than the member with lower wages.
To examine the family pattern of volunteering, I used the family identi- fication codes on the May 1989 CPS files to pair spouses and then cross- tabulated volunteer activity among pairs. The results in panel B of table 2 reject the notion of any simple substitution behavior here. Volunteering is positively associated among spouses: the most common pattern is for both husband and wife to volunteer or for neither to volunteer. Equally striking, panel C of the table shows that spouses in families in which both volunteer contribute more volunteer hours per person than spouses in families with only one volunteer. In tabulations not reported in the table, I have found a similar positive association between spousal volun-
7 In the Gallup survey I regressed volunteer hours on the personal characteris- tics given in the table 3 regressions including income or wages and a 0-1 charitable contribution dummy variable. The coefficient on whether or not the person con- tributed to charity is .313 with a standard error of .026 for volunteering last year.

Volunteer Labor S149
teering in the 1973 National Survey of Philanthropy and in the 1981 General Household Survey of the United Kingdom, so that the positive association between spousal volunteering appears to be robust. If there is substitution of volunteer time within the family, its effects are dwarfed by other factors.
The complementarity between donating money and time and between spousal volunteering has two implications for analysis of volunteer behav- ior. First, it suggests that labor supply substitution effects may be difficult to find in cross-section data absent some good control for the scale of charitable activity. Second, it shows that something more than substitu- tion responses to wages underlies the differences in volunteering between otherwise similar adults. I pursue the substitution issue in Section II and the "something more" in Section III.
II. Searching for Supply Behavior in Volunteering
To analyze volunteering, consider a person who maximizes utility (U) dependent on goods (G), leisure (L), and charity (C), where charity is produced by two inputs, volunteer time (Tv) and donations (D):
max U(G, L, C) (1)
subject to
C = C(Tv, D), (2)
an income constraint G + D = W TW + Y, and a time constraint Tw + T, + L = 1, where W = wages, Tw = time worked, Y = nonwage income, and D = charitable donations. Total time and the price of goods are scaled as 1.
The key to the model is the charitable production function. In the spirit of Ben-Porath's (1967) model of the production of human capital, I consider two specifications:
C = C(D, Tv), (2a)
and
C = C(D, WT,). (2b)
In (2a), the productivity of volunteer time is the same for all workers. Thus, the model predicts less volunteer activity as the wage or opportu- nity value of time rises: higher-wage workers should volunteer less. It also predicts substitution of donations for time volunteered as wages rise. In (2b), productivity in volunteering depends on human capital, indexed
S150 Freeman
by the wage, which can offset the increased opportunity cost of time in the supply decision. For instance, the high-wage movie star's telethon may generate more charitable contributions than she could make in an hour of work, so that volunteering is a more efficient way for her to produce charitable services.
How does (2a) fit the evidence on volunteering? The maximand to (1) and (2a) yields a derived demand for volunteer
time that I write for simplicity in linear form:
T, = a + bW+ cY+ v, (3)
where b depends on positive income effects and negative substitution effects, and c is the income effect of charitable activity. The additional term v is an individual-specific "taste" variable, positive for persons who, for whatever reason, obtain greater utility from volunteering and negative for those who get less utility from volunteering. Equation (3) is the simplest possible model for identifying substitution behavior in volun- teering. In the linear form the substitution effect in response to a change in W is b - cTw.
Table 3 presents estimates of variants of equation (3) for volunteering in the May CPS Supplement. In columns 1-4 the dependent variable is the 0-1 measure of whether the person volunteered in the past year or not.8 For ease of presentation I use a linear probability model: analyses with logistic and other functional forms give comparable results. In col- umns 5-8 the dependent variable is the log of hours volunteered. Hourly earnings are available only for a subset of the sample, the outgoing rota- tion group, so I report regressions for the full sample and for that subset. Identifying substitution effects in models of this form requires good mea- sures of nonwage income, which are hard to come by.9 The CPS asks for annual family income, for which responses are in categories: I have taken the mean of the categories as the income variable.
Columns 1 and 2 give coefficients and standard errors for the effect on volunteering of demographic variables and family income. Consistent with the table 1 tabulations, it shows that volunteers have characteristics associated with high values of time: higher family income, greater age and years of schooling, marriage, more children, and being white. In addition, among men, employment is positively associated with volun-
8 The CPS also includes a question on volunteering in the past week that gives a similar pattern of results.
9 Nonwage income is usually poorly measured and a poor indicator of "exoge- nous" income, Y, needed to identify income and substitution effects. Implicit income from housing is ignored. People underreport nonwage income on house- hold surveys. And observed nonwage income depends on past work and savings and may thus be correlated with the error term in any work equation.

(n -s -s r - -s - -s -s -s -s
-a Na, N o o N 0 oo C)o en "o * o Ln en en I- , Ln en Ln "o D I- Ln s E' JX o~t~ -4ti ro- o o
-> 4
-s o~~~~~~~~~~~~~~~~~~~~~~~~~~~~~~~~~~~~~~~~~~~~~~~~~~~- 0
0
s~ ~~ N)ce [oO-O ti-o o~N-N~oo~ti N =
~~~~~~~0 ~ ~ ~ ~ ~ 0
.S >> ~~~~~~~~~~~~~~~~~~~~
X~~~~~~~~~I 'I 00 C3C
4-1 ~ ~ ~ ~ ~ ~ ~ ~ ~ ~ ~ ~ ~ ~ ~ ~~~~~~- ; 8 c) _s _s _s _s00 _, _Ln _s_00 s _
t]~~~~~c Irn C3 I NN en O n -
n C) CA r" - I-e t.
d 3 C3 4 C: C3 C3 | |X 00
o~~~~~~~~~~~~~~ eC(9 o
4-d
0 C)S
C- 00\ en n 00 - Oti0
0? ot~~~~~~~~~~~~~~~~~~~
- 3 C C nC3r ' 30 r e .C3C --c -D c
5;; c0o a3 o 3 3 a 3 3 oo a3 3 3 oo 3 C3 3 C 3 3
-~~~~~~~~~~~~~~~~~~~~~~~~~~~~~~~~~~~~~~~~~~~~~~~~~~~~~-
Q - OO * N O i00 eOOtO\
0S0
0 lu (u Ln 00~~~~~~~0
W 2> 0 0>
U 0 O - C) D (D D (D (D I (D (D Lf (D r" C eNe
C: > q q q S - C3 HbCO
O~~~~~~~~~~~~~~~~~~~~~~~~~~~~~~~e '-'4. r
$ ~~- s E 0.00..000.0000 - =_
0
=~~~~~~~~~~~~~~~e Ln _C
Sz~~~~~~~~~C C) en C o en C) C) ) C) C) en O) C) C) I *) su C
er ~~~~~~~~~~~~~~~~~~~~~~~~~~~~~~C) = *
s X W8.t~~~~~~~~~~~~~~~~~~~~~~~~~~~~~~~~~~~~~~~~~~c =~~~~~~~~~~~~~~~~~~~~~~~~~~~~~~~~~~~~~- SoD
V)~~~~~~~~~~~~~~~~~~~~~~~~~~~~~~~~~~~~~~C C
u
oa
3 2 t O E a (nG ,, NU 5 ! ? U C7_~~~~~~~

S152 Freeman
teering. Volunteering falls with number of household earners, which is consistent with the positive effect of family income: holding family in- come constant, families with more earners are poorer, and poorer families volunteer less than wealthier families. That persons with children volun- teer more than others suggests that some volunteering produces services for children, possibly through a reciprocal altruistic relation. Johnny's mom volunteers to be den mother for the Cub Scouts on the understand- ing that other scouts' moms will do so in ensuing years. In addition, the probability of volunteering is smaller for those residing in larger cities (measured by INCMSA, for whether or not the person resides in a consol- idated metropolitan statistical area). Columns 3 and 4 report results for the smaller sample for which hourly earnings are available. The coefficient on hourly earnings is positive while the coefficient on family income is effectively zero. This is inconsistent with the notion that low-paid persons volunteer more because of substitution effects.
By contrast, the estimated coefficients in columns 5-6, which give the relation between demographic and economic factors on In hours volun- teered among those who volunteer, suggest that those with high value of time volunteer less than those with low value of time. In columns 5 and 6 family income has a negative effect on hours volunteered (negligible for women); working reduces volunteer hours for both sexes, the number of household earners has no effect on hours volunteered, and whites give fewer hours than nonwhites.10 The contrast between these relations and those in columns 1-2 highlights one important aspect of volunteer behav- ior that turns up in other data sets as well. While persons with higher earnings capacity are more likely to volunteer than those with lower earnings capacity, the former generally volunteer fewer hours.
The regressions in columns 7 and 8, which use usual hourly earnings as the measure of the value of time do not, however, show any sign of a substitution effect in response to hourly earnings. Among men hourly pay has little relation to hours volunteered, and family income obtains a negative coefficient. Among women hourly pay is negatively related to volunteer hours, but so too is family income. In much the same way that it is difficult to find substitution behavior in labor supply analyses of cross-section data on individuals (due presumably to the heterogeneity of the population), it is difficult to find substitution in volunteer behavior as well.
Table 4 presents comparable regressions from the Gallup Survey that tell a basically similar story about volunteering in this data set. The Gallup asks about volunteering last week, last month, and last year. To obtain the
" In addition, as in labor supply analyses, there are differences between men and women: marriage decreases male hours volunteered while increasing female hours volunteered.

-) -> \ Lr
> - -LrG OCo OO
- Oe> J
ON Ll en t en Ln U- Ln U- Ln (D m 1 Cro m m o C'd Ln - C3 O *N en C) I- Lr 00 C) Lr 11 L N I- ',
Lf)
;Y h -~o--ooooo---ocoo o w
0
ooR>NI " en e -00 c~0
o Q
N en ON N en N en en I- - 00 00 en ,C C)U)I I N _l - C_ N enettXX?e
. >;
0 0
oZ _
er~~~~~~~~~~~~~~C N N ) en ) en m C3 t3 r * M I- 00 00c is -
~~~~~~~ - ~~~~~~~~~~~~3 Ul nU)I-C l eI- I0
r )4. 0 *> St .
0D~~~~~~~~~~~~~~~~~~~~~~~
O -n
-~~~~~~~~~ o~~~~~~~~~~~~~ 0~L n 0 N C C) I- N N -~4- C
ON -d~~~~~~~~~~~~~~~ n - U) I
E Q 0o~o -oen 0 e l CIt en en N * ,- N N c- ,3 o - U N II Ho
:~~~- E t o 0 o. o oooooo
: ~~~~~~~~~~~~~~~~~~~~~~~~~~~~~~~~~~~~~~~~~~~~~~~~~~~~~~~~~~~~~.1
sZ~~~t C)
C:) ci ci d 'd~~~~~~ ~ 4 -4
~~~~ ~00 z- ) N N rl U)I
- - _e e0 -* C o o o o en N Z N l I.
O >;
er Q w oi * N N ?~~~~~~~~~, en - CO N CO N N I- CO en\ d t
w ~~~~~~~~~~~~~~~~~~~~~~~0
U)
;Y Q ~~~~~~~~~~~~~~~~~~~n O tN 00 00 N is) C r O Sz Q _ * ?~~~~~~~~~~" N en - en CO CO CO CO N en
- en -4 - -- en C O~~~~~~~c C) 3 C3 3 C3 ?, C3 C, C? C. CO C. C3 ,, 1, C3 C3 C _
rA a
"a C1 C3
t O 0 = ;~~~~~~~~~~~~~~~~~~~~~~~~~U
~~~~~~~~> Q I- -C.,
ci~~ I *;Y X O. 1I C~~~4 0 I-, q) U4I
_E4 %4 CL -.. 0 0 RQ. 0 S D = O: t = ~~~~~~~~~~~~~~~~~~~~~eq 4 w =Y U O
H~~b_ = = = X C:) ? ? k S Z; z Z; 2;4 U

S154 Freeman
largest sample of hours volunteered, I focus on last months' volunteering (estimates for the other time units of volunteering yield similar results to those in the table). The Gallup sample is smaller than the CPS sample, so that coefficients are less precisely estimated. In addition, wage and family income measures are given in broad categories; I have taken the mean of the categories.1" One advantage of the Gallup survey is that it asks those without a job how much they could earn per hour if they took a paid job. This enables me to create a new wage variable by combining the "prospective" wage and the reported wage of workers. In regressions with this variable, I include a dummy variable for working.
Columns 1 and 2 of the table record the coefficients and standard errors from the linear probability analysis of whether or not the individual volunteers. As in the CPS, the chance of volunteering is higher for those with more schooling, for whites, and for those with children and is lower for those in larger cities (INCMSA). It is higher for working women (rather than for men, as in table 3). The coefficients in columns 3 and 4 show that the augmented wage variable does no better in identifying substitution behavior in volunteering than the hourly earnings of those who work in the CPS. The positive coefficient on wages is too large to imply a negative substitution effect, even given the estimated positive effect of family income on volunteering.
The regressions for hours volunteered among those who volunteer in columns 7 and 8 give the first sign of substitution behavior: the estimated coefficients on In (hourly earnings) are negative for men and for women. Given that the estimated coefficients on family income are positive, the result is an estimated negative substitution effect of fairly sizeable magni- tudes: on the order of -.20 for men and -.30 for women.12
From the regressions in tables 3 and 4, I conclude that conditional on the decision to volunteer, there is some evidence of labor supply responsiveness in hours volunteered. But that evidence is hardly over- whelming. The search continues.
Volunteering and Hours Worked
As an alternative way to uncover substitution between work time and volunteer time, I have examined the relation between the number of hours volunteered and the number of hours worked in the May CPS. There are two reasons for expecting hours volunteered and hours worked to be negatively related: the time-budget constraint, which ought to produce
" It is standard for family income to be coded in categories. But the Gallup survey codes wages in dollars only ($5, $6) and is thus also effectively categorical.
12 To get the substitution effect, I subtracted the estimated coefficient on income times the share of the persons' wage income in total income from the coefficient on the wage.
Volunteer Labor S155
40
3 5 .." " ... ... .... , ..... 30 - _ _ _ _ 4
25
o 5 --.- ~20-
15-
10 1-19 20-29 20-39 40 41-49 50-59 60-69 70+
Hours Worked Last Week A
-|. Male c- Female
,,2 10-
Io
39_
V7
4 1-19 20-29 20-39 40 41-49 50-59 60-69 70+
Hours Worked Last Week
Bl * - Male .* Female
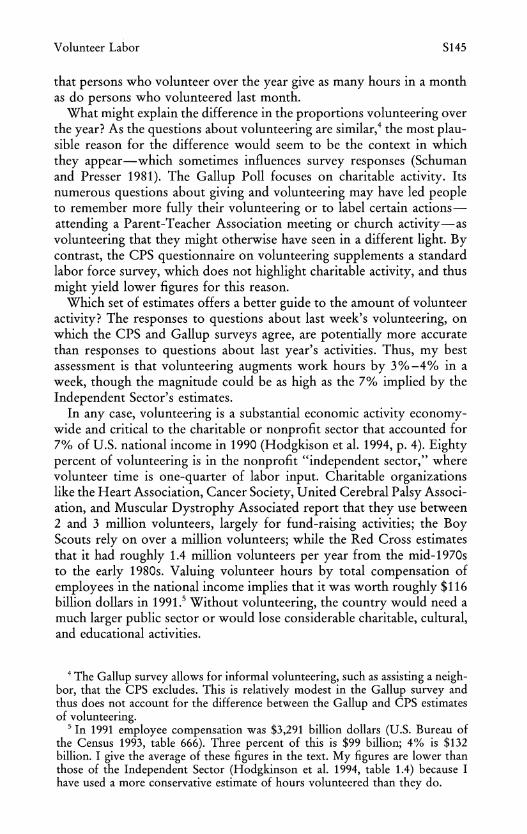
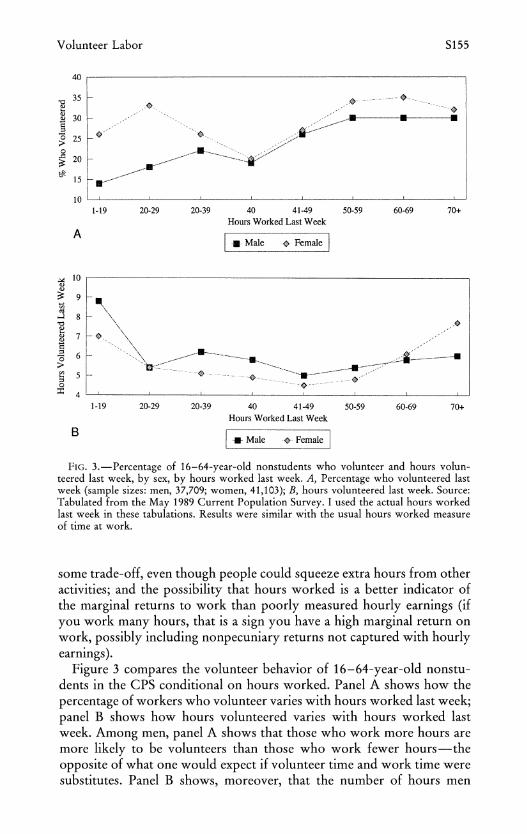
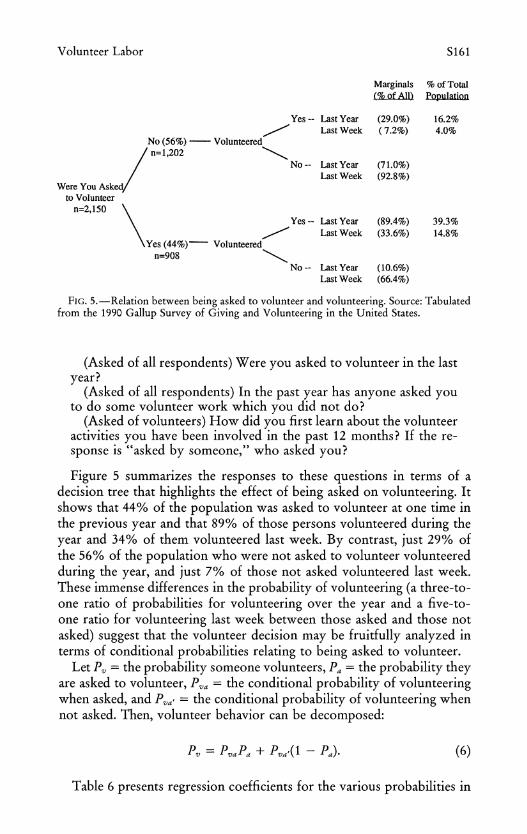
FIG. 3. Percentage of 16-64-year-old nonstudents who volunteer and hours volun- teered last week, by sex, by hours worked last week. A, Percentage who volunteered last week (sample sizes: men, 37,709; women, 41,103); B, hours volunteered last week. Source: Tabulated from the May 1989 Current Population Survey. I used the actual hours worked last week in these tabulations. Results were similar with the usual hours worked measure of time at work.
some trade-off, even though people could squeeze extra hours from other activities; and the possibility that hours worked is a better indicator of the marginal returns to work than poorly measured hourly earnings (if you work many hours, that is a sign you have a high marginal return on work, possibly including nonpecuniary returns not captured with hourly earnings).
Figure 3 compares the volunteer behavior of 16-64-year-old nonstu- dents in the CPS conditional on hours worked. Panel A shows how the percentage of workers who volunteer varies with hours worked last week; panel B shows how hours volunteered varies with hours worked last week. Among men, panel A shows that those who work more hours are more likely to be volunteers than those who work fewer hours-the opposite of what one would expect if volunteer time and work time were substitutes. Panel B shows, moreover, that the number of hours men

S156 Freeman
50
414 42.4
40 38.9
34.8
30 -
| 30 0 11 * ~~~~~~24.2 ** 2, 0~~~~~~~.
20
20
0 Males-Flextime Females-Flextime Males-2nd Job Females-2nd Job
M ih 0Wsthout
FIG. 4.-Percentage of 16-64-year-old nonstudents who volunteered last week by sex, by whether they have flexitime work schedule or hold second job. Source: Tabulated from May 1989 Current Population Survey. The sample size on the flexitime question was 31,831, of whom 5,686 (18%) said they had flexitime in their work schedule. The sample size for women on the flexitime question was 27,022, of whom 4,181 (15%) said they had flexitime in their work schedule. The sample size for men on the second job question was 31,962, of whom 2,028 (6%) held a second job. The sample size for women on the second job question was 27,048, of whom 1,525 (6%) held a second job.
volunteer is at most modestly inversely related to hours worked: volun- teers who worked less than 20 hours a week volunteered more hours than any other group, but those who worked 60 or more hours also volunteer considerable hours. Among women, there is a different pattern: the proportion volunteering and the hours volunteered of those who volunteer have a rough U-shaped relation to hours worked: those in the lowest and highest hours worked groups report greater volunteering and hours volunteered than those in the middle of the hours-of-work distribu- tion. No simple substitution story fits either the male or female patterns. That many persons who work many hours volunteer so much suggests something distinct about them, be it tastes, ability, energy, and so on.
Figure 4 uses two additional pieces of information on the CPS to explore the relation between the allocation of time to work and volunteer- ing: the flexibility of a work schedule and multiple job holding. The May 1989 CPS asked workers if they had "flexitime or some other work schedule that allows workers to vary the time they begin and end their workday." Workers with flexible schedules are more likely to volunteer than others. In addition, the CPS asks workers about second jobs. Persons
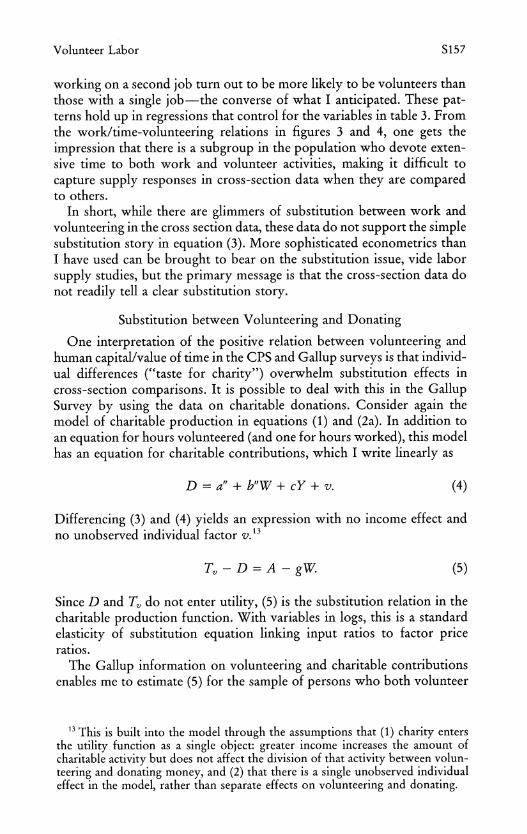
Volunteer Labor S157
working on a second job turn out to be more likely to be volunteers than those with a single job-the converse of what I anticipated. These pat- terns hold up in regressions that control for the variables in table 3. From the work/time-volunteering relations in figures 3 and 4, one gets the impression that there is a subgroup in the population who devote exten- sive time to both work and volunteer activities, making it difficult to capture supply responses in cross-section data when they are compared to others.
In short, while there are glimmers of substitution between work and volunteering in the cross section data, these data do not support the simple substitution story in equation (3). More sophisticated econometrics than I have used can be brought to bear on the substitution issue, vide labor supply studies, but the primary message is that the cross-section data do not readily tell a clear substitution story.
Substitution between Volunteering and Donating
One interpretation of the positive relation between volunteering and human capital/value of time in the CPS and Gallup surveys is that individ- ual differences ("taste for charity") overwhelm substitution effects in cross-section comparisons. It is possible to deal with this in the Gallup Survey by using the data on charitable donations. Consider again the model of charitable production in equations (1) and (2a). In addition to an equation for hours volunteered (and one for hours worked), this model has an equation for charitable contributions, which I write linearly as
D=a"+b"W+cY+v. (4)
Differencing (3) and (4) yields an expression with no income effect and no unobserved individual factor v.13
Tv - D = A - gW. (5)
Since D and Tv do not enter utility, (5) is the substitution relation in the charitable production function. With variables in logs, this is a standard elasticity of substitution equation linking input ratios to factor price ratios.
The Gallup information on volunteering and charitable contributions enables me to estimate (5) for the sample of persons who both volunteer
13 This is built into the model through the assumptions that (1) charity enters the utility function as a single object: greater income increases the amount of charitable activity but does not affect the division of that activity between volun- teering and donating money, and (2) that there is a single unobserved individual effect in the model, rather than separate effects on volunteering and donating.

S158 Freeman
and donate. Line 1 of table 4 contains estimates of the coefficient on log wages from equation (5) for men and women. The dependent variable is the difference between the log of volunteer hours and the log of charitable donations (by the individual's family). The coefficient on In (hourly earn- ings) is sizeable and negative, suggesting substantial supply responsiveness in the decision to volunteer versus contribute to charity. Addition of family income (and other variables) in line 2, however, weakens the result, as family income "picks up" most of the negative effect of wages on volunteering relative to donating. With family income in the equation, the "trade-off" between volunteering and donating is largely to income: members of higher-income families volunteer less and give more in cash donations to charity. Still, these findings suggest that among those who allocate resources to charity, there is substitution: high-wage or high- income persons give more in money and less in time than low-wage or low-income persons.
Consider next an alternative explanation for the positive relation be- tween human capital/value of time and volunteering-that the charitable production function (2a) is not valid. If all volunteers did the same thing- say, ladling soup at the local homeless shelter-there would be little or no relation between individuals' market productivity and their productiv- ity in charitable activities. But in fact volunteers do very different things. Most charities use the highly skilled on activities where they have a comparative advantage rather than ladling soup. If a charity wants to raise money, it will ask a corporate president to head the drive, and ask him to spend his time fund-raising in the business community, not to ladle soup. In this case, the appropriate charitable production function is (2b), where the individual's human capital affects the value of volunteer time. Perhaps differences in the productivity of time spent in voluntary activi- ties can help identify supply responsiveness in volunteering.
The Gallup Survey contains one question that enables me to examine this possibility:
Considering all the volunteer activities you performed in the past 12 months, if the organizations or persons for whom you volunteered had to pay for such services, how much do you think it would cost them in wages or salaries on the average per hour?
Over one-quarter of volunteers said they "didn't know/can't say" what the value of their volunteering was, but 880 persons answered the ques- tion. They reported a substantial assessed value of volunteer time: a mean value of voluntary time (VVT) of $12.56. A subset of 585 persons reported both a wage and a VVT. For this group the mean value of the VVT was $12.98 while the mean wage is $14.97-which suggests that individuals do something comparable in value to their normal work. Sixty-six percent regarded their voluntary contribution as being below their wage, 13% thought an hour volunteered was worth their wage, and 21 % valued the
Volunteer Labor S159
hour as contributing more than their wage. The standard deviation of the VVT was larger than the standard deviation of the wage ($20.80 vs. $15.40), perhaps because people are uncertain about the value of their contribution. Finally, the VVT was positively correlated with wages among individuals (r = .46) and was positively associated with standard wage determinants, such as years of schooling, age, and sex. In short, these data show that volunteers with high opportunity costs of time make a higher (self-perceived) contribution to charities than volunteers with low opportunity costs of time.
To see if this helps explain why persons with high productivity of time volunteer more than persons with low productivity of time, I regressed ln(voluntary hours) on the log ratio of VVT to wages, for the sample of respondents who reported both statistics. The resultant coefficients and standard errors are given in lines 3 and 4 of table 5. The size of the sample is around 200-250 for men or women separately, which gives imprecise estimated coefficients. Still, for women, the results support the notion that hours volunteered responds to the relative value of volunteer time versus work time: the elasticity of response is a positive 0.22. Decompos- ing the ln(VVT/wage) variable into its marginal product and wage compo- nents, moreover, gives roughly equal and opposite coefficients on the two terms (not reported in the table). But for men, the estimated coefficient on ln(VVT/wage) is insignificant negative.'4
Ideally, the two forms of differencing-taking volunteer hours versus charitable donations-and taking the value of volunteer time versus wages-should reinforce one another, but lines 5 and 6 in table 5 show that they do not: the coefficients are imprecisely estimated, and the family income term dominates the regression of the difference between voluntary hours and donations equation for men.
III. The Importance of Being Asked
The empirical analysis in table 3-5 shows some substitution behavior in volunteering but also indicates strongly that an explanation of differ- ences in volunteer behavior in individual cross-section data requires some- thing more than the standard demographic, human capital, and earnings variables. Is there any identifiable social factor that might explain why
14 There is a different way to view the value of volunteer time. Assume that someone wants to give $50.00 through volunteer activity. The high-productivity volunteer could do so with fewer hours than the low-productivity volunteer. This offers a possible explanation for why volunteers with higher human capital/wages give fewer hours than those with lower human capital/wages: they can give the same value with less time. If the value of an hour volunteering is simply the multiplicand of that hour and the assessed productivity of that hour, the "right" response to differences in the productivity of time is just the estimated coefficient on VVT in table 5, plus one.

S160 Freeman
Table 5 Coefficients (and Standard Errors) for the Effect of ln(Hourly Earnings) and ln(Family Income) on Volunteer Hours in 1990 Gallup Survey
Coefficients (Standard Errors)
ln(VVT/ ln(Family Dependent Variables ln(Wage) Wage) Income) Controls R2 N
1. ln(voluntary hours) - ln(donations):
Males -.89 No .09 247 (.18)
Females -.64 No .06 250 (.17)
2. ln(voluntary hours) - ln(donations):
Males -.18 -1.10 Yes .20 228 (.26) (.28)
Females -.11 -.18 Yes .20 226 (.23) (.22)
3. ln(voluntary hours): Males -.06 No .00 245
(.08) Females .22 No .03 218
(.09) 4. ln(voluntary hours):
Males -.03 -.22 Yes .05 228 (.10) (.14)
Females .25 .07 Yes .06 202 (.10) (.13)
5. ln(voluntary hours) - ln(donations):
Males .19 No .01 216 (.17)
Females .27 No .01 199 (.17)
6. ln(voluntary hours) - ln(donations):
Males -.20 -1.39 Yes .23 196 (.18) (.26)
Females .06 -.29 Yes .26 173 (.17) (.23)
SOURCE.-Tabulated from 1990 Gallup Survey of Giving and Volunteering in the United States. NOTE.-The wage variable is a composite of wages and the wages those without jobs say they would
get if they took a job today. The hours variable is monthly hours volunteered. Controls are the same as in table 4.
some people volunteer and others do not, or are we limited to unobserv- ables such as taste? I present next evidence that one social event-whether a person was asked to volunteer-is the key to understanding why people work for nothing.
The Evidence
The Gallup Survey asks several questions about how people did or did not become volunteers:
Volunteer Labor S161
Marginals % of Total
(%of All) Population
Yes -- Last Year (29.0%) 16.2% Last Week (7.2%) 4.0%
No (56%) - Volunteered n=1,202
No -- Last Year (71.0%) Last Week (92.8%)
Were You Asked to Volunteer
n=2,150 Yes -- Last Year (89.4%) 39.3%
\ / Last Week (33.6%) 14.8% Yes (44%) Volunteered
n=908 No -- Last Year (10.6%)
Last Week (66.4%)
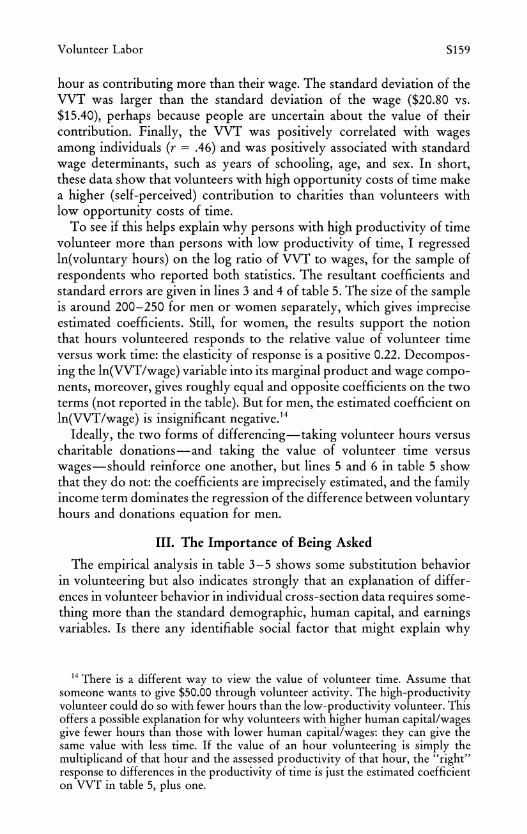
FIG. 5.-Relation between being asked to volunteer and volunteering. Source: Tabulated from the 1990 Gallup Survey of Giving and Volunteering in the United States.
(Asked of all respondents) Were you asked to volunteer in the last year?
(Asked of all respondents) In the past year has anyone asked you to do some volunteer work which you did not do?
(Asked of volunteers) How did you first learn about the volunteer activities you have been involved in the past 12 months? If the re- sponse is "asked by someone," who asked you?
Figure 5 summarizes the responses to these questions in terms of a decision tree that highlights the effect of being asked on volunteering. It shows that 44% of the population was asked to volunteer at one time in the previous year and that 89% of those persons volunteered during the year and 34% of them volunteered last week. By contrast, just 29% of the 56% of the population who were not asked to volunteer volunteered during the year, and just 7% of those not asked volunteered last week. These immense differences in the probability of volunteering (a three-to- one ratio of probabilities for volunteering over the year and a five-to- one ratio for volunteering last week between those asked and those not asked) suggest that the volunteer decision may be fruitfully analyzed in terms of conditional probabilities relating to being asked to volunteer.
Let P, = the probability someone volunteers, Pa = the probability they are asked to volunteer, Pva = the conditional probability of volunteering when asked, and Pva' = the conditional probability of volunteering when not asked. Then, volunteer behavior can be decomposed:
Pv = Pva Pa + Pva'(1 Pa). (6)
Table 6 presents regression coefficients for the various probabilities in
S162 Freeman
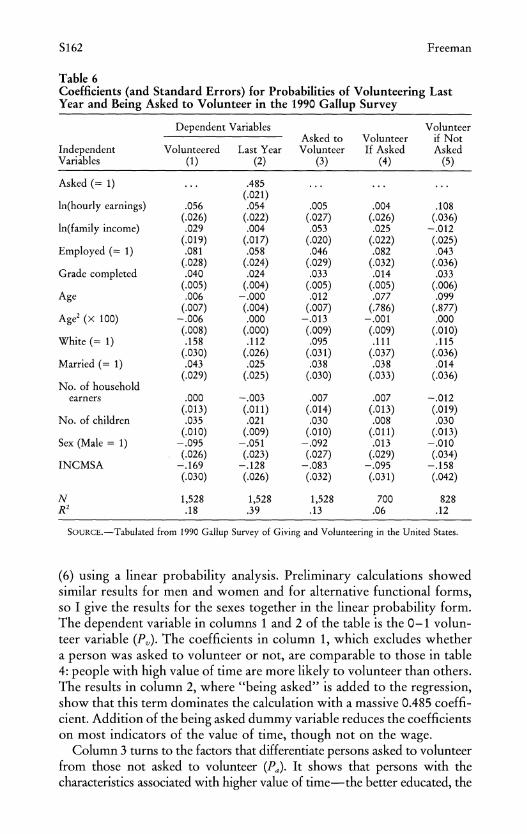
Table 6 Coefficients (and Standard Errors) for Probabilities of Volunteering Last Year and Being Asked to Volunteer in the 1990 Gallup Survey
Dependent Variables Volunteer Asked to Volunteer if Not
Independent Volunteered Last Year Volunteer If Asked Asked Variables (1) (2) (3) (4) (5)
Asked (= 1) ... .485 ... ... ... (.021)
ln(hourly earnings) .056 .054 .005 .004 .108 (.026) (.022) (.027) (.026) (.036)
ln(family income) .029 .004 .053 .025 -.012 (.019) (.017) (.020) (.022) (.025)
Employed (= 1) .081 .058 .046 .082 .043 (.028) (.024) (.029) (.032) (.036)
Grade completed .040 .024 .033 .014 .033 (.005) (.004) (.005) (.005) (.006)
Age .006 -.000 .012 .077 .099 (.007) (.004) (.007) (.786) (.877)
Age2 (X 100) -.006 .000 -.013 -.001 .000 (.008) (.000) (.009) (.009) (.010)
White (= 1) .158 .112 .095 .111 .115 (.030) (.026) (.031) (.037) (.036)
Married (= 1) .043 .025 .038 .038 .014 (.029) (.025) (.030) (.033) (.036)
No. of household earners .000 -.003 .007 .007 -.012
(.013) (.011) (.014) (.013) (.019) No. of children .035 .021 .030 .008 .030
(.010) (.009) (.010) (.011) (.013) Sex (Male = 1) -.095 -.051 -.092 .013 -.010
(.026) (.023) (.027) (.029) (.034) INCMSA -.169 -.128 -.083 -.095 - .158
(.030) (.026) (.032) (.031) (.042)
N 1,528 1,528 1,528 700 828 R 2 .18 .39 .13 .06 .12
SOURCE.-Tabulated from 1990 Gallup Survey of Giving and Volunteering in the United States.
(6) using a linear probability analysis. Preliminary calculations showed similar results for men and women and for alternative functional forms, so I give the results for the sexes together in the linear probability form. The dependent variable in columns 1 and 2 of the table is the 0-1 volun- teer variable (P,). The coefficients in column 1, which excludes whether a person was asked to volunteer or not, are comparable to those in table 4: people with high value of time are more likely to volunteer than others. The results in column 2, where "being asked" is added to the regression, show that this term dominates the calculation with a massive 0.485 coeffi- cient. Addition of the being asked dummy variable reduces the coefficients on most indicators of the value of time, though not on the wage.
Column 3 turns to the factors that differentiate persons asked to volunteer from those not asked to volunteer (Pa). It shows that persons with the characteristics associated with higher value of time-the better educated, the

Volunteer Labor S163
employed, those with higher incomes, and so on-are more likely to be asked to volunteer than others. Column 4 examines the factors that determine whether someone accedes to the request to volunteer (Pva). Here, we might expect persons with high valuation of time to reject requests to volunteer, but in fact the opposite is true: those with greater education, family income, and so on, are more likely to accede to requests for volunteer activity. Finally, column 5 examines the decision to volunteer among those who were not asked to volunteer (Pva). The estimates show that persons who volunteer on their own have characteristics associated with higher productivity of time: higher wages, years of schooling, and so forth.
The strong relation between being asked and volunteering found in column 2 is not unique to this data set. In 1984 Gallup did a similar survey of charitable activity for the Independent Sector (Independent Sector 1986): 44% of respondents said that they volunteered because they were asked-making this the single most important reason given for volunteering. In a Rockefeller Brothers study of charitable contribu- tions, individuals reported that the best way to get them to donate money was to have someone who knows them well or someone at work to ask them (Rockefeller Brothers Fund 1986, p. 22). I have found a similar pattern in a telephone survey of volunteering and charitable donations among Boston residents (Freeman 1993). And focus groups of British volunteers have come to the same conclusion: that people volunteer primarily because they are asked (Thomas and Finch 1990). In sum, the importance of being asked seems empirically unassailable. How ought we to interpret it?
Interpretation The observed tendency for people to volunteer when asked does not mean
that if the entire population was asked to volunteer, nearly all would do so, nor that if no one was asked to volunteer, only the small proportion who volunteer without being asked would do so. Column 3 of table 6 shows differences in measurable characteristics between those asked and those not asked to volunteer. Unmeasured characteristics, such as a reputation for re- sponding/not responding to efforts to solve community problems, presumably contribute to who gets asked to volunteer. You would not ask Mrs. Oeconom- icus if she goes around saying it is stupid to help others, all that counts is number one, and so on. And Mrs. Do-Gooder might find a cause to which she would volunteer, even if you do not ask her to help the local homeless shelter. At the same time, I doubt that the huge difference in volunteering rates between those asked and not asked is due solely to selectivity; everything we know about free riding argues that at least some of the observed relation is likely to reflect real behavior."5 Assuming that this is the case, the important
1 The experiment to test that being asked has a real effect on volunteering would be to randomly ask a set of people and then to observe their volunteer

S164 Freeman
question is why people say "yes" when asked to undertake charitable activity. Why not say, "I gave at the office" or "I'm busy" or tell the person to bug off, as you might to some telephone sales pitch about the vacation house you won in Florida.
I hypothesize that two factors underlie the response of individuals to requests to volunteer. The first factor-a precondition for asking to affect behavior-is that people value the particular charitable activity. They will accede to requests to volunteer (or give money) only for some causes: you give for the homeless but not to Senator Bubblehead's political drive. In a survey of Boston residents in 1989, I found that people differentiated finely on the basis of the content of activity in deciding whether or not to accede to a request to give to charity or volunteer (Freeman 1993). I will call a public good for which people are willing to contribute time or money when asked a conscience good, for obvious reasons. People have a latent demand for such a good, which a request brings to the fore, even if they would prefer to free ride on the provision of that good.
The second factor is that the request carries some "social pressure" with it: you are more likely to accede to personal requests than to telephone or written requests; to requests from employers, colleagues, and the like, than to requests from strangers. The Gallup survey asked people who said they learned about a volunteer activity through a request to identify the person who had asked them to volunteer. The two most cited re- sponses (the question allowed multiple responses) were friends (53% said they had been asked by friends to volunteer) and family (24% said they had been asked by their family). If your college class wants a charitable donation, they do better to ask someone who knows you to make the call than a stranger. When a colleague asks you to give to the Bosnian Food Bank, you feel more obligated to write a check than if a stranger comes to your door. The tendency for people in larger communities to reject requests to volunteer is consistent with this notion.
In a related vein, I would expect individuals to be more likely to volunteer to activities that benefit them or their family, along the lines of "reciprocal altruistic" explanations of altruistic behavior. If Johnny's mom is not involved in the Cub Scouts when all the other moms are, she and Johnny may find that they are excluded from other activities. The Gallup Survey contains some support for this notion: nearly one-third (31 %) of volunteers reported that they first became involved in volunteer activity when a family member or friend was involved or would benefit from it, and 38% reported that they volunteered because a family member or friend benefited or because they had benefited in the past. However, the survey does not ask nonvolunteers if their friends or family members
behavior over time. It is a difficult experiment to perform, however, because many groups and charities are in the market asking for volunteers.

Volunteer Labor S165
benefit from an activity, so there is no comparison group to judge if having friends/family benefit induces volunteering. For this, I turn to a 1984 United Way survey which asked volunteers and nonvolunteers if they or their families used a particular charitable service. The survey found that 23% of volunteers to a service used it, whereas just 9% of nonvolunteers used the service (O'Connor 1985, p. 202). This does not test reciprocal altruism (the survey did not ask what might happen if people did not volunteer), but it does show a role for private demand- side benefits in volunteering.
IV. Conclusion
This article has shown that volunteering is a substantial input into the American economy and that persons with considerable human capital/ opportunity cost of time volunteer more than others. It has uncovered some evidence for labor supply substitution effects in hours volunteered relative to charitable donations and in the perceived marginal product of volunteering relative to the opportunity cost of time. It has shown that a charitable production function that makes the value of a volunteer-hour depend on human capital in the spirit of Ben-Porath's 1967 article on the production of human capital is more consistent with cross-section evi- dence on volunteering than an analysis that treats all volunteer hours the same. But the main message is that volunteer behavior depends more on the factors embodied in Ben-Porath's "F-Connection" than on substitu- tion vis-a-vis labor supply considerations. People volunteer when asked to do so for charitable causes. I introduced the concept of a "conscience good" to account for the tendency of people to volunteer (or give money) when someone requests that they do so. This suggests that further illumi- nation of volunteer behavior requires analysis of the demand side of the market-the forces that lead some charities to seek to use volunteers and that lead some people to ask their friends, relatives, or co-workers to volunteer.
References
Ben-Porath, Yoram. "The Production of Human Capital and the Life Cycle of Earnings." Journal of Political Economy 75 (1967): 352-65.
"The F-Connection: Families, Friends, and Firms, and the Or- ganisation of Exchange." Population Development Review 6, no. 1 (March 1980): 1-30.
Freeman, Richard B. "Me, Give to Charity-Well, If You Ask." Paper presented at the Conference on Happiness, Fairness, and Markets, Lon- don School of Economics, November 4-5, 1993.
Hodgkinson, Virginia Ann, and Weitzman, Murray S. Dimensions of the Independent Sector. Washington, DC: Independent Sector, 1986.
. Giving and Volunteering in the United States. 1988 ed. Washing- ton, DC: Independent Sector, 1989.
S166 Freeman
. Giving and Volunteering in the United States. 1990 ed. Washing- ton, DC: Independent Sector, 1991.
Hodgkinson, Virginia Ann; Weitzman, Murray S.; Toppe, Christopher M.; and Noga, Stephen. Nonprofit Almanac, 1992-1993. San Francisco: Jossey-Bass, 1994.
Independent Sector. Americans Volunteer 1985. Washington, DC: Inde- pendent Sector, 1986.
Morgan James, N.; Dye, Richard; and Hybels, Judith. "Results from Two National Surveys on Philanthropic Activity." In Research Papers, by Commission on Private Philanthropy and Public Needs. 1:157-323. Washington D.C.: Commission on Private Philanthropy and Public Needs, 1977.
Menchik, Paul, and Weisbrod, Burton. "Volunteer Labor Supply in the Provision of Collective Goods." In Nonprofit Firms in a Three Sector Economy, edited by Michelle J. White. Washington, DC: Urban Insti- tute, 1981.
. "Voluntary Labor Supply." Journal of Public Economics (March 1987), pp. 159-83.
O'Connor, Robert J. "Giving and Volunteering at the Workplace." In Giving and Volunteering: New Frontiers of Knowledge. 1985 Spring Research Forum Working Papers. Washington, DC: Independent Sec- tor and United Way Institute, March 15, 1985.
Rockefeller Brothers Fund. Report on Charitable Giving. New York: Rockefeller Brothers Fund, 1986.
Schuman, Howard, and Presser, Stanley. Questions and Answers in Atti- tude Surveys. New York: Academic Press, 1981.
Thomas, Andrew, and Finch, Helen. "On Volunteering: A Qualitative Research Study." Unpublished manuscript. London: London School of Economics, contained in file on charities.
U.S. Bureau of the Census. Statistical Abstract 1991. Washington, DC: U.S. Government Printing Office, 1991.
Statistical Abstract 1992. Washington, DC: U.S. Government Printing Office, 1992.
Statistical Abstract 1993. Washington, DC: U.S. Government Printing Office, 1993.
U.S. Bureau of Labor Statistics. News. USDL 90-154. Washington, DC: U.S. Government Printing Office, March 29, 1990.