working conditions and factory survival: evidence …ftp.iza.org/dp10026.pdf · working conditions...
TRANSCRIPT

Forschungsinstitut zur Zukunft der ArbeitInstitute for the Study of Labor
DI
SC
US
SI
ON
P
AP
ER
S
ER
IE
S
Working Conditions and Factory Survival:Evidence from Better Factories Cambodia
IZA DP No. 10026
June 2016
Raymond RobertsonDrusilla BrownRajeev Dehejia

Working Conditions and Factory Survival: Evidence from Better Factories Cambodia
Raymond Robertson Texas A&M University
and IZA
Drusilla Brown
Tufts University
Rajeev Dehejia
New York University, Tufts University, NBER and IZA
Discussion Paper No. 10026 June 2016
IZA
P.O. Box 7240 53072 Bonn
Germany
Phone: +49-228-3894-0 Fax: +49-228-3894-180
E-mail: [email protected]
Any opinions expressed here are those of the author(s) and not those of IZA. Research published in this series may include views on policy, but the institute itself takes no institutional policy positions. The IZA research network is committed to the IZA Guiding Principles of Research Integrity. The Institute for the Study of Labor (IZA) in Bonn is a local and virtual international research center and a place of communication between science, politics and business. IZA is an independent nonprofit organization supported by Deutsche Post Foundation. The center is associated with the University of Bonn and offers a stimulating research environment through its international network, workshops and conferences, data service, project support, research visits and doctoral program. IZA engages in (i) original and internationally competitive research in all fields of labor economics, (ii) development of policy concepts, and (iii) dissemination of research results and concepts to the interested public. IZA Discussion Papers often represent preliminary work and are circulated to encourage discussion. Citation of such a paper should account for its provisional character. A revised version may be available directly from the author.

IZA Discussion Paper No. 10026 June 2016
ABSTRACT
Working Conditions and Factory Survival: Evidence from Better Factories Cambodia*
A large and growing literature has identified several conditions, including exporting, that contribute to plant survival. A prevailing sentiment suggests that anti-sweatshop activity against plants in developing countries adds the risk of making survival more difficult by imposing external constraints that may interfere with optimizing behavior. Using a relatively new plant-level panel dataset from Cambodia, this paper applies survival analysis to estimate the relationship between changes in working conditions and plant closure. The results find little, if any, evidence that improving working conditions increases the probability of closure. In fact, some evidence suggests that improvements in standards relating to compensation are positively correlated with the probability of plant survival. JEL Classification: J8, J5, J3 Keywords: working conditions, apparel, sweatshops, plant survival, closure Corresponding author: Raymond Robertson Bush School of Government and Public Service Texas A&M University 4220 TAMU College Station Texas 77843-4220 USA E-mail: [email protected]
* The authors thank without implicating Martin Hess, Ross Jones, Arianna Rossi, Amy Luinstra, Colin Fenwick, Sarah West, two anonymous referees, and participants at the 2011 Better Work Conference for helpful comments and suggestions.

1 | P a g e
Introduction
Low wages, long hours, high temperatures, excessive noise, poor air quality,
unsanitary conditions, and abuse (both verbal and physical) in developing country
manufacturing establishments are often cited as evidence that “sweatshops” characterize
production in relatively poor countries. Harsh working conditions in apparel factories are
at the center of a large and growing debate about globalization and labor standards (Elliott
and Freeman 2003). Several organizations have responded to rising public concern by
pressuring governments and employers to improve working conditions. Public exposure,
such as anti-sweatshop agitation, seems to have improved working conditions in global
supply chains. Harrison and Scorse (2010), analyzing Indonesian manufacturing census
data from 1990s, find that workers in the apparel, textile and footwear global supply chains
were underpaid relative to workers supplying the domestic sector prior to the anti-sweatshop
campaign of the early 1990s, but by 1997 were earning more than the comparison group.
One concern about anti-sweatshop activity is that it imposes constraints on factories
that, especially in very competitive environments, may make survival more difficult. Many
improvements require costly capital investments (such as air conditioning, plumbing, or
safety equipment). Complying with minimum wage laws and providing additional
compensation (such as paid leave and overtime) can also increase factory costs. These
arguments are trivial to illustrate using even the most basic economic theory: if firms are

2 | P a g e
operating efficiently in competitive markets, increases in costs (holding all else constant)
will necessarily cause marginal firms to exit.1
Factory closings are a considerable concern in developed and developing countries.
As a result, there is a sizable literature that seeks to uncover the variables linked to factory
survival. Early papers focused on the United States and other developing countries (Bernard
and Jensen 2007, Disney et al. 2003, Doms et al. 1995, Baggs 2005, and Greenaway et al.
2008). These papers illustrate the importance of technology, capital intensity, age, and size
in survival rates. Recent papers, such as Harris and Li (2010) find a positive relationship
between exporting in particular or exposure to foreign markets generally and survival.
Advances in data collection and availability has extended this literature to developing
countries, including Ghana, Kenya, and Tanzania (Soderbom et al. 2006), Ethiopia
(Shiferaw 2009), Indonesia (Behrman and Deolalikar 1989), and Malaysia (Nor et al.
2007).
These studies suggest that closure is a relevant dimension for analyzing the
relationship between improvements in working conditions and apparel factory performance
in developing countries. Apparel factories are generally small, have less technology than
other sectors, are often recent start-ups, and are considered “footloose” internationally
because of the ease at which they close. As a result, apparel factories have much higher
closure rates than factories in other sectors (Watson and Everett 1999). It is therefore
somewhat surprising that few, if any, of these papers identify underlying driving factors of
1 Reflecting a voluminous literature, Walker (2011), for example, shows that environmental regulation in the United States had adverse consequences for employment. The literature on the effects of labor-market regulations is not as large.

3 | P a g e
technology that may be improving survival. Fewer still examine the link between changes
in human resource practices in general, much less improvements in working conditions.
The goal of this paper is to analyze changes in working conditions in Cambodian
apparel exporting factories to see which, if any, are statistically related to the probability of
factory closure. Closure is very salient in our sample: about 41 per cent of our firms fail
during the sample period. Our data do not include financial information (such as profits),
but in the robustness section we explore the relationship between changes in working
conditions and employment growth. Changes in compensation compliance is slightly
negatively related to employment growth, but no other category of working conditions has a
statistically significant relationship.
Our very preliminary results suggest that most dimensions of working conditions are
not statistically related to closure: only 3 or 4 of the 31 groups show evidence of a
statistically significant relationship (depending on the estimation method and specification).
Those that are significant (or nearly significant) tend to be those that are most directly
related to worker effort – weekly hours, weekly rest, and payment of wages. Those that are
statistically significant are positively correlated with survival. We find very limited, if any,
evidence that improvements in any of the areas increase the probability of closure in a
statistically or economically important way. These preliminary results seem inconsistent
with the argument that improving conditions puts unbearable cost pressure on factories.
In the sections follow, we first describe the BFC program. We then briefly present a
broad theoretical framework that guides our analysis. The next section describes the data.
The penultimate section presents the empirical results and the final section concludes.
4 | P a g e
Better Factories Cambodia
Cambodia is considered to be a relatively recent example of a successful
transformation from central planning to a market-based export-oriented economy. The
growth of the apparel sector in Cambodia has played a key role in Cambodia’s
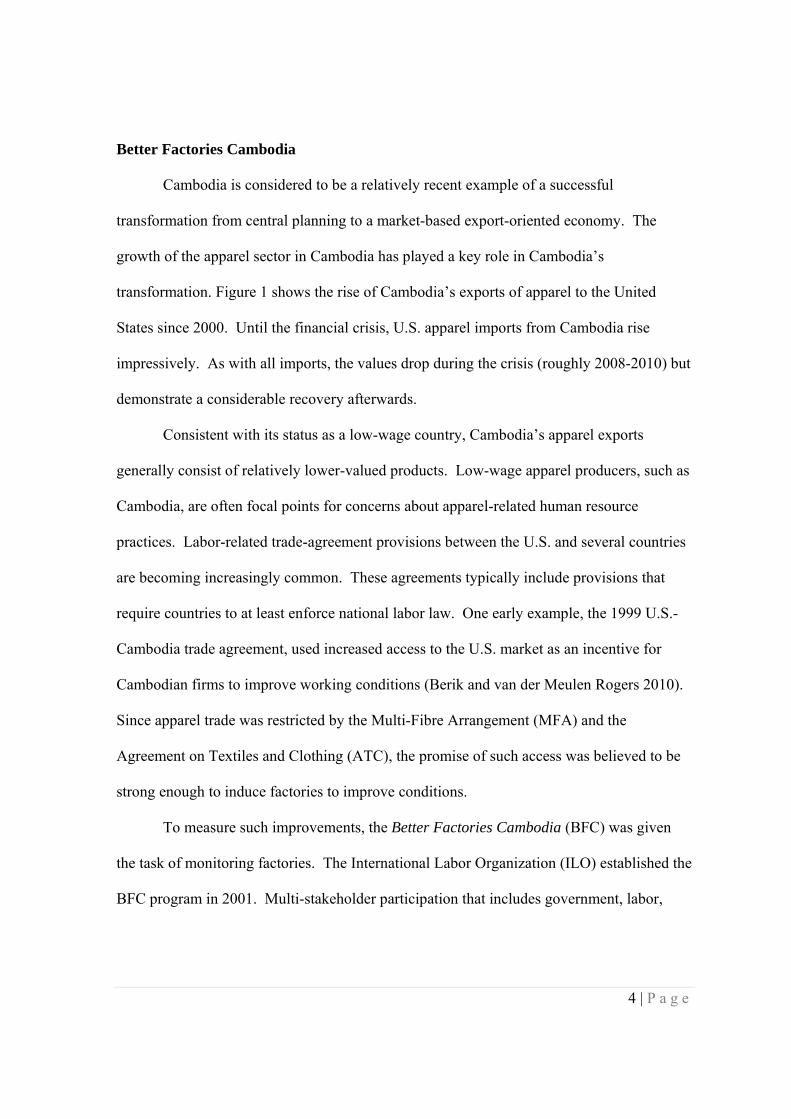
transformation. Figure 1 shows the rise of Cambodia’s exports of apparel to the United
States since 2000. Until the financial crisis, U.S. apparel imports from Cambodia rise
impressively. As with all imports, the values drop during the crisis (roughly 2008-2010) but
demonstrate a considerable recovery afterwards.
Consistent with its status as a low-wage country, Cambodia’s apparel exports
generally consist of relatively lower-valued products. Low-wage apparel producers, such as
Cambodia, are often focal points for concerns about apparel-related human resource
practices. Labor-related trade-agreement provisions between the U.S. and several countries
are becoming increasingly common. These agreements typically include provisions that
require countries to at least enforce national labor law. One early example, the 1999 U.S.-
Cambodia trade agreement, used increased access to the U.S. market as an incentive for
Cambodian firms to improve working conditions (Berik and van der Meulen Rogers 2010).
Since apparel trade was restricted by the Multi-Fibre Arrangement (MFA) and the
Agreement on Textiles and Clothing (ATC), the promise of such access was believed to be
strong enough to induce factories to improve conditions.
To measure such improvements, the Better Factories Cambodia (BFC) was given
the task of monitoring factories. The International Labor Organization (ILO) established the
BFC program in 2001. Multi-stakeholder participation that includes government, labor,

5 | P a g e
factory owners, and international buyers2 is a key dimension of the program. In place since
2001, the program strives to improve working conditions with a combination of monitoring,
remediation, and training. ILO-trained Cambodian monitors assess the factory’s compliance
during unannounced visits. The two-person monitoring teams rarely assess the same factory
twice in order to minimize monitor bias. The BFC team then compares the results with
national law and international standards to develop feedback and suggestions to help
factories address concerns. The results are aggregated and presented in annual synthesis
report that includes each factory’s name and progress on improving working conditions.
The BFC program shares these reports with the factories’ buyers. Firms were certainly
encouraged and perhaps even pressured to improve working conditions using several means.
Until 2006, firm-level compliance was made public.
The monitoring reports played a key role in establishing the apparel industry’s
record of compliance. This record was used by the U.S. government to determine
Cambodia’s apparel export quota allocation. Many wondered if the loss of the quota
incentive after the end of the MFA/ATC would adversely affect factory compliance, but
factories continued to comply and improve working conditions after the Arrangement
ended. Combining interviews, observations, and BFC synthesis reports, Shea et al. (2010)
document sustained increases in working conditions in Cambodia and Beresford (2009) in
particular finds that working conditions did not fall in response to an increasingly
competitive environment.
The BFC program has captured the attention of many as an example of an innovative
way to improve working conditions in global supply chains (Adler and Woolcock 2010,
2 More information about the Better Factories program can be found at http://www.betterfactories.org/.

6 | P a g e
Beresford 2009, Berik and van der Meulen Rodgers 2010, Miller et al. 2009, Oka 2010a and
2010b, and Polaski 2006). These papers identify several variables that, in the context of the
BFC program, are positively related to the factory-level decision to improve working
conditions, such as a relationship with a reputation-sensitive buyer (Oka 2010a) and public
disclosure of non-compliance (Ang et al. 2012). In the next section we incorporate these
and other factors into a general model that identifies some of the relationships between
factory characteristics, the BFC program characteristics, and working conditions.
Analytical Framework
The potential effects of improving working conditions are subtle and potentially
conflicting. Working conditions may involve an increase in costs to the firm (such as
installing air conditioning or additional plumbing) that may reduce the probability of plant
survival for marginal firms. On the other hand, improvements in working conditions may
increase worker utility and therefore increase effort or reduce turnover. In this section, we
present a simple, original model that illustrates these potential relationships as a way to
motivate our empirical work and help interpret the results. In particular, the model also
highlights the fact that different kinds of working conditions will have different effects on
the factories: those that increase effort will have different effects than those that workers do
not value as much. The model also have ambiguous implications for employment because
working conditions affect effort. If improving working conditions increases effort, the firm
may need fewer workers to achieve production targets.
We begin by assuming that workers maximize utility and factory managers
maximize profits subject to market, technology parameters, and information constraints.
Firm output is the consequence of worker effort (e) directed at quality ( ∈ 0,1 and
7 | P a g e
quantity ( ∈ 0,1 ). Working conditions are characterized by a vector ( … , for
example the rate paid for piece work ( ), pay based on product quality ( ),
work hours ( , and other working conditions such as the quality and availability of
first aid, the incidence of abuse by factory supervisors, etc.
Workers’ bargaining position with regard to the vector of working conditions is
determined by maximizing an additively separable utility function of working conditions
and work effort. That is, … , . The partial derivatives of c are non-
negative. The partial derivative, , is negative but the partial, , may be positive,
allowing for the possibility of intrinsic value of work.
The bargaining position of factory managers is derived from the solution of an
expected profit maximization program with expected profits given by:
, , … , ; ∑ , (1)
where is the price of output, ≥1 is the price premium for meeting a minimum compliance
standard, is hours worked by workers, and (or and ) are effort and wages for
effort directed at quantity (or quality), refers to working condition and its cost as
perceived by managers with information set . Firms can compensate for lower effort by
hiring more workers (extending hours worked h). The price, , depends on the workers’
effort with regard to the quality of the product. The production function is the factory
manager’s expectation of hourly output based on the working conditions chosen and is
conditional on the factory manager’s information set, , concerning production technology.
Factory managers can elicit work effort directed at quality and quantity by paying an
efficiency wage or by altering the conditions of work. Factories face an upward sloping
effort schedule where the slope depends on the conditions of work. That is

8 | P a g e
, , , … , (2)
, , , … , . (3)
Here we assume that
0,
0, and 0
0,
0, and 0.
That is, incentives targeting quantity reduce effort directed toward quality and vice versa.
Increased hours reduce effort toward quality and quantity. The partial derivates of the other
working conditions may be positive or negative. Verbal or physical abuse may increase
effort on quantity if such treatment is effectively intimidating. However, all working
conditions that are perceived by workers as degrading the work environment will reduce
effort on quality and quantity. Working conditions that improve information flow will
increase effort on quality and quantity. This includes information relating to information
about wages and worker grievances.
Working conditions enter the profit-maximization problem at several points. First,
the variable indicates whether the factory is deemed to be in compliance with a minimum
working conditions standard, ̅, as required by their principal customers or relevant
government agent. Here we take 1 if … ̅ and 1 if … ̅.
The size of the compliance premium is increasing in compliance reflecting the
degree of reputation sensitivity of a vendor’s principal customers. We take low-reputation
sensitive buyers to be negatively impacted by BFC generated public report of
noncompliance by its vendors. However, such buyers do not consider themselves to be the

9 | P a g e
target of anti-sweatshop activism and are, thus, not concerned intrinsically with conditions
of work in their vendors.
High reputation-sensitive buyers are concerned both with any noncompliance
publically reported by BFC and the potential of an exposé by anti-sweatshop activists.
Thus, for the high reputation-sensitive buyer, a record of BFC compliance is, in a sense,
infra-marginal. For these buyers, the threat of an exposé exists whether or not BFC is
disclosing noncompliance in its vendors.
Working conditions also reflect the HR system employed in the factory. The sign of
the partial derivative of the production function, f, with respect to a working condition
depends on the level of other working conditions and the factory manager’s information set,
. (3) The coefficient indicates the perceived marginal cost of working condition and
also depends on the manager’s information set, . (4) Working conditions affect the work
effort targeting quantity and quality.
Working conditions are the outcome of bargaining between the worker and the firm.
The bargaining function is , where , … indicates the relative bargaining
power of the firm. In the extreme case, 1, a factory manager sets working conditions
just high enough to satisfy a reservation wage requirement, . We also allow for the
possibility that the bargaining power of workers is increasing in the working conditions
variables. Improved working conditions, particularly related to two-way communication
and positive motivational techniques, may increase a sense of agency on the part of the
worker and thereby alter the bargaining parameter.
In our context, the factory manager’s information set and perceptions of the partial
derivatives of the production function, f, with respect to working conditions will be
10 | P a g e
augmented by two events. (1) A factory that attempts to come into compliance on a
particular point acquires information about the cost and benefits of compliance. (2)
Factories may also acquire technical information from its buyer on low-cost strategies on
maintaining compliance.
The solution to the firm’s optimization problem, then, produces the optimal choice
of working conditions at time t and profits that are a function of output prices, minimal
acceptable working conditions, the reservation wage and past compliance choices. That is
∗ ∗ ̅, , , , , (4)
∗ ∗ ̅, , , , ,∗ , ; 1, … , (5)
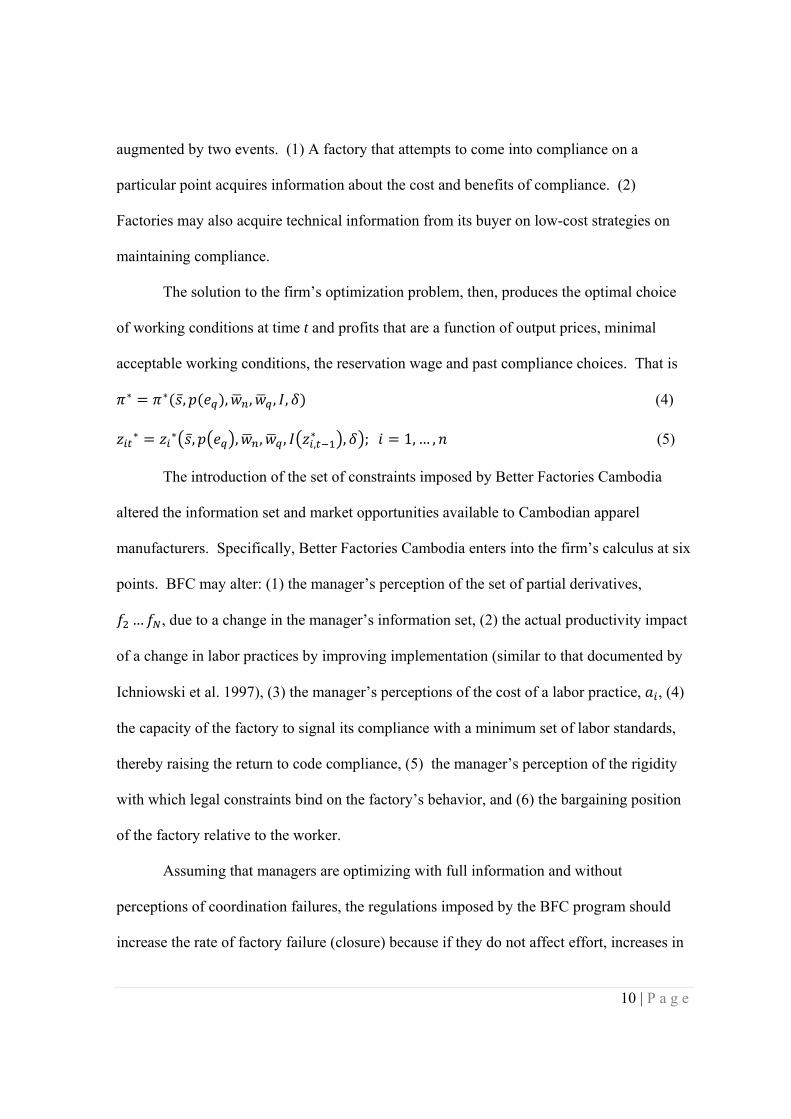
The introduction of the set of constraints imposed by Better Factories Cambodia
altered the information set and market opportunities available to Cambodian apparel
manufacturers. Specifically, Better Factories Cambodia enters into the firm’s calculus at six
points. BFC may alter: (1) the manager’s perception of the set of partial derivatives,
… , due to a change in the manager’s information set, (2) the actual productivity impact
of a change in labor practices by improving implementation (similar to that documented by
Ichniowski et al. 1997), (3) the manager’s perceptions of the cost of a labor practice, , (4)
the capacity of the factory to signal its compliance with a minimum set of labor standards,
thereby raising the return to code compliance, (5) the manager’s perception of the rigidity
with which legal constraints bind on the factory’s behavior, and (6) the bargaining position
of the factory relative to the worker.
Assuming that managers are optimizing with full information and without
perceptions of coordination failures, the regulations imposed by the BFC program should
increase the rate of factory failure (closure) because if they do not affect effort, increases in

11 | P a g e
costs (due to increasing compliance) reduce profits. Given the competitive environment, an
increase in costs induced by the program should push marginal firms past the breaking point
and cause them to fail. On the other hand, if the measures help the firm, perhaps by
increasing worker effort or productivity, then the chances of firm survival may increase. In
addition, the effects on employment (the infra-marginal measure) are also ambiguous.
Increases in effort that may come from improving working conditions may mean that fewer
workers are necessary to reach production targets. Furthermore, the model demonstrates
that improvements in different categories of working conditions should have different
effects. Categories that are most valued by workers, or, in the context of the model, most
directly affecting worker effort, are most likely to exhibit a positive correlation with
survival. Those that increase costs without increasing productivity (e.g. through effort), are
more likely to be associated with plant closings. We evaluate these statistical relationships
in the following sections.
Data
This paper uses factory-level monitoring reports matched with factory-specific
information. Factory-specific information includes ownership, unions, dates of monitoring
visits, location, and, of course, results from individual questions about working conditions in
the factory. Participation is mandatory for all exporting factories. We take the integrity of
the compliance reports at face value. While it would be naïve for us to suggest that these, or
any compliance reports anywhere in the world, are completely immune from corruption,
several sources cite the ILO and IFC involvement has providing higher integrity than might

12 | P a g e
otherwise be expected. Kotikula et al. (2015) provide a more complete discussion of the
evolution of the Better Work program.
The 2001-2002 wave of visits included 119 factories. For the next three years
monitors focused on specific concerns identified in the initial reports and did not complete
full monitoring reports. As a result, factory-level data are unavailable for the 2003-2005
period. An improved Information Management System (IMS) survey initiated the next
wave of documented visits in December 2005. Since 2005, the BFC has maintained a goal
of visiting factories about every eight months, but, in practice, some factories were visited
once per year.
Table 1 shows the number of factories by visit by year. The available data span the
2001-2010 period. As expected, the table’s upper triangular structure shows new firms
entering each year (with a first visit) and existing firms accumulating visits. The 446
individual factories identified in our data generate a total of 2,113 total observations with
the maximum number of visits observed for any factory being 10. The vast majority of the
sample (93.7%) is foreign-owned, with 42% owned by China, Hong Kong SAR, and Macau
SAR, 23.3% owned by Taiwan, and less than 3% owned by Western countries.
Since the main focus of this paper is factory closures, it is important to identify
factories that have actually closed rather than simply changed names (Watson and Everett
1999). We address this in two ways. First, the BFC program maintains a list of factories
that they have confirmed to have actually closed. We use this list as our primary indicator
of factory closings. As a secondary check, we compare the addresses of the factories over
time. Fewer than five have the same address with distinct names. We use the same factory
identifier for factories with the same address but with different names. It is possible, of

13 | P a g e
course, that factories close and then re-open at another location with a different name and
different ownership (e.g. Macau SAR may have a factory that closes and passes its business
to a firm owned by mainland China), and we treat these as separate factories.
Table 2 contains the operating status (defined as whether or not the factory closes at
some point in the sample) by operating country. The first point is that about 41% of the
factories with a first visit close during the sample period. Closure rates are highest for those
countries that had very few factories associated with them. This result may indicate that
these countries are less committed to Cambodian production and therefore provide fewer
resources that may be associated with survival, or there may be weaker supply-chain links
between these countries and Cambodia due to distance or other barriers. The financial crisis
also seems to have significantly increased factory closures. Figure 2 shows factory closures
by month during the sample period. The crisis period, roughly 2008-2010, shows a
significant increase in closures relative to the earlier period. Even as exports recover,
however (as illustrated in Figure 1), Figure 2 suggests that closures remain high.
Factory monitors use a tool that includes 405 specific questions designed to cover
the gamut of working conditions. These questions are coded with a binary variable in which
the value 1 indicates compliance and 0 indicates non-compliance. Sixty-two of the 405
questions show no variation across both factory and visit and therefore are dropped from the
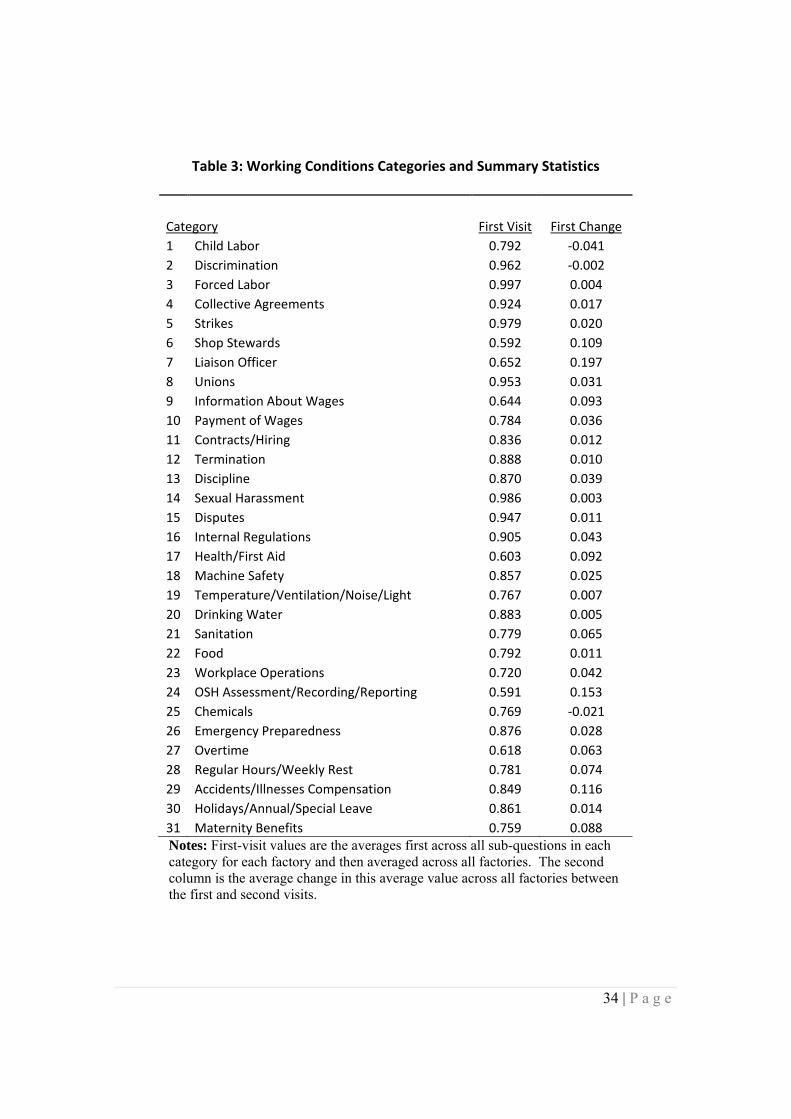
analysis. We aggregate the remaining questions into 31 categories that are listed in Table 3.
Table 3 also includes the average compliance at the first visit, which is calculated by first
taking the simple (unweighted) average of all binary compliance indicators within each
group for each factory and then taking the average of each category across all factories.

14 | P a g e
Table 3 shows significant variation across category first-period averages. Firms are
almost universally compliant (99.7%) with forced labor standards, which is not surprising
since this is widely considered to be an extremely serious violation. At the other extreme
OSH (Occupational Safety and Health) Assessment/Recording/Reporting has a much lower
compliance average of just over 59%.
It is interesting to note that sexual harassment also has extremely high compliance,
which may reflect the difficulty of accurately capturing cases. This is especially true in
countries with a limited history of legislation protecting women from workplace harassment.
A 2006 United Nations report notes that “Regardless of data collection procedures, the
actual number of women who experience sexual harassment is likely to exceed by far the
number of reported cases” (United Nations 2006, p. 68).
One characteristic of our working conditions measures is that the most significant
improvements in working conditions generally occur between the first and second visits
(Ang et al. 2012). Therefore, Table 3 also includes the change in the average across the first
and second visits. Not surprisingly, the largest changes occur in those areas with the lowest
levels of compliance in the first visit. Although not demonstrated here, we also note
improvement generally follows a similar pattern across the categories: the largest
improvements occur between the first and second visits and the absolute magnitude of
improvements falls (but generally remains positive) as the number of visits increases.
The factory-level data are then arranged to facilitate survival analysis. The first
relevant assumption for the data construction involves exposure to risk. We have no data
prior to the BFC program. In particular, we have no factory-level data prior to the BFC
program. Therefore, we make the assumption that the risk-exposure period corresponds to

15 | P a g e
the BFC period. In doing so, we are therefore evaluating the exposure to the BFC
“treatment” on survival probabilities using visits as our measure of time. As will be evident
below, we control for the financial crisis in our formal estimation.
Analysis
The analytical framework suggests that improvements to working conditions that do
not increase worker effort should be correlated with plant failure. Different categories of
working conditions may have different effects. To begin to estimate the correlations
between changes in different categories and plant failures, we begin by describing survival
analysis, which has been increasingly applied in situations similar to that studied in this
paper (e.g. Harris and Li 2010).
Survival Analysis
One of the first steps in survival analysis is to analyze the Kaplan-Meier survival
function. Figure 3 shows that the Kaplan-Meier survival estimate falls with the number of
visits. Apparel manufacturing, especially at the lower end of the value chain, is risky.
Turnover is high: factory births and deaths are common. Figure 3 reflects this by showing
the chances of survival fall through time.
One way to evaluate whether or not improvement in working conditions affects
survival is to compare the survival probability conditional only on whether or not factories
increased compliance prior to closing (or the end of the sample). Disaggregating Kaplan-
Meier survival functions between factories that improved compliance between the first and
second visit for various compliance areas, as shown in Figure 4, suggests that factories that
16 | P a g e
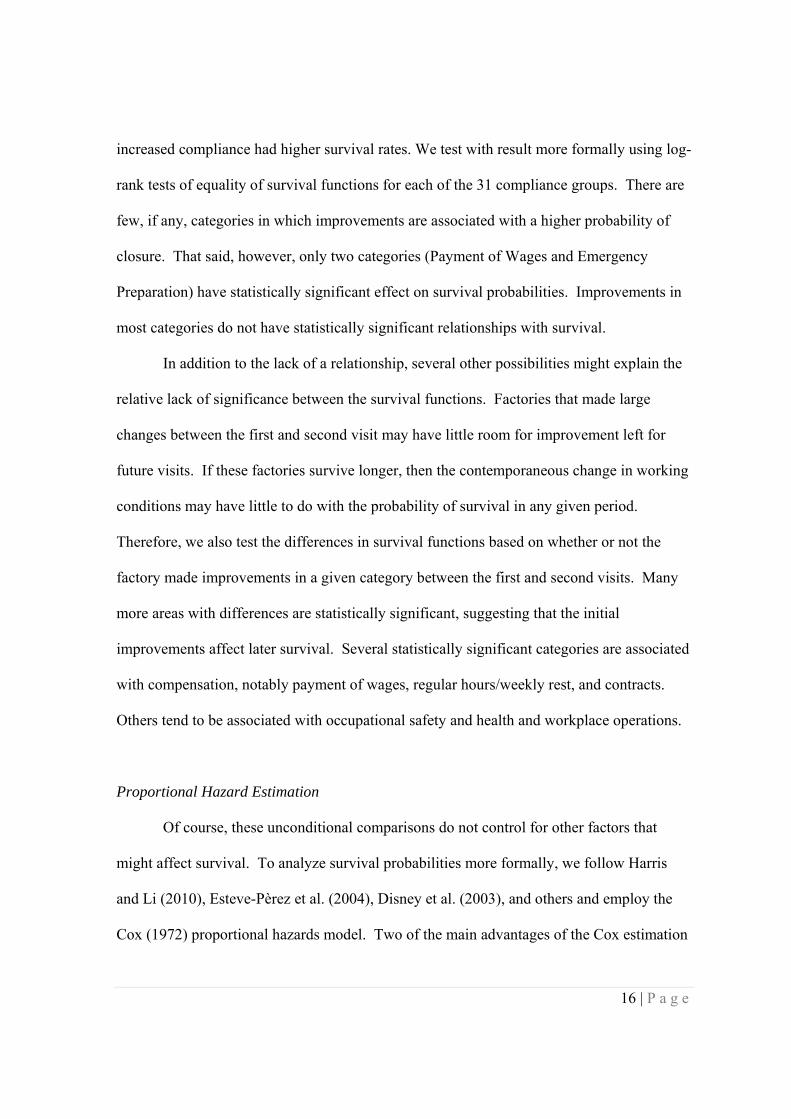
increased compliance had higher survival rates. We test with result more formally using log-
rank tests of equality of survival functions for each of the 31 compliance groups. There are
few, if any, categories in which improvements are associated with a higher probability of
closure. That said, however, only two categories (Payment of Wages and Emergency
Preparation) have statistically significant effect on survival probabilities. Improvements in
most categories do not have statistically significant relationships with survival.
In addition to the lack of a relationship, several other possibilities might explain the
relative lack of significance between the survival functions. Factories that made large
changes between the first and second visit may have little room for improvement left for
future visits. If these factories survive longer, then the contemporaneous change in working
conditions may have little to do with the probability of survival in any given period.
Therefore, we also test the differences in survival functions based on whether or not the
factory made improvements in a given category between the first and second visits. Many
more areas with differences are statistically significant, suggesting that the initial
improvements affect later survival. Several statistically significant categories are associated
with compensation, notably payment of wages, regular hours/weekly rest, and contracts.
Others tend to be associated with occupational safety and health and workplace operations.
Proportional Hazard Estimation
Of course, these unconditional comparisons do not control for other factors that
might affect survival. To analyze survival probabilities more formally, we follow Harris
and Li (2010), Esteve-Pèrez et al. (2004), Disney et al. (2003), and others and employ the
Cox (1972) proportional hazards model. Two of the main advantages of the Cox estimation

17 | P a g e
approach is that it is quite straightforward and it is robust to various (all) specifications of
the baseline hazard. It is therefore considered to be the main workhorse of survival analysis.
To save space the results are not presented, but very few of the 31 compliance
category estimates are statistically significant. In levels, drinking water, food, and
emergency preparedness are significant at the 5% level, and all of these are negative
(meaning higher levels are associated with lower probability of closure). In differences, the
sign switches for emergency preparedness, suggesting that larger improvements in this area
are associated with a higher probability of failure. The only other statistically significant
result in differences is for regular hours/weekly rest, which has a relatively large negative
coefficient, suggesting that improved compliance in regular hours regulations increases the
probability of survival. Focusing on just the change between the first and second visit
generates no statistically significant coefficients. When focusing on those firms that
improved between the first and second visit, however, the results suggest that second-visits
improvements in wage payments are associated with lower probability of failure. None of
the other estimates are statistically significant and the estimates are generally small.
This approach allows us to control for other factors that have been shown to affect
survival, such as firm size and ownership (Harris and Li 2010). These both matter. Large
firms (when measured by the log of total employment) are less likely to close. Region of
ownership is not statistically significant.
Two measures that are consistently important – both economically and statistically –
are the crisis period (equal to one after mid-2008) and being associated with a reputation-
sensitive buyer. Oka (2010a and 2010b) finds that a reputation-sensitive buyer is important
for factory compliance, and there may be additional effects here too on the probability of

18 | P a g e
survival. Reputation sensitive buyers may support their factories with higher prices in
exchange for improvements in working conditions that might improve the reputations of the
buyers. Of course, the crisis period is strongly associated with higher probability of failure.
The main message, however, is few of the individual categories are statistically
significant. There is very little, if any, evidence that improving working conditions reduces
the probability of survival. One possible concern about these results, however, is that
factories may take strategies to improve working conditions in particular areas together. In
fact, the changes in individual categories are highly correlated, and these correlations may
mask underlying factors – such as implementation costs – that drive the decisions about
compliance.
Factor Analysis
To analyze the possibility of common underlying factors, we turn to factor analysis.
The goal of factor analysis is to find a few common factors that might be driving changes of
individual categories and thereby reduce the number of variables considered by forming
linear combinations of the underlying categories into meaningful groups. One important
concern about factor analysis is that the groupings are admittedly subjective, and therefore
we explain our steps carefully.
We begin by performing a factor analysis for the 31 compliance categories using the
principle-factor method. One alternative possibility would be to employ the principle-
components factor method. This approach assumes that the commonalities are equal to one.
The problem in our case with this approach is that assuming that the commonalities are
equal to one is equivalent to assuming that the uniqueness (the proportion of the variation in

19 | P a g e
the categories explained by the underlying factors) is equal to zero. The average of our
uniqueness estimates is just over 0.65. Given that the uniqueness values are so high, the
principle components analysis is probably not appropriate.
We perform the principle-factor method on 28 of the 31 categories. The first three –
child labor, forced labor, and discrimination – correspond to the core labor standards. These
also start with generally high compliance and vary little, so we put them into a separate
group and perform the factor analysis on the remaining 28 categories.
We then perform an orthogonal rotation on the results to generate Table 4. The
factor analysis identifies nine possible factors. The maximum values of each row (category)
are shown in bold. Note that none of the maximum values appear in factors 6 and 8, so we
focus our attention on the remaining factors. Although subjective, it appears that a
meaningful pattern emerges from the pattern of results in Table 4. We use these results to
sort the 31 categories into the 5 groups shown in Table 5. As mentioned, these involve a
combination of subjective judgment and interpretation of the results in Table 4.
The next step is to replace the individual categories with the 5 factors (the core labor
standards are excluded for the same reasons described above) into the Cox estimation.
These results are shown in Table 6. Table 6 contains four columns. Column 1 uses the
mean levels of the working conditions groups. Column 2 uses the changes between visits.
Column 3 uses the change between the first and second visit. Column 4 uses an indicator
variable equal to one if the factory improved compliance in this category between the first
and second visit.
As with the individual categories coefficients, the majority of the estimates are not
statistically significant. The only variables that are statistically significant at the 5% level

20 | P a g e
(OSH in column 1 and Communication, Modern HR, and Compensation in Column 4) are
negative, suggesting that these improvements increase the changes of factory survival.
Compensation in column 1, statistically significant at the 10% level, is positive, but this
result reverses in columns (2), (3), and (4). This is the only potential evidence suggesting
that higher compliance increases the probability of factory failure, and is probably worth
continued investigation.
Total employment and being linked to a reputation-sensitive buyer increase the
probability of survival, while the crisis period (2008-2009) is strongly associated with
closure, which is consistent with Figure 2. Also consistent with Figure 2 is the fact that
even during the period in which imports recover (years after 2009), closures remain high.
The estimated coefficient on the “recovery” variable is just slightly lower than the estimated
coefficient for the crisis period, suggesting that the increase in imports was not immediately
transmitted into higher survival probabilities for factories. Ownership does not seem to
have a significant effect, and we explore this in more detail further into the paper.
It is probably important not to put too much emphasis on the statistically significant
negative coefficients for working conditions measures in Table 6. These do not appear to be
robust to the inclusion of other variables, such as the number of unions. The main message
from these results should probably be that there is surprisingly little, if any, evidence that
improvements in working conditions increase the probability of factory closure.
One additional concern that arises from Table 6 is that that foreign ownership does
not have a statistically significant effect on closure.3 The result contrasts with most
previous research of factory closure that finds foreign ownership generally increases
3 In additional unreported results, we collapse all foreign ownership into a single dummy variable and try alternative groupings of countries. These variables are also statistically insignificant in the survival analysis.

21 | P a g e
survival. One possibility is that the disaggregated country groups hide an overall distinction
between domestic (Cambodian) and foreign factories. Table 7 shows the results of
including a single control (equal to one) for foreign factories. This variable is never
statistically significant, and the rest of the results remain qualitatively similar. In particular,
column (4) shows that second-visit changes in several of the working conditions are
associated with a lower probability of closure (higher probability of survival).
Another possibility is that foreign ownership may proxy for international support
and commitment to factories, or may reflect value chain relationships (upstream and
downstream). To explore the possibility that the number of other firms of the same
nationality affect survival,4 we include this variable directly in place of the foreign
ownership controls. These results are shown in Table 8. In three of the four columns, the
number of other factories with the same ownership is statistically significant and has a
consistently negative sign. These results suggest that support networks may matter in the
sense that having more factories of the same nationality may increase the chance of survival.
These results may also alternatively suggest that the number of factories with the same
ownership reflects better market opportunities (such as stronger value chain links).
Understanding these differences may be a valuable direction for future research.
Robustness
There are several dimensions in which we explore the robustness of the results. The
first is to omit the crisis. The crisis controls that are included in the earlier tables may not
sufficiently control for the crisis. Table 9 contains the results when the crisis period is
4 We thank Martin Hess and Ross Jones for this suggestion.
22 | P a g e
excluded from the sample. If anything, the results now suggest that the correlation between
changes in working conditions and the probability of survival becomes stronger in the sense
that now three of the five groups have statistically significant coefficients (communication,
modern HR, and compensation).
Another concern is that factories that have higher initial compliance may have less
room to improve and may be more likely to survive. If so, then incompletely controlling for
initial compliance would bias the results towards zero. This argument is especially salient
for the new entrants. New entrants may learn from the experiences of previous entrants and,
presumably, adjust their starting levels of compliance in response to lessons learned from
previous entrants. Kotikula et al. (2015) show that first-visit noncompliance rates fall over
time. Note that this argument presumes that good working conditions are correlated with
survival, which runs counter to the presumption that improving working conditions imposes
disadvantageous cost increases.
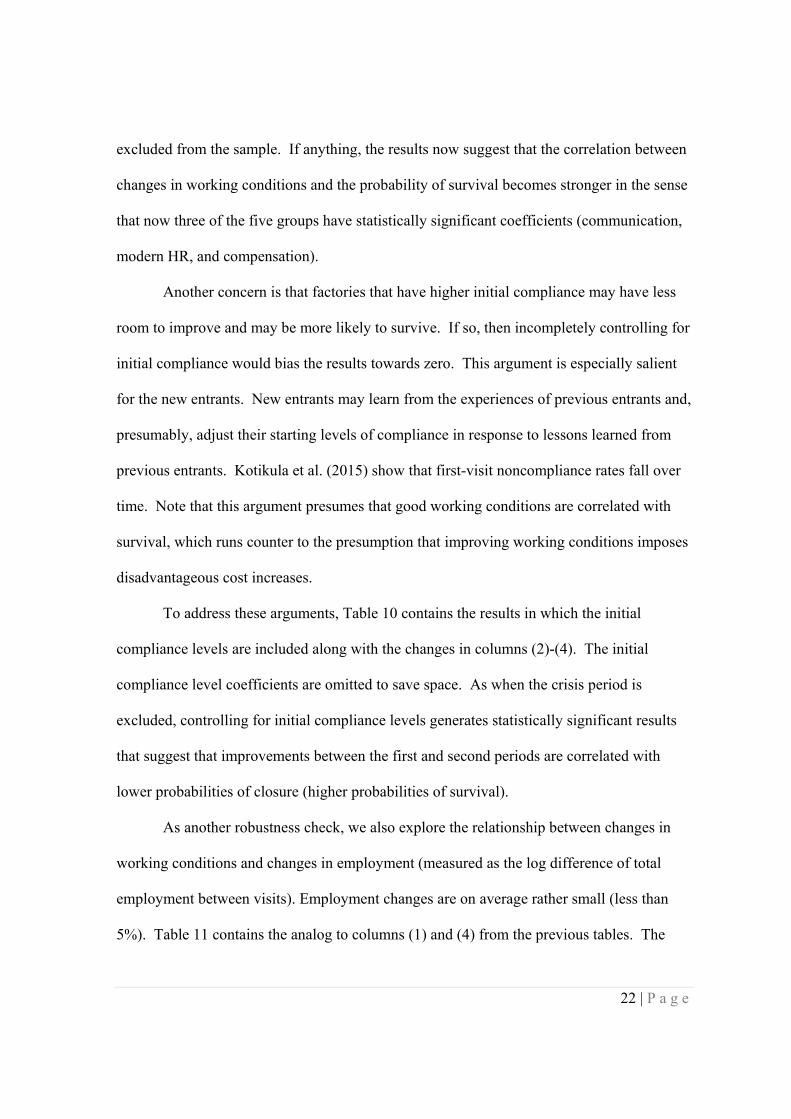
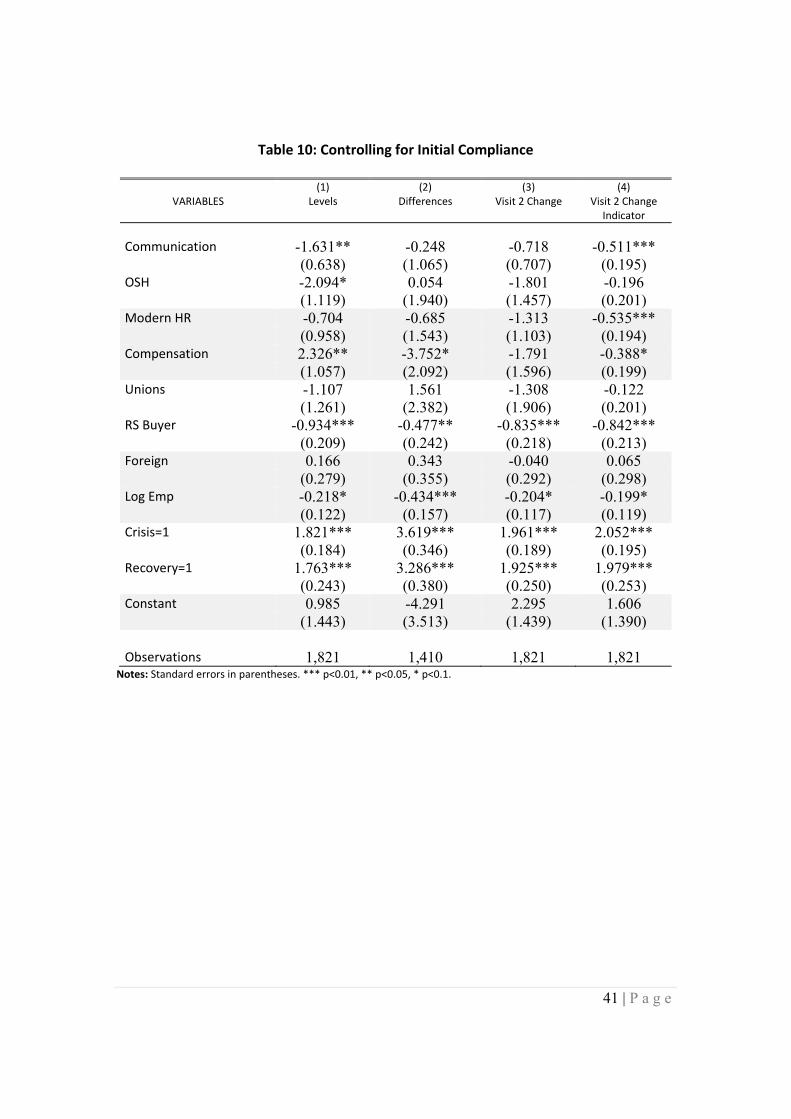
To address these arguments, Table 10 contains the results in which the initial
compliance levels are included along with the changes in columns (2)-(4). The initial
compliance level coefficients are omitted to save space. As when the crisis period is
excluded, controlling for initial compliance levels generates statistically significant results
that suggest that improvements between the first and second periods are correlated with
lower probabilities of closure (higher probabilities of survival).
As another robustness check, we also explore the relationship between changes in
working conditions and changes in employment (measured as the log difference of total
employment between visits). Employment changes are on average rather small (less than
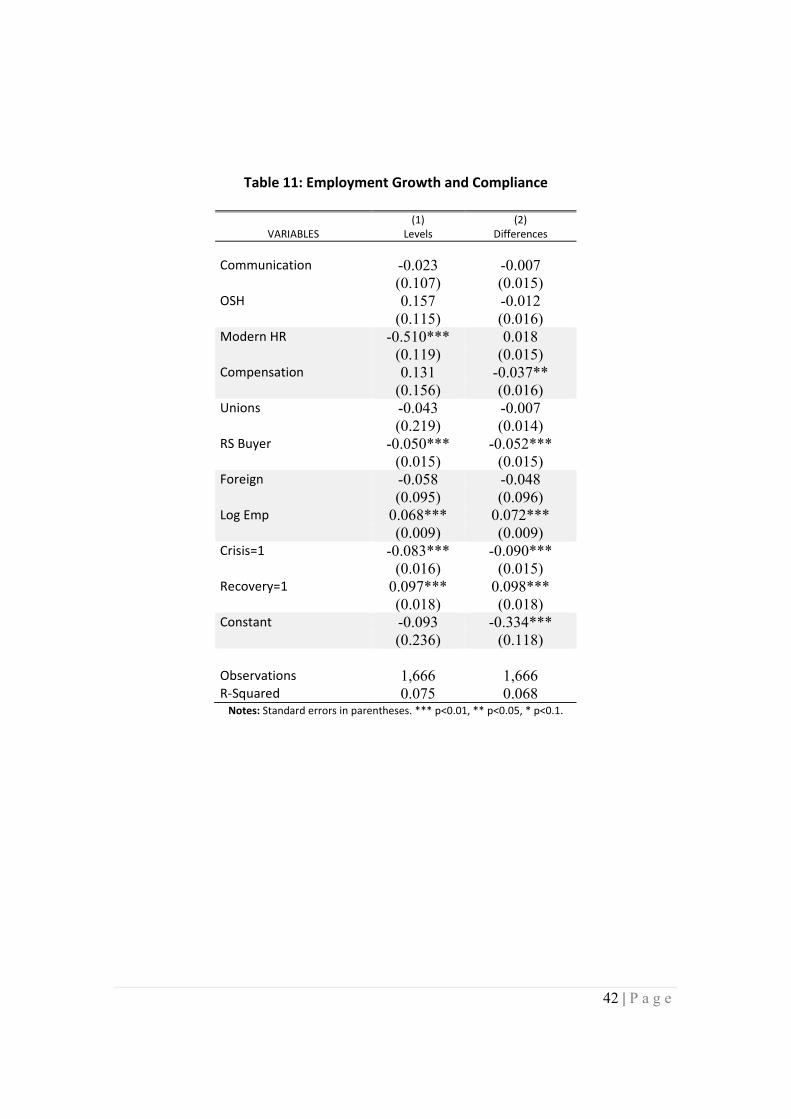
5%). Table 11 contains the analog to columns (1) and (4) from the previous tables. The

23 | P a g e
results suggest that with the exception of modern HR, the coefficients are either negative
and small or positive and not statistically significant. Modern HR is negative and
significant, suggesting firms with initially higher levels of modern HR compliance have
smaller changes in employment over time.
When considering the improvements in working conditions between the first and
second visit in column (2) we see only compensation is statistically significant and negative.
Presumably, these firms are paying higher wages and may be making a trade-off between
having fewer workers who earn more. It is also interesting that being associated with a
reputation-sensitive buyer, shown to be positively correlated with other positive firm
characteristics and outcomes, is negative and statistically significant. To explore this
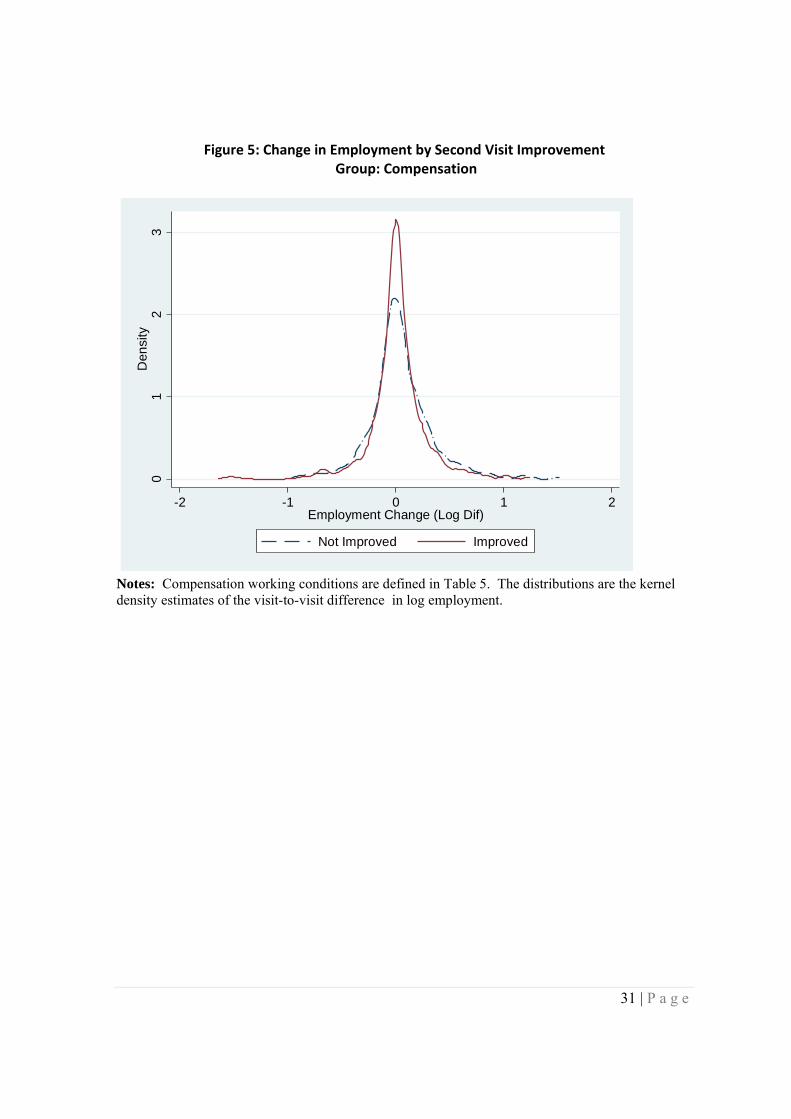
further, figure 5 shows the distributions of employment changes for firms that improved
compensation compliance between the first and second visit. Figure 5 shows that, while the
change in employment is lower, the variance is lower for firms that improved working
conditions in this area. Worker turnover is often cited as a significant cost for firms, and
figure 5 suggests that firms that improved compensation may have a lower variance in
employment (that is, less turnover), and therefore may have realized cost savings that could
possibility help explain the positive correlation between improvements in this area and the
increased probability of survival, but the causality is not definitely established here.
Conclusions
Rather than being associated with widespread failure of Cambodian factories, the
BFC program has been lauded as a success. Improvements in working conditions have been
associated with rising exports, wages, and employment. The results in this paper suggest
that, contrary to even very basic economic models, there is little evidence that

24 | P a g e
improvements in working conditions have imposed burdens great enough to cause them to
shut down.
One possible explanation for the relative lack of adverse effects is that improving
some working conditions is more likely to be positively associated with survival. If
factories have full information, then the finding of a positive relationship between working
conditions and survival (which is more prevalent in our results than support for a negative
relationship), would suggest that improving working conditions is a good decision that is
made by good managers. At the same time it is possible that factories that expect to close
(perhaps due to other poor decisions) may refrain from making the investments. Emerging
results, such as Bloom et al. (2013), however, suggest that developing country factories do
not have full information and that it is likely that the external emphasis on improving
working conditions induced policy experimentation.
Another possibility is that the positive relationship has roots in an “efficiency wage”
explanation that dates back to Alfred Marshall. This seems particularly possible given the
fact that the statistically significant negative coefficients (that suggest that improvements
reduce the probability of closure) tend to relate to compensation and modern HR practices.
Worker incentives may be associated with higher productivity, which might increase profits
for the firm is productivity increases more than compensation (broadly defined). Future
work on programs that improve working conditions should therefore focus on the link
between worker and factory output and working conditions.

25 | P a g e
References
Adler, Daniel, and Michael Woolcock (2010) “Justice without the Rule of Law? The Challenge of Rights-Based Industrial Relations in Contemporary Cambodia” In Human Rights at Work: Perspectives on Law and Regulation, ed. Colin Fenwick and Tonia Novitz. Oxford: Hart Publishing.
Álvarez, Roberto and Sebastián Vergara (2010) “Exit in Developing Countries: Economic Reforms and Plant Heterogeneity” Economic Development & Cultural Change; 58(3) (April), pp. 537-561.
Ang, Debra, Drusilla Brown, Rajeev Dehejia, Raymond Robertson (2012) “Labor Law Compliance and Human Resource Management Innovation: Better Factories Cambodia" Review of Development Economics 16(4), (November): 594-607.
Baggs, Jen (2005) “Firm Survival and Exit in Response to Trade Liberalization” Canadian Journal of Economics 38(4) (November), pp. 1364-83.
Behrman, Jere R., and Anil B. Deolalikar (1989) “. . . Of the fittest? Duration of survival of manufacturing establishments in a developing country” Journal of Industrial Economics 38(2) (December), pp. 215-226.
Beresford, Melanie (2009) “The Cambodian Clothing Industry in the post-MFA Environment: A Review of Developments” Journal of the Asia Pacific Economy 14(4) (November), pp. 366-88.
Berik, Günseli and Yana van der Meulen Rodgers (2010) “Options for Enforcing Labour Standards: Lessons from Bangladesh and Cambodia” Journal of International Development 22, pp. 56-85.
Bernard, Andrew, and J. Bradford Jensen (2007) “Firm Structure, Multinationals, and Manufacturing Plant Deaths” The Review of Economics and Statistics” 89(2) (May), pp. 193-204.
Bloom, Nicholas; Benn Eifert, Aprajit Mahajan, David McKenzie, and John Roberts (2013) “Does Management Matter? Evidence from India” The Quarterly Journal of Economics 128 (1), pp. 1-51 first published online November 18, 2012doi:10.1093/qje/qjs044
Cox, David R (1972) “Regression Models and Life-Tables” Journal of the Royal Statistical Society. Series B (Methodological) 34(2), pp.187–220.
Disney, Richard, Jonathan Haskel, and Ylva Heden (2003) “Entry, exit and establishment survival in UK manufacturing” Journal of Industrial Economics 51(1) (March), pp. 91-112
Doms, Mark, Timothy Dunne, and Mark J. Roberts. 1995. The role of technology use in the survival and growth of manufacturing plants. International Journal of Industrial Organization 13, (4) (December 1995): 523-542
Elliott, Kimberly Ann and Richard B. Freeman (2003) Can Labor Standards Improve under Globalization? Institute for International Economics, Washington, D.C.
Esteve Pérez, Silviano, Amparo Sanchis Llopis, and Juan Alberto Sanchis Llopis (2004) “The Determinants of Survival of Spanish Manufacturing Firms” Review of Industrial Organization 25(3), pp. 251-73.
Greenaway, David; Joakim Gullstrand, and Richard Kneller (2008) “Surviving Globalisation” Journal of International Economics, 74(2), pp. 264-77.
Harris, Richard I.D. and Qian Cher Li (2010) “Export-Market Dynamics and the Probability of Firm Closure: Evidence for the United Kingdom” Scottish Journal of Political Economy 57(2), (May), pp 145-168.
Harrison, Ann E. and Jason Scorse 2010 “Multinationals and Anti-Sweatshop Activism”American Economic Review, 100(1), pp. 247–73.
Ichniowski, Casey, Kathryn Saw and Biovanna Prennushi. (1997) “The Effects of Human Resource Management Practices on Productivity: A Study of Steel Finishing Lines.” American Economic Review 87(3), pp. 291-313, June.

26 | P a g e
Kotikula, Aphichoke; Milad Pournik; and Raymond Robertson (2015) Interwoven: How the Better Work Program Improves Job and Life Quality in the Apparel Sector World Bank Group, Washington D.C.
Miller, Doug, Vaasna Nuon, Charlene Aprill, and Ramon Certeza (2009) “Business as Usual? Governing the Supply Chain in Clothing - Post MFA phase-out: The case of Cambodia” International Journal of Labor Research, 1(1), pp. 10-33.
Nor, Norashidah Mohamed, Nor, Nor Ghani M, Ahmad Zainuddin Abdullah, and Suhaila A. Jalil. (2007) “Flexibility and small firms' survival: Further evidence from Malaysian manufacturing” Applied Economics Letters 14, (10-12) (August-October 2007): 931-934.
Oka, Chikako 2010a “Accounting for the Gaps in Labour Standard Compliance: The Role of Reputation-Conscious Buyers in the Cambodian Garment Industry” European Journal of Development Research 22(1): 59-78.
Oka, Chikako 2010b “Channels of Buyer Influence and Labor Standard Compliance: The Case of Cambodia’s Garment Sector” Advances in Industrial and Labor Relations 17: 153-183.
Polaski, Sandra (2006) “Combining Global and Local Forces: the Case of Labor Rights in Cambodia.” World Development 34(5), pp 919-32.
Shea, Anna, Mariko Nakayama, and Jody Heymann (2010) “Improving Labor Standards in Clothing Factories” Global Social Policy 10(1), pp. 85-110.
Shiferaw, Admasu. (2009) “Survival of private sector manufacturing establishments in Africa: The role of productivity and ownership” World Development 37(3) (March), pp. 572-584
Soderbom, Mans, Francis Teal, and Alan Harding (2006) “The determinants of survival among African manufacturing firms” Economic Development and Cultural Change 54(3) (April), pp. 533-555
United Nations (2006) “In-depth study on all forms of violence against women” Report of the Secretary-General, Sixty-first session. Item 60 (a) of the preliminary list*. Advancement of women: advancement of women. Available at “http://stopvaw.org/sites/3f6d15f4-c12d-4515-8544-26b7a3a5a41e/uploads/Sec_Gen_Study_VAW.pdf.”
Walker, W. Reed (2011) “Environmental Regulation and Labor Reallocation: Evidence from the Clean Air Act” American Economic Review 101(3), (May), pp. 442-447.
Watson, John and Jim Everett (1999) “Small Business Failure Rates: Choice of Definition and Industry Effects” International Small Business Journal 17(2), pp. 31-47.

27 | P a g e
Figure 1: U.S. Apparel Imports from Cambodia (Constant U.S. Dollars)
2040
6080
100
120
Mill
ion
s R
eal U
.S. D
olla
rs
2000 2002 2004 2006 2008 2010 2012Time

28 | P a g e
Figure 2: Post 2005 Closures by Closing Month
Notes: Graph excludes factories that did not close during the sample period. The horizontal axis is measured in months.
0.0
5.1
.15
.2D
ens
ity
2006m1 2007m1 2008m1 2009m1 2010m1Date Closed

29 | P a g e
Figure 3: Survival Estimate (All Factories)
0.00
0.25
0.50
0.75
1.00
0 2 4 6 8 10Visit
Kaplan-Meier survival estimate

30 | P a g e
Figure 4: Kaplan‐Meier Survival Estimates
Selected Compliance Categories
0.00
0.25
0.50
0.75
1.00
0 2 4 6 8 10analysis time
up10 = 0 up10 = 1
Kaplan-Meier survival estimates
0.00
0.25
0.50
0.75
1.00
0 2 4 6 8 10analysis time
up18 = 0 up18 = 1
Kaplan-Meier survival estimates
0.00
0.25
0.50
0.75
1.00
0 2 4 6 8 10analysis time
up26 = 0 up26 = 1
Kaplan-Meier survival estimates0.
000.
250.
500.
751.
00
0 2 4 6 8 10analysis time
up28 = 0 up28 = 1
Kaplan-Meier survival estimates
31 | P a g e
Figure 5: Change in Employment by Second Visit Improvement Group: Compensation
Notes: Compensation working conditions are defined in Table 5. The distributions are the kernel density estimates of the visit-to-visit difference in log employment.
01
23
Den
sity
-2 -1 0 1 2Employment Change (Log Dif)
Not Improved Improved

32 | P a g e
Table 1: Factory Visits by Year
Visit Year
Visit 2001 2002 2005 2006 2007 2008 2009 2010 2011 Total
1 85 34 7 188 30 37 27 20 18 446
2 0 0 18 122 136 34 28 16 6 360
3 0 0 0 48 186 33 24 27 5 323
4 0 0 0 0 80 152 27 20 11 290
5 0 0 0 0 11 112 82 24 12 241
6 0 0 0 0 0 38 102 42 12 194
7 0 0 0 0 0 0 52 75 20 147
8 0 0 0 0 0 0 11 43 28 82
9 0 0 0 0 0 0 0 13 12 25
10 0 0 0 0 0 0 0 3 2 5
Total 85 34 25 358 443 406 353 283 126 2,113Notes: Data are missing for 2003‐2004 because BFC monitors concentrated on previously‐identified issues rather than completing a full evaluation. See text for details.

33 | P a g e
Table 2: Operating Status by Country of Ownership
Status
Ownership Open Closed Total Close Rate
American Samoa 0 1 1 100.00%
Australia 3 1 4 25.00%
Bangladesh 1 0 1 0.00%
Cambodia 11 15 26 57.69%
Canada 0 1 1 100.00%
China 41 26 67 38.81%
Hong Kong SAR 37 40 77 51.95%
Indonesia 0 2 2 100.00%
Korea 29 12 41 29.27%
Macau SAR 0 1 1 100.00%
Malaysia 11 8 19 42.11%
Philippines 1 0 1 0.00%
Singapore 10 5 15 33.33%
Taiwan 61 28 89 31.46%
Thailand 1 0 1 0.00%
United Kingdom 1 1 2 50.00%
United States 3 1 4 25.00%
Viet Nam 0 1 1 100.00% Total 213 149 362 41.2% Notes: SAR denotes Special Administrative Region. Pursuant to an agreement signed by China and the UK on 19 December 1984, Hong Kong became the Hong Kong Special Administrative Region (SAR) of the People's Republic of China on 1 July 1997. Macau became Macau SAR 20 December 1999. There are 9 factories (3 open, 6 closed) of unknown ownership that are not included in the table.
34 | P a g e
Table 3: Working Conditions Categories and Summary Statistics
Category First Visit First Change
1 Child Labor 0.792 ‐0.041
2 Discrimination 0.962 ‐0.002
3 Forced Labor 0.997 0.004
4 Collective Agreements 0.924 0.017
5 Strikes 0.979 0.020
6 Shop Stewards 0.592 0.109
7 Liaison Officer 0.652 0.197
8 Unions 0.953 0.031
9 Information About Wages 0.644 0.093
10 Payment of Wages 0.784 0.036
11 Contracts/Hiring 0.836 0.012
12 Termination 0.888 0.010
13 Discipline 0.870 0.039
14 Sexual Harassment 0.986 0.003
15 Disputes 0.947 0.011
16 Internal Regulations 0.905 0.043
17 Health/First Aid 0.603 0.092
18 Machine Safety 0.857 0.025
19 Temperature/Ventilation/Noise/Light 0.767 0.007
20 Drinking Water 0.883 0.005
21 Sanitation 0.779 0.065
22 Food 0.792 0.011
23 Workplace Operations 0.720 0.042
24 OSH Assessment/Recording/Reporting 0.591 0.153
25 Chemicals 0.769 ‐0.021
26 Emergency Preparedness 0.876 0.028
27 Overtime 0.618 0.063
28 Regular Hours/Weekly Rest 0.781 0.074
29 Accidents/Illnesses Compensation 0.849 0.116
30 Holidays/Annual/Special Leave 0.861 0.014
31 Maternity Benefits 0.759 0.088 Notes: First-visit values are the averages first across all sub-questions in each category for each factory and then averaged across all factories. The second column is the average change in this average value across all factories between the first and second visits.

35 | P a g e
Table 4: Factor Analysis Results
Variable Factor1 Factor2 Factor3 Factor4 Factor5 Factor6 Factor7 Factor8 Factor9 Collective Agreements 0.115 0.196 0.085 0.229 0.058 0.063 0.287 0.078 0.040 Strikes 0.029 0.003 -0.014 -0.050 0.300 0.009 0.005 0.058 -0.054 Shop Stewards 0.193 -0.034 0.040 0.064 0.063 0.003 -0.039 -0.234 -0.032 Liaison Officer 0.297 0.239 0.155 0.287 0.065 0.146 0.283 0.020 0.005 Unions 0.050 0.119 -0.009 0.100 0.387 0.013 0.017 -0.071 -0.029 Information About Wages 0.233 0.392 0.149 0.318 0.056 0.129 -0.044 0.016 0.054 Payment of Wages 0.271 0.391 0.241 0.395 -0.001 0.067 0.022 0.008 0.064 Contracts/Hiring 0.318 0.287 0.285 0.497 0.023 0.010 0.056 0.031 -0.007 Termination 0.148 0.301 0.161 0.219 0.018 0.019 -0.037 -0.050 0.013 Discipline 0.146 0.440 0.150 0.230 0.051 -0.059 0.132 -0.048 0.069 Sexual Harassment 0.019 0.099 -0.011 -0.013 -0.030 -0.058 0.091 0.024 0.053 Disputes 0.147 0.084 0.071 0.151 0.342 -0.041 0.048 0.025 0.105 Internal Regulations 0.204 0.258 0.134 0.329 -0.036 0.143 0.117 0.240 -0.060 Health/First Aid 0.769 0.194 0.300 0.213 0.027 0.092 0.030 0.010 0.031 Machine Safety 0.303 0.189 0.506 0.284 -0.002 0.205 0.023 -0.025 -0.032 Temperature/Ventilation 0.247 0.123 0.627 0.086 0.005 -0.010 -0.024 0.057 0.003 Drinking Water 0.315 0.230 0.338 0.198 -0.010 0.048 0.034 -0.020 0.196 Sanitation 0.321 0.223 0.467 0.235 0.056 0.044 0.071 -0.031 0.200 Food 0.691 0.118 0.150 0.033 0.023 -0.093 -0.016 -0.005 -0.024 Workplace Operations 0.308 0.153 0.630 0.115 0.004 -0.034 0.038 -0.035 -0.037 OSH Assessment/Recordin 0.440 0.230 0.227 0.323 -0.016 0.273 0.159 -0.033 -0.012 Chemicals 0.102 0.072 0.086 -0.033 -0.036 0.018 -0.047 -0.037 -0.077 Emergency Preparedness 0.321 0.138 0.416 0.262 -0.012 0.336 0.045 0.064 0.035 Overtime 0.217 0.673 0.166 0.177 0.061 0.036 0.023 -0.024 0.017 Regular Hours/Weekly Re 0.183 0.607 0.146 0.113 -0.047 0.047 0.014 0.072 -0.028 Accidents/Illnesses Com 0.094 0.221 0.137 0.375 0.101 0.064 0.055 -0.003 0.089 Holidays/Annual/Special 0.264 0.430 0.234 0.491 0.079 -0.021 0.081 0.013 0.014 Maternity Benefits 0.325 0.217 0.232 0.507 0.019 0.077 -0.037 -0.048 0.017
Notes: Principle factor method used to analyze the correlation matrix. Communality estimated with squared multiple correlations. Orthogonal rotation applied. Principle Components factor analysis not used because the mean value of resulting uniqueness is over 0.65. Maximum values in bold.

36 | P a g e
Table 5: Groupings Resulting from Factor Analysis
Group 1: Communication and Workplace Systems Group 4: Compensation 6 Shop Stewards 10 Payment of Wages 7 Liaison Officer 11 Contracts/Hiring
23 Workplace Operations 16 Internal Regulations 29 Accidents/Illnesses Com Group 2: Occupational Safety and Health 30 Holidays/Annual/Special 17 Health/First Aid 31 Maternity Benefits 18 Machine Safety 19 Temperature/Ventilation Group 5: Unions 20 Drinking Water 4 Collective Agreements 21 Sanitation 5 Strikes 22 Food 8 Unions 24 OSH Assessment/Recording 14 Sexual Harassment 25 Chemicals 15 Disputes 26 Emergency Preparedness Group 3: Modern HR Practices Group 6: Core Labor Standards 9 Information About Wages 1 Child Labor
12 Termination 2 Discrimination 13 Discipline 3 Forced Labor 27 Overtime 28 Regular Hours/Weekly Rest

37 | P a g e
Table 6: Compliance Groups and Closure Probabilities
(1) (2) (3) (4) VARIABLES Levels Differences Visit 2 Change Visit 2 Change
Indicator
Communication -1.512** -0.235 0.143 -0.507*** (0.638) (0.967) (0.682) (0.185) OSH -2.018* -0.467 -1.626 -0.229 (1.112) (1.745) (1.468) (0.195) Modern HR -0.720 -1.262 -1.025 -0.459** (0.956) (1.395) (1.097) (0.191) Compensation 2.057* -2.829 -2.828* -0.541*** (1.057) (1.885) (1.507) (0.192) Unions -0.712 2.202 -0.841 -0.085 (1.191) (2.082) (1.820) (0.196) RS Buyer -0.957*** -0.431* -1.086*** -1.006*** (0.213) (0.240) (0.215) (0.212) Owned: Anglo -0.106 -0.278 -0.062 -0.194 (0.304) (0.374) (0.305) (0.314) Owned: Korea -0.351 -0.257 -0.426 -0.396 (0.397) (0.459) (0.402) (0.406) Owned: China -0.222 -0.407 -0.217 -0.283 (0.295) (0.362) (0.306) (0.307) Owned: Other Asia -0.180 -0.249 -0.267 -0.100 (0.372) (0.422) (0.372) (0.385) Owned: Other 0.790* -0.065 1.059** 0.890* (0.460) (0.685) (0.459) (0.461) Log Emp -0.236* -0.376** -0.288*** -0.267** (0.122) (0.148) (0.110) (0.112) Crisis=1 1.836*** 3.535*** 1.865*** 1.923*** (0.188) (0.344) (0.186) (0.189) Recovery=1 1.737*** 3.181*** 1.692*** 1.767*** (0.245) (0.376) (0.244) (0.246) Constant 0.979 -1.578 -0.466 0.096 (1.398) (1.024) (0.733) (0.743) Observations 1,821 1,410 1,822 1,822 Notes: Standard errors in parentheses. *** p<0.01, ** p<0.05, * p<0.1. Estimation: Stcox. Positive coefficients represent higher probability of closure. OSH stands for Occupational Safety and Health as described in Table 7. RS Buyer indicates “Reputation Sensitive Buyer.” “Log Emp” represents the natural log of total employment. The omitted category for the “Owned” (Nation of ownership variables) is Cambodia. “Crisis” represents calendar years 2008 and 2009. “Recovery” represents years after 2009. Compliance categories are described in Table 5.

38 | P a g e
Table 7: Aggregate Foreign Ownership
(1) (2) (3) (4)
VARIABLES Levels Differences Visit 2 Change Visit 2 Change Indicator
Communication -1.631** -0.238 0.277 -0.510*** (0.638) (0.963) (0.665) (0.187) OSH -2.094* -0.391 -1.293 -0.220 (1.119) (1.730) (1.449) (0.195) Modern HR -0.704 -1.305 -1.343 -0.533*** (0.958) (1.382) (1.070) (0.186) Compensation 2.326** -2.708 -2.685* -0.502*** (1.057) (1.864) (1.514) (0.189) Unions -1.107 2.172 -0.928 -0.052 (1.261) (2.083) (1.815) (0.195) RS Buyer -0.934*** -0.408* -1.058*** -0.954*** (0.209) (0.235) (0.212) (0.208) Foreign 0.166 0.327 0.144 0.200 (0.279) (0.340) (0.285) (0.291) Log Emp -0.218* -0.361** -0.269** -0.248** (0.122) (0.146) (0.109) (0.112) Crisis=1 1.821*** 3.559*** 1.854*** 1.928*** (0.184) (0.342) (0.183) (0.186) Recovery=1 1.763*** 3.185*** 1.736*** 1.805*** (0.243) (0.373) (0.243) (0.245) Constant 0.985 -2.019** -0.760 -0.243 (1.443) (0.965) (0.695) (0.716) Observations 1,821 1,410 1,822 1,822
Notes: Standard errors in parentheses. *** p<0.01, ** p<0.05, * p<0.1. “National Factories” is the number of factories in the sample with the same national ownership.

39 | P a g e
Table 8: National External Economies
(1) (2) (3) (4)
VARIABLES Levels Differences Visit 2 Change Visit 2 Change Indicator
Communication -1.675*** -0.077 0.197 -0.556*** (0.637) (0.958) (0.660) (0.183) OSH -2.023* -0.602 -1.439 -0.227 (1.115) (1.759) (1.454) (0.190) Modern HR -0.858 -1.146 -1.171 -0.526*** (0.965) (1.414) (1.067) (0.185) Compensation 2.216** -2.912 -2.708* -0.511*** (1.072) (1.915) (1.510) (0.189) Unions -1.025 2.423 -0.933 -0.066 (1.221) (2.103) (1.813) (0.194) RS Buyer -0.981*** -0.500** -1.087*** -1.004*** (0.211) (0.235) (0.211) (0.209) National Factories -0.003** -0.005** -0.002 -0.003** (0.001) (0.002) (0.001) (0.001) Log Emp -0.235* -0.403*** -0.284*** -0.276** (0.122) (0.147) (0.109) (0.111) Crisis=1 1.805*** 3.542*** 1.843*** 1.913*** (0.184) (0.342) (0.183) (0.186) Recovery=1 1.780*** 3.206*** 1.743*** 1.815*** (0.243) (0.373) (0.242) (0.245) Constant 1.504 -1.268 -0.457 0.293 (1.426) (1.003) (0.718) (0.740) Observations 1,821 1,410 1,822 1,822
Notes: Standard errors in parentheses. *** p<0.01, ** p<0.05, * p<0.1. “National Factories” is the number of factories in the sample with the same national ownership.

40 | P a g e
Table 9: Omitting the Crisis
(1) (2) (3) (4) VARIABLES Levels Differences Visit 2 Change Visit 2 Change
Indicator
Communication -3.775*** 1.069 0.168 -1.064*** (0.841) (1.265) (1.027) (0.278) OSH -1.386 2.772 -3.889 -0.414 (1.331) (2.414) (2.680) (0.294) Modern HR 0.135 1.707 -1.500 -0.646** (1.194) (2.184) (1.671) (0.291) Compensation 1.062 -5.067 -4.916* -0.867*** (1.367) (3.199) (2.564) (0.323) Unions -1.374 2.999 -0.708 -0.092 (1.234) (2.763) (2.410) (0.329) RS Buyer -1.394*** -0.663* -1.667*** -1.609*** (0.301) (0.381) (0.296) (0.297) Foreign 0.250 0.663 0.340 0.155 (0.364) (0.506) (0.393) (0.366) Log Emp -0.117 -0.412 -0.246* -0.180 (0.166) (0.267) (0.134) (0.138) Recovery=1 1.892*** 3.207*** 1.776*** 2.113*** (0.254) (0.378) (0.255) (0.265) Constant 1.915 -1.808 -0.590 -0.091 (1.568) (1.697) (0.857) (0.885) Observations 1,550 1,214 1,551 1,551
Notes: Standard errors in parentheses. *** p<0.01, ** p<0.05, * p<0.1. “National Factories” is the number of factories in the sample with the same national ownership.
41 | P a g e
Table 10: Controlling for Initial Compliance
(1) (2) (3) (4) VARIABLES Levels Differences Visit 2 Change Visit 2 Change
Indicator
Communication -1.631** -0.248 -0.718 -0.511*** (0.638) (1.065) (0.707) (0.195) OSH -2.094* 0.054 -1.801 -0.196 (1.119) (1.940) (1.457) (0.201) Modern HR -0.704 -0.685 -1.313 -0.535*** (0.958) (1.543) (1.103) (0.194) Compensation 2.326** -3.752* -1.791 -0.388* (1.057) (2.092) (1.596) (0.199) Unions -1.107 1.561 -1.308 -0.122 (1.261) (2.382) (1.906) (0.201) RS Buyer -0.934*** -0.477** -0.835*** -0.842*** (0.209) (0.242) (0.218) (0.213) Foreign 0.166 0.343 -0.040 0.065 (0.279) (0.355) (0.292) (0.298) Log Emp -0.218* -0.434*** -0.204* -0.199* (0.122) (0.157) (0.117) (0.119) Crisis=1 1.821*** 3.619*** 1.961*** 2.052*** (0.184) (0.346) (0.189) (0.195) Recovery=1 1.763*** 3.286*** 1.925*** 1.979*** (0.243) (0.380) (0.250) (0.253) Constant 0.985 -4.291 2.295 1.606 (1.443) (3.513) (1.439) (1.390) Observations 1,821 1,410 1,821 1,821
Notes: Standard errors in parentheses. *** p<0.01, ** p<0.05, * p<0.1.
42 | P a g e
Table 11: Employment Growth and Compliance
(1) (2) VARIABLES Levels Differences
Communication -0.023 -0.007 (0.107) (0.015) OSH 0.157 -0.012 (0.115) (0.016) Modern HR -0.510*** 0.018 (0.119) (0.015) Compensation 0.131 -0.037** (0.156) (0.016) Unions -0.043 -0.007 (0.219) (0.014) RS Buyer -0.050*** -0.052*** (0.015) (0.015) Foreign -0.058 -0.048 (0.095) (0.096) Log Emp 0.068*** 0.072*** (0.009) (0.009) Crisis=1 -0.083*** -0.090*** (0.016) (0.015) Recovery=1 0.097*** 0.098*** (0.018) (0.018) Constant -0.093 -0.334*** (0.236) (0.118) Observations 1,666 1,666 R‐Squared 0.075 0.068 Notes: Standard errors in parentheses. *** p<0.01, ** p<0.05, * p<0.1.