working capital management (wcm) and firm performance in
TRANSCRIPT
http://afr.sciedupress.com Accounting and Finance Research Vol. 10, No. 1; 2021
Published by Sciedu Press 36 ISSN 1927-5986 E-ISSN 1927-5994
Working Capital Management (WCM) and Firm Performance in
Emerging Markets: A Case of Bangladesh
Rafiqul Bhuyan1, Mohammad Sogir Hossain Khandoker2, Noshin Tasneem2 & Mahjuja Taznin1
1 Department of Accounting and Finance, Alabama A&M University, USA
2 Department of Finance, Jagannath University, Bangladesh
Correspondence: Rafiqul Bhuyan, Department of Accounting and Finance, Alabama A&M University, USA.
Received: March 7, 2020 Accepted: February 24, 2021 Online Published: February 25, 2021
doi:10.5430/afr.v10n1p36 URL: https://doi.org/10.5430/afr.v10n1p36
Abstract
We examine the impact of efficient working capital management on market value and profitability. Using secondary
data on selected firms from Dhaka Stock Exchange we explore the effects of various working capital components
(i.e. cash conversion cycle (CCC), current ratio (CR), current asset to total asset ratio (CATAR), current liabilities to
total asset ratio (CLTAR), debt to asset ratio (DTAR), size and growth) to the firm’s performance by looking firm’s
value i.e. Tobin’s Q (TQ) and profitability i.e. return on asset (ROA) and return on invested capital (ROIC). Our
results show that, for both food and overall manufacturing sectors, there is a significant association between working
capital variables and firm’s value & return on assets, but an insignificant association with return on invested capital.
Keywords: working capital management, Tobin’s Q, Return on Asset, Return on Invested Capital, Cash conversion
cycle
1. Introduction
Working capital management (WCM) is as equally important as long-term capital management in adding values to
share holders’ wealth and in any firm’s sustained performance. It is no difference for firms in developing economies
where, inefficiency in working capital management can have significant negative impact in firm’s profitability,
liquidity management, and overall performance. Efficiency in working capital management is vital, especially for
manufacturing sector as it accounts for over half of its total assets and thereby directly affects the profitability and
liquidity of the company (Raheman & Nasir, 2007). Trade credit and inventories influence firm value (see, for
instance, Bao & Bao, 2004; Emery, 1984). Maness and Zietlow (2004) develop two models of value creation that
incorporate effective short-term financial management activities. Similarly, Schiff and Lieber (1974), Sartoris and
Hill (1983), and Kim and Chung (1990) model the effects of working capital management practices on firm value.
Sartoris and Hill (1983) and Kim and Chung (1990) provide models that focus on how the joint management of a
firm’s credit policies and inventories influences firm value. Although the notion that efficiency of WCM affects firm
value seems to enjoy wide acceptance, the empirical evidence on the value effect of working capital investment is
scarce (Baños-Caballeroet al., 2014). Most of the previous empirical research has focused on the working capital
determinants (e.g., Garcia-Teruel & Solano, 2010; Anagnostopoulou, 2012), policy practices (e.g., Afza & Nazir,
2007; Pandey, Gupta &Perera, 1997; Perera, & Wickremasinghe, 2010; Bei & Wijewardena, 2012) and relationship
between WCM and accounting performance of companies (e.g., Deloof 2003; Padachi 2006). Majority of the
empirical studies confirm a negative relationship between WCM measures and accounting profitability measures
(e.g., Deloof, 2003; Lazaridis and Tryfonidis, 2006; Garcia-Teruel and Martinez Solano, 2007; Jayarathne, 2014).).
Sometimes, insufficient working capital management may also lead to bankruptcy, even though their profitability
constantly grows positive (Samiloglu & Demirgunes, 2008). Every firm tries to maintain an optimum level of
working capital management that maximizes the value of the firm (Deloof, 2003; Howorth & Westhead, 2003; Afza
& Nazir, 2007). There is extant literature on working capital management focusing on firm’s performance and
growth (Lamberson, 1995; Shin and Soenen, 1998; Narware, 2004, Lazaridies and Tryfonidis, 2006; Padachi, 2006;
Afza and Nazir, 2007; Chowdhury and Amin, 2007; Ganesan,2007; Raheman and Nasr,2007; Uyar, 2009;Mathuva,
2010; Mansoor and Muhammad, 2010;Valipour, Javad and Farsi (2012); Naimulbari, 2012 ). Bangladesh is
considered as one of the promising and growing economies among the emerging countries in Asia. In this country,
there are several manufacturing companies like Cement, British American Tobacco Bangladesh, Textile,
Pharmaceutical, and GlaxoSmithkline Bangladesh. It would be interesting research question to explore how working
http://afr.sciedupress.com Accounting and Finance Research Vol. 10, No. 1; 2021
Published by Sciedu Press 37 ISSN 1927-5986 E-ISSN 1927-5994
capital management in such companies is impacting on its profitability an overall performance. Taking a sample of
manufacturing companies listed in DSE (Dhaka Stock Exchange) we explore this question. Earlier studies focuses on
the relationship between working capital management with the firm’s profitability in the case of Bangladesh
(Mansoor and Muhammad, 2010;Valipour, Javad and Farsi (2012); Naimulbari, 2012). We add to the current
literature by studying the impact of working capital management on firm’s market value and profitability of
Bangladeshi companies.
1.1. Literature Review
The importance of working capital management is not new to the finance literature and the review of prior literature
reveals that there exists a significant relationship between firm performance and working capital management.
Efficient working capital management involves managing short-term assets and short-term liabilities in a way that
provides balance to cope with short-term debts and avoiding unnecessary holdings in these assets. Vajasaradhi and
Rao (1978) find that increases in the investment of current assets, resulted in higher carrying cost which is negatively
affected the profitability of the sector by studying Indian public enterprise. In an empirical study on the
interrelationship between working capital management and profitability of 31 companies in Tamil Nadu, Vijaykumar
and Venkatachalam (1995) show negative influence of liquidity and positive influence of inventory turnover on
profitability. Mallik and Sur (1998) conduct research in the Indian tea industry to assess the influence of inventory
turnover and debtor turnover profitability and observe both negative and positive association. Shin and Soenen
(1998) examine the relationship between a firm’s profitability and net trade cycle and find that a strong relationship
exists between the two variables. Sivarama (1999) derives a close association between profitability and working
capital efficiency in the study of working capital management in the Indian paper industry. By using the cash
conversion cycle as a liquidity indicator in Greek food industry, Lyroudi & Lazaridis (2000) find significant positive
relationship between cash conversion cycle and the traditional liquidity measures of current and quick ratios. They
find a negative relationship between the current and quick ratios and debt to equity ratio and a positive relationship
with the time's interest earned ratio. Bardia (2004) focuses on steel manufacturing sectors and concludes a favorable
influence of the liquidity of the company on its profitability. Deloof (2003) performs similar studies on
Belgian non-financial sectors using DSO, inventories, and accounts payable cash conversion cycle as a measurement
tool for trade creditor, inventory policies and WCM respectively and reveals that corporate profitability would
increase if the number of day’s accounts receivables and inventories are reduced. Narware (2004) also finds similar
evidence on fertilizing sector that an increase in a company's profitability was lower than a decrease in working
capital ratio.
The cash conversion cycle has been broadly used as a key component representing working capital. One of the
earlier studies done by Jose, et al (1996) for the twenty-year period from 1974 through 1993 of 2718 firms offers
strong evidence that aggressive working capital policies indicate by shorter cash conversion cycle enhance
profitability. Looking at manufacturing firms in Greece, Lazaridis and Tryfonidis (2006) also that show there is a
statistical significance between profitability, measured through gross operating profit and the cash conversion cycle.
Padachi (2006) finds that high investment in inventories and in receivables are associated with lower profitability.
Christopher and Kamalavalli, (2009), focusing on corporate hospitals in India show that working capital component
namely current ratio, current assets to operating income and leverage negatively influence profitability. However, the
study was done by Raheman & Nazir (2007) on Pakistani manufacturing firms demonstrate a strong negative
relationship exists between variables of the working capital management (represents by liquidity and debt) with the
profitability of the firm. Whilst, Afza and Nazir (2007) through cross-sectional regression models on working capital
policies, profitability and risk of the firms, find a negative relationship between profitability measures of firms and
degree of aggressiveness on working capital investment and financing policies. Ganesan (2007) analyzes the working
capital management efficiency of firms from the telecommunication equipment industry and finds evidence that even
though “day’s working capital” is a negative correlation to the profitability, it is not significantly impacting the
profitability of the firm. While Chowdhury and Amin (2007) find a positive correlation between working capital
management with the financial performance of the Pharmaceutical industries in Bangladesh. Kieschnick et al (2008)
study the importance of working capital management on US firms and show that an extra dollar invested in net
working capital on average lowers firm value. Uyar (2009) studies similar issues on manufacturing firms in Turkey
and indicates that the firms with shorter CCC are more likely to be more profitable than the firms with longer CCC.
Nazir (2009) analyzes on the impact of aggressiveness of working capital investment and financing policies on
non-financial firms in Pakistan. They evaluate firm returns i.e. return on assets and Tobin’s Q to represent market
performance and indicate that firms adopting an aggressive approach towards working capital financing policy create
more value to the firm while the inverse relationship between the aggressiveness of working capital investment
http://afr.sciedupress.com Accounting and Finance Research Vol. 10, No. 1; 2021
Published by Sciedu Press 38 ISSN 1927-5986 E-ISSN 1927-5994
policies on firm performance. Similar results are also found in Afza and Nazir (2007). Deelof (2003) analyzes a
sample of Belgian firms, and Wang (2002) analyzes a sample of Japanese and Taiwanese firms, emphasizing that the
way the working capital is managed has a significant impact on the profitability of firms and increase in profitability
by reducing number of day’s accounts receivable and reducing inventories. Soenen (1993), Shin and Soenen (1998),
Deloof (2003), and Garcia-Teruel and MartinezSolano (2007) provide evidence that the profitability of a firm,
measured by either return on assets or return on equity, is improved as the firm improves its management of its
working capital (i.e. the profitability of a firm is inversely related to its cash conversion cycle). Eljelly (2004) finds
that working capital management is one of the most important areas while making the liquidity and profitability
comparison among firms, involving the decision of the amount and composition of current assets and the financing
of these assets. The way of managing working capital can have a significant impact on both the liquidity and the
profitability of the company (Shin & Soenen, 1998). There are a very few empirical research conducted on working
capital components and firm profitability in Bangladesh. Ahmed et al (2017) analyze the impact of working capital
management on profitability of textile companies of Bangladesh conclude that there is a statistically significant
relationship between working capital management and profitability. Hoque, et al (2015) study on working capital
management and profitability on Cement Companies in Bangladesh and find that there is significant positive
correlation between profitability and working capital components as well as the impact of day sales outstanding
(DSO) on profitability ratios is negatively significant. Asaduzzam and Chowdhury investigate the effect of working
capital management on firm profitability on the textile companies of Bangladesh and reveal that inventory of number
of days, number of day’s accounts receivables and cash conversion period are positively correlated with firm’s
profitability but the numbers of days accounts payable are negatively correlated. We strive to add to the lieterature by
focusing on the impact of working capital management on firm’s market value and profitability looking at food and
overall manufacturing sectors.
2. Data and Methodology
We collect secondary data from Dhaka Stock Exchange (DSE) on 24 listed companies for the period ranging from
2010 to 2016. Out of these 24 companies 16 are food sector & 8 companies are overall manufacturing sector). The
sample data of 2017 is eliminated because of the calculation of growth and the recent data of fiscal year 2018-19 is
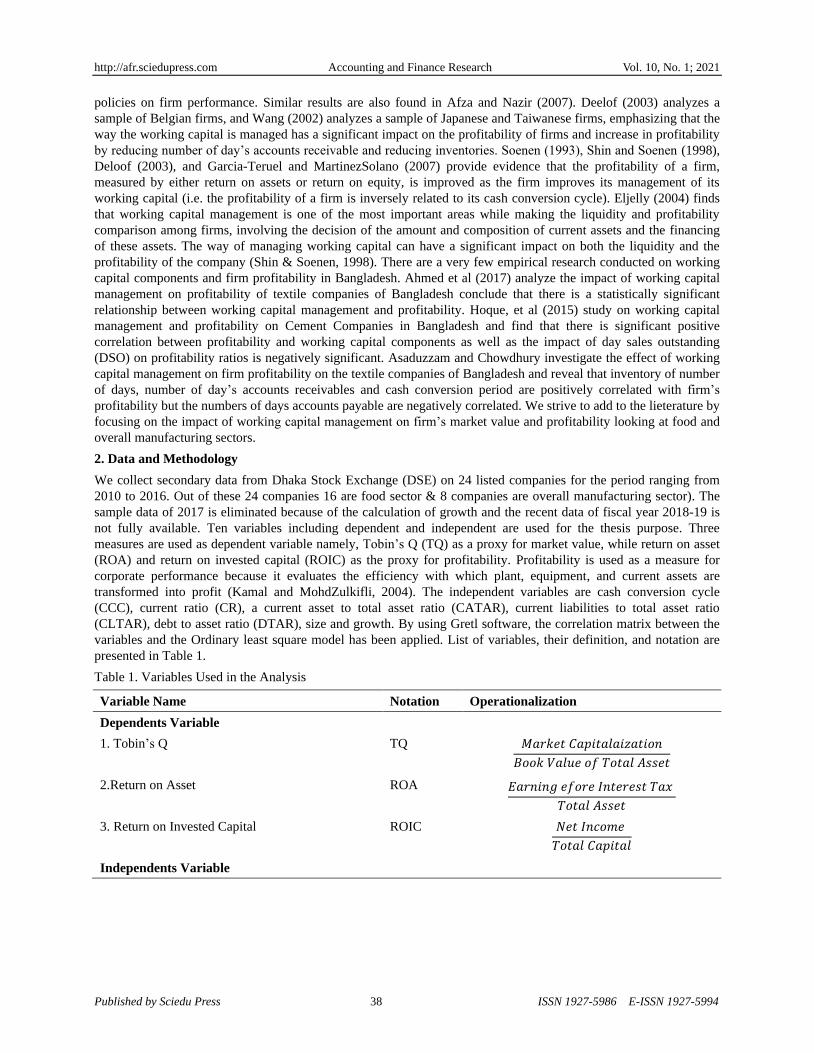
not fully available. Ten variables including dependent and independent are used for the thesis purpose. Three
measures are used as dependent variable namely, Tobin’s Q (TQ) as a proxy for market value, while return on asset
(ROA) and return on invested capital (ROIC) as the proxy for profitability. Profitability is used as a measure for
corporate performance because it evaluates the efficiency with which plant, equipment, and current assets are
transformed into profit (Kamal and MohdZulkifli, 2004). The independent variables are cash conversion cycle
(CCC), current ratio (CR), a current asset to total asset ratio (CATAR), current liabilities to total asset ratio
(CLTAR), debt to asset ratio (DTAR), size and growth. By using Gretl software, the correlation matrix between the
variables and the Ordinary least square model has been applied. List of variables, their definition, and notation are
presented in Table 1.
Table 1. Variables Used in the Analysis
Variable Name Notation Operationalization
Dependents Variable
1. Tobin’s Q TQ 𝑀𝑎𝑟𝑘𝑒𝑡 𝐶𝑎𝑝𝑖𝑡𝑎𝑙𝑎𝑖𝑧𝑎𝑡𝑖𝑜𝑛
𝐵𝑜𝑜𝑘 𝑉𝑎𝑙𝑢𝑒 𝑜𝑓 𝑇𝑜𝑡𝑎𝑙 𝐴𝑠𝑠𝑒𝑡
2.Return on Asset ROA 𝐸𝑎𝑟𝑛𝑖𝑛𝑔 𝑒𝑓𝑜𝑟𝑒 𝐼𝑛𝑡𝑒𝑟𝑒𝑠𝑡 𝑇𝑎𝑥
𝑇𝑜𝑡𝑎𝑙 𝐴𝑠𝑠𝑒𝑡
3. Return on Invested Capital ROIC 𝑁𝑒𝑡 𝐼𝑛𝑐𝑜𝑚𝑒
𝑇𝑜𝑡𝑎𝑙 𝐶𝑎𝑝𝑖𝑡𝑎𝑙
Independents Variable
http://afr.sciedupress.com Accounting and Finance Research Vol. 10, No. 1; 2021
Published by Sciedu Press 39 ISSN 1927-5986 E-ISSN 1927-5994
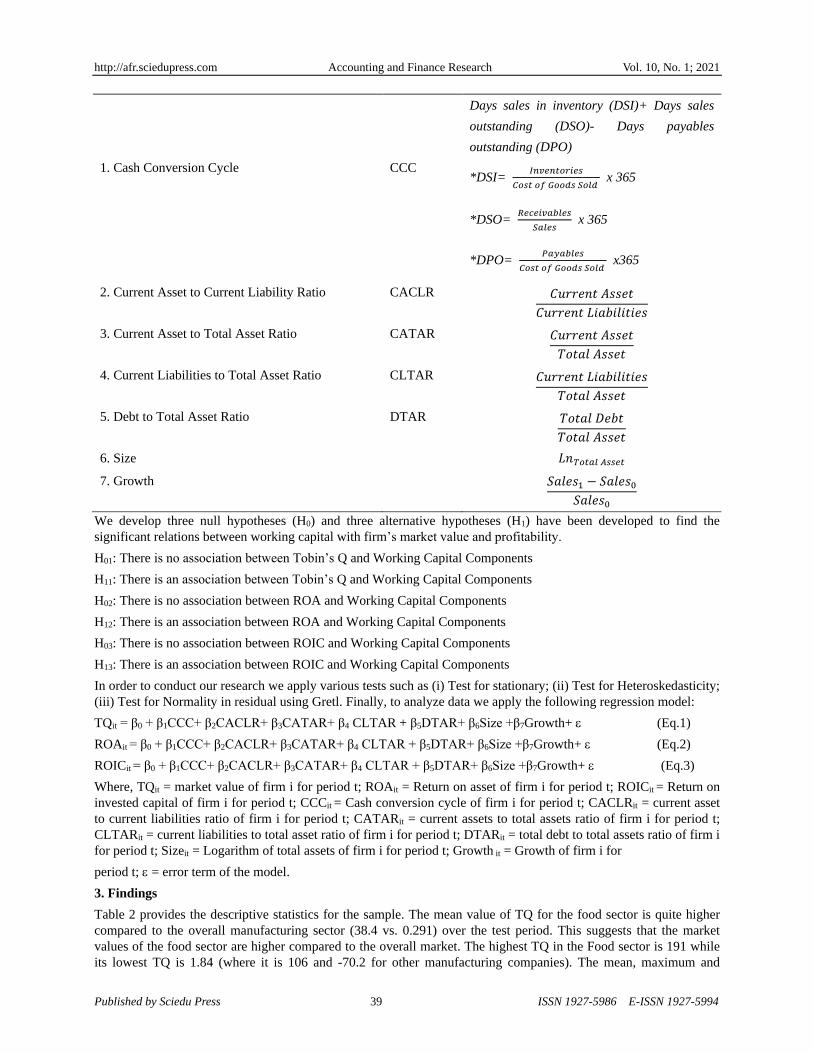
1. Cash Conversion Cycle
CCC
Days sales in inventory (DSI)+ Days sales
outstanding (DSO)- Days payables
outstanding (DPO)
*DSI= 𝐼𝑛𝑣𝑒𝑛𝑡𝑜𝑟𝑖𝑒𝑠
𝐶𝑜𝑠𝑡 𝑜𝑓 𝐺𝑜𝑜𝑑𝑠 𝑆𝑜𝑙𝑑 x 365
*DSO= 𝑅𝑒𝑐𝑒𝑖𝑣𝑎𝑏𝑙𝑒𝑠
𝑆𝑎𝑙𝑒𝑠 x 365
*DPO= 𝑃𝑎𝑦𝑎𝑏𝑙𝑒𝑠
𝐶𝑜𝑠𝑡 𝑜𝑓 𝐺𝑜𝑜𝑑𝑠 𝑆𝑜𝑙𝑑 x365
2. Current Asset to Current Liability Ratio
CACLR 𝐶𝑢𝑟𝑟𝑒𝑛𝑡 𝐴𝑠𝑠𝑒𝑡
𝐶𝑢𝑟𝑟𝑒𝑛𝑡 𝐿𝑖𝑎𝑏𝑖𝑙𝑖𝑡𝑖𝑒𝑠
3. Current Asset to Total Asset Ratio CATAR 𝐶𝑢𝑟𝑟𝑒𝑛𝑡 𝐴𝑠𝑠𝑒𝑡
𝑇𝑜𝑡𝑎𝑙 𝐴𝑠𝑠𝑒𝑡
4. Current Liabilities to Total Asset Ratio CLTAR 𝐶𝑢𝑟𝑟𝑒𝑛𝑡 𝐿𝑖𝑎𝑏𝑖𝑙𝑖𝑡𝑖𝑒𝑠
𝑇𝑜𝑡𝑎𝑙 𝐴𝑠𝑠𝑒𝑡
5. Debt to Total Asset Ratio DTAR 𝑇𝑜𝑡𝑎𝑙 𝐷𝑒𝑏𝑡
𝑇𝑜𝑡𝑎𝑙 𝐴𝑠𝑠𝑒𝑡
6. Size 𝐿𝑛𝑇𝑜𝑡𝑎𝑙 𝐴𝑠𝑠𝑒𝑡
7. Growth 𝑆𝑎𝑙𝑒𝑠1 − 𝑆𝑎𝑙𝑒𝑠0
𝑆𝑎𝑙𝑒𝑠0
We develop three null hypotheses (H0) and three alternative hypotheses (H1) have been developed to find the
significant relations between working capital with firm’s market value and profitability.
H01: There is no association between Tobin’s Q and Working Capital Components
H11: There is an association between Tobin’s Q and Working Capital Components
H02: There is no association between ROA and Working Capital Components
H12: There is an association between ROA and Working Capital Components
H03: There is no association between ROIC and Working Capital Components
H13: There is an association between ROIC and Working Capital Components
In order to conduct our research we apply various tests such as (i) Test for stationary; (ii) Test for Heteroskedasticity;
(iii) Test for Normality in residual using Gretl. Finally, to analyze data we apply the following regression model:
TQit = β0 + β1CCC+ β2CACLR+ β3CATAR+ β4 CLTAR + β5DTAR+ β6Size +β7Growth+ (Eq.1)
ROAit = β0 + β1CCC+ β2CACLR+ β3CATAR+ β4 CLTAR + β5DTAR+ β6Size +β7Growth+ (Eq.2)
ROICit = β0 + β1CCC+ β2CACLR+ β3CATAR+ β4 CLTAR + β5DTAR+ β6Size +β7Growth+ (Eq.3)
Where, TQit = market value of firm i for period t; ROAit = Return on asset of firm i for period t; ROICit = Return on
invested capital of firm i for period t; CCCit = Cash conversion cycle of firm i for period t; CACLRit = current asset
to current liabilities ratio of firm i for period t; CATARit = current assets to total assets ratio of firm i for period t;
CLTARit = current liabilities to total asset ratio of firm i for period t; DTARit = total debt to total assets ratio of firm i
for period t; Sizeit = Logarithm of total assets of firm i for period t; Growth it = Growth of firm i for
period t; = error term of the model.
3. Findings
Table 2 provides the descriptive statistics for the sample. The mean value of TQ for the food sector is quite higher
compared to the overall manufacturing sector (38.4 vs. 0.291) over the test period. This suggests that the market
values of the food sector are higher compared to the overall market. The highest TQ in the Food sector is 191 while
its lowest TQ is 1.84 (where it is 106 and -70.2 for other manufacturing companies). The mean, maximum and
http://afr.sciedupress.com Accounting and Finance Research Vol. 10, No. 1; 2021
Published by Sciedu Press 40 ISSN 1927-5986 E-ISSN 1927-5994
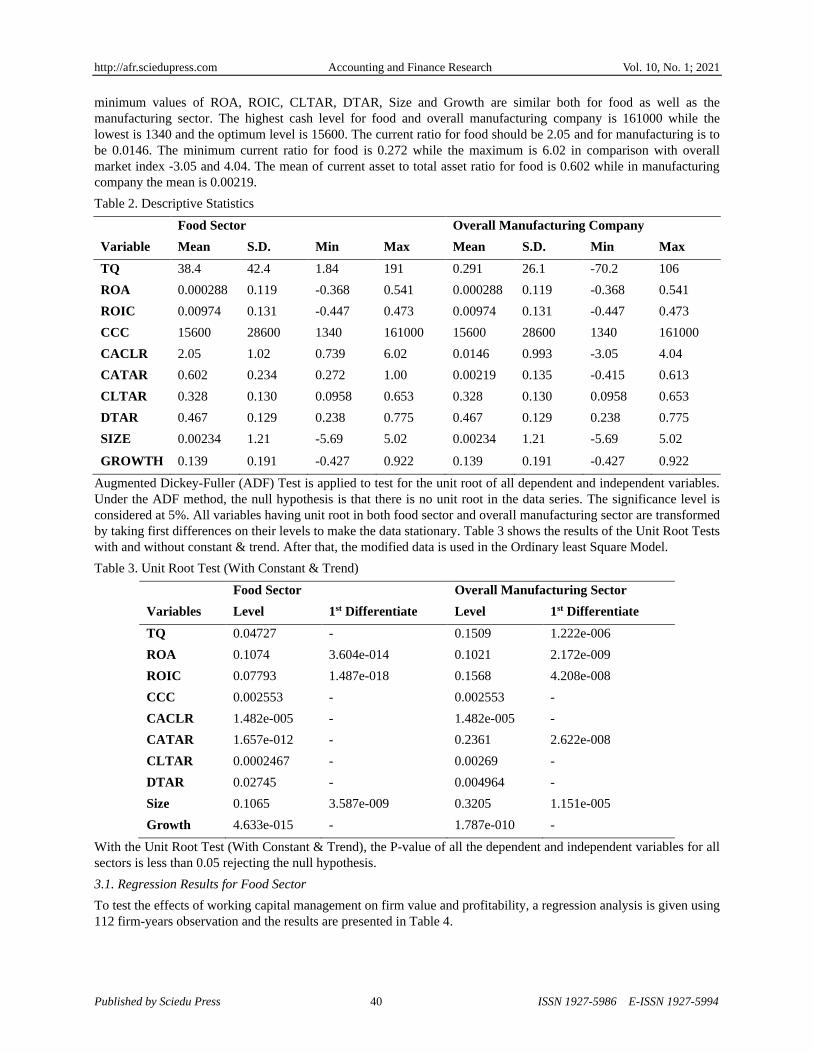
minimum values of ROA, ROIC, CLTAR, DTAR, Size and Growth are similar both for food as well as the
manufacturing sector. The highest cash level for food and overall manufacturing company is 161000 while the
lowest is 1340 and the optimum level is 15600. The current ratio for food should be 2.05 and for manufacturing is to
be 0.0146. The minimum current ratio for food is 0.272 while the maximum is 6.02 in comparison with overall
market index -3.05 and 4.04. The mean of current asset to total asset ratio for food is 0.602 while in manufacturing
company the mean is 0.00219.
Table 2. Descriptive Statistics
Variable
Food Sector Overall Manufacturing Company
Mean S.D. Min Max Mean S.D. Min Max
TQ 38.4 42.4 1.84 191 0.291 26.1 -70.2 106
ROA 0.000288 0.119 -0.368 0.541 0.000288 0.119 -0.368 0.541
ROIC 0.00974 0.131 -0.447 0.473 0.00974 0.131 -0.447 0.473
CCC 15600 28600 1340 161000 15600 28600 1340 161000
CACLR 2.05 1.02 0.739 6.02 0.0146 0.993 -3.05 4.04
CATAR 0.602 0.234 0.272 1.00 0.00219 0.135 -0.415 0.613
CLTAR 0.328 0.130 0.0958 0.653 0.328 0.130 0.0958 0.653
DTAR 0.467 0.129 0.238 0.775 0.467 0.129 0.238 0.775
SIZE 0.00234 1.21 -5.69 5.02 0.00234 1.21 -5.69 5.02
GROWTH 0.139 0.191 -0.427 0.922 0.139 0.191 -0.427 0.922
Augmented Dickey-Fuller (ADF) Test is applied to test for the unit root of all dependent and independent variables.
Under the ADF method, the null hypothesis is that there is no unit root in the data series. The significance level is
considered at 5%. All variables having unit root in both food sector and overall manufacturing sector are transformed
by taking first differences on their levels to make the data stationary. Table 3 shows the results of the Unit Root Tests
with and without constant & trend. After that, the modified data is used in the Ordinary least Square Model.
Table 3. Unit Root Test (With Constant & Trend)
Variables
Food Sector Overall Manufacturing Sector
Level 1st Differentiate Level 1st Differentiate
TQ 0.04727 - 0.1509 1.222e-006
ROA 0.1074 3.604e-014 0.1021 2.172e-009
ROIC 0.07793 1.487e-018 0.1568 4.208e-008
CCC 0.002553 - 0.002553 -
CACLR 1.482e-005 - 1.482e-005 -
CATAR 1.657e-012 - 0.2361 2.622e-008
CLTAR 0.0002467 - 0.00269 -
DTAR 0.02745 - 0.004964 -
Size 0.1065 3.587e-009 0.3205 1.151e-005
Growth 4.633e-015 - 1.787e-010 -
With the Unit Root Test (With Constant & Trend), the P-value of all the dependent and independent variables for all
sectors is less than 0.05 rejecting the null hypothesis.
3.1. Regression Results for Food Sector
To test the effects of working capital management on firm value and profitability, a regression analysis is given using
112 firm-years observation and the results are presented in Table 4.
http://afr.sciedupress.com Accounting and Finance Research Vol. 10, No. 1; 2021
Published by Sciedu Press 41 ISSN 1927-5986 E-ISSN 1927-5994
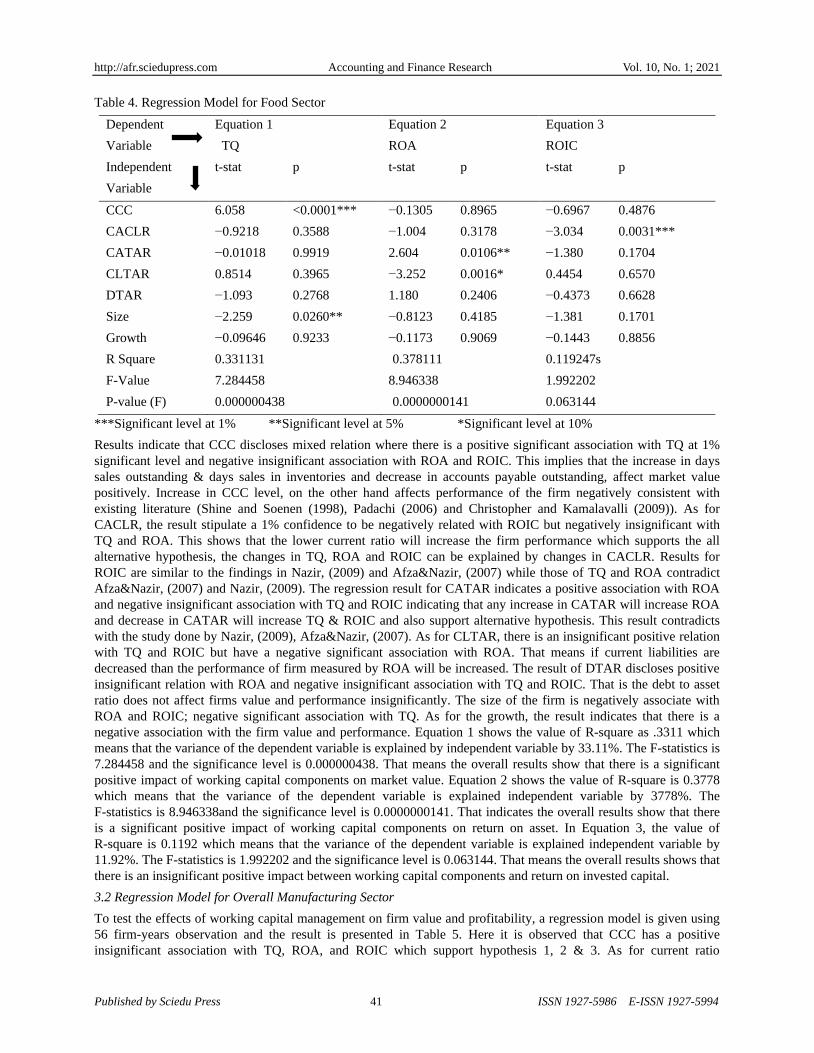
Table 4. Regression Model for Food Sector
Dependent
Variable
Equation 1
TQ
Equation 2
ROA
Equation 3
ROIC
Independent
Variable
t-stat p t-stat p t-stat p
CCC 6.058 <0.0001*** −0.1305 0.8965 −0.6967 0.4876
CACLR −0.9218 0.3588 −1.004 0.3178 −3.034 0.0031***
CATAR −0.01018 0.9919 2.604 0.0106** −1.380 0.1704
CLTAR 0.8514 0.3965 −3.252 0.0016* 0.4454 0.6570
DTAR −1.093 0.2768 1.180 0.2406 −0.4373 0.6628
Size −2.259 0.0260** −0.8123 0.4185 −1.381 0.1701
Growth −0.09646 0.9233 −0.1173 0.9069 −0.1443 0.8856
R Square 0.331131 0.378111 0.119247s
F-Value 7.284458 8.946338 1.992202
P-value (F) 0.000000438 0.0000000141 0.063144
***Significant level at 1% **Significant level at 5% *Significant level at 10%
Results indicate that CCC discloses mixed relation where there is a positive significant association with TQ at 1%
significant level and negative insignificant association with ROA and ROIC. This implies that the increase in days
sales outstanding & days sales in inventories and decrease in accounts payable outstanding, affect market value
positively. Increase in CCC level, on the other hand affects performance of the firm negatively consistent with
existing literature (Shine and Soenen (1998), Padachi (2006) and Christopher and Kamalavalli (2009)). As for
CACLR, the result stipulate a 1% confidence to be negatively related with ROIC but negatively insignificant with
TQ and ROA. This shows that the lower current ratio will increase the firm performance which supports the all
alternative hypothesis, the changes in TQ, ROA and ROIC can be explained by changes in CACLR. Results for
ROIC are similar to the findings in Nazir, (2009) and Afza&Nazir, (2007) while those of TQ and ROA contradict
Afza&Nazir, (2007) and Nazir, (2009). The regression result for CATAR indicates a positive association with ROA
and negative insignificant association with TQ and ROIC indicating that any increase in CATAR will increase ROA
and decrease in CATAR will increase TQ & ROIC and also support alternative hypothesis. This result contradicts
with the study done by Nazir, (2009), Afza&Nazir, (2007). As for CLTAR, there is an insignificant positive relation
with TQ and ROIC but have a negative significant association with ROA. That means if current liabilities are
decreased than the performance of firm measured by ROA will be increased. The result of DTAR discloses positive
insignificant relation with ROA and negative insignificant association with TQ and ROIC. That is the debt to asset
ratio does not affect firms value and performance insignificantly. The size of the firm is negatively associate with
ROA and ROIC; negative significant association with TQ. As for the growth, the result indicates that there is a
negative association with the firm value and performance. Equation 1 shows the value of R-square as .3311 which
means that the variance of the dependent variable is explained by independent variable by 33.11%. The F-statistics is
7.284458 and the significance level is 0.000000438. That means the overall results show that there is a significant
positive impact of working capital components on market value. Equation 2 shows the value of R-square is 0.3778
which means that the variance of the dependent variable is explained independent variable by 3778%. The
F-statistics is 8.946338and the significance level is 0.0000000141. That indicates the overall results show that there
is a significant positive impact of working capital components on return on asset. In Equation 3, the value of
R-square is 0.1192 which means that the variance of the dependent variable is explained independent variable by
11.92%. The F-statistics is 1.992202 and the significance level is 0.063144. That means the overall results shows that
there is an insignificant positive impact between working capital components and return on invested capital.
3.2 Regression Model for Overall Manufacturing Sector
To test the effects of working capital management on firm value and profitability, a regression model is given using
56 firm-years observation and the result is presented in Table 5. Here it is observed that CCC has a positive
insignificant association with TQ, ROA, and ROIC which support hypothesis 1, 2 & 3. As for current ratio
http://afr.sciedupress.com Accounting and Finance Research Vol. 10, No. 1; 2021
Published by Sciedu Press 42 ISSN 1927-5986 E-ISSN 1927-5994
(CACLR), there is a negative association with TQ and ROA and having positive insignificant relation with ROIC.
That means current ratio does not affect the market value and the return of the asset but has an effect on ROIC.
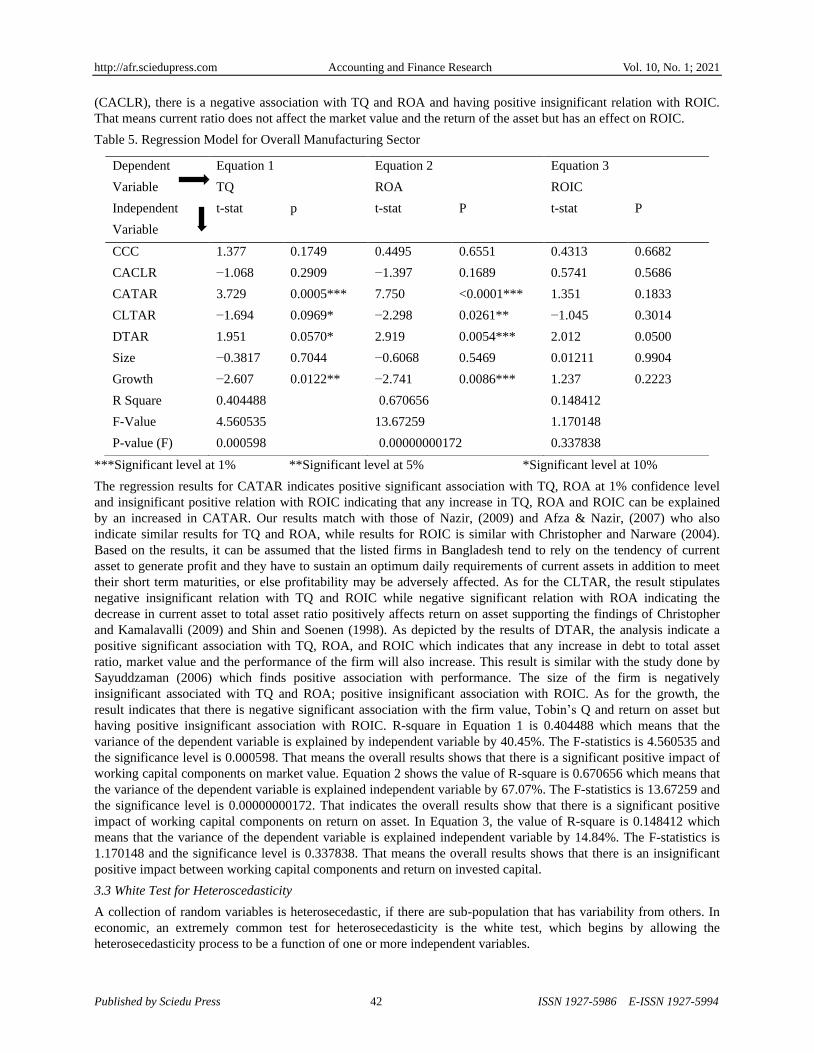
Table 5. Regression Model for Overall Manufacturing Sector
***Significant level at 1% **Significant level at 5% *Significant level at 10%
The regression results for CATAR indicates positive significant association with TQ, ROA at 1% confidence level
and insignificant positive relation with ROIC indicating that any increase in TQ, ROA and ROIC can be explained
by an increased in CATAR. Our results match with those of Nazir, (2009) and Afza & Nazir, (2007) who also
indicate similar results for TQ and ROA, while results for ROIC is similar with Christopher and Narware (2004).
Based on the results, it can be assumed that the listed firms in Bangladesh tend to rely on the tendency of current
asset to generate profit and they have to sustain an optimum daily requirements of current assets in addition to meet
their short term maturities, or else profitability may be adversely affected. As for the CLTAR, the result stipulates
negative insignificant relation with TQ and ROIC while negative significant relation with ROA indicating the
decrease in current asset to total asset ratio positively affects return on asset supporting the findings of Christopher
and Kamalavalli (2009) and Shin and Soenen (1998). As depicted by the results of DTAR, the analysis indicate a
positive significant association with TQ, ROA, and ROIC which indicates that any increase in debt to total asset
ratio, market value and the performance of the firm will also increase. This result is similar with the study done by
Sayuddzaman (2006) which finds positive association with performance. The size of the firm is negatively
insignificant associated with TQ and ROA; positive insignificant association with ROIC. As for the growth, the
result indicates that there is negative significant association with the firm value, Tobin’s Q and return on asset but
having positive insignificant association with ROIC. R-square in Equation 1 is 0.404488 which means that the
variance of the dependent variable is explained by independent variable by 40.45%. The F-statistics is 4.560535 and
the significance level is 0.000598. That means the overall results shows that there is a significant positive impact of
working capital components on market value. Equation 2 shows the value of R-square is 0.670656 which means that
the variance of the dependent variable is explained independent variable by 67.07%. The F-statistics is 13.67259 and
the significance level is 0.00000000172. That indicates the overall results show that there is a significant positive
impact of working capital components on return on asset. In Equation 3, the value of R-square is 0.148412 which
means that the variance of the dependent variable is explained independent variable by 14.84%. The F-statistics is
1.170148 and the significance level is 0.337838. That means the overall results shows that there is an insignificant
positive impact between working capital components and return on invested capital.
3.3 White Test for Heteroscedasticity
A collection of random variables is heterosecedastic, if there are sub-population that has variability from others. In
economic, an extremely common test for heterosecedasticity is the white test, which begins by allowing the
heterosecedasticity process to be a function of one or more independent variables.
Dependent
Variable
Equation 1
TQ
Equation 2
ROA
Equation 3
ROIC
Independent
Variable
t-stat p t-stat P t-stat P
CCC 1.377 0.1749 0.4495 0.6551 0.4313 0.6682
CACLR −1.068 0.2909 −1.397 0.1689 0.5741 0.5686
CATAR 3.729 0.0005*** 7.750 <0.0001*** 1.351 0.1833
CLTAR −1.694 0.0969* −2.298 0.0261** −1.045 0.3014
DTAR 1.951 0.0570* 2.919 0.0054*** 2.012 0.0500
Size −0.3817 0.7044 −0.6068 0.5469 0.01211 0.9904
Growth −2.607 0.0122** −2.741 0.0086*** 1.237 0.2223
R Square 0.404488 0.670656 0.148412
F-Value 4.560535 13.67259 1.170148
P-value (F) 0.000598 0.00000000172 0.337838
http://afr.sciedupress.com Accounting and Finance Research Vol. 10, No. 1; 2021
Published by Sciedu Press 43 ISSN 1927-5986 E-ISSN 1927-5994
Table 6. Test for Heteroscedasticity
Food Sector Overall Market Sector
R Square P value R Square P value
Equation 1 TQ 26.929387 0.800352 47.264329 0.080668
Equation 2 ROA 109.647260 0.000000 51.357286 0.036677
Equation 3 ROIC 52.225429 0.023644 49.000530 0.058370
By doing heterosecedasticity test, we find that the P-value is less than 0.05 in the overall market sector which ensure
that there is no heteroscedasticity problem in the overall market sector. In food sector, there is no heterosecedasticity
in equation 2 & 3 as p values are less than 0.05 and have the existence of heteroscedasticity in Equation 1 as P-value
is more than 0.05.
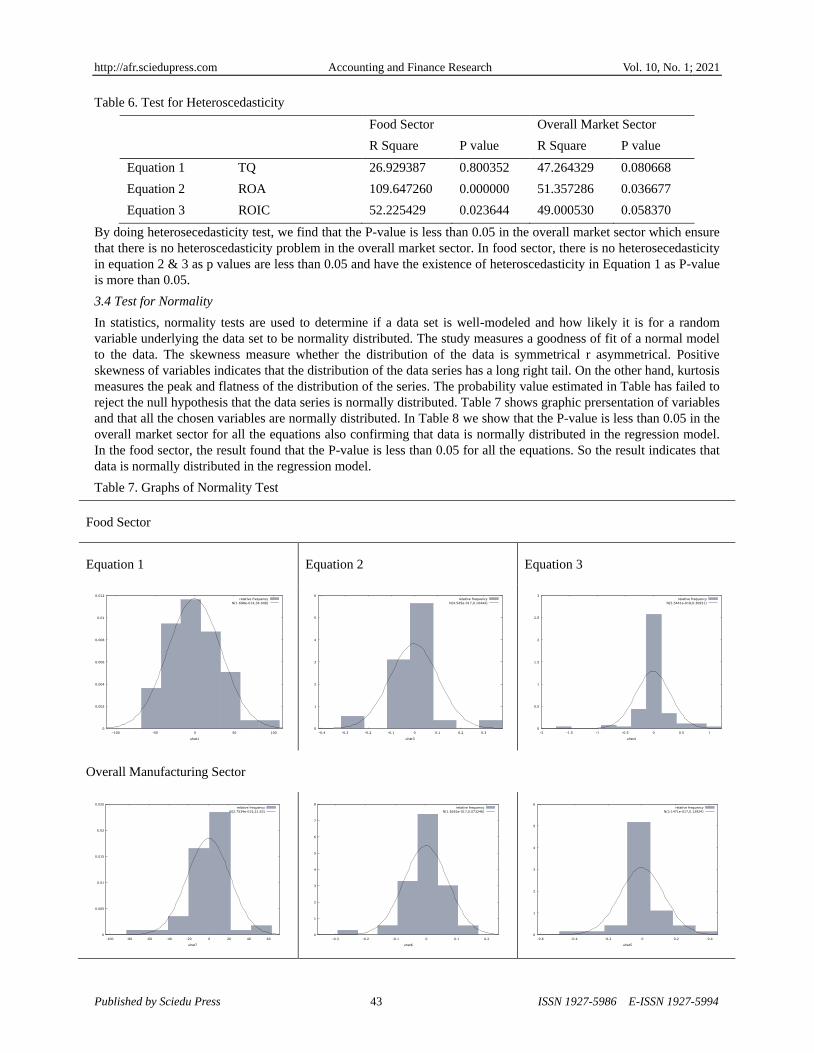
3.4 Test for Normality
In statistics, normality tests are used to determine if a data set is well-modeled and how likely it is for a random
variable underlying the data set to be normality distributed. The study measures a goodness of fit of a normal model
to the data. The skewness measure whether the distribution of the data is symmetrical r asymmetrical. Positive
skewness of variables indicates that the distribution of the data series has a long right tail. On the other hand, kurtosis
measures the peak and flatness of the distribution of the series. The probability value estimated in Table has failed to
reject the null hypothesis that the data series is normally distributed. Table 7 shows graphic prersentation of variables
and that all the chosen variables are normally distributed. In Table 8 we show that the P-value is less than 0.05 in the
overall market sector for all the equations also confirming that data is normally distributed in the regression model.
In the food sector, the result found that the P-value is less than 0.05 for all the equations. So the result indicates that
data is normally distributed in the regression model.
Table 7. Graphs of Normality Test
Food Sector
Equation 1 Equation 2 Equation 3
Overall Manufacturing Sector
0
0.002
0.004
0.006
0.008
0.01
0.012
-100 -50 0 50 100
Density
uhat1
relative frequency
N(1.698e-014,34.048)
0
1
2
3
4
5
6
-0.4 -0.3 -0.2 -0.1 0 0.1 0.2 0.3
Density
uhat3
relative frequency
N(4.545e-017,0.10444)
0
0.5
1
1.5
2
2.5
3
-2 -1.5 -1 -0.5 0 0.5 1
Density
uhat4
relative frequency
N(5.5441e-018,0.30931)
0
0.005
0.01
0.015
0.02
0.025
-100 -80 -60 -40 -20 0 20 40 60
Density
uhat7
relative frequency
N(2.7534e-015,21.63)
0
1
2
3
4
5
6
7
8
-0.3 -0.2 -0.1 0 0.1 0.2
Density
uhat6
relative frequency
N(1.8262e-017,0.073246)
0
1
2
3
4
5
6
-0.6 -0.4 -0.2 0 0.2 0.4
Density
uhat5
relative frequency
N(2.1471e-017,0.12924)
http://afr.sciedupress.com Accounting and Finance Research Vol. 10, No. 1; 2021
Published by Sciedu Press 44 ISSN 1927-5986 E-ISSN 1927-5994
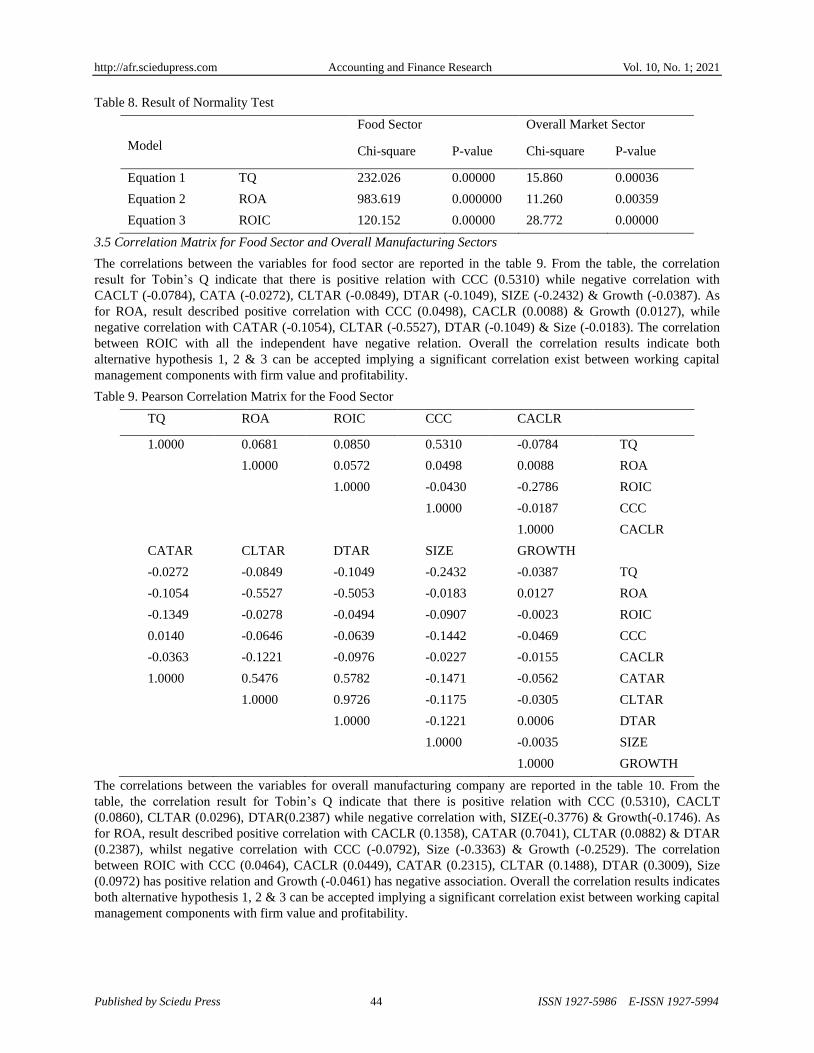
Table 8. Result of Normality Test
Model
Food Sector Overall Market Sector
Chi-square P-value Chi-square P-value
Equation 1 TQ 232.026 0.00000 15.860 0.00036
Equation 2 ROA 983.619 0.000000 11.260 0.00359
Equation 3 ROIC 120.152 0.00000 28.772 0.00000
3.5 Correlation Matrix for Food Sector and Overall Manufacturing Sectors
The correlations between the variables for food sector are reported in the table 9. From the table, the correlation
result for Tobin’s Q indicate that there is positive relation with CCC (0.5310) while negative correlation with
CACLT (-0.0784), CATA (-0.0272), CLTAR (-0.0849), DTAR (-0.1049), SIZE (-0.2432) & Growth (-0.0387). As
for ROA, result described positive correlation with CCC (0.0498), CACLR (0.0088) & Growth (0.0127), while
negative correlation with CATAR (-0.1054), CLTAR (-0.5527), DTAR (-0.1049) & Size (-0.0183). The correlation
between ROIC with all the independent have negative relation. Overall the correlation results indicate both
alternative hypothesis 1, 2 & 3 can be accepted implying a significant correlation exist between working capital
management components with firm value and profitability.
Table 9. Pearson Correlation Matrix for the Food Sector
TQ ROA ROIC CCC CACLR
1.0000 0.0681 0.0850 0.5310 -0.0784 TQ
1.0000 0.0572 0.0498 0.0088 ROA
1.0000 -0.0430 -0.2786 ROIC
1.0000 -0.0187 CCC
1.0000 CACLR
CATAR CLTAR DTAR SIZE GROWTH
-0.0272 -0.0849 -0.1049 -0.2432 -0.0387 TQ
-0.1054 -0.5527 -0.5053 -0.0183 0.0127 ROA
-0.1349 -0.0278 -0.0494 -0.0907 -0.0023 ROIC
0.0140 -0.0646 -0.0639 -0.1442 -0.0469 CCC
-0.0363 -0.1221 -0.0976 -0.0227 -0.0155 CACLR
1.0000 0.5476 0.5782 -0.1471 -0.0562 CATAR
1.0000 0.9726 -0.1175 -0.0305 CLTAR
1.0000 -0.1221 0.0006 DTAR
1.0000 -0.0035 SIZE
1.0000 GROWTH
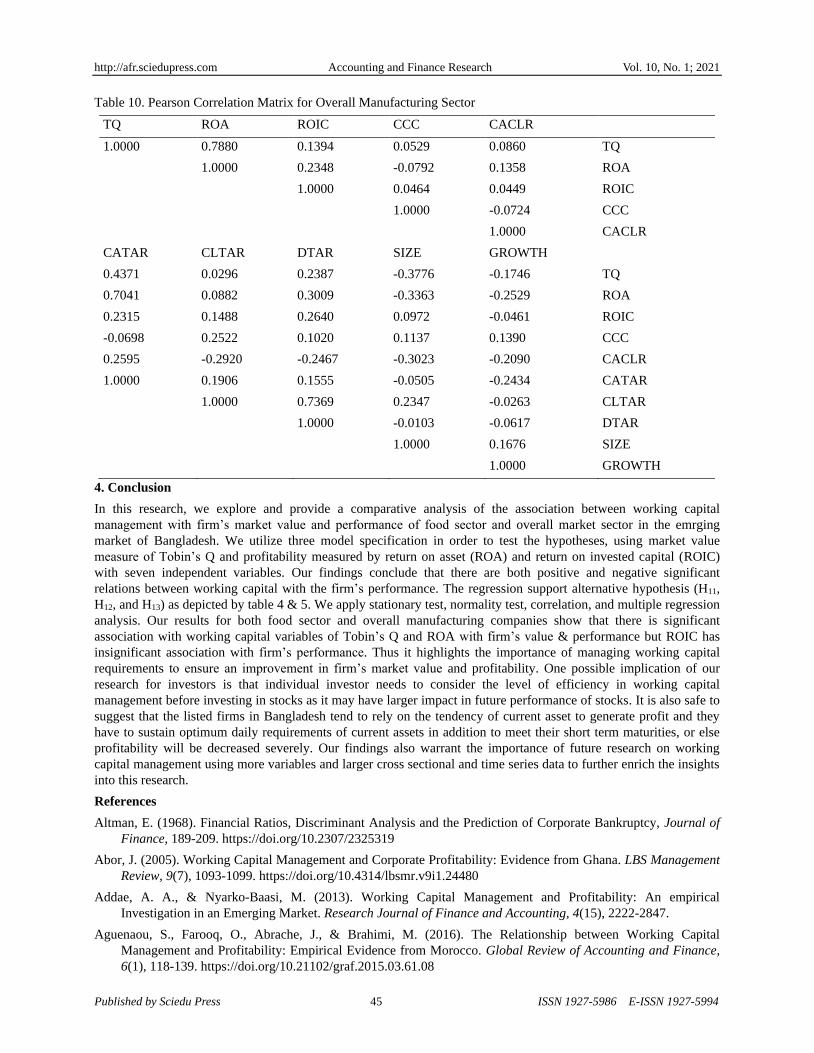
The correlations between the variables for overall manufacturing company are reported in the table 10. From the
table, the correlation result for Tobin’s Q indicate that there is positive relation with CCC (0.5310), CACLT
(0.0860), CLTAR (0.0296), DTAR(0.2387) while negative correlation with, SIZE(-0.3776) & Growth(-0.1746). As
for ROA, result described positive correlation with CACLR (0.1358), CATAR (0.7041), CLTAR (0.0882) & DTAR
(0.2387), whilst negative correlation with CCC (-0.0792), Size (-0.3363) & Growth (-0.2529). The correlation
between ROIC with CCC (0.0464), CACLR (0.0449), CATAR (0.2315), CLTAR (0.1488), DTAR (0.3009), Size
(0.0972) has positive relation and Growth (-0.0461) has negative association. Overall the correlation results indicates
both alternative hypothesis 1, 2 & 3 can be accepted implying a significant correlation exist between working capital
management components with firm value and profitability.
http://afr.sciedupress.com Accounting and Finance Research Vol. 10, No. 1; 2021
Published by Sciedu Press 45 ISSN 1927-5986 E-ISSN 1927-5994
Table 10. Pearson Correlation Matrix for Overall Manufacturing Sector
TQ ROA ROIC CCC CACLR
1.0000 0.7880 0.1394 0.0529 0.0860 TQ
1.0000 0.2348 -0.0792 0.1358 ROA
1.0000 0.0464 0.0449 ROIC
1.0000 -0.0724 CCC
1.0000 CACLR
CATAR CLTAR DTAR SIZE GROWTH
0.4371 0.0296 0.2387 -0.3776 -0.1746 TQ
0.7041 0.0882 0.3009 -0.3363 -0.2529 ROA
0.2315 0.1488 0.2640 0.0972 -0.0461 ROIC
-0.0698 0.2522 0.1020 0.1137 0.1390 CCC
0.2595 -0.2920 -0.2467 -0.3023 -0.2090 CACLR
1.0000 0.1906 0.1555 -0.0505 -0.2434 CATAR
1.0000 0.7369 0.2347 -0.0263 CLTAR
1.0000 -0.0103 -0.0617 DTAR
1.0000 0.1676 SIZE
1.0000 GROWTH
4. Conclusion
In this research, we explore and provide a comparative analysis of the association between working capital
management with firm’s market value and performance of food sector and overall market sector in the emrging
market of Bangladesh. We utilize three model specification in order to test the hypotheses, using market value
measure of Tobin’s Q and profitability measured by return on asset (ROA) and return on invested capital (ROIC)
with seven independent variables. Our findings conclude that there are both positive and negative significant
relations between working capital with the firm’s performance. The regression support alternative hypothesis (H11,
H12, and H13) as depicted by table 4 & 5. We apply stationary test, normality test, correlation, and multiple regression
analysis. Our results for both food sector and overall manufacturing companies show that there is significant
association with working capital variables of Tobin’s Q and ROA with firm’s value & performance but ROIC has
insignificant association with firm’s performance. Thus it highlights the importance of managing working capital
requirements to ensure an improvement in firm’s market value and profitability. One possible implication of our
research for investors is that individual investor needs to consider the level of efficiency in working capital
management before investing in stocks as it may have larger impact in future performance of stocks. It is also safe to
suggest that the listed firms in Bangladesh tend to rely on the tendency of current asset to generate profit and they
have to sustain optimum daily requirements of current assets in addition to meet their short term maturities, or else
profitability will be decreased severely. Our findings also warrant the importance of future research on working
capital management using more variables and larger cross sectional and time series data to further enrich the insights
into this research.
References
Altman, E. (1968). Financial Ratios, Discriminant Analysis and the Prediction of Corporate Bankruptcy, Journal of
Finance, 189-209. https://doi.org/10.2307/2325319
Abor, J. (2005). Working Capital Management and Corporate Profitability: Evidence from Ghana. LBS Management
Review, 9(7), 1093-1099. https://doi.org/10.4314/lbsmr.v9i1.24480
Addae, A. A., & Nyarko-Baasi, M. (2013). Working Capital Management and Profitability: An empirical
Investigation in an Emerging Market. Research Journal of Finance and Accounting, 4(15), 2222-2847.
Aguenaou, S., Farooq, O., Abrache, J., & Brahimi, M. (2016). The Relationship between Working Capital
Management and Profitability: Empirical Evidence from Morocco. Global Review of Accounting and Finance,
6(1), 118-139. https://doi.org/10.21102/graf.2015.03.61.08
http://afr.sciedupress.com Accounting and Finance Research Vol. 10, No. 1; 2021
Published by Sciedu Press 46 ISSN 1927-5986 E-ISSN 1927-5994
Al-Mwalla, Muna. (2012). The impact of Working Capital Management Policies on firm's Profitability and Value:
the case of Jordan. International Research Journal of Finance and Economics, 85, 147-153.
Anwar, S. M. R. (2017). Working Capital Management and Profitability: A Study on Cement Industry Working
Capital Management and Profitability: A Study on Cement Industry in Bangladesh. (January 2015).
Anagnostopoulou, S. (2013). Working Capital Management and Firm Listing Status. Multinational Finance Journal,
Forthcoming, 16(3), 261-301. https://doi.org/10.17578/16-3/4-4
Baghiyan, F. (2013). The Impact of Working Capital Management on Management Performance. Journal of
Behavioural Economics, Finance, Entrepreneurship, Accounting and Transport, 1(1), 13-14.
https://doi.org/10.12691/JBE-1-1-2
Chowdhury, A., & Amin, M. (2007). Working Capital Management Practiced in Pharmaceutical Companies Listed
in Dhaka Stock. BRAC University Journal, IV(2), 75-86.
Das, A. K., Hoque, M. M., & Abu Taher, M. (2014). Working Capital Management Practices in Selected Listed
Companies of Bangladesh. (December). Retrieved from https://www.researchgate.net/publication/286883256
DEN, M., & ORUC, E. (2014). Relationship between Efficiency Level of Working Capital Management and Return
on Total Assets in ISE (Istanbul Stock Exchange). International Journal of Business and Management, 4(10),
109-114. https://doi.org/10.5539/ijbm.v4n10p109
Deloof, M. (2003). Does working capital management affect profitability of Belgian firms? Journal of business
finance & Accounting, 30(3‐4), 573-588. https://doi.org/10.1111/1468-5957.00008
Dixon, R., Guariglia, A., & Vijayakumaran, R. (2015). Managerial ownership, corporate governance and firms'
exporting decisions: evidence from Chinese listed companies. The European Journal of Finance, 1-39.
https://doi.org/10.1080/1351847X.2015.1025990
Edi, N., & Binti, A. (2010). Working Capital Management: The Effect of Market Valuation and Profitability in
Malaysia. International Journal of Business and Management, 5(11), 140-147.
https://doi.org/10.5539/ijbm.v5n11p140
Filbeck, Greg., & Krueger, Thomas. M. (2005), “An Analysis of Working Capital Management Results across
Industries", American Journal of Business, 20(2), 11- 20. https://doi.org/10.1108/19355181200500007
Ganesan, V. (2007). 3 Measures of Working Capital Management Efficiency, 3(2), 1-10.
García-Teruel, P. J., & Martínez-Solano, P. (2007). Effects of working capital management on SME profitability.
International Journal of Managerial Finance, 3(2), 164-177. https://doi.org/10.1108/17439130710738718
Hill, M., Kelly, G., & Highfield, M. (2010), Net Operating Working Capital Behavior: A First Look, Financial
Management, 39, 783-805. https://doi.org/10.1111/j.1755-053X.2010.01092.x
Kieschnick, R., Laplante, M., & Moussawi, R. (2013). Working capital management and shareholders’ wealth.
Review of Finance, 17(5), 1827-1852. https://doi.org/10.1093/rof/rfs043
Kalcheva, I., & Lins, K. (2007), International Evidence on Cash Holdings and Expected Managerial Agency
Problems, Review of Financial Studies, 20, 1087-1112. https://doi.org/10.1093/rfs/hhm023
Lee, K. W., & Lee, C. F. (2009). Cash holdings, corporate governance structure and firm valuation. Review of
Pacific Basin Financial Markets and Policies, 12(3), 475-508. https://doi.org/10.1142/S021909150900171X
Majidmakki, M. A., Saleem, S., & Aziz, T. (2012). the Relationship of Cash Conversion Cycle and Firm’ S
Profitability: an Empirical Investigation of Pakistani, 1(1), 80-96.
Meckling, W. H., (1976). Theory of the firm: managerial behaviour, agency costs and ownership structure. Journal
of Financial Economics, 3, 305-360. https://doi.org/10.1016/0304-405X(76)90026-X
Petersen, M., & Rajan, R. (1997), Trade Credit: Theories and Evidence, Review of Financial Studies, 10, 661-691.
https://doi.org/10.1093/rfs/10.3.661
Pinkowitz, L., & Williamson, R. (2007). What is the market value of a dollar of corporate cash? Journal of Applied
Corporate Finance, 19(3), 74-81. https://doi.org/10.1111/j.1745-6622.2007.00148.x
Quayyum, S. T. (2012). Relationship between Working Capital Management and Profitability in Context of
Manufacturing Industries in Bangladesh. International Journal of Business and Management, 7(1), 58-69.
https://doi.org/10.5539/ijbm.v7n1p58
http://afr.sciedupress.com Accounting and Finance Research Vol. 10, No. 1; 2021
Published by Sciedu Press 47 ISSN 1927-5986 E-ISSN 1927-5994
Raheman, A., & Nasr, M. (2007). Microsoft Word - Raheman.doc - Paper 19.pdf, 3(1), 279-300. Retrieved from
http://www.bizresearchpapers.com/Paper 19.pdf
Rehman, M. U., & Anjum, N. (2013). Determination of the Impact of Working Capital Management on Profitability:
An Empirical Study from the Cement Sector in Pakistan. Asian Economic and Financial Review, 3(3), 3-19.
Richards, V., & Laughlin, E. (1980), A Cash Conversion Cycle Approach to Liquidity Analysis, Financial
Management, 9, 32-38. https://doi.org/10.2307/3665310
Ruback, R., & Sesia, A., (2000), Dell's Working Capital, Harvard Business School Case, 201-029.
Sartoris, W., & Hill, N. (1983), “Cash and Working Capital Management”, Journal of Finance, 38, 349-360.
https://doi.org/10.2307/2327967
Sayaduzzaman, M. (2007). Working Capital Management: A Study on British American Tobacco Bangladesh
Company Ltd. Journal of Nepalese Business Studies, 3(1), 78-84. https://doi.org/10.3126/jnbs.v3i1.484
Schiff, M., & Lieber, Z. (1974), A Model for the Integration of Credit and Inventory Management, Journal of
Finance, 29, 133-140. https://doi.org/10.1111/j.1540-6261.1974.tb00029.x
Shin, H., & Soenen, L. (1998), Efficiency of Working Capital Management and Corporate Profitability, Financial
Practice and Education, 8, 37-45.
Copyrights
Copyright for this article is retained by the author(s), with first publication rights granted to the journal.
This is an open-access article distributed under the terms and conditions of the Creative Commons Attribution
license (http://creativecommons.org/licenses/by/4.0/).