work, income and material hardship after welfare...
TRANSCRIPT

1
WORK, INCOME AND MATERIAL HARDSHIP AFTER WELFARE
REFORM
Sandra Danziger, Mary Corcoran, Sheldon Danziger & Colleen M. Heflin
October, 1999
Revised January 2000
University of Michigan 540 E. Liberty St., Suite 202
Ann Arbor MI 48104-2210 Phone: (734) 998 8515
Fax: (734) 998 8516
To Appear: Journal of Consumer Affairs, Vol. 34/1, Summer 2000
This paper is based on the Colston Warne Lecture, “Welfare Reform and Economic Hardship,”given by Sheldon Danziger at the 1999 Annual Meeting of the American Council of ConsumerInterests. Sandra Danziger presented an earlier version of this paper at the NorthwesternUniversity/University of Chicago Joint Center for Poverty Research Conference, “For Better andFor Worse: State Welfare Reform and the Well-being of Low Income Families and Children,”.This research was supported by grants from the Charles Stewart Mott Foundation, the JoyceFoundation, the John D. & Catherine T. MacArthur Foundation, the National Institute ofMental Health, and the University of Michigan, Office of the Vice-President for Research.Interviews were collected by staff from the Survey Research Center, University of MichiganInstitute for Social Research, Bruce Medbery survey manager. We thank Nath Anderson,Rebecca Blank, Peter Gottschalk, Kristin Seefeldt, Kristine Siefert and Richard Tolman forhelpful comments, Barbara Ramsey for clerical assistance, and the Michigan FamilyIndependence Agency for their cooperation and consultation throughout this project. Theopinions expressed are those of the authors exclusively.
Sandra Danziger is Associate Professor of Social Work and Director, Program on Poverty andSocial Welfare Policy; Mary Corcoran is Professor of Public Policy, Political Science and
2
Women’s Studies; Sheldon Danziger is Henry J. Meyer Collegiate Professor of Social Work andPublic Policy and Director of the Center on Poverty, Risk and Mental Health; Colleen Heflin isSenior Research Associate at the Poverty Research and Training Center. Please directcorrespondence to Sandra Danziger, [email protected].
Work, Income and Material Hardship after Welfare Reform
Sandra Danziger, Mary Corcoran, Sheldon Danziger, and Colleen M. Heflin
The Personal Responsibility and Work Opportunity Reconciliation Act (PRWORA) of
1996 ended the federal entitlement of cash assistance for needy families with children and created
the Temporary Assistance to Needy Families Program (TANF). TANF replaces the former Aid
to Families with Dependent Children program and provides transitional assistance conditional on
work or the performance of work-related activities; it requires most recipients to go to work
within two years of entering the program. The number of individuals receiving assistance has
declined sharply since the passage of PRWORA. The employment and earnings of welfare
recipients have increased, however, PRWORA’s impact on the economic and non-economic well-
being of recipients and their families is not yet well-established (Danziger, S. 1999). Although
preliminary evidence does not find increased rates of homelessness or foster-care placement
among recipients and their children, there is some early evidence that many families who have left
welfare remain poor, and that some of the poorest single-mother families may be experiencing
reductions in income (Cancian et al., 1999; Loprest, 1999, Primus, 1999).
3
A key goal of welfare reform is for recipients to establish stable, long-term work patterns
under the assumption that regular involvement in work will eventually improve their well-being.
Past research provides little information about the determinants of employment over time for
women who were welfare recipients, either pre- or post-PRWORA, and little information about
how work affects their economic well-being and experiences of material hardship. After a review
of the relevant literature, we address the following questions in this paper:
(1) To what extent does a sample of women who received cash assistance in early 1997
establish work attachment over time? How is the proportion of time worked over the
1997-1998 period associated with income and poverty at the end of this period?
(2) How is the amount of time spent working associated with experiences of material
hardship and subjective well-being?
Studies of recipients’ employment and income outcomes
Analysts using national longitudinal data sets to track the transition from welfare to work
pre-PRWORA report that a sizable minority of recipients are unable to keep jobs and tend to
cycle between work and welfare (Bane & Ellwood, 1994; Harris 1996). Evaluations of welfare-
to-work demonstrations typically report that while most participants get jobs, a large
proportion, often a majority, lose those jobs within a year (Hershey & Pavetti, 1997; Berg et al.,
1991; Friedlander & Burtless, 1995; Gueron & Pauly, 1991). Also, wages are low among welfare
recipients, and recent research suggests that their wages grow over time, but only for the minority
of former recipients who established regular, stable full time work patterns (Corcoran et al.,
4
forthcoming; Pavetti & Acs, 1996). Certain characteristics enhance recipients' ability to remain
employed once they leave welfare -- high school graduates, those with prior work experience and
women with fewer than three children are less likely to return to welfare (Bane & Ellwood, 1994;
Harris, 1996). Even among recipients with the same schooling, the same work experience and the
same number of children, however, there is considerable variation in the probability of remaining
at work and staying off welfare. When recipients are compared to non-recipients with the same
schooling and family characteristics, recipients leave jobs at higher rates and have lower wages
than do non-recipients (Hershey & Pavetti, 1997). These findings suggest that unmeasured
personal attributes, in addition to low schooling, lack of work experience and large families,
constrain recipients' employment and wage growth.
One unmeasured factor that discourages work may be work-related expenses. Edin &
Lein’s (1997) pre-reform qualitative study of current and former AFDC recipients emphasizes
that the costs associated with going to work outweigh the benefits for many recipients. Most of
their respondents could get jobs (83 percent had some formal work experience), but many had a
hard time making ends meet because of increased costs for child care, transportation, medical care,
housing, and work clothing. Earnings were not sufficient to cover these costs and leave them
materially better off than when they were on welfare. Their respondents who worked steadily
tended to benefit from special circumstances, including co-residence with relatives or boyfriends,
free child care provided by relatives or friends, receipt of regular, substantial child support, and
access to transportation.
5
Welfare mothers in the post-reform era now face a radically-different set of work
incentives and constraints than did AFDC mothers. One way to predict recipients’ future work
effort under TANF is to examine the work effort of women with similar characteristics (race and
ethnicity, education, basic skills, family characteristics) who did not receive welfare. Using the
NLSY, Pavetti (1999) tracked employment paths of comparable women as they aged from 18 to
27 years and found that “women on welfare would work 30 percent more if their employment
paths matched those of similar women who did not receive welfare.” Although this increase is
substantial, many recipients would still experience considerable joblessness; Pavetti predicts that
only 61 percent would be steadily employed by age 27. This estimate might be too high, as
welfare mothers tend to have unmeasured barriers to work. The estimate, however, might be too
low, because in the 1990’s economic changes increased the availability of work, and policy
changes (e.g. the expansion of the Earned Income Tax Credit and the expansion of publicly-
provided health care for poor children) increased the attractiveness of work (Ellwood, 1999).
Welfare, Work, and Economic Well-being Post-PRWORA
Studies of welfare mothers’ work behaviors after August 1996 provide initial evidence on
the employment consequences of welfare reform. Researchers have analyzed data from
administrative caseload records, the Current Population Surveys (CPS), and surveys of women
who left welfare. On two criteria, PRWORA has been declared a success to date by President
Clinton and many governors and politicians -- caseloads have declined sharply, and the
employment rate of single mothers has increased. Prior to 1996, more than half of the states had
6
instituted work requirements for some welfare recipients, and 31 states had received waivers to
experiment with time limits. Between FY 1994 and FY 1996, the AFDC caseload dropped by 14
percent. Post-PRWORA, between August 1996 and March 1999, caseloads declined by another
40 percent (U.S. Department of Health and Human Services, 1999).
Based upon analysis of CPS data, Rolston (1999) concluded that welfare reform
substantially increased work -- whereas 20 percent of women who received welfare in 1992 were
employed in 1993, 34 percent of recipients in 1996 were working a year later. O’Neill (1999),
using CPS data, found that employment rates of unmarried single mothers increased from 58.5
percent in March 1994 to 69.2 percent in March 1998.
Are these caseload reductions and employment increases due to welfare reform or the
economic boom? Several econometric analyses of caseload data suggest that declines in
unemployment rates accounted for about one-third to one-half of the caseload reductions
between 1994 and 1996 (Blank, 1997; Council of Economic Advisors, 1997; Figlio & Ziliak,
1999; Levine & Whitmore, in press; Wallace & Blank, 1999; Ziliak et al., 1997). Wallace & Blank
(1999) examine monthly caseload reductions over a longer period, 1994 to 1998, and find that
declines in unemployment rates accounted for 8 to 12 percent of caseload reductions.
Evidence on changes in income and well-being following welfare reform is also mixed. On
the positive side, CPS data indicate that the percent of people in female-headed families whose
pre-welfare incomes were below the poverty line fell by 5.4 percent (0.8 million people) between
1995 and 1997 (Primus, 1999). On the negative side, caseload declines over this period far
7
exceeded declines in poverty: the percent of people receiving TANF/AFDC benefits dropped by
22.6 percent (3.0 million people). And, the average disposable income of the poorest 20 percent
of single mothers fell by 7.6 percent; the average disposable income of the poorest 10 percent fell
by 15.2 percent (Primus et al., 1999).
Many states have begun to study families who have left welfare or who have been
sanctioned. These studies provide preliminary evidence about employment and well-being that
are consistent across studies and with the CPS data (Brauner & Loprest, 1999). Combining
sanctioned and non-sanctioned welfare leavers, point-in-time employment rates range from 51 to
69 percent. “Durational estimates” of employment rates (i.e., the percent of leavers who worked
at any time during a given period following a welfare exit) range from 68 to 88 percent in the year
after an exit. According to Tweedie et al. (1999), the work rate is 5 to10 percent higher than for
recipients who left welfare for jobs under AFDC.
The most recent TANF studies, like earlier AFDC studies, indicate that most recipients
can find a job, especially when the unemployment rate is low. Why someone leaves welfare,
however, is strongly associated with subsequent employment status. Recipients who have been
sanctioned (those whose benefits were cut off for failure to comply with program requirements)
were not as likely to be employed as were other leavers -- their employment rates ranged from 20
to 50 percent. Studies in several states indicate that over half of employed leavers worked 30 or
more hours per week, but most were not earning enough to lift their families out of poverty
(Brauner & Loprest, 1999).
8
Leavers’ economic well-being varied substantially across the states, reflecting in part,
state benefit levels and earnings disregards. Rolston, in congressional testimony on the results of
the welfare reform waiver demonstrations, reports that mandatory programs increased work and
earnings, but that former recipients’ average annual income was only greater after participation in
states which had generous welfare benefits and disregards (Rolston, 1999).
A few studies have examined economic strain, but many of them suffer from low
response rates and may have missed families in the worst shape. In telephone surveys in
Wisconsin and South Carolina, over 50 percent of leavers claim to be “just getting by” (Brauner
& Loprest, 1999). In three states, over a third of leavers reported problems providing enough
food for their families, and three out of five studies reported that a third or more of respondents
had problems paying rent or utility bills (Brauner & Loprest, 1999). In one study, former
recipients were significantly more likely to report falling behind in house or rent payments and
not having enough money to buy food, or pay for child care than when they received cash
assistance. Some families who are leaving or being diverted from welfare may also not be
receiving Food Stamps and Medicaid even though they continue to be eligible (Primus et al.,
1999).
Brauner and Loprest (1999) note the lack of a “total income” picture for welfare leavers
who are working and for those out of the labor market, as well as the inability of many studies to
assess the broader, noneconomic aspects of well-being among both types of leavers. Our
research in progress, the Women’s Employment Survey (WES) is filling some gaps in this
9
literature. Analyses of the initial wave of this panel study of single mothers who were welfare
recipients in an urban county in Michigan in February 1997 (Danziger et al., in press) found that
in the year following welfare reform, approximately 75 percent were still receiving cash
assistance and about three-fifths were employed at least 20 hours per week. One-fifth of those
who had left welfare and were working reported having no health insurance (7.4 percent of all
respondents).
A key finding was that employment status at the time of the initial interview was
strongly associated with a broad range of personal characteristics, including human capital and
skills (education, number and type of prior job skills, work experience), respondents’ physical
and mental health (mother’s self-rated health status, health-related limitations in physical
activities, and meeting the diagnostic criteria for major depression), transportation problems, and
self-reported discrimination in the workplace. Some factors that were not significantly associated
with employment at the first interview include race, prior years of welfare experience, children’s
health problems, knowledge of workplace norms, and exposure to domestic violence. The larger
the number of problems a recipient experienced, the lower the probability she was employed.
The research reviewed provides little information on the extent of employment of women
who had been post-TANF welfare recipients or on the consequences of employment over time
for their economic and non-economic well-being. As mentioned above, TANF recipients face a
radically different set of incentives for working and penalties for non work than AFDC recipients
10
did. All else equal, these economic and policy changes should contribute to increased work
involvement.
On the other hand, welfare recipients and poor women and their children, compared to the
general population, are more likely to be in poor health, to have mental health problems, and have
greater exposure to acute and chronic stressors that can adversely affect work and well-being
(Kalil et al, 1998; Olson & Pavetti, 1996). They are less likely than women in the general
population to have access to the material and emotional resources that could buffer the impact of
stressful life events and conditions, such as money for goods and services and the presence of a
supportive partner. While analysts have documented that such problems are more common
among welfare mothers than among women in general, Danziger et al. (in press) was the first
study to directly link these problems to welfare mothers' employment. This study and that of
Olson and Pavetti (1996) suggest that the presence of one personal problem may not be
insurmountable, but the presence of multiple problems causes disjunctures in labor market
experiences.
Moreover, the impact of mother’s work on family economic well-being for former
recipients is unclear. Does work improve financial well-being? How does it affect financial
strains? A rationale for welfare reform is that as recipients establish regular and stable work
patterns, their earnings will grow and they will become economically self-sufficient (Bonilla,
1995; also explained in Holcomb et al, 1998). Edin and Lein (1997), however, report that
working single mothers actually experienced more economic hardship than AFDC mothers,
11
largely because work-related expenses outweighed the increased income from going to work. This
paper makes use of the second wave of our panel data to analyze the relationships between work
involvement and family income, material hardships and financial strains.
Data, variables, and methods.
The Women’s Employment Survey (WES) allows us to analyze the associations between
the extent of employment and objective and subjective measures of well-being for continuing and
former welfare recipients. The first wave of interviews was completed between September and
December 1997 with a random sample of 753 single mothers who were welfare recipients in an
urban Michigan county in February, 1997. Michigan’s Family Independence Agency (FIA), the
state’s TANF agency, provided names and addresses of all single parent cases; a stratified
random sample was drawn; completed interviews represented an 86 percent response rate. The
second wave of interviews was completed between September and December of 1998 with a
response rate of 92 percent, 693 respondents.1
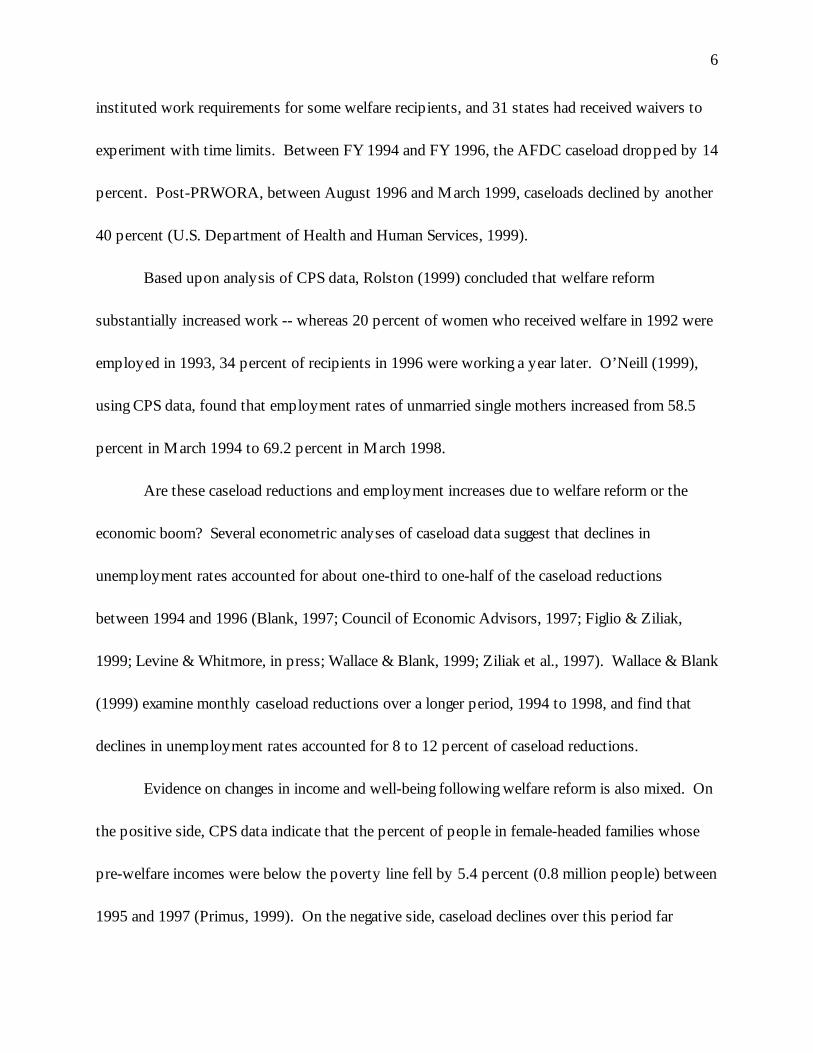
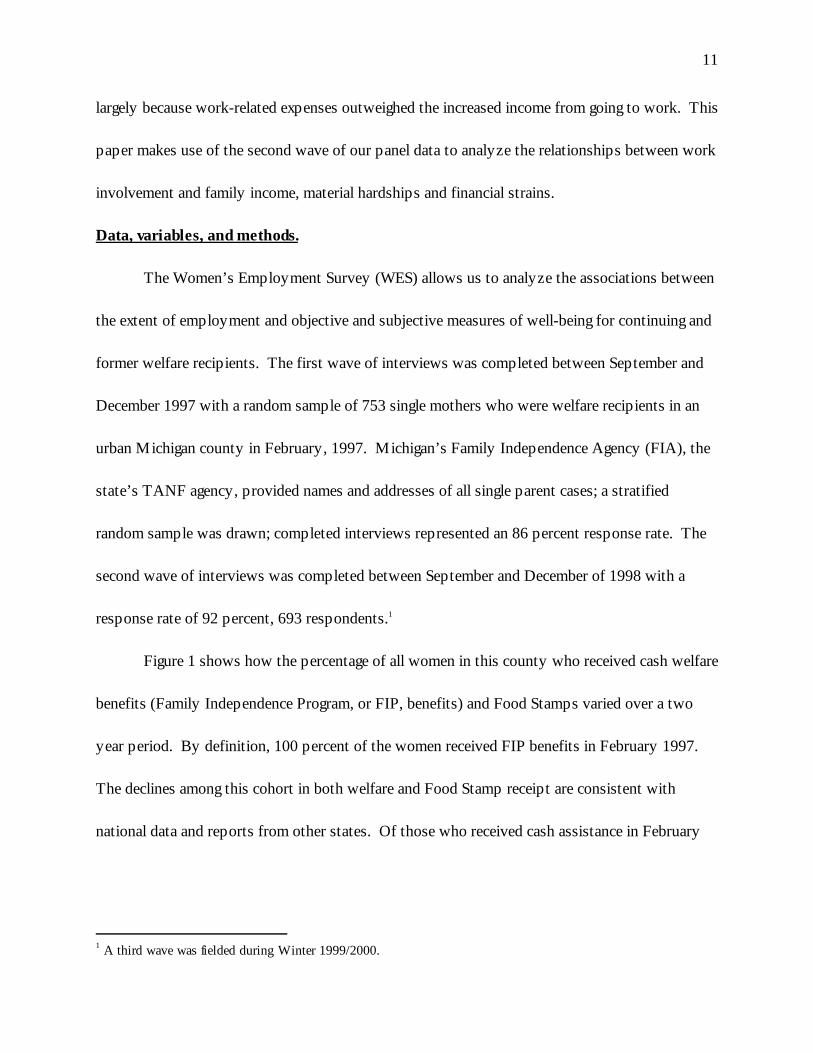
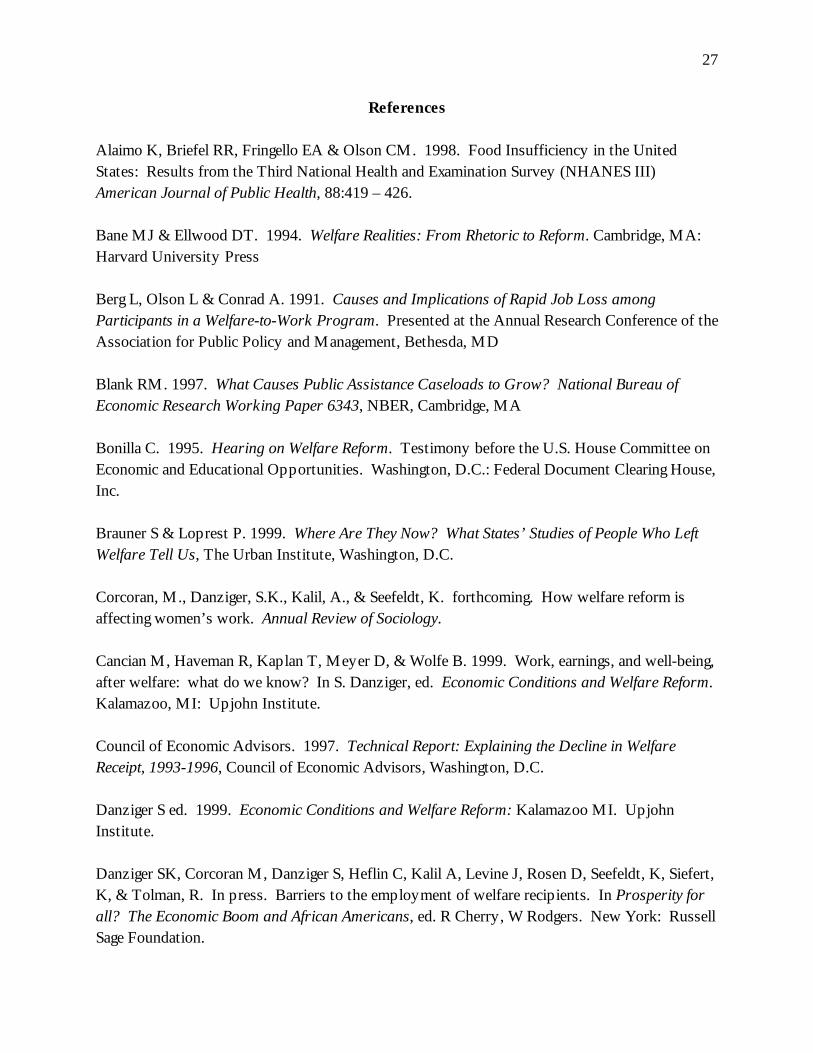
Figure 1 shows how the percentage of all women in this county who received cash welfare
benefits (Family Independence Program, or FIP, benefits) and Food Stamps varied over a two
year period. By definition, 100 percent of the women received FIP benefits in February 1997.
The declines among this cohort in both welfare and Food Stamp receipt are consistent with
national data and reports from other states. Of those who received cash assistance in February
1 A third wave was fielded during Winter 1999/2000.
12
1997, only a third were still on the caseload by March, 1999; 56 percent were still Food Stamps
recipients at that time.
This survey provides a rich source of policy-relevant data, including many measures not
available in other studies, that allow us to investigate the broader economic and non-economic
impacts of welfare reform. Whereas all survey respondents received cash assistance in February
1997, about one-quarter had left welfare by Fall 1997 and one-half by Fall 1998 (similar to
caseload trends for the universe of recipients in the county in Fig. 1). Thus, we have large
samples both of women who have left welfare and of those who remain.
Measure of employment involvement.
In Wave 1, respondents were asked to indicate whether or not they had worked 25 hours
or more in each calendar month between February 1997 and the interview month in Fall, 1997. In
Wave 2, work histories were collected for the months in which a woman reported any paid work
between Wave 1 and Wave 2. We combine data from these two waves and define employment
involvement as the proportion of months employed between February 1997 and the second
interview in Fall 1998. For each respondent, this employment history covers from 20 to 23
months, depending on the month in which the second interview took place (September through
December).2 Of the 692 respondents with valid work history data for the entire survey period,
2 The difference between wave one and wave two in the way we gathered the work history data were gatheredsuggests that work effort in wave one could be under-reported relative to that in wave 2. For example, a womanwho worked just a few hours in September 1998 should have reported herself as working in that month; but if shehad worked less than 25 hours in the month of September 1997, she would have reported herself as not working.
13
there is a wide distribution of this measure. For example, 9.7 percent of the sample did not work
in any of the months, whereas 21.7 percent worked in every month.
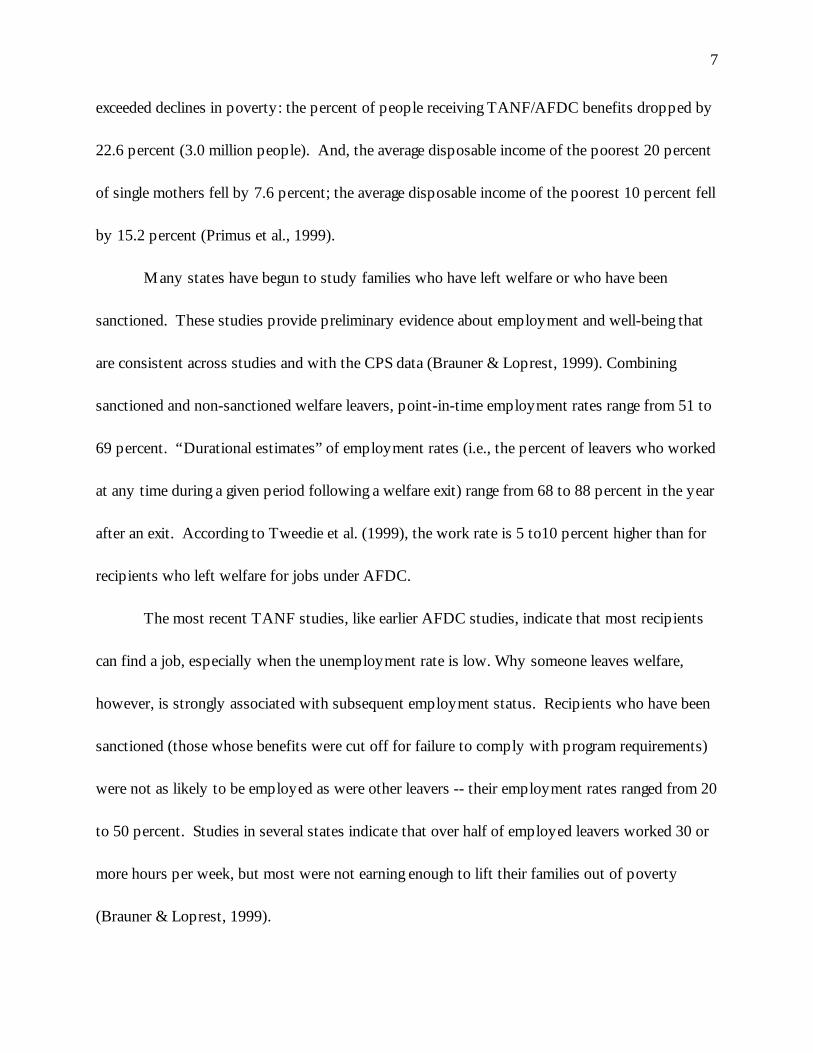
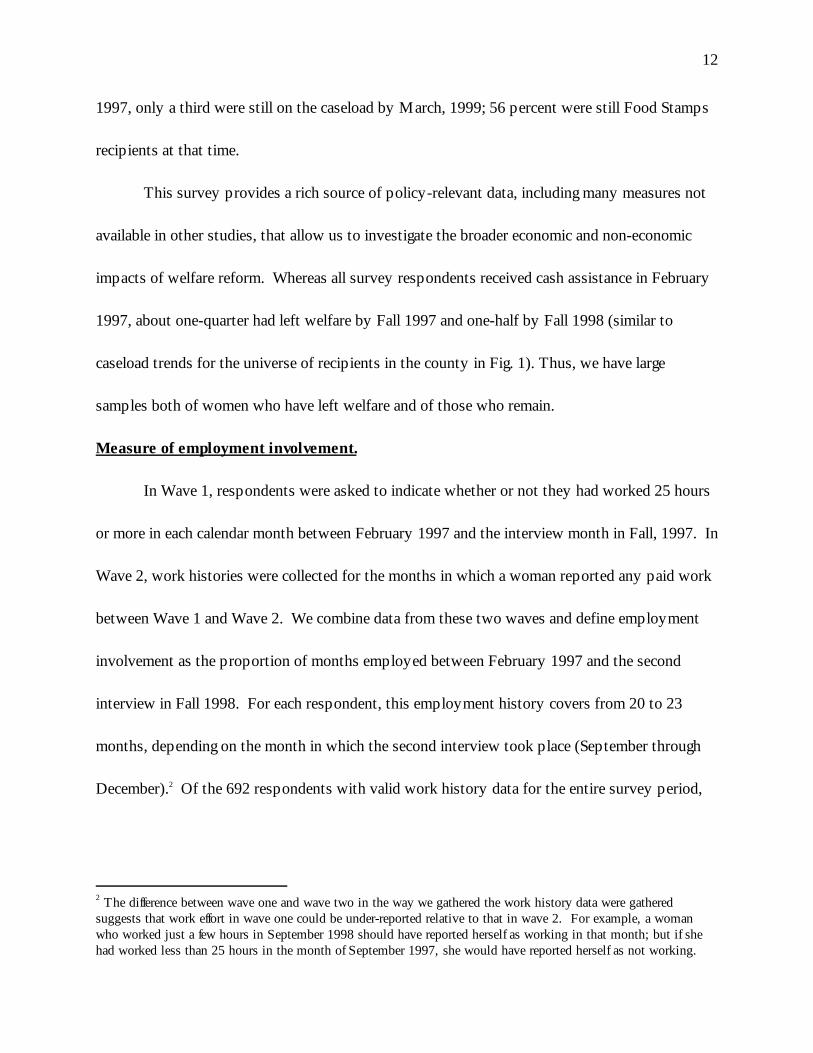
Figure 2 shows the trend in the proportion of the respondents who had worked in each of
the months between February 1997 and September 1998 (the beginning of the second survey
period). Whereas 40 percent said they had worked at some point in the first month, the
proportion grew to about 60 percent by September 1997, then fluctuated around 65 percent in
the Summer of 1998.
This measure of employment attachment or involvement reflects the extent to which
women are successful in staying employed. The policy goal of not just getting jobs, but keeping
jobs and becoming self- sufficient, can only be assessed with such over time measures of
employment. Although we can assess the extent to which the women are acquiring work
experience, the survey does not gather information on hours worked or earnings in every month.3
Regardless of how many times a woman changes jobs, the survey records whether she is actively
employed at some point within each month.4
These results conform to the national pattern – a sharp decline in welfare receipt and an
increase in employment. Rather then declare success, however, the remainder of the paper
focuses on how women who had been welfare recipients in early 1997 were faring in late 1998.
3 We have, at each wave, a measure of earnings last month, annual earnings, and usual hours of work per week.Earnings and hours in every month were not measured.4 Even women whom we classify as working in every month may have experienced periods of unemployment. Forexample, a woman who works the first week of August, loses her job, and then starts a new job during the last weekof September, will be classified as having worked in both months.
14
Methods
Our analysis proceeds as follows. First, how the relationshp between household income
and poverty at the second interview varies with work involvement over the analysis period is
evaluated. A variety of measures are examined -- sources of monthly income, work expenses,
total income minus work expenses, and income minus work expenses and excluding earnings from
other household members. This helps answer the question, “How is the proportion of time
worked between February 1997 and Fall 1998 associated with income levels and poverty rates in
Fall 1998?”
Second, three other aspects of economic well being are analyzed-- reports of recent
experiences of material hardships, the extent to which the women have resorted to hardship-
mediating activities to make ends meet, and subjective financial strains – with respect to how
they vary with work involvement. We ask, “How much better off are women who have worked
in a greater percentage of months than those who have worked less?”
Results
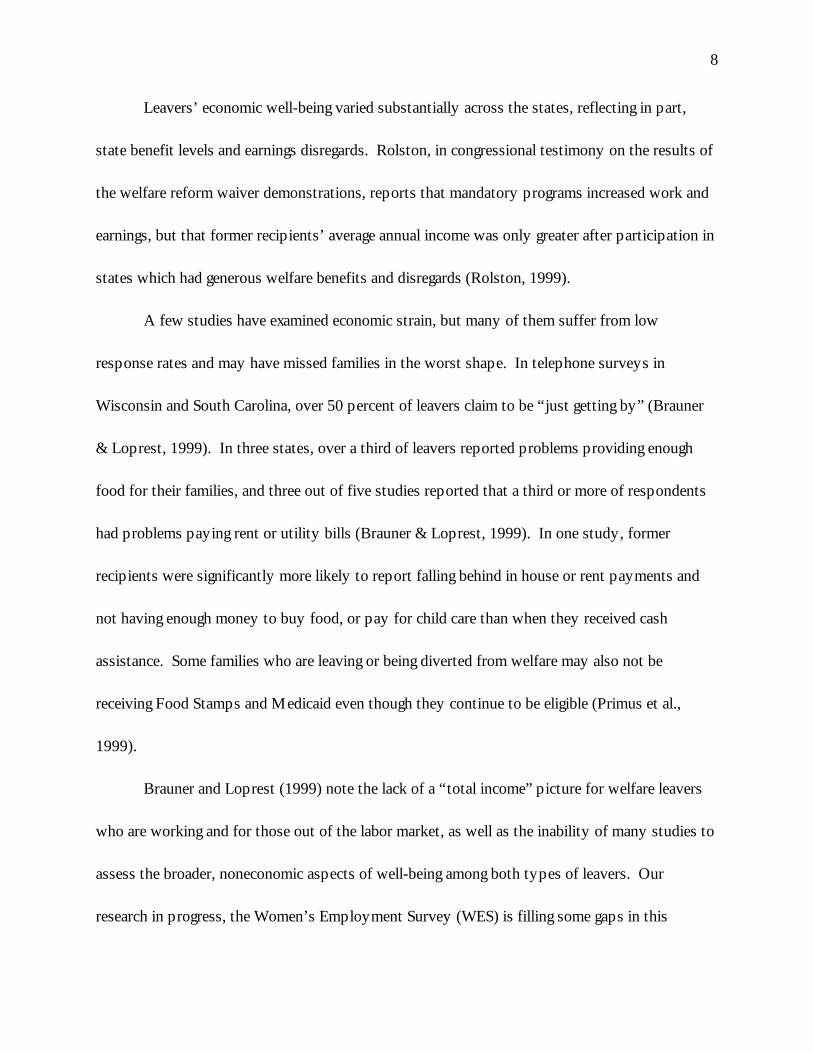
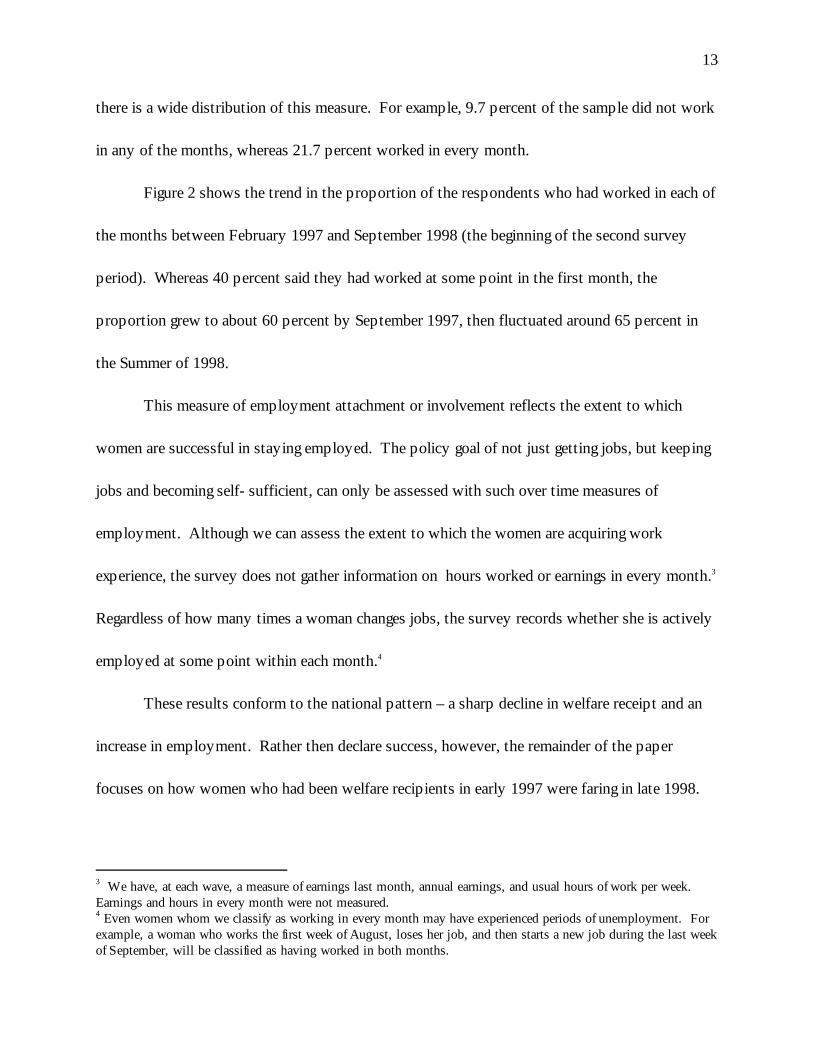
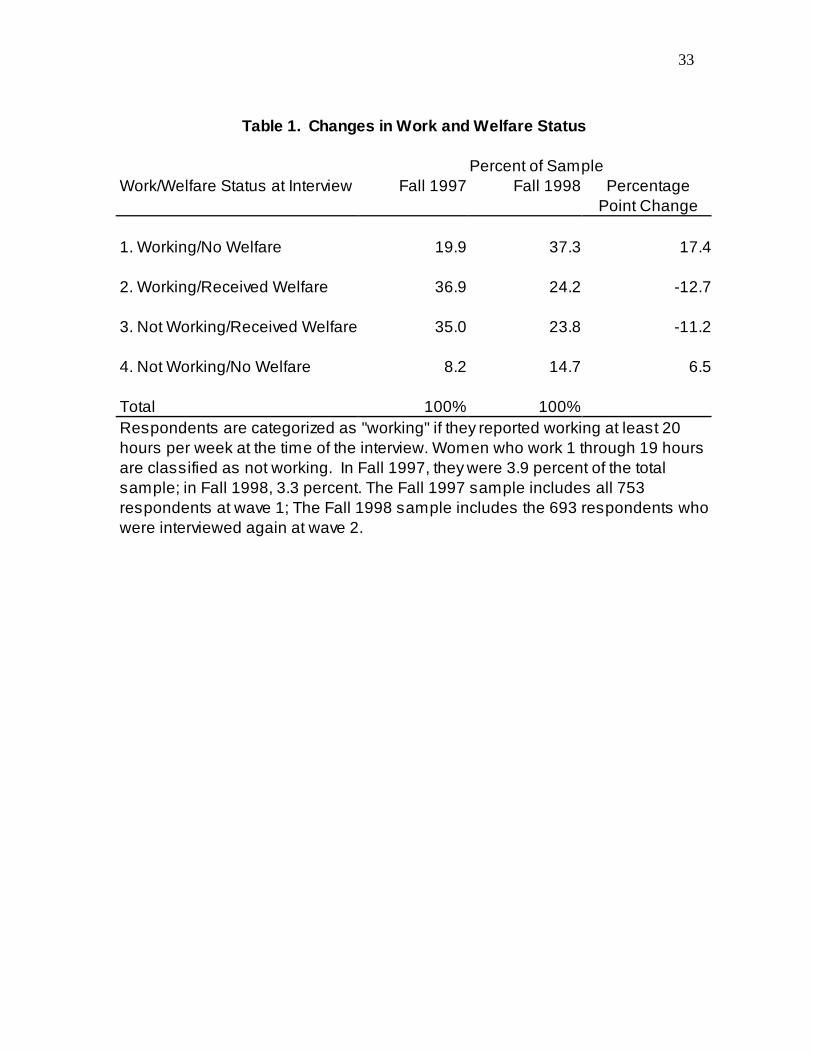
Table 1 classifies all respondents at waves one and two into one of four mutually-
exclusive, point-in-time categories of work by welfare receipt status. By definition, 100 percent
of the women in the sample received welfare in February 1997; Figure 2 showed about 40 percent
were working at that time. There are several key findings. At both interviews, about 60 percent
15
of respondents were working at least 20 hours per week.5 This is consistent with results from
recent studies in other states which find post-welfare reform employment rates of 50 to 70
percent. That the percentage of this cohort who reported working 20 or more hours per week
grew only slightly from 56.8 percent in Fall 1997 to 61.5 percent in Fall 1998 (the sum of
categories working/ no welfare and working/received welfare) is somewhat discouraging,
particularly because the unemployment rate in this county declined slightly over this period, to
about 5 percent in December 1998.
On the other hand, there was a large increase in the number of women who were working
and no longer receiving welfare (category 1), from 19.9 to 37.3 percent. These women tend to
work full time – median usual hours of work per week was 40 at both waves. Thus, while the
total percentage of women working at least half time remained constant, there was a shift away
from part-time work combined with welfare receipt (category 2 has median usual hours of 30
and 34 at waves one and two, respectively) to full-time work without reliance on cash assistance
(category 1). Among the entire sample, the percentage working 35 or more hours per week
increased from 30.5 to 40.5 percent between the two waves.
The proportion of respondents who were welfare recipients (the sum of the
working/welfare and not working/welfare categories) dropped by about 24 percentage points,
from 71.9 to 48 percent between the two waves of our survey. About half of this reduction was
due to the decline in the proportion who both worked and received welfare (category 2), about
5 Whereas Figure 2 plots the percentage of the sample reporting any work, Table 1 focuses on women who workedat least 20 hours per week because that is the amount of work required for a welfare recipient to be in compliance in
16
half, to a drop in the proportion who received welfare but were not working (category 3). The
proportion of recipients who had left the rolls and were not working almost doubled over this
period, from 8.2 to 14.7 percent of the sample.6 This group includes women who are having the
most difficulty adjusting to the new welfare rules.
Now consider how the respondents were faring in Fall 1998, at the second interview,
when they are classified by the percentage of the months they worked between February 1997
and the Fall 1998 interview. We classify all respondents into four categories of employment
involvement -- those who worked in none (0), some (1-64 percent), most (65-99 percent), and all
(100 percent) of the months covered by the study period.7
We document that as the extent of work involvement increases, women have more
disposable income, less poverty, a lower probability of experiencing a number of material
hardships and higher subjective well-being. However, the increases in well-being are not large on
some indicators of material hardship and vulnerability persists for many of the most work-
involved respondents. Some of those who are not succeeding in moving into work and are no
longer receiving welfare are living in very precarious circumstances.
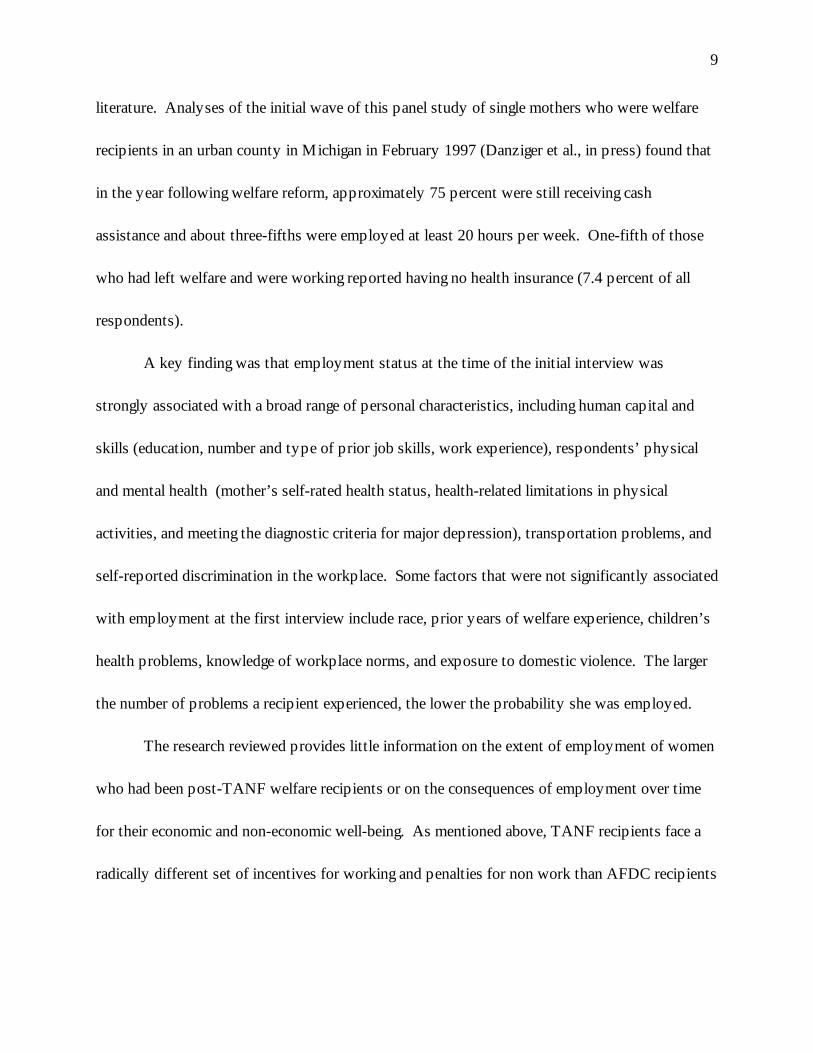
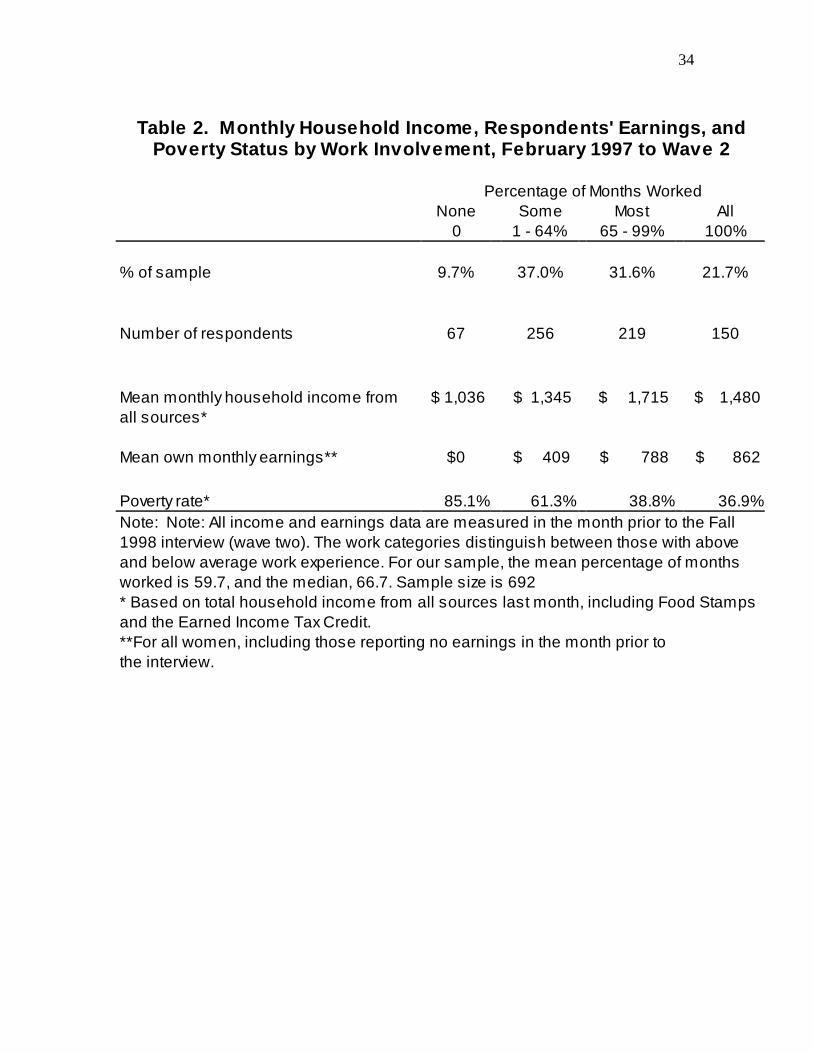
Table 2 documents the extent of work involvement and how total monthly income,
monthly earnings and the monthly poverty rate (for all respondents) vary by work involvement.
1997 with the State’s guidelines.6 Some of these women now receive SSI, some live with a partner who has earnings; but some have no regularincome source.7 Any such classification may seem arbitrary, especially the two middle categories. The categories “ none” and “ allmonths” have obvious meaning. We split the sample at 64 percent, because it was roughly the sample median forthe percentage of months worked. We also experimented with variations on these categories, but the results did notdiffer.
17
About one-tenth of the women did not work for pay in any of the months between February
1997 and Fall 1998;8 37.0 percent worked in less than two-thirds of the months; about one-third
worked most of the time (65 – 99 percent); 21.7 percent worked in every study month.
The extent of work is clearly associated with economic well-being -- mean monthly
household income from all sources and mean own monthly earnings were higher and poverty
rates were lower for women with high levels of work involvement compared to those who
worked some or not at all. For example, women who worked in every month since February
1997 had mean earnings of $862 in Fall 1998, whereas those who worked in some of the months
(1 – 64 percent) had mean earnings of only $409.9 Similarly, mean monthly household income
from all sources was $1715 and $1480 for women who worked most and all of the time,
compared to $1036 for women who never worked. Poverty rates fall as the extent of work
involvement increases, from 85.1 percent for women who never worked to 61.3 percent for those
8 When the wage history data was gathered, respondents were asked whether they had worked in paid jobs,including babysitting, housekeeping, or irregular jobs. They were later asked to list things that they might do“ when times are hard to make extra money, such as babysitting, housekeeping, styling hair or nails, selling thingsout of the house, or doing odd jobs. Because they reported both not holding paid jobs and receiving zero earningsin the month survey, they are treated as non workers.
Respondents were also asked how much cash welfare they received. After the data were gathered, we realized thatsome welfare recipients reported the amount of their welfare check, rather than the full grant amount, because aportion of their check was “ vendored” (i.e. the state directly pays rent and/or utilities to the landlord and utilitycompanies).
The extent of this problem is gauged by imputing welfare income to recipients who might have reported low welfareamounts because of vendoring We assumed that non-working respondents who reported receiving cash welfare andnot receiving Supplemental Security Income and are not married receive the full welfare grant. This overestimateswelfare income, in contrast to the tables, which understate it for vendored respondents.
This imputation increases mean total household income (Table 2) by 10% for each of the four groups. Poverty ratesdecrease slightly for the groups, by at most 3 percentage points for nonworkers.
18
who worked some of the time, to 38.8 percent for those who worked most of the time and 36.9
percent for those working in every month. We also computed extreme poverty rates (income less
than half of the poverty line) for these four groups. They also decline rapidly with work
involvement, from 37.3 to 24.2 to 10.5 to 6.7 percent as months worked increase from none, to
some, to most to all (data not shown).
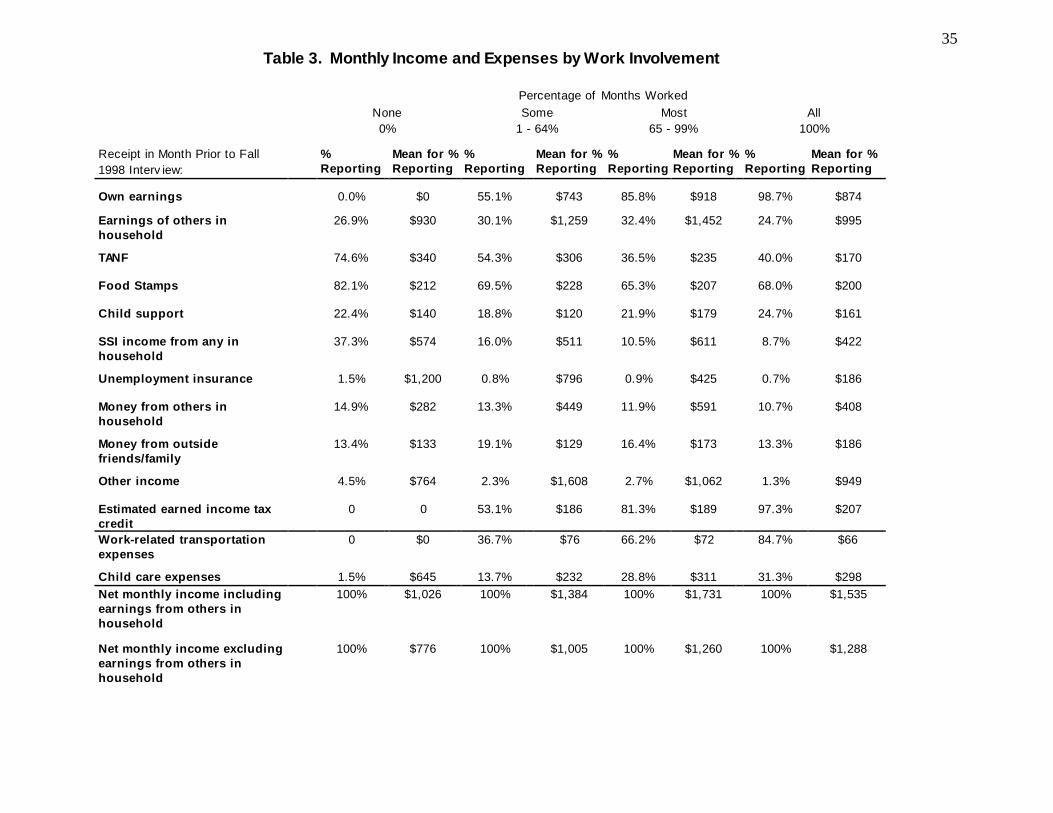
Table 3 compares monthly income by source and work expenses by the extent of work
involvement. For each income source, we show the percentage of all respondents who received it
and the mean for those with positive values. Row 1 reports respondents’ own earnings in the
month prior to the Fall 1998 survey. Both the proportions of women reporting earned income
and the mean earnings of those who worked in that month increase with the extent of work.
Only 55.1 percent of women who worked some of the time reported earnings, which averaged
$743; 85.8 percent of those working most of the months reported earnings in late 1998, which
averaged $918.10
Similarly, the likelihood of reporting cash welfare (TANF) benefits declines as work
involvement increases -- from 74.6 percent of those with no post-PRWORA work history to
54.3 percent for those who worked in some of the months, to about 40 percent for those working
most and all of the months. That two-fifths of women who worked in every month were
receiving cash welfare and two-thirds were receiving Food Stamps shows that work attachment
9 The fact that the total household income level in Table 1, row 3, column 3 is slightly above that in row 3,column 4 is due to the inclusion of earnings from other household members

19
alone does not guarantee self sufficiency. Most of the women who worked in every month and
received welfare or food stamps were working part-time and/or at a low wage rate.11
Table 3 also shows the extent to which respondents receive income from sources other
than their own earnings and public assistance. Thirty-seven percent of the women who never
worked reported SSI income for themselves or another household member; only 9-16 percent of
the women in the other work effort groups reported SSI receipt. Health problems, either of their
own or those of family members, are one reason some women did not work over the study
period.
There are not large differences across the work involvement categories in the extent of
receipt of other income sources. For example, about one-quarter to one-third of respondents
lived with another household member who was working, and the earnings of these other
household members, on average, exceeded those of the respondent. The receipt of child support
varied from about one-fifth to one quarter of each group, with the amounts received ranging, on
average, from $120 to $179 in the most recent month.
To derive more comprehensive measures of economic well-being, income from all sources,
including food stamps, was summed for each respondent. Then the estimated earned income tax
credit received was added and work expenses paid were subtracted.
10 Two women who worked in every month since February 1997 did not report their earnings last month and arethus coded as not reporting earnings. Thus, the percentage reporting earnings for the last category in Table 3 is98.7.11 About half of these women usually worked less than 35 hours per week; 12.8 percent earned less than $450 in theprior month. Further, about 12 percent of the respondents who worked in every month reported working 48 or fewerweeks in 1997.
20
Working families with children that have annual family income less than $26,500 with one
child and $30,095 with two or more children are eligible for the Earned Income Tax Credit
(EITC). These income cutoffs are high enough that almost every respondent who works is
eligible. The maximum EITC in 1998 was $3756 for a family with two or more children and
$2271 for a family with one child. Because we are evaluating poverty based on earnings last
month, the relevant EITC maxima are then $313 and $189 per month. We include our EITC
estimates as an income source. Table 3 shows the estimated percent of women in each work-
involvement group who would receive the EITC. This percentage increases with work effort,
ranging from 53.1 percent for those working in some months to 97.3 percent for those who
worked in every month.12 The value of the EITC, however, does not vary much across the
groups, ranging from $186 to 207.
The first two rows in the bottom panel of Table 3 report work-related transportation and
child care expenses. Edin and Lein (1997) argue that work-related expenses substantially lower
returns to work for their sample of AFDC recipients. In our sample, these expenses, on average,
are not large enough to reverse the finding that economic well-being increases with the extent of
12 We estimated the monthly EITC in 1998 by using monthly income sources as proxies for annual income (wemultiply monthly income from own earnings, unemployment income, social security and pensions by 12 months).The credit was calculated using only earned income as the law requires and with our estimates of adjusted grossincome (which includes unemployment and social security income). According to IRS rules, the EITC is the lesservalue of the two amounts computed from these income definitions. Eligibility is determined by number ofdependents and amount and source of income. We assume that untaxed earned income, interest and dividends,student loan interest or scholarship income, and IRA deductions are all not received or paid by respondents. Weassume that all respondents file returns with themselves and their children as a single tax unit. We thus excludeother household members’ income and assume that all of the respondents’ children are their dependents and are notclaimed by any other tax filer. For the 19 women who do not have children under age 18 living in their household,we assumed that they were eligible only for the much smaller EITC available to single persons between the ages of25 and 64. This is a maximum annual credit of $341 or $28/month.
21
work involvement. The proportion of women who report work-related transportation expenses
increases sharply with work involvement. Only 36.7 percent of women who worked in some
months reported work-related transportation expenses, whereas 84.7 percent of those who
worked in every month reported them. The average amount of transportation costs was modest,
ranging from $66 to $76 per month.
The proportion of women reporting child care expenses also increases with the extent of
work involvement – from 1.5 percent for women who did not work to 31.3 percent of those who
worked in every month.13 Out-of-pocket child care costs were higher than transportation
expenses. For women who reported spending on child care, it ranges from $232 to $311 per
month for the women who work some, most, or all of the time.14 Some of the women who do not
pay much out-of-pocket for child care are receiving state subsidies, which are paid directly to
their child care providers.15
The bottom panel of Table 3 reports two measures of net monthly income, one that
includes and one that excludes the earnings of other household members. Net income is
computed as the sum of income from all sources shown in the top panel of the table, including
the value of Food Stamps and the estimated EITC, minus the sum of work-related transportation
and child care expenses, shown in the middle panel. Net income for both measures is higher for
13 Because child care is necessary for a person to conduct job search or attend job training, we include child careexpenses (which could be incurred by those not working) when we calculate net monthly income.14 One woman who did not work in any of the months (1.5 percent of this group) reported spending $645 in themonth prior to the survey.15 In this wave of the survey, respondents were only asked about out-of-pocket spending. In the third wave, they areasked about receipt of the state subsidy paid directly to child-care providers.
22
the women who worked most or all of the time than for those who worked none or some of the
time.
The first measure of net income ranges from $1026 for women who never worked to
$1535 for those who worked in every month and $1731 for those who worked most of the time.
The pattern is even stronger when we subtract earnings of other household members from net
monthly income (bottom row).16 This measure for women who worked in every month, $1288,
is 66 percent higher than that of women who never worked, $776, and 28 percent higher than
those who worked some of the time, $1,005.
Thus, in the aftermath of the 1996 welfare reform, work pays, at least on average, for
women who were welfare recipients. The payoff to earnings relative to welfare, however, would
be lower in states with shorter time limits, quicker and more aggressive sanctioning policies, or
ones that make it more difficult to combine welfare and work than does Michigan. For example,
if the group of women who worked in every month had not received any TANF benefits, the
average monthly income (net of work-related expenses and the earnings of other household
members) would have been $1212, instead of $1288, and their economic advantage relative to
non-workers would have fallen from 66 to 56 percent.17
16 We subtracted the earnings of other household members because we are not certain that those members fully sharetheir earnings with respondents.17 Although the text emphasizes increases in mean net monthly income as work involvement increases, there issubstantial variation within each category. For example, although women who have worked all or most of the timeare much better off on average than women who have not worked at all, about one-fifth of these women have netincomes below the mean of those who did not work ($776). About two-fifths of the women who worked some ofthe time fall below this amount; about half of those who did not work at all. The pattern is the familiar one – fewerwomen fall below this threshold as work involvement increases.
23
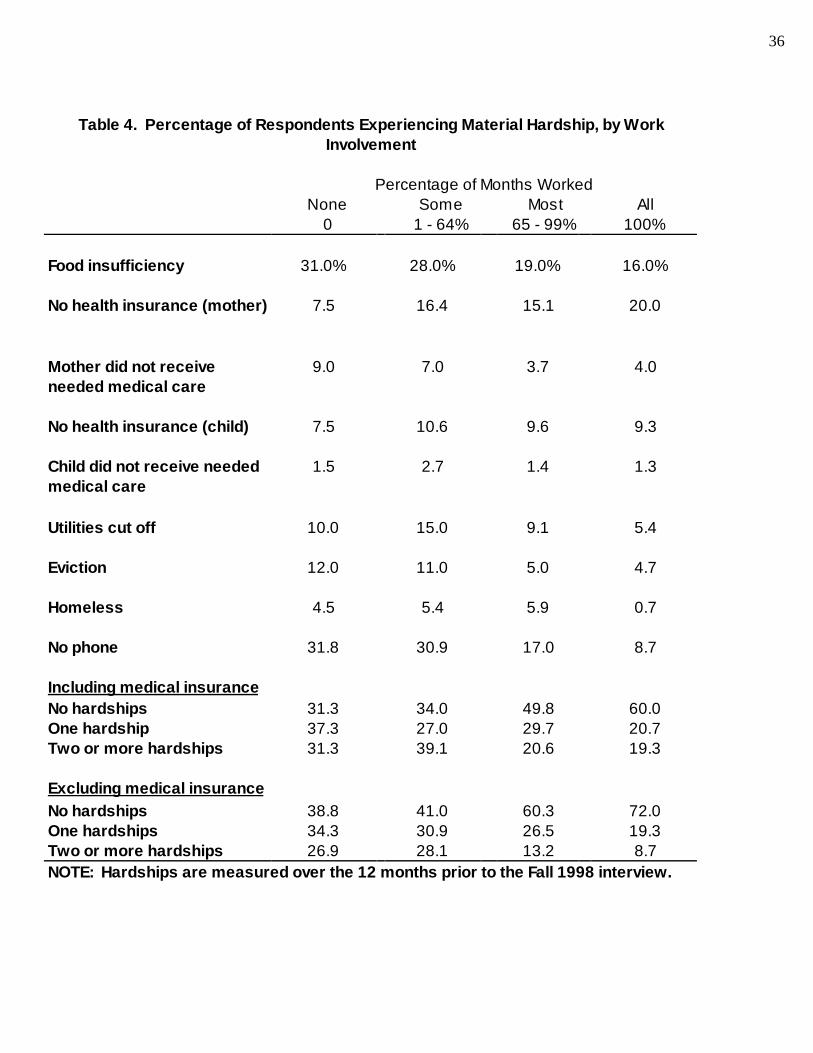
Table 4 explores the extent to which a variety of measures of material hardships reported
in the 12 months prior to the second interview vary by work involvement. We examine the
incidence of nine material hardships – food insufficiency,18 lack of health insurance for either the
mother or children, instances in which the mother or her child did not receive needed medical care,
and experiences of a utility shut-off, eviction, or an episode of homelessness, and if she currently
lacks a telephone. A general pattern emerges -- the two groups of women who have worked in
most or all of the months are less likely than the others to report having experienced one or more
of the nine hardships. For example, (first row), 28 to 31 percent of women who worked in none
or some of the months reported sometimes or often not having enough food in the last year,
compared to 16 to 19 percent for women who worked most or all of the time.
There is an important exception to this pattern. Lack of health insurance is highest among
those who have worked in every month – 20 percent are not covered and 9.3 percent do not have
coverage for their children.19 The finding suggests that lack of access to health insurance remains a
serious problem for recipients in the process of leaving welfare for work.
The bottom panels of Table 4 show that the cumulative number of experiences of material
hardship decline with the extent of employment attachment. For example, 31 percent of women
who never worked and 39 percent of those who worked some of the time experienced two or
18 Respondents are coded as being “ food insufficient” if they reported that they sometimes or often did not haveenough food to eat when asked: “ Which of the following describes the amount of food in your household – enough,sometimes not enough, often not enough.” This measure is also used in the Current Population Survey and theThird National Health and Nutrition Examination Survey (NHANES III). See Alaimo et al. (1998) for a discussionof this measure.19 The percentage of respondents whose children do not have health insurance does not vary much by extent ofwork, perhaps due to Michigan’s implementation of the Child Health Insurance Program (CHIP).
24
more hardships, compared to about one-fifth of those working most or all of the months. When
we examine all hardships except medical insurance, the relative disadvantage of the women who
worked least is even greater.
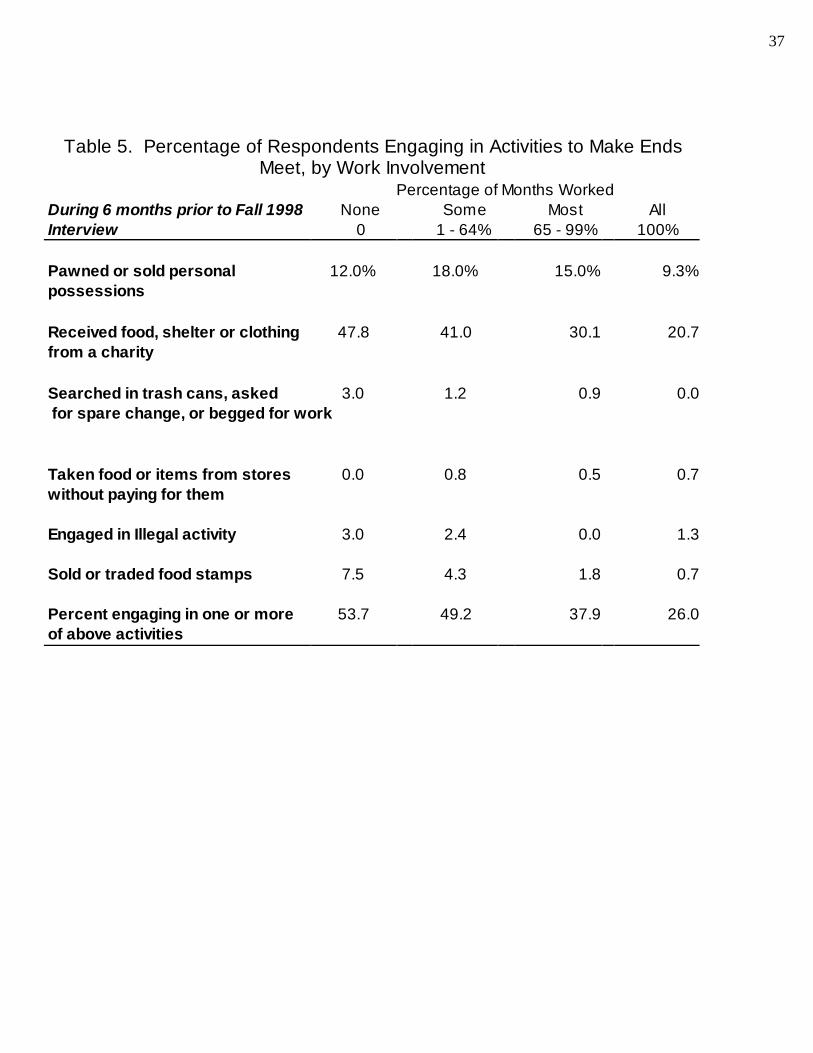
Table 5 reports the extent to which women had engaged in one or more of 6 activities to
make ends meet during the 6 months prior to the Wave 2 interview. These activities range from
pawning or selling personal items to engaging in illegal activities. Our interpretation is that
women engage in these activities as a last resort, when they have difficulty getting by on the
regular income sources listed in Table 3. Women who worked in every month are less likely to
report engaging in these activities than were women who worked less. As the bottom row
indicates, 26 percent of those who worked in every month resorted to one or more of these
activities compared to 37.9 percent of those working most of the time, 49.2 percent of those
working some of the time and 53.7 percent of those who did not work. Thus, women who work
most or all of the time are better off than those working some or none of the time across all of the
measures of economic well-being that we have reviewed – income, experiences of material
hardship, and engagement in “last resort” activities.
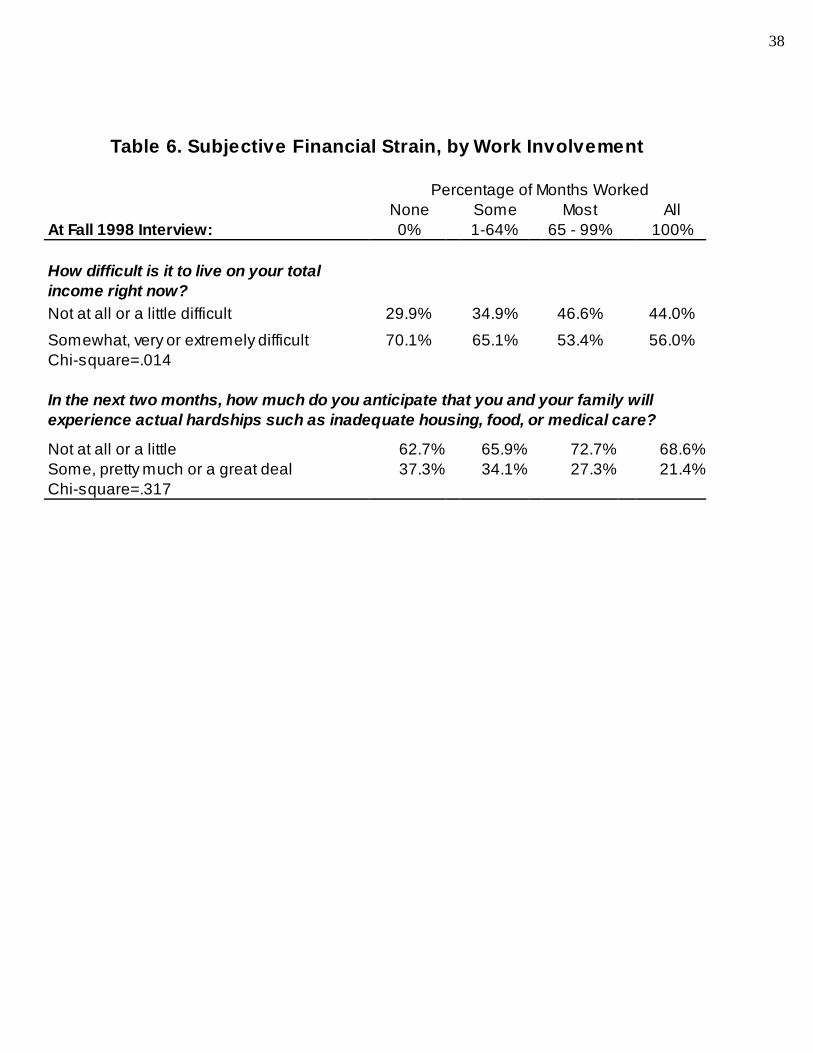
Table 6 reports respondents’ subjective appraisals of financial strain. We asked the
women how difficult it is to live on their income and whether they anticipated experiencing
hardships in the future. Two patterns emerge. First, recipients who work more are significantly
less likely to report having difficulties living on their income. Slightly more than half of the two
groups of women who worked in most or all of the months reported that it was somewhat, very
25
or extremely difficult to live on this income, compared to almost two thirds of those working
some of the time and 70 percent of those who did not work. Second, the respondents perceive
the future as being less difficult than their current situation. About 37 percent of women who
had not worked anticipated experiences of hardships, such as inadequate housing, food or medical
care, some, pretty much or a great deal, compared to about 21 percent of women who worked in
every month. Although these differences are not very large and are not statistically significant,
the women who worked most are better off. Taken together, these subjective appraisals of
financial strain are high for most respondents, but lower for those who have worked in the
greatest number of months.
Summary
Women who are accumulating the most labor market experience, measured by the
proportion of months worked between February 1997 and Fall 1998, have higher levels of
financial and subjective well-being. They have higher monthly earnings and income net of work-
related transportation and child care expenses, have experienced fewer material hardships, (even
though they are less likely to have health coverage than women who have not worked), and are
less likely to report engaging in other activities to make ends meet, such as pawning possessions,
seeking charity, or engaging in illegal behavior. They are also less likely to report subjective
financial strains.
Nonetheless, a substantial proportion of respondents, regardless of their level of work
involvement, report serious economic difficulties and subjective financial strain. For example, the
26
Fall 1998 poverty rate for those who worked in every month was 36.9 percent, about one-third
received cash welfare, two-thirds received Food Stamps, and a fifth reported two or more
experiences of material hardship, such as lacking health insurance and experiencing food
insufficiency. In addition, one quarter resorted to at least one activity to help make ends meet,
56 percent found it difficult to live on their income, and 21 percent expected to experience
additional hardships in future months. These respondents are successfully making the transition
from welfare to work, but continue to rely on government for income supplements and
subsidized access to medical care and child care.
The extent of material hardship and financial strain that we have documented, even among
women who are working in every month, demonstrates that declining caseloads do not
automatically translate into improved well-being. Working is associated with reductions in, but
not elimination of, economic vulnerability and material hardships. When President Clinton first
proposed welfare reform he spoke both of “making work pay” and of “ending welfare as we
know it.” PRWORA certainly “ended welfare as we knew it;” and, the expansion of the earned
income tax credit and other policy changes have helped “make work pay more than welfare.” But
much remains to be done if we are to strengthen the post welfare-reform safety net and alleviate
the continuing hardships documented here.
27
References
Alaimo K, Briefel RR, Fringello EA & Olson CM. 1998. Food Insufficiency in the UnitedStates: Results from the Third National Health and Examination Survey (NHANES III)American Journal of Public Health, 88:419 – 426.
Bane MJ & Ellwood DT. 1994. Welfare Realities: From Rhetoric to Reform. Cambridge, MA:Harvard University Press
Berg L, Olson L & Conrad A. 1991. Causes and Implications of Rapid Job Loss amongParticipants in a Welfare-to-Work Program. Presented at the Annual Research Conference of theAssociation for Public Policy and Management, Bethesda, MD
Blank RM. 1997. What Causes Public Assistance Caseloads to Grow? National Bureau ofEconomic Research Working Paper 6343, NBER, Cambridge, MA
Bonilla C. 1995. Hearing on Welfare Reform. Testimony before the U.S. House Committee onEconomic and Educational Opportunities. Washington, D.C.: Federal Document Clearing House,Inc.
Brauner S & Loprest P. 1999. Where Are They Now? What States’ Studies of People Who LeftWelfare Tell Us, The Urban Institute, Washington, D.C.
Corcoran, M., Danziger, S.K., Kalil, A., & Seefeldt, K. forthcoming. How welfare reform isaffecting women’s work. Annual Review of Sociology.
Cancian M, Haveman R, Kaplan T, Meyer D, & Wolfe B. 1999. Work, earnings, and well-being,after welfare: what do we know? In S. Danziger, ed. Economic Conditions and Welfare Reform.Kalamazoo, MI: Upjohn Institute.
Council of Economic Advisors. 1997. Technical Report: Explaining the Decline in WelfareReceipt, 1993-1996, Council of Economic Advisors, Washington, D.C.
Danziger S ed. 1999. Economic Conditions and Welfare Reform: Kalamazoo MI. UpjohnInstitute.
Danziger SK, Corcoran M, Danziger S, Heflin C, Kalil A, Levine J, Rosen D, Seefeldt, K, Siefert,K, & Tolman, R. In press. Barriers to the employment of welfare recipients. In Prosperity forall? The Economic Boom and African Americans, ed. R Cherry, W Rodgers. New York: RussellSage Foundation.
28
Edin K & Lein L. 1997. Making Ends Meet: How Single Mothers Survive Welfare and Low-Wage Work. New York: Russell Sage Foundation
Ellwood DT. 1999. Anti-poverty policy for families in the next century: from welfare towork—and worries. Working paper. Harvard University, Cambridge, MA.
Figlio DN & Ziliak JP. 1999. Welfare reform, the business cycle, and the decline in AFDCcaseloads. In S. Danziger, ed. Economic Conditions and Welfare Reform. Kalamazoo, MI:Upjohn Institute.
Friedlander D & Burtless G. 1995. Five Years After: The Long-Term Effects of Welfare-to-WorkPrograms. New York: Russell Sage Foundation
Gueron J & Pauly E. 1991. From Welfare to Work. New York: Russell Sage Foundation
Harris KM. 1996. Life after welfare: women, work, and repeat dependency. AmericanSociological Review. 61: 407–26
Hershey AM & Pavetti L. 1997. Turning job finders into job keepers: the challenge of sustainingemployment. The Future of Children. 7 (1): 74-86
Holcomb P, Pavetti L, Ratcliffe C & Reidinger S. 1998. Building an Employment FocusedWelfare System: Work First and Other Work-oriented Strategies in Five States, The UrbanInstitute, Washington, D.C.
Kalil A, Corcoran M, Danziger SK, Tolman R, Seefeldt K, Rosen D & Nam, Y. 1998. GettingJobs, Keeping Jobs, and Earning a Living Wage: Can Welfare Reform Work?, Institute forResearch on Poverty Discussion Paper, No. 1170-98, University of Wisconsin-Madison,Madison, WI
Kessler, R., McGonagle, K.A., Zhao, S., Nelson, C.B., Hughes, M., Eshleman, S., Wittchen,H.U. & Kendler, K.S. 1994. Lifetime and 12-month prevalence of DSM-III-R psychiatricdisorders in the United States: results from the National Comorbidity Study. Archives ofGeneral Psychiatry, 51: 8-19.
Levine PB & Whitmore DM. 1999. The impact of welfare reform on the AFDC caseload.National Tax Journal. In press
29
Loprest P. 1999. Families Who Left Welfare: Who Are They And How Are They Doing? TheUrban Institute, Washington, D.C.
Olson K & Pavetti L. 1996. Personal and Family Challenges to the Successful Transition fromWelfare to Work, The Urban Institute, Washington, D.C.
O’Neill J. 1999. Hearing on the Effects of Welfare Reform. Testimony Before the Subcommitteeon Human Resources of the House Committee on Ways and Means.http://www.house.gov/ways_means/humres/106cong/5-27-99/5-27onei.htm
Pavetti L. 1999. How much more can they work? Focus. 20 Newsletter of the Institute forResearch on Poverty (2): 16-19
Pavetti L & Acs G. 1996. Moving Up, Moving Out, or Going Nowhere? A Study of theEmployment Patterns of Young Women and the Implications for Welfare Reform, The UrbanInstitute, Washington, D.C.
Primus W. 1999. Testimony, Hearing on the Effects of Welfare Reform. Before the Subcommitteeon Human Resources of the House Committee on Ways and Means.http://www.house.gov/ways_means/humres/106cong/5-27-99/5-27prim.htm
Primus W, Rawlings L, Larin K & Porter K. 1999. The Initial Impact of Welfare Reform on theIncomes of Single-Mother Families. Center for Budget and Policy Priorities, Washington, D.C.
Rolston, H. 1999, June 2. Testimony: Effects of changes to the welfare system. Before theSubcommittee on Human Resources of the House Committee on Ways and Means.http://www.house.gov/ways_means/humres/106cong/5-27-99/5-27rols.htm
Straus, M.A., & Gelles, R.J. (eds.) 1990. Physical Violence in American Families: Risk Factorsand Adaptations to Violence in 8145 Families. New Brunswick, NJ: Transaction Books.
Tweedie J, Reichert D & O’Conner M. 1999. Tracking Recipients After They Leave Welfare,National Conference of State Legislatures, Denver.
Wallace G & Blank RM. 1999. What goes up must come down? explaining recent changes inpublic assistance caseloads. In S. Danziger, ed. Economic Conditions and Welfare Reform.Kalamazoo, MI: Upjohn Institute.
U.S. Department of Health and Human Services, Administration for Children and Families.1999. Temporary assistance for needy families (TANF) 1936-1999. U.S. Welfare Caseload

30
Data. http://www.acf.dhhs.gov/news/tables.htm
Ziliak JP, Figlio DN, Davis EE & Connolly LS. 1997. Accounting for the Decline in AFDCCaseloads: Welfare Reform or Economic Growth?, Institute for Research on Poverty DiscussionPaper No, 1151-97, University of Wisconsin-Madison, Madison, WI
31
Figure 1.Trends in Welfare Use, February 1997 - March 1999
Female Single Parent Caseload, February 1997(Urban Michigan County)
0
0.1
0.2
0.3
0.4
0.5
0.6
0.7
0.8
0.9
1
Feb-
97
Mar
-97
Apr-9
7
May
-97
Jun-
97
Jul-9
7
Aug-
97
Sep-
97
Oct
-97
Nov-
97
Dec-
97
Jan-
98
Feb-
98
Mar
-98
Apr-9
8
May
-98
Jun-
98
Jul-9
8
Aug-
98
Sep-
98
Oct
-98
Nov-
98
Dec-
98
Jan-
99
Feb-
99
Mar
-99
% receiving FIP Benefits % receiving Food Stamps
33%
56%

32
Figure 2Percent of Respondents Working, February 1997-September 1998
(n=693)
0
10
20
30
40
50
60
70
80
Feb-97 Mar-97 Apr-97 May-97 Jun-97 Jul-97 Aug-97 Sep-97 Oct-97 Nov-97 Dec-97 Jan-98 Feb-98 Mar-98 Apr-98 May-98 Jun-98 Jul-98 Aug-98 Sep-98
33
Table 1. Changes in Work and Welfare Status
Percent of SampleWork/Welfare Status at Interview Fall 1997 Fall 1998 Percentage
Point Change
1. Working/No Welfare 19.9 37.3 17.4
2. Working/Received Welfare 36.9 24.2 -12.7
3. Not Working/Received Welfare 35.0 23.8 -11.2
4. Not Working/No Welfare 8.2 14.7 6.5
Total 100% 100%Respondents are categorized as "working" if they reported working at least 20hours per week at the time of the interview. Women who work 1 through 19 hoursare classified as not working. In Fall 1997, they were 3.9 percent of the totalsample; in Fall 1998, 3.3 percent. The Fall 1997 sample includes all 753respondents at wave 1; The Fall 1998 sample includes the 693 respondents whowere interviewed again at wave 2.
34
Table 2. Monthly Household Income, Respondents' Earnings, andPoverty Status by Work Involvement, February 1997 to Wave 2
Percentage of Months WorkedNone Some Most All
0 1 - 64% 65 - 99% 100%
% of sample 9.7% 37.0% 31.6% 21.7%
Number of respondents 67 256 219 150
Mean monthly household income fromall sources*
$ 1,036 $ 1,345 $ 1,715 $ 1,480
Mean own monthly earnings** $0 $ 409 $ 788 $ 862
Poverty rate* 85.1% 61.3% 38.8% 36.9%Note: Note: All income and earnings data are measured in the month prior to the Fall1998 interview (wave two). The work categories distinguish between those with aboveand below average work experience. For our sample, the mean percentage of monthsworked is 59.7, and the median, 66.7. Sample size is 692* Based on total household income from all sources last month, including Food Stampsand the Earned Income Tax Credit.**For all women, including those reporting no earnings in the month prior tothe interview.
35Table 3. Monthly Income and Expenses by Work Involvement
Percentage of Months WorkedNone0%
Some1 - 64%
Most65 - 99%
All100%
Receipt in Month Prior to Fall1998 Interv iew:
%Reporting
Mean for %Reporting
%Reporting
Mean for %Reporting
%Reporting
Mean for %Reporting
%Reporting
Mean for %Reporting
Own earnings 0.0% $0 55.1% $743 85.8% $918 98.7% $874
Earnings of others inhousehold
26.9% $930 30.1% $1,259 32.4% $1,452 24.7% $995
TANF 74.6% $340 54.3% $306 36.5% $235 40.0% $170
Food Stamps 82.1% $212 69.5% $228 65.3% $207 68.0% $200
Child support 22.4% $140 18.8% $120 21.9% $179 24.7% $161
SSI income from any inhousehold
37.3% $574 16.0% $511 10.5% $611 8.7% $422
Unemployment insurance 1.5% $1,200 0.8% $796 0.9% $425 0.7% $186
Money from others inhousehold
14.9% $282 13.3% $449 11.9% $591 10.7% $408
Money from outsidefriends/family
13.4% $133 19.1% $129 16.4% $173 13.3% $186
Other income 4.5% $764 2.3% $1,608 2.7% $1,062 1.3% $949
Estimated earned income taxcredit
0 0 53.1% $186 81.3% $189 97.3% $207
Work-related transportationexpenses
0 $0 36.7% $76 66.2% $72 84.7% $66
Child care expenses 1.5% $645 13.7% $232 28.8% $311 31.3% $298Net monthly income includingearnings from others inhousehold
100% $1,026 100% $1,384 100% $1,731 100% $1,535
Net monthly income excludingearnings from others inhousehold
100% $776 100% $1,005 100% $1,260 100% $1,288
36
Table 4. Percentage of Respondents Experiencing Material Hardship, by WorkInvolvement
Percentage of Months WorkedNone
0Some
1 - 64%Most
65 - 99%All
100%
Food insufficiency 31.0% 28.0% 19.0% 16.0%
No health insurance (mother) 7.5 16.4 15.1 20.0
Mother did not receiveneeded medical care
9.0 7.0 3.7 4.0
No health insurance (child) 7.5 10.6 9.6 9.3
Child did not receive neededmedical care
1.5 2.7 1.4 1.3
Utilities cut off 10.0 15.0 9.1 5.4
Eviction 12.0 11.0 5.0 4.7
Homeless 4.5 5.4 5.9 0.7
No phone 31.8 30.9 17.0 8.7
Including medical insuranceNo hardships 31.3 34.0 49.8 60.0One hardship 37.3 27.0 29.7 20.7Two or more hardships 31.3 39.1 20.6 19.3
Excluding medical insuranceNo hardships 38.8 41.0 60.3 72.0One hardships 34.3 30.9 26.5 19.3Two or more hardships 26.9 28.1 13.2 8.7NOTE: Hardships are measured over the 12 months prior to the Fall 1998 interview.
37
Table 5. Percentage of Respondents Engaging in Activities to Make EndsMeet, by Work Involvement
Percentage of Months WorkedDuring 6 months prior to Fall 1998Interview
None0
Some1 - 64%
Most65 - 99%
All100%
Pawned or sold personalpossessions
12.0% 18.0% 15.0% 9.3%
Received food, shelter or clothingfrom a charity
47.8 41.0 30.1 20.7
Searched in trash cans, asked 3.0 1.2 0.9 0.0 for spare change, or begged for work
Taken food or items from stores 0.0 0.8 0.5 0.7without paying for them
Engaged in Illegal activity 3.0 2.4 0.0 1.3
Sold or traded food stamps 7.5 4.3 1.8 0.7
Percent engaging in one or moreof above activities
53.7 49.2 37.9 26.0
38
Table 6. Subjective Financial Strain, by Work Involvement
Percentage of Months WorkedNone Some Most All
At Fall 1998 Interview: 0% 1-64% 65 - 99% 100%
How difficult is it to live on your totalincome right now?Not at all or a little difficult 29.9% 34.9% 46.6% 44.0%Somewhat, very or extremely difficult 70.1% 65.1% 53.4% 56.0%Chi-square=.014
In the next two months, how much do you anticipate that you and your family willexperience actual hardships such as inadequate housing, food, or medical care?
Not at all or a little 62.7% 65.9% 72.7% 68.6%Some, pretty much or a great deal 37.3% 34.1% 27.3% 21.4%Chi-square=.317