work improving lives through data ecosystems
TRANSCRIPT

WORKPROGRAMME 2020/2021
Improving lives through data ecosystems

For further information contact:Celia de KlerkTel: 012 310 8454Strategy Office
Statistics South AfricaPrivate Bag X44Pretoria 0001
Koch Street, SalvokopPretoria 0002
User information services: (012) 310 8600Fax: (012) 310 8500Main switchboard: (012) 310 8911Fax: (012) 310 7381
Website: www.statssa.gov.zaEmail: [email protected]

Work Programme 2020/21
Statistics South Africa, 2020
Risenga Maluleke, Statistician-General

Work Programme 2020/21 Statistics South Africa
Published by Statistics South Africa, Private Bag X44, Pretoria 0001
© Statistics South Africa, 2020
Users may apply or process this data, provided Statistics South Africa (Stats SA) is acknowledged as the original source of the data; that it is specified that the
application and/or analysis is the result of the user’s independent processing of the data; and that neither the basic data nor any reprocessed version or
application thereof may be sold or offered for sale in any form whatsoever without prior permission from Stats SA.
Stats SA Library Cataloguing-in-Publication (CIP) Data
Work Programme 2020/21 Statistics South Africa. Pretoria: Statistics South Africa, 2020
162pp
ISBN: 978-0-621-48227-0
A complete set of Stats SA publications is available at Stats SA Library and the following libraries:
National Library of South Africa, Pretoria Division
National Library of South Africa, Cape Town Division
Library of Parliament, Cape Town
Bloemfontein Public Library
Natal Society Library, Pietermaritzburg
Johannesburg Public Library
Eastern Cape Library Services, King William’s Town
Central Regional Library, Polokwane
Central Reference Library, Mbombela
Central Reference Collection, Kimberley
Central Reference Library, Mmabatho
This report is available on the Stats SA website: www.statssa.gov.za
Copies are obtainable from: Reprographics, Statistics South Africa
Tel.: 012 310 8619
012 310 8161
Email: [email protected]
Email: [email protected]
Physical address: 75 Koch Street, Salvokop, Pretoria, 0002
For technical enquiries, please contact:
Mantikoane Lelosa
Tel.: 012 310 6995
Email: [email protected]

Contents
Foreword by Minister
Foreword by Statistics Council
Introduction by the Statistician-General
Part 1. Strategic overview 2
Part 2. Annual Performance Plan 28
Part 3: Stakeholders and the environment 124
Annexures 136
1. Fundamental Principles of Official Statistics 137
2. African Charter on Statistics 138
3. Planning, monitoring and reporting 141
4. Strategy map 142
5. Summary of publications 143
6. List of abbreviations and acronyms 145

Tables – Chief Directorates
1. Executive and Project Support 33
2. Strategy, Operations and Organisational Development 34
3. Risk, Anti-corruption and Integrity Management 35
4. Human Resources Management and Development 37
5. Facilities, Transport and Security Management 40
6. Financial Management 41
7. Internal Audit 43
8. Business Cycle Indicators 48
9. Structural Industry Statistics 51
10. Price Statistics 53
11. Private Sector Financial Statistics 55
12. Government Financial Statistics 57
13. National Accounts 59
14. Demographic and Population Statistics 65
15. Health and Vital Statistics 67
16. Social Statistics 69
17. Labour Statistics 73
18. Poverty and Inequality Statistics 75
19. Statistical Methods 82
20. Statistical Standards 83
21. Business Register 84
22. Geography 85
23. Survey Monitoring and Evaluation 87
24. Communication and Marketing 92
25. Business Modernisation 93
26. Publication Services 94
27. Information and Communication Technology 95
28 Analytical Studies 97
29. Provinces 102
30. Data Operations 104
31. Household Surveys and Censuses 105
32. Economic Subsystem 111
33. Social Subsystem 113
34. Independent Quality Assessment 115
35. Statistical Reporting 116
36. Data and Information Management 118

Official sign-off
In terms of section 5.1(a) of the Statistics Act, the Minister must on the recommendation of the Statistician-General prioritise the work programme
in accordance with the purpose and statistical principles contemplated in section 3, and both having been advised in this regard by the Council.
Section 7(1)(e) states that the Statistician-General determines and exercises final responsibility regarding the implementation of the work
programme of Statistics South Africa.
In terms of Part 5, Section 9 of the Treasury regulations, the Accounting Officer of an institution must ensure that the institution has a strategic
plan with a planning horizon of at least five years that complies; as well as an Annual Performance Plan (APP) covering the Medium Term
Expenditure Framework (MTEF).
The compilation of the work programme (also called the annual performance plan) has been guided by the Revised Framework for Strategic
Plans and Annual Performance Plans as prescribed by the Department of Public Monitoring and Evaluation. The core focus of the strategy is
about providing empirical evidence to inform the nation on planning, policy development, monitoring and evaluation, and decis ion-making. The
work programme is compiled according to strategic outcomes and performance indicators as captured in the strategic plan. Programmes of the
work programme are aligned to budget programmes. All performance indicators and targets are individually linked to a specific programme.
Addendum: The Technical Indicator Descriptions (TIDs) is attached as an addendum to the work programme. TIDs provide a brief explanation
of what the indicator is, with enough detail to give a general understanding of the indicator. The TIDs are available on the Stats SA website.

SIGNATURES
It is hereby certified that this Work Programme, for 2020/21:
• Was developed by the Management of Statistics South Africa reporting to the Minister in the Presidency responsible for Planning, Monitoring
and Evaluation.
• Was prepared in line with the current Strategic Plan of Statistics South Africa; and
• Accurately reflects the performance targets that Statistics South Africa will endeavour to achieve, given the resources made available in the
budget for 2020/21.
Bheki Mathumjwa
Chief Financial Officer
_______________________
Celia de Klerk
Head: Strategic Planning
_______________________
Risenga Maluleke
Statistician-General of South Africa
Approved by: _______________________
Jackson Mthembu
Minister in the Presidency

Executive Authority Statement
I t is my pleasure to present the Statistics South Africa (Stats SA) Work Programme 2020/21 as the first instalment of the organisation’s new five-
year strategic plan, which starts in the 2020/21 financial year. This programme is critical as it sets the scene for the next five years and is the
start of taking delivery of statistical services and products within the data ecosystem. The work programme is presented at the time when the world
is faced with the COVID-19 pandemic. This challenge places official statistics at the centre of galvanising all our forces to defeat the pandemic.
It is worth remembering that this year marks the thirtieth anniversary of the release of the founding president of a democrat ic South Africa,
President Nelson Rolihlahla Mandela. His vision for a non-racial, non-sexist, democratic and prosperous South Africa remains an ideal worth
pursuing. Together we must make it happen. One of the ways we can ensure that this vision becomes a reality is to strive to urgently achieve our
National Development Plan (NDP). The NDP sets out the year-on-year targets to be achieved by 2030 to create a better life for all our people.
Statistics are about the lives of our people. President Ramaphosa, reporting on the progress that our government is making, captured this point
concretely during the 2020 State of the Nation Address when he said: “These are not just statistics. These are lives of ordinary citizens being
improved. They are signs of progress.”
Stats SA produces more than 250 reports every year on poverty, labour, employment and other social and economic statistics. They are intended
to give policymakers, private sector and non-governmental organisations as well as planners across all spheres of government facts about the
state of the nation. In addition, our statistics are used by various international agencies.
It is my pleasure to announce that Stats SA has already begun the process of planning and organising the participation of South Africa in the
United Nations 2020 Round of Population and Housing Censuses. On our part as government, we will support the undertaking of the census to
ensure that all residents within the confines of our national borders are counted. I am encouraged by the commitment of our s taff in ensuring
that all the plans are in place for the execution of Census 2021.

Good-quality official statistics are fundamental for building a capable developmental state. Such statistics provide knowledge and insight to us
as policymakers and the general public. They enable us to make decisions informed by scientific evidence. The availability and reliability of
scientific evidence enhance transparency and accountability in our policymaking and implementation process. It also makes it easier for
government and citizens alike to monitor our performance in implementing our priority areas.
Our citizens deserve better services at all times. Credible statistics therefore become a critical lens through which our citizens can be assured that
government programmes are making an impact on their lives. The Integrated Planning Framework Bill – which aims at minimising duplication
and wastage of resources by streamlining the structure of government planning at national, provincial and local level – can only stand on solid
ground if it is supported by empirical evidence. The District Development Model will make a meaningful contribution to the lives of our people if
it is supported by data and statistics. I am pleased that our national statistics agency continues to provide the facts about our nation. Stats SA
enjoys the independence that is enshrined in our law as well as in other international protocols.
I wish to thank the Statistician-General and the leadership and staff of Stats SA for compiling this work programme. In this regard, let me
appreciate the role that is played by the South African Statistics Council under the leadership of Prof. David Everatt.
Mr Jackson Mthembu
Minister in the Presidency

Chair of Statistics Council Statement
This 2020/21 Work Programme of Stats SA is the first year of implementing its new strategic direction, which has been fully endorsed by the
South African Statistics Council. Stats SA will therefore also make a number of noticeable but small investments in transformation initiatives as it
embarks on its change journey as set out in the Strategic Plan. These investments must scale up over the next five years, which depends on the
availability of resources from government.
This new Work Programme – like the new five-year Strategic Plan – is, however, being implemented in a very challenging environment, both
nationally for our country and at an organisational level for Stats SA. These challenges come at a time when there is an even greater need to
keep Stats SA fully aligned to the UN’s Fundamental Principles of Official Statistics, and in step with international and developing world
innovations in statistics, and statistics agencies.
In year one of the implementation of the new strategy, Stats SA will also be fully engaged with the following important stati stical work:
release of the results of the National Household Travel Survey;
release of the Census of Commercial Agriculture;
preparations for Census 2021 (conducting the pilot census) – as the baseline information the country needs and the master sample that Stats
SA needs to advise other research entities in South Africa; and
the Income and Expenditure Household Survey to be conducted in 2020/21. This is a critical survey to measure and understand poverty and
inequality in South Africa, which has been delayed by lack of funds but must go into the field.
In this new financial year, the Statistics Council will also be fully supportive of initiatives to conclude parliamentary discussions and the possible
passing of the Amended Statistics Act in order to strengthen statistical coordination in South Africa. This will also strengthen the independence of
the Statistician-General, and strengthen Council to better play our supporting role.

We as Council wish to affirm our confidence in our leadership that these challenges will not deter the country or Stats SA from rising to and
overcoming the hurdles that are being faced. We remain committed to fully support Stats SA and its staff and will do everything in our power and
control to ensure that Stats SA is fully funded, even if it means that we take very unpopular or uncomfortable decisions.
Einstein noted that “In the middle of a difficulty lies opportunity.” Stats SA has used the last few years of financial auste rity to innovate, transition
to digitalisation, and reshape the institution. Stats SA has used its difficulties to good effect. Long may it continue, in hopefully a somewhat less
difficult funding period, to keep providing South Africa with the data we need to better understand who we are, what challeng es we face as a
nation, and how we are progressing towards meeting those challenges.
Professor David Everatt
Chair, South African Statistics Council

Accounting Officer Statement
The world at large is changing in the advent of the fourth industrial revolution. This change requires various institutions across the globe to
engage in partnerships and connect through the use of technology in the data ecosystem. The increasing demand for statistical information
globally, continentally and within the country requires Stats SA to embark on a different trajectory.
We have developed a new strategy for the next five years (2020/21–2024/25), which will be implemented through the annual work programmes
and monitored through the quarterly and annual reports. The overall organisational strategic goal of Stats SA in the next five years is to increase
the use of statistical information for better decision-making by leading the statistical production and coordination in the data ecosystem through
optimisation, innovation, partnerships and diversification.
The 2020/21 Work Programme focuses on optimising the use of current resources to deliver quality basic statistics as we inves t and strengthen
our partnerships with various stakeholders within the data ecosystem. Our change efforts will drive automation and digitalisation of our statistical
and support processes as we aim to reduce the cost of doing business.
Never before has human life been disrupted like we have come to learn through COVID-19. Empirical evidence the world over, and indeed
official statistics, has been much more critical than ever before. The challenge of drying financial resources also places us on a pedestal to search
for innovative ways to do our work.
The ultimate goal of Stats SA is to improve lives through the data ecosystem. This will be done through:
Insightful data – We will deploy data and information that are responsive to user demands and bring deeper understanding and insights for
informed decisions. We will focus our efforts on sustaining the quality of national indicators, conducting an Income and Expenditure Survey, and
piloting Census 2021.

Agile operating model – Smart operations require agile operating models that are lean, efficient and flexible. In 2020/21, we plan to
institutionalise business process management, continue with the transitioning efforts from paper to digital data collection, and establish a research
and innovation hub to research innovative methodologies and technologies.
Interconnected statistical systems – We will connect people, systems and technology through collaboration, partnerships and platforms. We will
be investing in strengthening partnerships in the statistics system – suppliers, producers and users – as we drive the implementation of the amended
Statistics Act.
Transformed capability – We will invest in the transformation of our people’s capability, systems and technology. We will be aligning our
operations to a new approved structure that will entail the redeployment and reskilling of staff across the organisation. We will also invest in the
culture and leadership programme as we embark on our new journey of leading a digital organisation.
We have managed to deliver on our mandate over the past five years with the serious challenge of declining resources, and for that I thank the
staff of Stats SA for their commitment and hard work. I would like to thank the leadership of this organisation who has been helping me to steer
this ship in very difficult times. I further extend a word of gratitude to the South African Statistics Council, which is chaired by Prof. David Everatt,
for its unrelenting support to official statistics. The Statistics Council is an independent body that advises the Minister and the Statistician-General.
On this note, let me extend my appreciation to the Minister in the Presidency, Honourable Jackson Mthembu, for his sterling leadership and
commitment to uphold the independence of Stats SA.
Risenga Maluleke
Statistician-General


2
Strategic overview

3
1. Strategic overview
1.1 Introduction
And so we find ourselves today at a decisive moment. We have a choice. We can succumb to the many and difficult and protracted problems that
confront us, or we can confront them, with resolve and determination and with action. Because we choose to confront our challenges, our
immediate, vital and overarching task is to place our economy on a path of inclusive growth. Without growth, there will be no jobs, and without
jobs there will be no meaningful improvement in the lives of our people.’ (President Cyril Ramaphosa, SONA 2020)
Statistics are a vital source of evidence as it provides objective and numerical data on important aspects of the country, including economic
growth, job creation, characteristics of the population, social living conditions, health, education and crime, to mention a few.
Diminishing resources are posing a huge threat to the country, requiring different approaches to service delivery to all South African citizens. The
planning and development of these new approaches require statistics that will enable better decisions. Evidence-based policy- and decision-
making help to address the real needs of the public towards building a better life for all.
The overall organisational strategic goal is to increase the supply and use of statistical information for better informed decisions by leading the
statistical production and coordination in the data ecosystem through optimisation, innovation, partnerships and diversificat ion.
In this work programme, our focus is on optimising the use of our current resources to del iver quality national indicators, as we build and
strengthen strategic partnerships in the data ecosystem. We will be piloting the census in October 2020 to ensure that all our processes and
systems are ready to go for the main census in 2021. We will continue to drive legislative reform through the Amendment of the Statistics Act.
We have set out a bold transformation and change agenda to guide our transition into the data ecosystem.
‘The time ahead of us is a time of great difficulty, but also a time laden with great opportunities.’ (President Cyril Ramaphosa, SONA 2020)
As we echo the time of difficulty, but also a time of great opportunity, the task ahead of us requires a culture of collective leadership that embraces
change and diversity in thought and practice.

4
1.2 The strategic direction
Stats SA’s vision, mission and values form the basis of our strategy.
1.2.1 Vision
‘Improving lives through data ecosystems’
1.2.2 Mission
‘To transform the production, coordination and use of statistics through optimisation, partnerships and
innovation’
1.2.3 Our culture and values
Our culture embraces diversity in thought and practice in order to guide our behaviour on the change and
transformation journey. Our culture aims to align the purpose of staff members with that of
the organisation. Our culture will help us to create the future that we want by ‘Embracing change and
transformation’, ‘Driving powerful and meaningful engagements’ facilitated through ‘Ethical and collective
leadership’.
Our shared values will help our employees and the organisation to grow and develop. Our values form
the basis of our methods of work, the way we make decisions, and the way we interact with our stakeholders
both internal and external. Our values are:
Integrity: We take accountability for the quality of information delivered by striving to deliver products
and services in a transparent and ethical way. We ensure that our products are fit for use and aligned
to internationally recognised best practice;
Empowering partnerships: We create opportunities for organisational and individual growth. We will
treat each other with mutual respect and harness diversity to advance organisational effectiveness. We
foster partnerships to achieve better coordination and collaboration; and
Service excellence: We strive to deliver more products and services to satisfy user needs through
operational excellence and value for money, and by continuously increasing our productivity through
innovation.

5
1.2.4 Overall strategic goal and thrust
The overall organisational strategic goal is to increase the supply and use of statistical information for better informed decisions by leading the
statistical production and coordination in the data ecosystem through optimisation, innovation, partnerships and diversification.
1 – 2 years (Tactics): We are optimising the use of our current resources to deliver quality basic statistics, as we build and strengthen strategic
partnerships in the data ecosystem. Tactically, we are focusing on change initiatives to optimise and digitalise our statistical and support processes.
We will invest in building new skills. Envisioning the data ecosystem will commence in this period.
3 – 5 years (Strategy): During this period, we have adopted a bimodal approach in our methods of work, to create space and time for innovation,
without disrupting our day-to-day operations for continuity. Modernising our business processes will continue in order to reduce the cost of doing
business. We will upscale our investment in reskilling of our staff and establishing new partnerships. In this period, transformative initiatives are
introduced cautiously as we are looking at new ways of doing our work. We commence with key building blocks in the enterprise architecture
towards building a platform that will facilitate interconnectivity.
5 – 10 years (Vision): By this time, Stats SA has set frameworks and policies for statistical development in the data ecosystem. Participants in the
data ecosystem, are following guidelines from Stats SA to collect, process and disseminate their data. We continue to invest in new partnerships.
Statistical systems will interconnect and 80% of statistics meet minimal level of statistical principles to respond to the indicators in the integrated
indicator framework (IIF).
10+ years (System-level evolution): Stats SA has diversified its service delivery and offering to users. An interconnected platform exists and is
available to users through a self-help portal to access and use data and statistics to inform decisions. The statistical system is transformed where
Stats SA is a data regulator in the data ecosystem, driving and facilitating statistical development in the country.
“In strategy it is important to see distant things as if they were close and to take a distanced view of close things” – Miyamoto Musashi

6
Data ecosystem
The data ecosystem is defined as a complex network or interconnected system that aims to connect people, systems and technology.
It is an evolving system where emerging technologies have given rise to new and non-traditional data sources and new analytical
methods that were previously not possible. This community of interacting entities as well as the policy environment in which new data
users and producers operate, creates an extended data ecosystem of many new actors with new capabilities. (Adapted from Paris21)
Our vision will be realised if policy and development programmes are underpinned by a vibrant data ecosystem that provides
information and insights for evidence-based decisions.

7
1.2.5 Strategic impact
The impact of the strategy is evidence-based decisions that promotes citizenry and informs policy development, planning, monitoring and
evaluation to create a better life for all.
1.2.6 Outcomes, indicators and targets
Stats SA identified the following four strategic outcomes that the organisation aims to achieve in pursuit of transforming the statistical landscape
in the country.
Insightful data – Data and information are responsive to user demands and bring deeper understanding and insight for informed decisions.
Agile operating model – The business operations are lean, efficient and flexible.
Inter-connected statistical systems – People, systems and technology are interconnected through collaboration, partnerships and platforms.
Transformed capability – The capability (people, systems and technology) of the organisation and statistical system is transformed.
The next section outlines the:
Strategic outcomes
Outcome statements
Strategic focus areas and initiatives
Key outcome indicators

8
Strategic outcome 1: Insightful data Insightful data speaks to the information requirements for development and sustainability concerns of humankind, at a level that is within the
grasp of the nation’s people and global citizens.
The need for statistics has never been so apparent. Data requests cover a wide range of aspects of the economy, society and the environment,
including new fields such as well-being, climate change and the digital economy. The ability of the statistical system to respond to the growing
demand of users for insightful data and information remains a challenge in the current environment. Stats SA therefore aims to adapt a new data
culture that is more responsive, flexible and proactive to user demands.
Outcome statement: By 2025, we serve users’ basic demands through an online self-service platform.
Outcome statement: By 2030, users are partners in co-creating value in the data ecosystem.
The following strategic focus areas will guide the achievement of Insightful data:
Key indicators and targets for success:
Outcome indicator Indicator baseline Five-year target
Percentage indicators in the IIF that can be
harnessed from the statistics system
5% of indicators in the IIF are harnessed
through the statistical system
(IIF 2019/20)
50% of indicators in the IIF are harnessed
through the statistical system
Percentage increase in use of statistics to
inform evidence-based decisions
400 000 publication downloads 10% increase in publication downloads over
5 years
% increase in social media presence
Number of users reached via social
media:
Facebook – 27 000
Twitter – 51 900
Linkedln – 21 900
10% increase of national online users
reached via social media
Percentage increase in overall user
satisfaction levels
80% user satisfaction levels (USS 2019) 85% user satisfaction levels

9
Strategic outcome 2: Agile operating model
An Agile operating model is enables flexibility and responsiveness to the use of innovative development practices to deliver statistical products
and services to users better, faster and more cost-efficient.
Outcome statement: By 2025, efficiencies in the business operating model are underpinned by innovative methodologies.
The organisation aims to reduce the cost of doing business by refining methodologies to guide all downstream activities in the value chain. Smart
operations will be implemented taking advantage of technology as well as leveraging on available statistical infrastructure in the data ecosystem,
to enable use of various available input data sources to enhance the production of credible statistics.
Outcome statement: By 2030, statistical operations and methodologies are agile in response to opportunities and disruptions in the data
ecosystem.
Stats SA has transformed its business model in the data ecosystem. Stats SA is agile and adapts quickly to external opportuni ties. We disrupt
our own methods of work ahead of external forces.
The following strategic focus areas will guide the achievement of an Agile operating model:
Key indicators and targets for success:
Performance indicator Indicator baseline Five-year target
Reduced turnaround time in the
production of quality statistics
Statistical releases of household surveys
are published 6 months after the reference
period
Statistical releases of household surveys are
published 3 months after the reference period
Reduced cost in the provision of quality
statistical products
Stats SA’s current operating cost is R1,8 billion for the provision of quality
statistical products
Stats SA’s operating cost reduced by 10%
Increased number of business processes
improved through digitalisation
3 household survey operations are
digitalised 10 business processes (household and
business surveys, and support services) are
digitalised

10
Strategic outcome 3: Interconnected statistical systems An Interconnected statistical system is a network of various data systems, institutions, technological resources, human resources and partnerships
based on shared principles that are interoperable and interconnected. An interconnected system aims to improve efficiency, accountability and
accessibility.
Outcome statement: By 2025, statistical systems are connected through statistical principles, standards and frameworks.
Stats SA envisions to be the key authority to facilitate the establishment of an interconnected statistical system by connecting people, systems and
technology in the data ecosystem.
Outcome statement: By 2030, the creation and use of data in the data ecosystem is driven by statistical principles, standards and frameworks
facilitated by interconnected platforms.
Statistical partners within the data ecosystem subscribe to the statistical principles, standards and frameworks as directed by the SG in the creation
and use of data for all indicators in the IIF.
The following strategic focus areas will guide the achievement of Interconnected statistical systems:
Key indicators and targets for success:
Performance indicator Indicator baseline Five-year target Increased number of frameworks included in
the IIF that broaden the demand for
statistical information
3 frameworks included in the IIF (SDGs,
Agenda 2063 and NDP)
5 frameworks included in the IIF
Increased proportion of IIF data sources that
comply with statistical principles and
standards
31% data sources comply with statistical
principles and standards
50% data sources comply with statistical
principles and standards
Increased number of statistical series that
are certified as official
4 statistical series are certified as official
through SASQAF
12 statistical series are certified as official
through SASQAF
Increased interconnectivity in the statistical
system
Conventional connectivity of people,
systems and technology
Innovative technology connecting people and
systems
11
Strategic outcome 4: Transformed capability
Transformed capability refers to a major shift in an organisation’s strategic capabilities in terms of its human, technological and organisational
capital so that it can drive business transformation and change in order to remain relevant and deliver better outcomes for i ts stakeholders.
Outcome statement: By 2025, we have adopted agile technologies and built a diverse, skilled and versatile workforce that embraces change
and is able to deliver innovative solutions.
For Stats SA to remain relevant and be a meaningful player in the environment in which it operates, it has to adopt agile technologies driven by
a skilled workforce to foster modernisation and innovation in the business operating model.
Outcome statement: By 2030, we are leading agile, interconnected and seamless technologies and have created a cadre of analytical capability
to drive value in the data ecosystem.
Stats SA will be trending among leading statistics agencies that have embraced digital transformation. We have created interconnected statistical
systems that are agile and capable to deliver value to stakeholders. Through our research functions within the statistical system, we have created
various new capabilities in technology, data analytics and geospatial analysis.
The following strategic focus areas will guide the achievement of Transformed capability as a strategic outcome:
Key indicators and targets for success:
Performance indicator Indicator baseline Five-year target
Enterprise architecture institutionalised Ad-hoc systems development and ICT
infrastructure End-to-end digital platform and architecture
developed and implemented
Increased capability of staff to operate in
the digital environment
Staff members have skills for the current
environment
No leadership skills in digital transformation
Staff members are reskilled for the digital
environment
100% of top management staff are skilled to
lead the digital transformation
Employment equity targets achieved 42% SMS staff are women
1,4% staff with disability
50% SMS staff are women
2% staff with disability
% increase of staff embracing
organisational culture and values
Staff Satisfaction Index for culture and
values is -0,25%
Staff Satisfaction Index for culture and values
is 0,1%

12
1.3 Situation analysis
“Data are the lifeblood of decision-making and the raw material for accountability. Without high-quality data providing the right information on
the right things at the right time; designing, monitoring and evaluating effective policies becomes almost impossible.” (A World That Counts, UN,
2014).
Defining a sound strategy that can compete and thrive in the fast-changing world is critical to maintain relevancy of the organisation in the future.
A comprehensive scan of the environment was undertaken to assess the readiness of the organisation to respond to key drivers and disruptions
in the external and internal environment.
1.3.1 External environment
National statistics offices (NSOs) are globally disrupted by changes from the external environment, posing both threats and opportunities to their
future relevance. The reality is that official statistics as defined, is under threat as it is in contrast to the modern world of getting things done.
Political environment
South Africa has adopted the National Development Plan 2030 as the lodestar to create a better life for all. The 6th administration has adopted
a Medium-Term Strategic Framework (MTSF 2019–2024) guiding the 5-year implementation and monitoring of the NDP in line with the seven
priorities to put the country on a positive trajectory towards the achievement of the 2030 vision. Key objectives of the MTSF are to:
a) Focus on building a constitutional democracy, building institutions, safety net and broadening access to services;
b) Address the triple challenge of poverty, inequality and unemployment;
c) Pave the road to undoing structural pillars of apartheid which produced multi-generational impoverishment of Blacks in general and Africans
in particular;
d) Rid society of fundamentals of segregation, exclusion, discrimination, oppression and marginalisation of our people form the benefits of
democracy and prosperity; and
e) Maximise access to resources, skills, opportunities and assets for all South Africans to realise their full potential.
At a global and continental level, member countries of the UN and the AU have adopted the SDGs and Agenda 2063 policy agendas respectively
towards driving sustainable development. These policy agendas form the basis of measurement of national indicators in South Africa. New and
emerging priorities that require measurement over time will need to be incorporated in the IIF and NSDS to ensure responsiveness to various
global developmental agendas and country priorities.
Economic reality
“If we look after what we sow, and what we have ploughed and laboured over so tirelessly, since the founding of our democracy, it will grow
and the seed will bear fruit. However, if we abandon our fields, the seeds we plant will wither.”(Minister of Finance: Budget Speech, 2019)
South Africa, during the times of plenty, introduced a number of policies to drive the country’s economic growth while attemp ting to negate
inequalities created by previous government systems. The Endogenous Growth (EG) model was already adopted by creating strategic partnerships
with developed countries particularly for investment and knowledge transfer through a number of platforms. Turnaround strategies were deployed
(Expanded Public Works Programme, BEE, AA, RDP and others). These served as a temporary corrective mechanism creating artificial economic
growth, which is unsustainable. The country is now faced with serious problems in different sectors and the rising unemployment rates (>29%,
Stats SA: Q4 of 2019) continue to fuel the situation. The challenges imply that there is little scope for any significant fiscal or monetary stimulus.

13
SA citizens and government sectors (including Stats SA) are also negatively affected, and this is putting the quality of basic statistics at risk, as
compensation of employees has become unaffordable.
Knowing and understanding the state and structure of the economy is important to design the right economic policies and programmes to
stimulate economic growth. To this end, data is essential. The lack of economic data at a lower level remains a concern as it does not allow
municipalities and districts to adequately plan for economic development.
Societal changes
Rapid urbanisation is presenting both opportunities and threats to the well-being of societies. It has drastically created an unbalanced population
mass with the proportion of South Africans living in rural areas falling from 41% in 2006 to 36,5% in 2015 (SA Poverty & Inequality Report,
2018). These changes, coupled with other South African societal developments, have led to several behavioural and cultural changes across
races. Family structures and lineage value have shifted from what it used to be more than 20 years ago. Family sizes have dropped with the total
fertility rate (TFR) declining from 2.66 in 2008 to 2.32 in 2018 (Stats SA, 2019). Society’s attitudes towards work, leisure, career and retirement
have changed, and citizens are more health conscious, causing them to change their eating habits, which has obviously led to an increased life
expectancy.
The advancement of women’s socio-economic empowerment and the promotion of gender equality is at the centre of SA developmental agendas.
Stats SA, in partnership with the Department of Women, Youth and People with Disabilities (DWYPD), the World Bank and other s takeholders,
are embarking on a focused study to address issues of harmonisation, develop the Disability Inequality Index (DII), and research the possibili ty of
running a disability survey. Stats SA’s outputs will take into consideration these societal changes by timely providing decis ion-makers with relevant
data, enabling them to introduce and deploy public services and programmes that will improve the lives of SA citizens.
Global pandemic – Covid-19
The Coronavirus has changed the world. The COVID-19 pandemic is simultaneously a health crisis and a global economic crisis. Almost all
sectors in the world, inclusive of the public sector, are currently dealing with the devastating effects of this global pandemic. It has resulted in
mass production shutdowns and supply chain disruptions, causing global ripple effects across all economic sectors.
The President of South Africa has announced a national state of disaster in March 2020, where the whole country went into lockdown to flatten
the curve of infections. The South African economy was already weak before the emergence of the pandemic. The immediate priority is to use
the joint levers of fiscal and monetary policy to support economic activity and alleviate hardship. Government has adopted a risk-adjusted
approach to reopening the economy.
As the President noted in his 21 April address, over the longer term, the South African economy cannot merely return to where it was before the
pandemic. Forging a new economy in a new global reality will require a social compact between business, labour, communities and government.
It will require far-reaching structural reforms enabling millions of South Africans to participate in building a more productive and prosperous
society. It will require steps to reimagine government’s industrial strategy and overhaul state-owned enterprises. A special adjustment budget has
been announced by the Minister of Finance that set out a range of economic reform proposals and measures to stabilise the public finances.
This has resulted in a budget cut of R200 million for Stats SA in the 2020/21 financial year.
Stats SA, immediately after the announcement of the national state of disaster, suspended face-to-face data collection which brought the
household surveys programme to a standstill. All data collection activities for businesses also came to a standstill during Level 5 which impacted
on the release of key economic indicators. Where possible, staff worked from home. Stats SA is no exception on embracing challenges that came

14
with Covid-19. The organisation embarked on new designing new statistical methodologies in areas of data collection and intensified the
development of systems and processes to respond to emerging needs.
Reimagining the future and planning for this global disruption has become the new normal. Technological inventions and new partnerships are
present vast opportunities. Agility and use of technology have never been more critical in leadership and have become the bedrock of the new
normal.
Technology changes
Every government or private sector organisation that makes use of the internet or digital platforms to operate and deliver services, generates data
that can potentially be harvested. The evolution of technology has distorted both the physical and virtual world across sectors, making digital
transformation a trending topic on all platforms. OECD countries have set their objectives at the 2016 Cancún Ministerial on the Digital Economy,
with the intention to maximise the benefits of digital transformation for innovation, growth and social prosperity. In the next five years, the focus
of global organisations will be mainly on technological themes such as process and business modernisation, ICT security, digi tal transformation
and enterprise architecture. The registered strategic focus on digital transformation is the first step, but the reality of digital transformation is
another, and many sectors are grappling with the changes and challenges it presents.
The South African government developed a public service digital transformation strategy to facilitate an innovative public service that leverages
on technology to improve internal operations and citizens’ experience. In addition, the South African Public Service has adop ted the Cloud-First
policy as one of the core building blocks towards digital transformation. The policy will enable public sectors to be more flexible and scalable i n
cost and actual physical space.
Stats SA will partner with technology and data analytics sector companies in the data ecosystem to gain a better leverage on their capability.
Environmental changes
Key environmental change drivers emanate from changing population dynamics and economic development. South Africa, similar to other
countries globally, is experiencing serious environmental changes, of which, if not properly monitored, the impact will soon exceed the ability of
the environment to absorb. Key environmental concerns and challenges that could soon become a threat include climate change (global
warming), air, water, land and soil pollution, and others. There are sectors in both the public and private corporation that are responsible for
managing these environmental changes, and have valuable data that can be processed to give better insight to policymakers.
The United Nations has issued the 2012 System of Environmental Economic Accounting (SEEA), which is a framework that integrates economic
and environmental data to provide a more comprehensive and multipurpose view of the interrelationships between the economy and the
environment. Stats SA has in the past compiled a compendium of economic environmental accounts, which was discontinued in 2016/17 due
to financial constraints. The importance of environmental statistics is evident in both the national and global policy agendas, as it influences the
measurement of the well-being of citizens.
Legislative changes
Statistics is governed at the global level by the UNCS through the Fundamental Principles of Official Statistics in order to safeguard official
statistics and guide national statistics offices in their work. At a continental level, the African Charter on Statistics also outlines six best practice
principles in line with the UNCS principles (see Annexures A and B for both the global and continental principles). The Inter national Monetary

15
Fund (IMF) as part of its responsibility to ensure the stability of the international monetary system, has developed the SDDS that drives a sound
statistical system around the world. South Africa is a signatory of the SDDS and complies with the dissemination standards.
The Department of Government Communication and Information Systems (GCIS) issued the Promotion of Access to Information Act (PAIA) of
2000 to ‘foster a culture of transparency and accountability in public and private bodies by giving effect to the right of access to information’.
To protect personal data, the Department of Justice and Constitutional Development (DoJ&CD) issued the Protection of Personal Information
(POPI) Act of 2013 to ensure that all South African institutions conduct themselves in a responsible manner when collecting, processing, storing
and sharing another entity’s personal information. Other sectors have developed by-laws governing management of their information, presenting
a vacuum within the data ecosystem of a regulatory body or legislation to manage datasets and access thereof for the purposes of statistics and
research in the country.
Industry changes
Data has become a major resource globally, offering enormous opportunities for citizens, businesses and governments to make better informed
decisions and develop innovative solutions for countries.
Several NSOs and other statistics agencies across the globe have embarked on various initiatives and innovations to respond t o many
opportunities and threats that the digital and data revolution offers. These industry trends in the statistics sector include:
Data acquisition: Explore use of alternative data sources including private sector data sources through partnerships with new entrants in the
data ecosystem. To harness this new data, corporates are introducing multimode approaches to create a space for exploratory activities,
testing and validating new initiatives before deploying them in the production environment.
Data integration: Linkage of different data sources and statistical systems. Geospatial capability offers countries opportunities to enhance
statistical products by integrating information to geo-location.
Data analytics: Exploring alternative methodologies and technologies to analyse big data and seeking data-driven analytical capabilities to
give insight to acquired information.
Data visualisation: Innovating dissemination methodologies and platforms to increase use of data and statistics.
These new trends institute for a different cadre of capability such as data science and data analytics, which are able to convert such raw or base
data into statistics ready for use in decision-making – whether to inform Stats SA methodologies, processes or those of policy planning, monitoring
and evaluation.
Partnerships
It is becoming critical for NSOs to build their partnerships beyond public sectors. The data ecosystem consists of participants that are producing
different forms of unofficial statistics, and of data analytical experts that use data from NSOs and other data producers to produce statistics that
are more relevant for users. There is an opportunity for Stats SA to embrace these participants and not view them as competitors to drive
production of statistics in the data ecosystem, while building distributed and diverse capacity/expertise and enabling access. The SG has minimal
mandate to access such data at no cost, and this is currently a barrier in the expansion of partnerships with stakeholders in the SA National
Statistics System (NSS). Stakeholders want to know “what is their gain in the statistics game”. Stats SA will implement the amended Statistics Act
and clearly outline its strategic intent to build partnerships in the data ecosystem.
The modern world requires data that responds to issues at hand on time and location, which is available in the form of big da ta and can be
sourced through technology platforms owned mostly by private sectors such as banks, retailers, communication companies, etc. Accumulation
of insights based on such digital data is monetised by private sectors with little or no incentive to share their data. Governments should see

16
these opportunities and unlock them for NSOs through legislations before future battles between those who believe in public knowledge and
those who will be profiting from its disintegration.
1.3.2 Internal environment
The internal environmental analysis included an intensive analysis and review involving staff members at all levels in order to identify
weaknesses and strengths within the organisation. A number of challenges and successes were noted across the statistics value chain and are
discussed below.
Service delivery and business operating model
Stats SA’s service delivery model is based on the core mandate as outlined in the Statistics Act, namely the production and coordination of
official and other statistics.
Statistical coordination
Section 14 of the Statistics Act outlines the responsibility for statistical coordination in the country.
Stats SA’s objective to lead the development and coordination of the national statistical system in South Africa is hampered by current resource
constraints. In addition, the Statistics Act (Act No. 6 of 1999) provides minimal mandate for the SG to access administrative records or any other
data at no cost, leading to minimal stakeholders’ desire to participate in the NSS.
The revised Act makes provision for the participation of partners in the statistics system in the development of the NSDS. The integrated indicator
framework (IIF), which is meant to align statistical information needs from global to municipal level, with the National Development Plan at the
centre of the framework, will form the basis of the NSDS.

17
Statistical production
Stats SA’s operating model is reflected in the Statistical value chain (SVC). An assessment of the efficiency and effectiveness of the SVC was
conducted with the following key findings:
Operating model: The current operating model has served the organisational well over the past decade to deliver basic quality statistics. More
than 250 statistical products are published annually, but the mode of operation is dated and expensive and therefore not sustainable in a
declining financial environment.
Demand and supply: The growing demand for data and information far exceeds the supply of official statistical information, especially at lower
levels of geography and frequency of product offerings. Stats SA’s current business model within the current funding constraints, which led to the
discontinuation of most value-add products, will therefore not be able to be responsive to growing user demands without pursuing strategic
partnerships within the data ecosystem.
Key projects: Stats SA has consistently demonstrated the ability to deliver on key projects over and above the normal product and service offerings.
Key projects include the South Africa Demographic and Health Survey, the Citizen Satisfaction Survey for KZN, and the Census of Commercial
Agriculture, to mention a few. The uptake of user-paid surveys will be guided by the IIF as well as the capability of the statistical infrastructure to
support these surveys.
Response burden: The average response rates of business and household surveys has exceeded 85%, which is in line with international best
practice. A growing concern, however, is the response burden on respondents in completing long survey questionnaires.
Statistical standards: The organisation has adopted and adapted various international statistical standards and practices over the past five years.
The organisation subscribes to the International Special Data Dissemination Standard and continues to publish and disseminate statistics in line
with these standards.
Statistical infrastructure: Collaborative partnerships have been established with various municipalities to build and maintain the geospatial
information frame (GIF). A new navigation tool (M.APP Enterprise) was introduced as part of the CAPI transition project, which provides for
digitally captured structures and maps. Following Census 2021, the GIF will enable a new sampling frame for household surveys for the next five
years.
Location as a link between the economy, society and the environment: The next level of innovation required is the adoption of the Global Statistical
Geospatial Framework (GSGF), which facilitates the integration of statistical and geospatial information. The GSGF is situated in a rapidly
developing ecosystem that is strengthening the statistical and geospatial communities. It provides huge opportunities to modernise statistical
production systems and processes, to transform operations, and to derive new relevant metrics and indicators for statistical purposes. The growing
importance of integrating statistical and geospatial information calls for closer collaboration between geospatial experts and statisticians.
Systems, processes and technology: The organisation has embarked on a journey to modernise the statistical value chain. A comprehensive
review of all business processes was undertaken, enabling the organisation to identify new automation opportunities beyond the data collection
process, including the introduction of systems and processes. The organisation needs to invest in business process management to ensure
continuous improvement and innovation to drive change and reduce cost efficiencies.
Staff and skills
Staff profile: Stats SA has 2 836 filled posts against 3 511 permanent posts, representing a vacancy rate of 19,2% as at the end of September
2019, which continues to increase due to declining financial resources in the budget allocation of the compensation of employees (CoE).

18
Employment equity: Females represent more than 53% of the total staff complement. The inability to fill vacancies has impacted negatively on
meeting employment equity targets, especially at senior management levels. The age profile distribution indicates that Stats SA comprises very
few young people on a permanent basis, although the organisation always uses the opportunity in periodic surveys to appoint young people on
contract as fieldworkers.
Skills and capability: Stats SA has over the years prioritised capacity building for our people. Over and above the bursary programme benefiting
more than 200 staff annually and staff attending short courses, the organisation invested in the spatial and integrative anal ytical skills training
programmes, including the Master’s degree at Stellenbosch University (CRUISE) and SAS training. However, we do not have all the necessary
skills for the new digital environment.
Strategy, organisational performance and organisational design
Strategy and performance: Stats SA is a high performing organisation. Over the past four years, the organisation has consistently achieved more
than 80% of its targets as set out in the APP. The organisation reported an overall performance of 93% against a spending of 102% during
2018/19. The annual Work Programme consisted of both business-as-usual (BAU) and strategic targets. The organisation performed
exceptionally well in its BAU targets, which deliver basic statistics at more than 90%, but less so on its strategic targets, with a reported performance
of less than 80%. Stats SA has received three clean audit findings and one unqualified audit finding over the past four years , demonstrating that
the organisation is well administered and that governance and accountability practices are in place.
Organisational design: The modernisation of the statistical value chain has initiated the redesign of organisational processes and systems with a
major impact on the roles and responsibilities across branches, which in part led to the redesign of the structure process.
Trusted brand: Key results of the latest user satisfaction survey indicated that 85% of respondents found our statistics to be credible, 88% trusted
our statistics, and 89% used the website to access statistics.
1.4 Key priorities for 2020/21
The key priorities for 2020/21 are outlined below:
Driving legislative reform
Sustaining the quality of national indicators
Modernising the statistical value chain
Leading a transformation and change agenda
Rolling out the integrated indicator framework
Conducting Census 2021 pilot

19
1.5 Revisions to legislative and other mandates
Statistics South Africa is a national government department accountable to the Minister in the Presidency: Planning, Monitori ng and Evaluation.
The activities of the department are regulated by the Statistics Act (Act No. 6 of 1999), which mandates the department to advance the production,
dissemination, use and coordination of official and other statistics to assist organs of state, businesses, other organisations and the public in
planning, monitoring, and decision-making. The Act also requires that the department coordinate statistical production among organs of state
in line with the purpose of official statistics and statistical principles.
Stats SA has finalised the proposed changes to the Act. An amendment to the Statistics Act (Act No. 6 of 1999) will be submitted to the legislature
to ensure that there is administrative and legislative consistency in accountability, as Stats SA was gazetted to be accountable to the Minister in
the Presidency. The key focus of the amendments is to strengthen statistical coordination mechanisms, to define and broad the scope and
participation in the national statistical system and to create a state-wide statistical service. Other amendments include changing the execution of
a population census from a 5-yearly to a 10-yearly cycle.
1.6 Overview of 2020/21 budget and MTEF estimates
Expenditure analysis
Budget summary 2020/21 2021/22 2022/23
R million
Special Adjusted
Appropriation Total
Current payments
Transfers and subsidies
Payments for capital assets Total Total
MTEF allocation Administration 663.3 397.6 0.3 265.3 693.8 753.7
Economic Statistics 282.1 282.1 – 0.0 326.1 344.4
Population and Social Statistics 124.2 123.6 0.0 0.5 176.9 235.1
Methodology and Statistical Infrastructure 143.8 143.6 – 0.2 198.2 209.0
Statistical Support and Informatics 281.5 263.5 – 18.1 301.3 324.1
Statistical Operations and Provincial Coordination 1 713.9 1 683.9 0.2 29.9 3 102.0 948.5
South African National Statistics System 43.3 43.1 – 0.2 45.7 47.6
Total expenditure estimates 3 252.2 2 937.4 0.5 314.2 4 843.9 2 862.6
Executive authority Minister in the Presidency: Planning, Monitoring and Evaluation
Accounting officer Statistician General of Statistics South Africa
Website address www.statssa.gov.za
The Estimates of National Expenditure e-publications for individual votes are available at www.treasury.gov.za. These publications provide more comprehensive coverage of vote-
specific information, particularly about transfers and subsidies, personnel and other public institutions. Additional tables in Excel format can be found at www.treasury.gov.za and
www.vulekamali.gov.za.

20
Expenditure trends and estimates
Vote expenditure trends and estimates by programme and economic classification Programmes 1. Administration 2. Economic Statistics 3. Population and Social Statistics 4. Methodology and Statistical Infrastructure 5. Statistical Support and Informatics 6. Statistical Operations and Provincial Coordination 7. South African National Statistics System Programme
Audited outcome Adjusted
appropriation
Average growth
rate (%)
Average: Expen- diture/
total (%)
Medium-term expenditure estimate
Average growth
rate (%)
Average: Expen- diture/
total (%)
2016/17 2017/18 2018/19 2019/20 2016/17 - 2019/20
Special Adjusted
Appropriation 2020/21 2021/22 2022/23 2019/20 - 2022/23
Programme 1 648.3 686.0 714.9 659.5 0.6% 28.6% 663.3 693.8 753.7 4.6% 20.6%
Programme 2 233.3 240.7 248.5 276.8 5.9% 10.5% 282.1 326.1 344.4 7.6% 9.1%
Programme 3 114.5 116.9 168.9 180.1 16.3% 6.1% 124.2 176.9 235.1 9.3% 5.3%
Programme 4 123.5 126.1 130.5 149.4 6.6% 5.6% 143.8 198.2 209.0 11.8% 5.2%
Programme 5 249.3 239.8 248.3 281.7 4.2% 10.7% 281.5 301.3 324.1 4.8% 8.8%
Programme 6 1 061.0 763.4 773.1 935.9 -4.1% 37.3% 1 713.9 3 102.0 948.5 0.4% 49.7%
Programme 7 31.2 22.6 26.8 30.9 -0.3% 1.2% 43.3 45.7 47.6 15.4% 1.2%
Subtotal 2 461.2 2 195.5 2 311.1 2 514.4 0.7% 100.0% 3 252.2 4 843.9 2 862.6 4.4% 100.0%
Total 2 461.2 2 195.5 2 311.1 2 514.4 0.7% 100.0% 3 252.2 4 843.9 2 862.6 4.4% 100.0%
Economic classification
Current payments 2 229.2 1 901.2 2 024.8 2 141.1 -1.3% 87.5% 2 937.4 4 524.2 2 545.5 5.9% 90.2%
Compensation of employees 1 371.8 1 409.5 1 493.2 1 460.1 2.1% 60.5% 1 611.5 1 739.7 1 798.9 7.2% 49.1%
Goods and services1 857.4 491.3 531.6 681.0 -7.4% 27.0% 1 325.9 2 784.6 746.5 3.1% 41.1%
of which:
Advertising 10.3 0.9 0.3 5.7 -17.8% 0.2% 56.3 256.1 2.3 -25.7% 2.4%
Minor assets 32.5 0.4 1.1 4.4 -48.9% 0.4% 650.3 2.0 2.0 -22.4% 4.9%
Computer services 87.3 75.0 79.5 99.4 4.4% 3.6% 126.6 130.7 128.1 8.8% 3.6%
Agency and support/outsourced
services
138.4 7.9 8.4 92.1 -12.7% 2.6% 16.3 1 301.1 28.0 -32.8% 10.7%
Operating leases 183.1 165.7 219.4 174.4 -1.6% 7.8% 171.9 209.3 200.1 4.7% 5.6%
Travel and subsistence 186.4 61.6 66.0 106.5 -17.0% 4.4% 89.1 309.8 124.1 5.2% 4.7%

21
Expenditure trends and estimates (concluded)
Vote expenditure trends and estimates by programme and economic classification Programmes 1. Administration 2. Economic Statistics 3. Population and Social Statistics 4. Methodology and Statistical Infrastructure 5. Statistical Support and Informatics 6. Statistical Operations and Provincial Coordination 7. South African National Statistics System Vote expenditure trends and estimates by programme and economic classification
Programme
Audited outcome Adjusted
appropriation
Average growth
rate (%)
Average: Expen- diture/
total (%)
Medium-term expenditure estimate
Average growth
rate (%)
Average: Expen- diture/
total (%)
2016/17 2017/18 2018/19 2019/20 2016/17 - 2019/20
Special Adjusted
Appropriation 2020/21 2021/22 2022/23 2019/20 - 2022/23
Transfers and subsidies1 5.6 5.0 4.8 2.6 -22.4% 0.2% 0.5 4.6 0.5 -43.7% 0.1%
Departmental agencies and
accounts
0.0 0.0 0.0 0.0 -39.4% – 0.0 0.0 0.0 -20.6% –
Public corporations and private
enterprises
0.2 0.1 – – -100.0% – – – – – –
Non-profit institutions 0.3 0.2 – 0.1 -21.6% – 0.1 0.1 0.1 -0.7% –
Households 5.1 4.7 4.8 2.5 -21.5% 0.2% 0.4 4.5 0.3 -48.9% 0.1%
Payments for capital assets 220.2 289.3 270.8 370.6 19.0% 12.1% 314.2 315.1 316.6 -5.1% 9.8%
Buildings and other fixed structures 155.9 247.5 243.8 255.8 17.9% 9.5% 264.5 284.3 294.7 4.8% 8.2%
Machinery and equipment 61.6 29.9 23.0 80.7 9.4% 2.1% 39.5 30.1 21.3 -35.9% 1.3%
Software and other intangible assets 2.7 11.8 4.0 34.1 132.8% 0.6% 10.2 0.6 0.6 -73.5% 0.3%
Payments for financial assets 6.2 – 10.7 – -100.0% 0.2% – – – – –
Total 2 461.2 2 195.5 2 311.1 2 514.4 0.7% 100.0% 3 252.2 4 843.9 2 862.6 4.4% 100.0%

22
Transfers and subsidies expenditure trends and estimates
Vote transfers and subsidies trends and estimates
Audited outcome Adjusted
appropriation
Average growth
rate (%)
Average: Expen- diture/
total (%)
Medium-term expenditure estimate
Average growth
rate (%)
Average: Expen- diture/
total (%)
R thousand 2016/17 2017/18 2018/19 2019/20 2016/17 - 2019/20
Special Adjusted
Appropriation 2020/21 2021/22 2022/23 2019/20 - 2022/23
Departmental agencies and accounts Departmental agencies(non-business entities) Current 9 4 9 2 -39.4% 0.1% 1 1 1 -20.6% 0.1%
Communication 9 4 9 2 -39.4% 0.1% 1 1 1 -20.6% 0.1%
Households Social benefits Current 3 803 3 428 4 617 2 170 -17.1% 77.7% 208 4 060 130 -60.9% 79.9%
Employee social benefits 3 803 3 428 4 617 2 170 -17.1% 77.7% 208 4 060 130 -60.9% 79.9%
Households Other transfers to households Current 1 304 1 264 198 300 -38.7% 17.0% 180 418 199 -12.8% 13.3%
Employee social benefits – 522 17 – – 3.0% – – – – –
Claims against the state 46 7 – – -100.0% 0.3% – – – – –
Bursaries for non-employees 1 248 665 148 300 -37.8% 13.1% 180 190 199 -12.8% 10.6%
Employee ex-gratia payment 10 70 33 – -100.0% 0.6% – 228 – – 2.8%
Non-profit institutions Current 290 244 – 140 -21.6% 3.7% 137 137 137 -0.7% 6.7%
South African Statistical Association 90 44 – 130 13.0% 1.5% 127 127 127 -0.8% 6.2%
Population Association of Southern
Africa
200 200 – 10 -63.2% 2.3% 10 10 10 – 0.5%
Public corporations and private enterprises Other transfers to public corporations Current 20 85 – – -100.0% 0.6% – – – – –
Claims against the state 20 – – – -100.0% 0.1% – – – – –
Public corporation and private
enterprise
– 85 – – – 0.5% – – – – –
Public corporations and private enterprises Other transfers to private enterprises Current 165 – – – -100.0% 0.9% – – – – –
Public corporation and private
enterprise
135 – – – -100.0% 0.7% – – – – –
Other transfers 30 – – – -100.0% 0.2% – – – – –
Total 5 591 5 025 4 824 2 612 -22.4% 100.0% 526 4 616 467 -43.7% 100.0%

23
Departmental receipts
Departmental receipts by economic classification
Audited outcome Adjusted estimate
Revised estimate
Average growth
rate (%)
Average: Receipt
item/ total
(%) Medium-term receipts estimate
Average growth
rate (%)
Average: Receipt
item/ total
(%)
2016/17 2017/18 2018/19 2019/20 2016/17 -
2019/20
Special Adjusted
Appropriation 2020/21 2021/22 2022/23
2019/20 - 2022/23
Departmental receipts 8 580 2 046 3 473 1 524 1 524 -43.8% 100.0% 1 472 1 483 1 494 -0.7% 100.0% Sales of goods and services produced by department
826 1 118 799 819 819 -0.3% 22.8% 819 824 829 0.4% 55.1%
Sales by market
establishments
142 43 42 40 40 -34.4% 1.7% 38 38 38 -1.7% 2.6%
of which:
Parking 142 43 42 40 40 -34.4% 1.7% 38 38 38 -1.7% 2.6%
Other sales 684 1 075 757 779 779 4.4% 21.1% 781 786 791 0.5% 52.5%
of which:
Replacement of security cards 1 1 2 2 2 26.0% – 1 1 1 -20.6% 0.1%
Commission on insurance 646 707 744 776 776 6.3% 18.4% 780 785 790 0.6% 52.4%
Departmental publications 37 21 10 1 1 -70.0% 0.4% – – – -100.0% –
Cruise conference entrance
fees
– 346 – – – – 2.2% – – – – –
Sales of assets less than
R5000
– – 1 – – – – – – – – –
Sales of scrap, waste, arms and other used current goods
737 6 8 2 2 -86.1% 4.8% 3 4 5 35.7% 0.2%
of which:
Sale of wastepaper 737 6 8 2 2 -86.1% 4.8% 3 4 5 35.7% 0.2%
Interest, dividends and rent on land
110 100 215 76 76 -11.6% 3.2% 80 85 90 5.8% 5.5%
Interest 110 100 215 76 76 -11.6% 3.2% 80 85 90 5.8% 5.5%
Sales of capital assets 1 039 15 76 2 2 -87.6% 7.2% – – – -100.0% – Transactions in financial assets and liabilities
5 868 807 2 375 625 625 -52.6% 61.9% 570 570 570 -3.0% 39.1%
Total 8 580 2 046 3 473 1 524 1 524 -43.8% 100.0% 1 472 1 483 1 494 -0.7% 100.0%

24
Personnel information
Vote personnel numbers and cost by salary level and programme¹
Programmes
1. Administration
2. Economic Statistics
3. Population and Social Statistics
4. Methodology and Statistical Infrastructure
5. Statistical Support and Informatics
6. Statistical Operations and Provincial Coordination
7. South African National Statistics System
Number of posts estimated for
31 March 2020 Number and cost2 of personnel posts filled/planned for on funded establishment Number
Number of
funded posts
Number of posts
additional to the
establishment Actual Revised estimate Medium-term expenditure estimate
Average growth
rate (%)
Average: Salary
level/total (%)
2018/19 2019/20 2020/21 2021/22 2022/23 2019/20 - 2022/23
Statistics South Africa Number Cost Unit cost Number Cost
Unit cost Number Cost
Unit cost Number Cost
Unit cost Number Cost
Unit cost
Salary level 3 314 – 2 889 1 493.2 0.5 2 663 1 459.8 0.5 2 808 1 611.4 0.6 2 849 1 739.4 0.6 2 756 1 798.6 0.7 1.2% 100.0%
1 – 6 1 432 – 1 313 379.6 0.3 1 324 423.5 0.3 1 410 484.3 0.3 1 497 554.8 0.4 1 461 581.9 0.4 3.3% 51.4%
7 – 10 1 176 – 1 007 511.4 0.5 767 425.4 0.6 870 520.3 0.6 781 490.9 0.6 729 485.0 0.7 -1.7% 28.4%
11 – 12 456 – 367 335.1 0.9 365 339.7 0.9 318 312.4 1.0 361 381.6 1.1 357 401.7 1.1 -0.7% 12.6%
13 – 16 249 – 202 267.0 1.3 207 271.3 1.3 210 294.5 1.4 209 312.2 1.5 208 330.0 1.6 0.2% 7.5%
Other 1 – – – – – – – – – – 1 – – 1 – – – 0.0%
Programme 3 314 – 2 889 1 493.2 0.5 2 663 1 459.8 0.5 2 808 1 611.4 0.6 2 849 1 739.4 0.6 2 756 1 798.6 0.7 1.2% 100.0%
Programme 1 518 – 401 231.1 0.6 307 185.0 0.6 329 189.7 0.6 291 187.5 0.6 288 199.0 0.7 -2.1% 11.0%
Programme 2 563 – 509 230.3 0.5 489 243.2 0.5 483 257.9 0.5 544 300.8 0.6 530 315.4 0.6 2.7% 18.5%
Programme 3 200 – 164 134.8 0.8 154 109.8 0.7 144 106.6 0.7 150 119.6 0.8 145 125.2 0.9 -2.0% 5.4%
Programme 4 230 – 196 122.7 0.6 196 133.7 0.7 183 131.3 0.7 213 167.4 0.8 202 174.9 0.9 1.0% 7.2%
Programme 5 236 – 208 137.2 0.7 198 145.2 0.7 186 144.0 0.8 198 159.2 0.8 196 166.4 0.8 -0.3% 7.0%
Programme 6 1 535 – 1 390 617.3 0.4 1 303 624.2 0.5 1 457 748.9 0.5 1 427 769.9 0.5 1 370 782.3 0.6 1.7% 50.2%
Programme 7 32 – 21 19.8 0.9 16 18.8 1.2 26 32.9 1.3 26 35.1 1.3 25 35.4 1.4 16.0% 0.8%
1. Data has been provided by the department and may not necessarily reconcile with official government personnel data.
2. Rand million.

25
Selected performance indicators
Performance indicators by programme and related priority Indicator Programme MTSF priority Past Current Projections 2016/17 2017/18 2018/19 2019/20 2020/21 2021/22 2022/23 Number of releases on
GDP estimates per year
Economic Statistics
Priority 6: A
capable, ethical
and
developmental
state
4 4 4 4 4 4 4
Number of releases on
industry and trade statistics
per year
Economic Statistics 150 150 150 150 150 150 150
Number of releases on
financial statistics per year
Economic Statistics 17 17 17 17 17 17 17
Number of releases on the
price index per year
Economic Statistics 48 48 48 48 48 48 48
Number of releases on
labour market dynamics
per year
Population and
Social Statistics
Priority 6: A
capable, ethical
and
developmental
state
7 8 8 8 8 8 8
Number of releases on living
circumstances, service
delivery and poverty per year
Population and
Social Statistics
4 3 4 4 4 4 4
Number of releases on
the changing profile of the
population per year
Population and
Social Statistics
17 15 16 17 17 17 17


27

28
Annual Performance Plan

29
2. Annual performance plan
The annual performance plan sets out performance indicators, outputs and targets to achieve its strategic objectives and outcomes in line with
the strategic plan. The activities of the department are aligned to the strategic outcomes and objectives to ensure effective implementation. This
book outlines the plans for implementing the strategic outcomes.
Stats SA produces statistical products under two broad programmes, namely Economic Statistics, and Population and Social Statistics . These
programmes are supported by five programmes, namely (i) Methodology and Statistical Infrastructure; (ii) Statistical Support and Informatics;
(iii) Statistical Operations; (iv) South African National Statistics System; and (v) Administration. The official statistics produced by Stats SA are
based on data collected through censuses, surveys and administrative data sources. All official statistics are characterised by common statistical
principles and practices.
The statistical process involves a range of statistical operations, which are enabled by various support functions:
Impact: The social impact that the organisation aims to achieve has been defined as the development outcomes of the state in line with the
National Development Plan (NDP) and Medium Term Strategic Framework (MTSF), as well as achieving sustainable development for a better life
for all.
Outcomes: The outcomes we wish to achieve have been described in line with the purpose of official statistics in the Statistics Act, which is to
assist organs of state, businesses, other organisations and the public by providing statistics to inform planning, decision-making or other actions,
and monitoring or assessment of policies.
Outputs: The outputs have been defined at three levels, namely i) Level 1: The provision of basic statistics on various topics; ii) Level 2:
Transforming basic statistics into indicators, as part of an indicator system in order to be responsive to national and international policy agendas;
and iii) Level 3: The provision of integrated statistical information (products) using spatial analysis, integrative analysis and statistical tools to be
responsive to sectoral and cross-sectoral demands.
Process: In order to achieve these outputs, outcomes and impact, Stats SA has introduced ‘integration by design’ in the value chain. This approach
starts with the conceptual design of a survey with integration as the end in mind. It implies an information hierarchy that will deliver all three levels
of outputs. It implies the design of an integrated analytical database that will be available and accessible for any analysis and dissemination of
basic statistics, integrated indicators and integrated products.
Input: The inputs enable the statistics value chain. The legislative mandate has been added as the critical input that will guide the statistical
operations of the statistical system.
The Stats SA statistical value chain below illustrates the functioning of the organisation:

30

31
Organisational structure
Stats SA’s new organisational structure has been reviewed and will be implemented with effect from April 2020.

32
2.1 Programme: Administration
Purpose: Provides strategic leadership, management and support services to the department
Subprogrammes:
Departmental Management: provides strategic leadership and management services to the department including executive and project support
services; strategic management and organisational development services; and risk, anti-corruption and integrity management services.
Corporate Services: is responsible for providing a legal advisory service to the department and efficient facilities, security and logistical services.
Provides human resource management and development support services and promotes sound human management principles in line with the
Public Service Act and other applicable labour legislations.
Financial Management Services: provides financial, asset and procurement support services to the department; it promotes financial practices
for good governance and administration in line with the Public Finance Management Act (PFMA).
Internal Audit: provides an independent audit service to the department; it assists management in improving internal controls, risk management
and governance by providing independent risk-based assurance services, as well as advisory services as required by the Public Finance
Management Act.
Office Accommodation: provides a secure and healthy working environment for employees and stakeholders.
The following tables outline the outcomes, outputs, performance indicators and targets:

33
Table 1: Outcomes, outputs, performance indicators and targets
Audited/actual performance
Estimated
performance Medium-term targets
No. Outcome Output Output indicators 2016/17 2017/18 2018/19 2019/20 2020/21 2021/22 2022/23
Programme 1: Administration (Subprogramme: Executive and Project Support)
1. Agile operating
model
Report on
priority projects
supported for
Census 2021
Number of
priority projects
supported in
accordance
with Stats SA’s
project
management
framework
Provided
support to 7
projects
Provided
support to 5
projects
Provided
support to 6
projects
Provide
project
management
support to
Census 2021
mini-test
1 report on
support
provided to
Census 2021
pilot
compiled
1 report on
support
provided to
Census 2021
and PES
2021
compiled
1 report on
support
provided to
Census 2021
dissemination
compiled
Transformed
capability
Discussion
document on
enhancement of
management
information
repository
Research to
enhance
management
information
repository
conducted
Enhanced
management
information
repository
Enhanced
management
information
repository
Compiled
report on
consolidation of
management
information
repository
Investigate
additional
management
information
and
functionality
required
1 discussion
document on
required
functionalities
and utilising
other
platforms
compiled
50% required
functionali-
ties (Phase 1)
developed
50% required
functionalities
(Phase 2)
developed
Table 2: Indicators, annual and quarterly targets
Quarterly targets
No. Output indicator Annual target Quarter 1 Quarter 2 Quarter 3 Quarter 4
Programme 1: Administration (Subprogramme: Executive and Project Support)
1.1 Number of priority projects supported in
accordance with Stats SA’s project management
framework
1 report on support provided to Census 2021 pilot
compiled by March 2021
1
1.2 Research to enhance management information
repository conducted
1 discussion document on required functionalities
and utilising other platforms compiled by March
2021
1

34
Table 1: Outcomes, outputs, performance indicators and targets
Audited/actual performance
Estimated
performance Medium-term targets
No. Outcome Output Output indicators 2016/17 2017/18 2018/19 2019/20 2020/21 2021/22 2022/23
Programme 1: Administration: (Subprogramme: Strategy, Operations and Organisational Development)
2. Agile operating
model
Business
process
management
institutiona-lised
Business
processes
management
framework
developed
1 business
process
management
framework
developed
Transformed
capability
Transformation
and change
agenda
Transformation
and change
agenda
realigned
Developed
values and
diversity
programmes
An assessment
of talent
management
was not
conducted
Implemented
values and
diversity
management
programme
Compiled
transformation
programme
Evaluate the
impact of the
transformation
and change
agenda
1 transfor-
mation and
change
agenda
realigned to
the new
strategy
1 transfor-
mation and
change
agenda
implemented
1 transfor-
mation and
change
agenda
implemented
Table 2: Indicators, annual and quarterly targets
Quarterly targets
No. Output indicator Annual target Quarter 1 Quarter 2 Quarter 3 Quarter 4
Programme 1: Administration: (Subprogramme: Strategy, Operations and Organisational Development)
2.1 Business processes management framework
developed
1 business processes management framework
developed by December 2020
1
2.2 Transformation and change agenda realigned 1 transformation and change agenda realigned to
the new strategy by September 2020
1

35
Table 1: Outcomes, outputs, performance indicators and targets
Audited/actual performance
Estimated
performance Medium-term targets
No. Outcome Output Output indicators 2016/17 2017/18 2018/19 2019/20 2020/21 2021/22 2022/23
Programme 1: Administration (Subprogramme: Risk, Anti-corruption & Integrity Management)
3. Transformed
capability
Covid-19
measures and
controls
Covid-19
measures and
controls
implemented
1 report on
Covid-19
measures and
controls
implemented
1 report on
Covid-19
measures and
controls
implemented
Integration of
risk
management
information
system
Proposal on
integration of
risk
management
information
system
compiled
Reviewed
compliance
plan and
governance
programme
Compiled
report on
strengthening
risk
management
process
Compiled
assessment
report on
building a
resilient anti-
corruption
environment
Reports on
embedding
constitutional
values and
strengthening
the risk
management
culture were not
compiled
Evaluated the
fraud
prevention
strategy
A government
accountability
framework was
not
institutionalised
Evaluate
compliance
environment
1 proposal on
integration of
risk
management
information
system
1 integrated
risk
management
information
system
compiled
Report on risk,
anti-corruption
and integrity
management
for Census
2021 pilot
Risk, anti-
corruption and
integrity
management
support
provided to
Census 2021
pilot
1 risk, anti-
corruption
and integrity
management
support
provided to
Census 2021
pilot
compiled
1 risk, anti-
corruption
and integrity
management
support
provided to
Census 2021
compiled
1 risk, anti-
corruption
and integrity
management
support
provided to
Census 2021
compiled

36
Table 2: Indicators, annual and quarterly targets
Quarterly targets
No. Output indicator Annual target Quarter 1 Quarter 2 Quarter 3 Quarter 4
3.1 Covid-19 measures and controls implemented 1 report on Covid-19 measures and controls
implemented by March 2021
1
3.2 Risk, anti-corruption and integrity management
support provided to Census 2021 pilot
1 report on risk, anti-corruption and integrity
management for Census 2021 pilot compiled by
March 2021
1

37
Table 1: Outcomes, outputs, performance indicators and targets
Audited/actual performance
Estimated
performance Medium-term targets
No. Outcome Output Output indicators 2016/17 2017/18 2018/19 2019/20 2020/21 2021/22 2022/23
Programme 1: Administration (Subprogramme: Human Resource Management and Development)
4 Transformed
capability
Report on the
institutionalisati
on of talent
management
Talent
management
institutionalised
Developed
qualifications
matrix
Documents on
generic career
pathways and a
pool of talent
documents were
not compiled
A talent
management
document was
not compiled
Phase 1 of
succession
planning was
not
implemented
Phase 2 of
succession
planning for
critical skills was
not developed
Institutionalise
talent
management:
Drive the
implemen-
tation of a
succession
plan
1 skills
development
plan aligned
to the new
strategy
compiled
1 skills
development
plan aligned
to the new
strategy
implemented
1 report on
talent
management
compiled
1 skills
development
plan aligned
to the new
strategy
implemented
1 report on
talent
management
process
monitoring
compiled
Report on the
implementation
of the realigned
structure
Realigned
structure
implemented
Structure review
plan
implemented
1 realigned
structure
implemented
by March
2021
Report on
human resource
management
for Census
2021 pilot
Percentage of
human resource
management
support
provided to
Census 2021
pilot
Developing
HRM plan for
Census 2021
100% human
resource
support
provided to
Census 2021
pilot
100% human
resource
support
provided to
Census 2021
100% human
resource
support
provided to
Census 2021
Report on
employment
equity
Percentage
increase in
employment
equity
50% youth
contract staff
for Census
2021 pilot
appointed
50% youth
contract staff
for Census
2021
appointed
Report on
employment
equity
Percentage
increase in
employment
equity
2% of women
on SMS
increased
2% of women
on SMS
increased
2% of women
on SMS
increased
Report on
employment
equity
Percentage
increase in
employment
equity
0.2% of people
with disabilities
increased
0.2% of people
with disabilities
increased
0.2% of people
with disabilities
increased

38
Table 1: Outcomes, outputs, performance indicators and targets
Audited/actual performance
Estimated
performance Medium-term targets
No. Outcome Output Output indicators 2016/17 2017/18 2018/19 2019/20 2020/21 2021/22 2022/23
Programme 1: Administration (Subprogramme: Human Resource Management and Development)
e-Leave system HRM systems
computerised
Developed
specifications
for e-
recruitment
HRM systems
were not
developed
Implemented e-
recruitment
system
Implement
computerised
HRM systems
Implement
structure
review
1 leave
electronic
system
developed
1 leave
electronic
system
implemented
Gender-based
violence
programme
Gender-based
violence
programme
implemented
1 Gender-
based
violence
programme
implemented
1 Gender-
based
violence
programme
implemented
1 Gender-
based
violence
programme
implemented

39
Table 2: Indicators, annual and quarterly targets
Quarterly targets
No. Output indicator Annual target Quarter 1 Quarter 2 Quarter 3 Quarter 4
Programme 1: Administration (Subprogramme: Human Resource Management and Development)
4.1 Talent management institutionalised 1 skills development plan aligned to the new
strategy compiled by March 2021
1
4.2 Realigned structure implemented 1 realigned structure implemented by March 2021 1
4.3 Percentage of human resource management
support provided to Census 2021 pilot
100% human resource support provided to
Census 2021 pilot by March 2021
100%
4.4 Percentage increase in employment equity 50% youth contract staff for Census 2021 pilot
appointed by March 2021
50%
2% of women on SMS level increased by March
2021
2%
0.2% of people with disabilities increased by
March 2021
0.2%
4.5 Gender-based violence programme implemented 1 Gender-based violence programme
implemented by March 2021
1

40
Table 1: Outcomes, outputs, performance indicators and targets
Audited/actual performance
Estimated
performance Medium-term targets
No. Outcome Output Output indicators 2016/17 2017/18 2018/19 2019/20 2020/21 2021/22 2022/23
Programme 1: Administration (Subprogramme: Facilities, Transport and Security Management)
5. Transformed
capability
Fleet
management
strategy
Fleet
management
strategy
reviewed
Implemented
records
management
and registry
services
Rolled out
SHERQ and PPP
service level
agreement
programme
Reviewed fleet
management
policy
1 fleet
management
strategy
reviewed
1 fleet
management
strategy
implemented
1 fleet
management
strategy
monitored
Report on
logistics and
fleet
management
support to
Census 2021
pilot
Percentage of
logistics and
fleet
management
support
provided to
Census 2021
pilot
Develop
FMLS plan for
Census 2021
100%
logistics and
fleet
management
support
provided to
Census 2021
pilot
100%
logistics and
fleet
management
support
provided to
Census 2021
100%
logistics and
fleet
management
support
provided to
Census 2021
Table 2: Indicators, annual and quarterly targets
Quarterly targets
No. Output indicator Annual target Quarter 1 Quarter 2 Quarter 3 Quarter 4
Programme 1: Administration (Subprogramme: Facilities, Transport and Security Management)
5.1 Fleet management strategy reviewed 1 fleet management strategy reviewed by March
2021
1
5.2 Percentage of logistics and fleet management
support provided to Census 2021 pilot
100% logistics and fleet management support
provided to Census 2021 pilot by March 2021
100%

41
Table 1: Outcomes, outputs, performance indicators and targets
Audited/actual performance
Estimated
performance Medium-term targets
No. Outcome Output Output indicators 2016/17 2017/18 2018/19 2019/20 2020/21 2021/22 2022/23
Programme 1: Administration (Subprogramme: Financial Management)
6. Transformed
capability
Concept note
on a financial
management
funding model
Research on
financial
management
funding model
conducted
Implemented
asset disposal
strategy
Compiled
report on
support to CS
2016
An audit
progress
monitoring
system was not
developed
Conducted
research on
e-payroll
certification
Tested the
viability of
implementing a
digital filing
system
An audit
progress
monitoring
system was not
implemented
The drafting of
a financial
strategy for the
SANSS was
discontinued
Implemented
digital filing
system
Developed
standard
costing
procedures
Compiled
concept
document for
Commitments
and Accruals
Tool
E-payroll
system
certification
1 concept
note on a
financial
management
funding
model
compiled
1 research on
financial
management
funding
model
conducted
1 system for
financial
management
funding
model
developed
Report on
financial
management
for Census
2021 pilot
Percentage of
financial
management
provided to
Census 2021
pilot
Developed
Census 2021
fieldworker
payment and
SCM strategies
Develop
financial
administration
support plan
for Census
2021
100%
financial
management
support
provided to
Census 2021
pilot
100%
financial
management
support
provided to
Census 2021
100%
financial
management
support
provided to
Census 2021
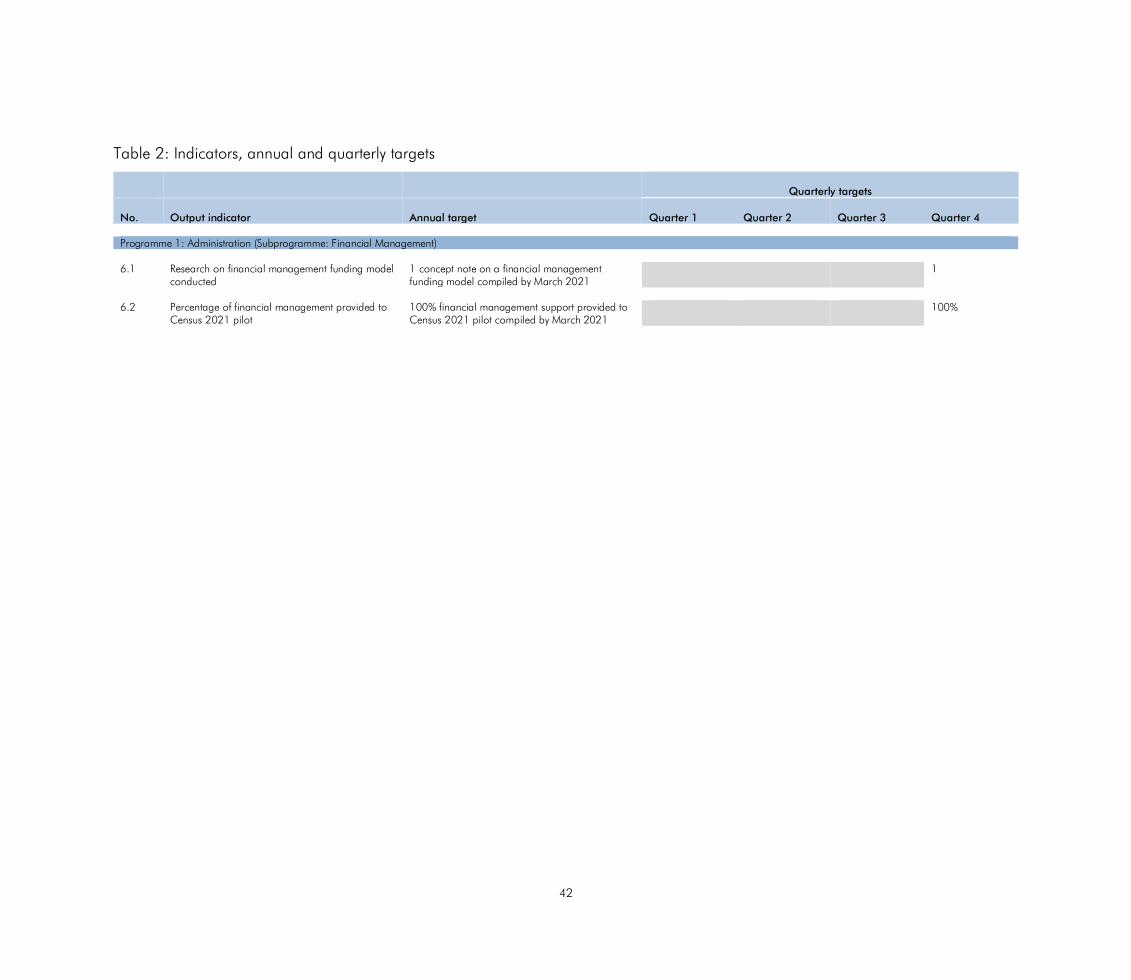
42
Table 2: Indicators, annual and quarterly targets
Quarterly targets
No. Output indicator Annual target Quarter 1 Quarter 2 Quarter 3 Quarter 4
Programme 1: Administration (Subprogramme: Financial Management)
6.1 Research on financial management funding model
conducted
1 concept note on a financial management
funding model compiled by March 2021
1
6.2 Percentage of financial management provided to
Census 2021 pilot
100% financial management support provided to
Census 2021 pilot compiled by March 2021
100%

43
Table 1: Outcomes, outputs, performance indicators and targets
Audited/actual performance
Estimated
performance Medium-term targets
No. Outcome Output Output indicators 2016/17 2017/18 2018/19 2019/20 2020/21 2021/22 2022/23
Programme 1: Administration (Subprogramme: Internal Audit)
7. Agile operating
model
Research report
on
developments in
the internal
audit processes
Research on
developments in
the internal
audit processes
conducted
Developed
frameworks for
quality
assurance and
combined
assurance
A report on
external quality
assurance was
not compiled
The conducting
of quality
assurance
according to IIA
standards and
framework was
not completed
Compiled
reports on
implementation
of combined
assurance and
implementation
of quality
assurance
review results
Develop an
internal audit
plan for
Census 2021
Coordinate
combined
assurance
model
1 research
report on
developments
in internal
audit
processes
compiled
1 research
report on
development
s in internal
audit
processes
compiled
1 updated
internal audit
processes
reviewed and
documented
Transformed
capability
Internal audit
report on
Census 2021
pilot
Internal audit
support to
Census 2021
pilot
1 audit report
on Census
2021 pilot
compiled
1 audit report
on main
Census 2021
and PES
compiled
1 audit report
on main
Census 2021
compiled
Table 2: Indicators, annual and quarterly targets
Quarterly targets
No. Output indicator Annual target Quarter 1 Quarter 2 Quarter 3 Quarter 4
Programme 1: Administration (Subprogramme: Internal Audit)
7.1 Research on developments in the internal audit
processes conducted
1 research report on developments in internal
audit processes compiled by March 2021
1
7.2 Internal audit support to Census 2021 pilot 1 audit report on Census 2021 pilot compiled by
March 2021
1

44
Programme 1: Explanation on planned performance
The strategic intention of the programme is focused on driving the outcome of transformed capability. The programme will align itself to the
strategy of digitalisation through automation of processes. The provision of support to projects, including the Census 2021 project, will be utilising
all facets of automated processes. A cost-effective strategy to reduce the major cost driver in surveys which, apart from compensation of employees
is the utilisation of vehicles, will be explored.
Talent management, albeit within a restricted fiscal environment, will form the basis of career path development including succession planning,
reskilling of employees and multipronged programmes to ensure that critical skills are retained.
A transformation and change agenda will be compiled to facilitate and drive the culture and organisational change required to implement the
new strategic direction. The implementation of the revised structure and relocation of staff to critical areas will be rolled out in 2020/21.
The branch will also pursue research on alternative funding models.
Resource allocation
The primary cost driver is expenditure on compensation of employees. Within the remaining goods and services budget, the primary cost drivers
relate to fleet management services, travel and subsistence, and communications. Office accommodation is funded from Programme 1.

45
Expenditure trends and estimates
Administration expenditure trends and estimates by subprogramme and economic classification Subprogramme
Audited outcome Adjusted
appropriation
Average growth
rate (%)
Average: Expen- diture/
total (%)
Medium-term expenditure estimate
Average growth
rate (%)
Average: Expen- diture/
total (%)
R million 2016/17 2017/18 2018/19 2019/20 2016/17 - 2019/20
Special Adjusted
Appropriation 2020/21 2021/22 2022/23 2019/20 - 2022/23
Departmental Management 60.0 69.5 62.5 66.5 3.5% 9.5% 62.6 68.6 74.3 3.8% 9.8%
Corporate Services 146.0 136.5 125.0 122.2 -5.8% 19.6% 124.8 119.0 130.5 2.2% 18.0%
Financial Administration 74.4 76.4 82.6 63.3 -5.2% 11.0% 61.2 70.0 76.0 6.3% 9.8%
Internal Audit 12.8 14.3 14.4 12.7 -0.4% 2.0% 12.0 13.3 14.3 4.0% 1.9%
Office Accommodation 355.1 389.3 430.5 394.9 3.6% 57.9% 402.6 422.9 458.7 5.1% 60.6%
Total 648.3 686.0 714.9 659.5 0.6% 100.0% 663.3 693.8 753.7 4.6% 100.0%
Economic classification
Current payments 479.5 427.0 469.2 401.2 -5.8% 65.6% 397.6 408.3 457.8 4.5% 60.1%
Compensation of employees 216.0 223.3 231.1 185.0 -5.0% 31.6% 189.8 187.7 199.4 2.5% 27.5%
Goods and services1
263.5 203.3 238.1 216.1 -6.4% 34.0% 207.8 220.7 258.4 6.1% 32.6%
of which:
Audit costs: External 5.6 7.0 6.2 7.6 10.6% 1.0% 8.6 8.4 9.6 8.1% 1.2%
Fleet services (including government
motor transport)
2.7 2.2 3.1 5.4 25.7% 0.5% 7.6 7.7 9.3 19.8% 1.1%
Operating leases 128.0 101.3 151.5 104.8 -6.4% 17.9% 102.9 103.3 120.5 4.8% 15.6%
Property payments 58.6 36.9 41.0 39.5 -12.3% 6.5% 38.6 38.9 47.2 6.1% 5.9%
Travel and subsistence 19.1 15.1 9.0 17.3 -3.3% 2.2% 9.3 14.1 16.0 -2.6% 2.0%
Training and development 2.3 4.2 1.1 6.1 38.9% 0.5% 1.9 8.0 9.5 16.0% 1.0% Transfers and subsidies1 1.8 1.6 1.2 0.8 -24.1% 0.2% 0.3 0.3 0.3 -25.4% 0.1%
Public corporations and private
enterprises
Non-profit institutions
Households
Payments for capital assets 167.0 257.3 244.5 257.6 15.5% 34.2% 265.3 285.2 295.6 4.7% 39.8%
Buildings and other fixed structures 155.9 247.5 243.8 255.8 17.9% 33.3% 264.5 284.3 294.7 4.8% 39.7%
Machinery and equipment 11.1 9.4 0.7 1.8 -45.2% 0.9% 0.9 0.8 0.9 -20.7% 0.2%
Software and other intangible assets – 0.4 – – – – – – – – –
Total 648.3 686.0 714.9 659.5 0.6% 100.0% 663.3 693.8 753.7 4.6% 100.0%
Details of transfers and subsidies
Households Social benefits Current 0.0 0.0 1.0 0.2 115.8% – – – – -100.0% –
Employee social benefits 0.0 0.0 1.0 0.2 115.8% – – – – -100.0% –
Households
Other transfers to households
Current 1.2 0.7 0.1 0.3 -37.8% 0.1% 0.2 0.2 0.2 -12.8% –
Bursaries for non-employees 1.2 0.7 0.1 0.3 -37.8% 0.1% 0.2 0.2 0.2 -12.8% –
1. Estimates of National Expenditure data tables can be downloaded from www.treasury.gov.za. These tables contain detailed information by goods and services, and transfers and subsidies items
by programme.

46
Personnel information
Administration personnel numbers and cost by salary level¹
Number of posts estimated for
31 March 2020 Number and cost2 of personnel posts filled/planned for on funded establishment Number
Number of
funded posts
Number of posts
additional to the
establishment Actual Revised estimate Medium-term expenditure estimate
Average growth
rate (%)
Average: Salary
level/total (%)
2018/19 2019/20 2020/21 2021/22 2022/23 2019/20 - 2022/23
Administration Number Cost Unit cost Number Cost
Unit cost Number Cost
Unit cost Number Cost
Unit cost Number Cost
Unit cost
Salary level 518 – 401 231.1 0.6 307 185.0 0.6 329 189.7 0.6 291 187.5 0.6 288 199.0 0.7 -2.1% 100.0% 1 – 6 155 – 96 26.9 0.3 150 39.4 0.3 171 48.0 0.3 156 47.3 0.3 153 49.8 0.3 0.7% 51.9%
7 – 10 248 – 215 112.5 0.5 60 35.5 0.6 76 42.7 0.6 53 34.6 0.7 53 37.0 0.7 -4.1% 19.9%
11 – 12 67 – 48 40.9 0.9 57 55.5 1.0 52 54.5 1.0 52 58.0 1.1 52 61.7 1.2 -3.0% 17.5%
13 – 16 48 – 42 50.9 1.2 40 54.6 1.4 30 44.6 1.5 30 47.5 1.6 30 50.6 1.7 -9.1% 10.7%
1. Data has been provided by the department and may not necessarily reconcile with official government personnel data.
2. Rand million.
Key risks and mitigation
The following risks have been identified that could impact on the operations of the programme:
Strategic risks Mitigation strategy
Lack of resources to fund the new strategic direction
Reprioritisation and realignment of resources to new strategy
Implementation of the realigned structure and impact on staff Roll out a change management programme for the implementation of the
new structure
Financial constraints, both human and operational
Funding model alternatives to be considered
Loss of critical skills due to resignations, retirement that cannot be replaced
due to funding constraints
Talent management strategy to be implemented

47
2.2 Programme: Economic Statistics
Purpose: Produces economic statistics to inform evidence-based economic development
Subprogrammes:
Business Cycle Indicators: provides information on turnover and volumes in various industries in the economy through the publication of
monthly, quarterly and annual statistical releases covering: Mining and quarrying; Manufacturing; Electricity, gas and water; Construction; Trade;
and Transport.
Structural Industry Statistics: provides periodic information on the income and expenditure structure of industries by publishing periodic
statistical information. The periodic large sample surveys focus on collecting information relating to the structure of different industries.
Price Statistics: provides information on the level of inflation by producing the consumer price index and various producer price indices; thus
measuring changes in the prices of a basket of goods and services purchased by South African households and prices of a basket of commodities
at producer level each month.
Private Sector Financial Statistics: tracks the financial performance of private sector organisations. Financial performance and the financial
position of private sector and public sector enterprises are provided through a series of quarterly and annual publications, focusing on selected
industries.
Government Financial Statistics: tracks public sector spending. The income and expenditure information of government is provided through
a series of publications focusing on all levels of government. It also details financial and non-financial statistics of municipalities (quarterly and
annually).
National Accounts: produces GDP data and other integrative statistical products; provides information on dynamics of the economy, which are
reported through quarterly and annual estimates of national accounts, based on a series of supply and use tables.

48
Table 1: Outcomes, outputs, performance indicators and targets
Audited/actual performance
Estimated
performance Medium-term targets
No. Outcome Output Output indicators 2016/17 2017/18 2018/19 2019/20 2020/21 2021/22 2022/23
Programme 2: Economic Statistics (Subprogramme: Business Cycle Indicators)
8. Insightful data Statistical
information on
business cycle
indicators
Number of
releases on
business cycle
indicators
published
Published
monthly,
quarterly and
annual industry
and trade
statistics
Published
monthly,
quarterly and
annual industry
and trade
statistics
Published
monthly,
quarterly and
annual industry
and trade
Publish
monthly,
quarterly and
annual
industry and
trade statistics
150 monthly,
quarterly and
annual
industry and
trade statistics
published
150 monthly,
quarterly and
annual
industry and
trade statistics
published
150 monthly,
quarterly and
annual
industry and
trade statistics
published
Reports on
short-term
industry
statistics
Reports on
improving
short-term
industry
statistics
compiled
Implemented
weights for
manufacturing
and
manufacturing
production
capacity; base
year changes;
seasonal
adjustments
earlier; and
calculated
weights for
deflators
Completed
seasonal
adjustment for
land transport
and
implemented
weights for
indices
The research
report on retail
products and
imputing size
group 4 was
not compiled
Compiled
weights for
manufacturing
production
capacity,
mining and
manufacturing
Weights for
indices
Manufacturing
[2017];
Mining
[2017];
Manufacturing
production
capacity
[2017])
Base year
changes for
deflation:
Wholesale
(2015); Tourist
accommo-
dation (2016);
Retail (2016);
Weights for
deflator (Retail
[2015])
1 report on
weights for
manufacturing
(2018)
updated
1 research
report on
deflators for
Motor trade
sales compiled
1 research
report on
seasonal
adjusted data
at a lower
level for Retail
trade sales
compiled
3 reports on
weights for:
Mining
(2019);
Manufacturing
(2019) and
Manufacturing
production
capacity
(2019)
updated
1 research
report on
deflator for
Motor trade
sales piloted
1 research
report on
seasonal
adjusted data
at a lower
level for Retail
trade sales
published
3 reports on
weights for:
Mining (2020);
Manufacturing
(2020) and
Manufacturing
production
capacity
(2020) and
Retail (SIS-
2018) updated
1 report on
base year from
2015 to 2020
for affected
surveys
updated
1 report on
deflator for
Motor trade
sales
implemented
1 publication
on of seasonal
adjusted data
at a lower
level for Motor
trade sales
piloted

49
Table 2: Indicators, annual and quarterly targets
Quarterly targets
No. Output indicator Annual target Quarter 1 Quarter 2 Quarter 3 Quarter 4
Programme 2: Economic Statistics (Subprogramme: Business Cycle Indicators)
8.1 Number of releases on mining: production and
sales published, within two months after the
reference month
12 monthly releases on mining: production and
sales published as scheduled
3 3 3 3
8.2 Number of releases on manufacturing: production
and sales published, within two months after the
reference month
12 monthly releases on manufacturing: production
and sales published as scheduled
3 3 3 3
8.3 Number of releases on manufacturing: utilisation
of production capacity by large enterprises
published, within one quarter after the reference
month
4 quarterly releases on manufacturing: utilisation
of production capacity by large enterprises
published as scheduled
1 1 1 1
8.4 Number of releases on electricity generated and
available for distribution published, within two
months after the reference month
12 monthly releases on electricity generated and
available for distribution published as scheduled
3 3 3 3
8.5 Number of releases on selected building statistics
of the private sector as reported by local
government institutions published, within two
months after the reference month
12 monthly releases on selected building statistics
of the private sector as reported by local
government institutions published as scheduled
3 3 3 3
8.6 Number of releases on selected building statistics
published, 6 months after year-end report
1 annual release for 2019 on selected building
plans passed and completed published by June
2020
1
8.7 Number of reports on building statistics published,
within two years after year-end report
1 annual report for 2018 on building statistics
published by August 2020
1
8.8 Number of releases on retail trade sales
published, within two months after the reference
month
12 monthly releases on retail trade sales published
as scheduled
3 3 3 3
8.9 Number of releases on motor trade sales
published, within two months after the reference
month
12 monthly releases on motor trade sales
published as scheduled
3 3 3 3
8.10 Number of releases on wholesale trade sales
published, within two months after the reference
month
12 monthly releases on wholesale trade sales
published as scheduled
3 3 3 3
8.11 Number of releases on land transport published,
within two months after the reference month 12 monthly releases on land transport published
as scheduled
3 3 3 3
8.12 Number of releases on liquidations and
insolvencies published, within two months after the
reference month
12 monthly releases on liquidations and
insolvencies published as scheduled
3 3 3 3

50
Table 2: Indicators, annual and quarterly targets
Quarterly targets
No. Output indicator Annual target Quarter 1 Quarter 2 Quarter 3 Quarter 4
Programme 2: Economic Statistics (Subprogramme: Business Cycle Indicators)
8.13 Number of releases on civil cases for debt
published, within two months after the reference
month
12 monthly releases on civil cases for debt
published as scheduled
3 3 3 3
8.14 Number of releases on food and beverages
published, within two months after the reference
month
12 monthly releases on food and beverages
published as scheduled
3 3 3 3
8.15 Number of releases on tourist accommodation
published, within two months after the reference
month
12 monthly releases on tourist accommodation
published as scheduled
3 3 3 3
8.16 Reports on improving short-term industry statistics
compiled 1 report on weights for indices manufacturing
updated by June 2020
1
1 research report on deflators for motor trade
sales compiled by March 2021
1
1 research report on seasonal adjusted data at a
lower level for Retail trade sales compiled by
March 2021
1

51
Table 1: Outcomes, outputs, performance indicators and targets
Audited/actual performance
Estimated
performance Medium-term targets
No. Outcome Output Output indicators 2016/17 2017/18 2018/19 2019/20 2020/21 2021/22 2022/23
Programme 2: Economic Statistics (Subprogramme: Structural Industry Statistics)
9. Insightful data Statistical
information on
the structure of
industries
Number of
periodic reports
on trade
industry
published
Published
periodic reports
on 2015 mining
industry survey;
2014
manufacturing
industry survey;
and 2014
construction
industry survey
Published
periodic reports
on 2015
wholesale trade
survey; 2015
retail trade
industry survey,
2015 motor
trade survey,
2015 food and
beverages
survey and,
2015 tourist
accommodation
survey
Published
periodic industry
reports on 2016
electricity, gas
and water supply
survey; 2016
transport and
storage survey;
2016 post and
telecommunica-
tions survey; and
2016 business
services survey
Publish periodic
industry reports:
2017
manufacturing
survey
2017
construction
survey
5 reports on
2018 trade
industry
published:
(wholesale
trade; retail
trade; motor
trade; food
and
beverages;
and tourist
accommo-
dation)
1 report on
2018
personal
services
published
5 reports on
2019 trade
industry
published:
(mining
2019,
transport post
and
telecommuni-
cations 2019,
electricity, gas
& water)
2 reports on
2020 trade
industry
published:
(business
services 2020
&
construction)
Statistical
information on
commercial
agriculture,
forestry and
fisheries industry
Number of
annual releases
on agriculture,
forestry and
fisheries industry
published
Published report
on 2015
agriculture
survey
Compiled
discussion
documents on
forestry and
fisheries
industries
Published report
on 2016
agriculture
survey
Published report
on 2017
agriculture
survey
Publish report
on 2017
Census of
Commercial
Agriculture
Publish
reports on
forestry and
fishery
statistics
1 annual
release on
agriculture,
fisheries and
forestry
statistics
published
1 annual
release on
agriculture,
fisheries and
forestry
statistics
published

52
Table 2: Indicators, annual and quarterly targets
Quarterly targets
No. Output indicator Annual target Quarter 1 Quarter 2 Quarter 3 Quarter 4
Programme 2: Economic Statistics (Subprogramme: Structural Industry Statistics)
9.1 Number of periodic reports on trade industry
published
5 reports on 2018 trade industry (wholesale,
retail, motor trade, accommodation and food and
beverages) published by September 2020
5
9.2 Number of periodic reports on personal services
industry published
1 report on 2018 personal services industry
published by September 2020
1

53
Table 1: Outcomes, outputs, performance indicators and targets
Audited/actual performance
Estimated
performance Medium-term targets
No. Outcome Output Output indicators 2016/17 2017/18 2018/19 2019/20 2020/21 2021/22 2022/23
Programme 2: Economic Statistics (Subprogramme: Price Statistics)
10. Insightful data Statistical
information on
CPI
Number of CPI
releases
published
Published
monthly CPI
Published
monthly CPI
Published
monthly CPI
Publish
monthly CPI
12 monthly
CPI releases
published
12 monthly
CPI releases
published
12 monthly
CPI releases
published
Statistical
information on
PPI
Number of PPI
releases
published
Published
monthly PPI
Published
monthly PPI
Published
monthly PPI
Publish
statistics on
producer
prices
12 monthly
PPI releases
published
12 monthly
PPI releases
published
12 monthly
PPI releases
published
Statistical
information on
CMPI
Number of
CMPI releases
published
Published
monthly CMPI
Published
monthly CMPI
Published
monthly CMPI
Publish
statistics on
construction
prices
12 monthly
CMPI
releases
published
12 monthly
CMPI
releases
published
12 monthly
CMPI
releases
published
Statistical
information on
XMUVI
Number of
XMUVI releases
published
Published
monthly XMUVI
Published
monthly XMUVI
Published
monthly XMUVI
Publish
statistics on
producer
Export and
import unit
value indices
12 monthly
XMUVI
releases
published
12 monthly
XMUVI
releases
published
12 monthly
XMUVI
releases
published
Reweighted PPI PPI with
updated weights
published
Research on
residential
property price
index was not
conducted
Research on
transport,
storage and
communication
services was not
conducted
Compiled
research report
on services PPI
Compiled
research report
on transport,
storage and
communication
services
Compiled
research report
on transport,
storage and
communication
services
Test transport,
storage and
communi-
cation
services
1 PPI with
updated
weights and
product list
published

54
Table 2: Indicators, annual and quarterly targets
Quarterly targets
No. Output indicator Annual target Quarter 1 Quarter 2 Quarter 3 Quarter 4
Programme 2: Economic Statistics (Subprogramme: Price Statistics)
10.1 Number of CPI releases published within one
month of the reference period
12 monthly CPI releases published as scheduled 3 3 3 3
10.2 Number of PPI releases published (monthly PPI)
within one month of the reference period
12 monthly PPI releases published as scheduled 3 3 3 3
10.3 Number of CMPI releases published (monthly
CMPI) within one month of the reference period
12 monthly CMPI releases published as scheduled 3 3 3 3
10.4 Number of XMUVI releases published (monthly
XMUVI) within one month of the reference period
12 monthly XMUVI releases published as
scheduled
3 3 3 3
10.5 PPI with updated weights published
1 PPI with updated weights published by March
2021
1

55
Table 1: Outcomes, outputs, performance indicators and targets
Audited/actual performance
Estimated
performance Medium-term targets
No. Outcome Output Output indicators 2016/17 2017/18 2018/19 2019/20 2020/21 2021/22 2022/23
Programme 2: Economic Statistics (Subprogramme: Private Financial Statistics)
11. Insightful data Statistical
information on
financial
statistics of
private sector
enterprises
Number of
releases on
financial
statistics of the
private sector
published
Published
quarterly and
annual private
sector financial
statistics
Published
quarterly and
annual private
sector financial
statistics
Published
quarterly and
annual private
sector financial
statistics
Publish
quarterly and
annual
private sector
financial
statistics
3 quarterly
and 1 annual
releases on
private sector
financial
statistics
published
5 quarterly
and 1 annual
releases on
private sector
financial
statistics
published
4 quarterly
and 1 annual
releases on
private sector
financial
statistics
published
Discussion
document on
capital
expenditure
Discussion
document on
the capital
expenditure
survey compiled
Compiled
reports on
proposed
capital
expenditure
survey and
engaging
stakeholders in
research
initiatives
Compiled
reports on
detailed capital
expenditure
data and
stakeholder
engagement
Compiled
report on
integrating data
on capital
expenditure
Compiled
report on
stakeholder
engagement
Discussion
document on
quarterly
estimates of
capital
expenditure in
the private
sector
Stakeholders
engaged to
promote
private sector
financial
surveys
1 discussion
document on
the quarterly
capital
expenditure
compiled
1 capital
expenditure
survey
discussion
document
published
1 capital
expenditure
survey
discussion
document
published

56
Table 2: Indicators, annual and quarterly targets
Quarterly targets
No. Output indicator Annual target Quarter 1 Quarter 2 Quarter 3 Quarter 4
Programme 2: Economic Statistics (Subprogramme: Private Financial Statistics)
11.1 Number of annual releases on financial statistics
of the private sector published
1 annual release on financial statistics 2019
published by December 2020
1
11.2 Number and timeliness of quarterly releases on
financial statistics of private sector enterprises
published with a four month lag
3 quarterly releases on financial statistics of private
sector enterprises published as scheduled
1 1 1
11.3 Discussion document on the capital expenditure
compiled
1 discussion document on the quarterly capital
expenditure compiled by March 2021
1

57
Table 1: Outcomes, outputs, performance indicators and targets
Audited/actual performance
Estimated
performance Medium-term targets
No. Outcome Output Output indicators 2016/17 2017/18 2018/19 2019/20 2020/21 2021/22 2022/23
Programme 2: Economic Statistics (Subprogramme: Government Financial Statistics)
12. Insightful data Statistical
information on
general
government
expenditure
Number of
releases on
government
financial
statistics
published
Published
quarterly and
annual
government
financial
statistics
Published
quarterly and
annual
government
financial
statistics
Published
quarterly and
annual
government
financial
statistics
Publish
quarterly and
annual
government
financial
statistics
7 annual
releases on
government
financial
statistics
published
7 annual
releases on
government
financial
statistics
published
7 annual
releases on
government
financial
statistics
published
Statistical
information on
financial
statistics of
municipalities
Number of
releases on the
financial
statistics of
municipalities
published
Published
quarterly
releases on
financial
statistics of
municipalities
Published
quarterly
releases on
financial
statistics of
municipalities
Published
quarterly
releases on
financial
statistics of
municipalities
Publish
quarterly
releases on
financial
statistics of
municipalities
3 releases on
financial
statistics of
municipalities
published
4 releases on
financial
statistics of
municipalities
published
4 releases on
financial
statistics of
municipalities
published
Statistical
information on
non-financial
statistics of
municipalities
Number of
releases on the
non-financial
census of
municipalities
published
Published
annual release
on the non-
financial census
of municipalities
Published
annual release
on the non-
financial census
of municipalities
Published
annual release
on the non-
financial census
of municipalities
Publish
annual
release on the
non-financial
census of
municipalities
1 release on
the non-
financial
census of
municipalities
published
1 release on
the non-
financial
census of
municipalities
published
Research report
on time series
data for LGI
Research on
time series data
for LGI
conducted
Completed the
QFSM pilot
Compiled
report on
collaboration
and partnering
Compiled
report on time
series data for
GFS
1 research
report on time
series data for
LGI compiled
1 research
report on time
series data for
LGI compiled
1 time series
data for LGI
published

58
Table 2: Indicators, annual and quarterly targets
Quarterly targets
No. Output indicator Annual target Quarter 1 Quarter 2 Quarter 3 Quarter 4
Programme 2: Economic Statistics (Subprogramme: Government Financial Statistics)
12.1 Number of releases on government financial
statistics published
1 annual release on the financial statistics of
national government with audited data published
by June 2020
1
1 annual release on the financial census of
municipalities published by June 2020
1
1 annual release on the capital expenditure of the
public sector published by October 2020
1
1 annual release on the financial statistics of extra-
budgetary accounts and funds with audited data
published by August 2020
1
1 annual release on the financial statistics of
provincial government with audited data published
by September 2020
1
1 annual release on the financial statistics of
higher education institutions with audited data
published by December 2020
1
1 annual release on the financial statistics of
consolidated general government with audited
data published by December 2020
1
12.2 Number of releases on financial statistics of
municipalities published with a four month lag
3 quarterly releases on financial statistics of
municipalities published
1 1 1
12.3 Number of releases on the non-financial census of
municipalities published
1 annual release on non-financial census of
municipalities published by March 2021
1
12.4 Research on time series data for LGI surveys
conducted
1 research report on time series data for LGI
surveys compiled by March 2021
1

59
Table 1: Outcomes, outputs, performance indicators and targets
Audited/actual performance
Estimated
performance Medium-term targets
No. Outcome Output Output indicators 2016/17 2017/18 2018/19 2019/20 2020/21 2021/22 2022/23
Programme 2: Economic Statistics (Subprogramme: National Accounts)
13. Insightful data Statistical
information on
GDP
Number of
GDP releases
published
Published GDP
releases
Compiled
supply and use
tables
Published GDP
releases
Compiled
supply and use
tables
Published GDP
releases
Compiled
supply and use
tables
Publish
quarterly,
annual and
regional
national
accounts
statistics
Conduct an
evaluation of
GDP
expenditure
estimates
4 quarterly
releases on
GDP
published
4 quarterly
releases on
GDP
published
4 quarterly
releases on
GDP
published
Research report
on national
accounts
Research to
improve the
existing statistics
conducted
Compiled
position papers
on research and
development
satellite
account,
integrated
economic
accounts and
reviewing and
improving data
sources
Compiled 2
research reports
on factors
affecting the
economy
Conducted
research on
reviewing and
improving data
sources
Developed
research plan
for
benchmarking
Conducted
research on
reviewing and
improving data
sources
Rebase and
benchmark
national
accounts
statistics
Review and
improve data
sources
1 research
report on
reviewing and
improving
data sources
compiled
1 research
report on
reviewing and
improving
data sources
compiled
1 research
report on
reviewing and
improving
data sources
compiled
Statistical
information on
Tourism satellite
accounts
Number of
reports on
tourism satellite
accounts
published
Compiled
discussion
document on
statistics of the
non-profit
sector, tourism
satellite
accounts and
input/output
tables
Published report
on tourism
satellite
accounts and
quarterly flash
GDP estimates
A report on the
social
accounting
matrix was not
compiled
Published
tourism satellite
accounts
Report on
tourism
satellite
accounts
1 report on
tourism
satellite
accounts
published
1 report on
tourism
satellite
accounts
published
1 report on
tourism
satellite
accounts
published
Statistical
information on
EEA
EEA Statistics
published
Compiled
compendium
on EEA
indicators
Research
complementary
data sources
1 report on
EEA statistics
published
1 report on
EEA statistics
published
1 report on
EEA statistics
published

60
Table 1: Outcomes, outputs, performance indicators and targets (concluded)
Audited/actual performance
Estimated
performance Medium-term targets
No. Outcome Output Output indicators 2016/17 2017/18 2018/19 2019/20 2020/21 2021/22 2022/23
Programme 2: Economic Statistics (Subprogramme: National Accounts)
13. Insightful data Statistical
information on
Economic-
environmental
accounts
Natural Capital
Accounting and
Valuation of
Ecosystem
Services project
published
Compiled
report on
coordination of
the Natural
Capital
Accounting and
Valuation of
Ecosystem
Services project
in SA
Project
document on
coordinating
the European
Union-funded
project on
Natural
Capital
Accounting
and Valuation
of Ecosystem
Services
1 report on
Natural
Capital
Accounting
and Valuation
of Ecosystem
Services
results
published
1 research
report on
ways to
present the
EEA statistics
published
1 research
report on
ways to
present the
EEA statistics
published
Table 2: Indicators, annual and quarterly targets
Quarterly targets
No. Output indicator Annual target Quarter 1 Quarter 2 Quarter 3 Quarter 4
Programme 2: Economic Statistics (Subprogramme: National Accounts)
13.1 Number of GDP releases published 4 quarterly releases on GDP published as
scheduled
1 1 1 1
13.2 Research to improve the existing statistics
conducted
1 research report on reviewing and improving
data sources compiled by March 2021
1
13.3 Number of reports on tourism satellite accounts
published
1 report on tourism satellite accounts published by
March 2021
1
13.4 Number of reports on EEA statistics published 1 report on EEA statistics published by March
2021
1
13.5 Natural Capital Accounting and Valuation of
Ecosystem Services project published
1 report on Natural Capital Accounting and
Valuation of Ecosystem Services project results
published by March 2021
1

61
Programme 2: Explanation on planned performance
The strategic intention of the programme is focused on driving the outcome of providing insightful data. To this extent, it will continue to provide
a range of statistics that describe the dynamics of the economy as well as its links to job creation, economic growth, the environment and society.
These statistics will adhere to the requirements of official statistics in respect of following relevant international frameworks, classifications,
standards and good practice. The revision of the industry classification system is a multiphased project that was halted, and the resumption
thereof will have severe operational and financial implications for the organisation.
The existing surveys vary in terms of their scope, coverage and frequency. It includes various monthly, quarterly, annual and periodic sample
surveys, based on a statistical business register. Where relevant, administrative data is used to compile the statistics. Each of these statistical series
has various local and international users ranging from government departments, the private sector, academia as well as non-governmental
institutions. In addition, these series serve to inform the development of estimates of the gross domestic product. The intention is for the outputs
of the branch to respond to the economic indicators as outlined in the integrated indicator framework, through which it will contribute to the
monitoring of the country’s National Development Plan, the Sustainable Development Goals as well as Agenda 2063 at continental level.
A key strategic intent is to increase the supply of economic statistics through the development of new surveys, funded through efficiency gains
within the current resource constraints. These will primarily be focused on developing a better understanding of the services sector of the economy.
The branch is considering different approaches to ensure that the business operating model becomes more agile. This will be done through an
increase in the use of technology during the data collection phase of the statistical value chain to improve efficiency. Further research will be
conducted to assess the use of administrative data to both supplement existing surveys and serve as a source of data for new indicators.
The outputs of the branch do not take place in isolation but depend on other actors within the data ecosystem. The interconnected statistical
systems objective of Stats SA is relevant for the branch as it is dependent on data from partners in the data ecosystem for many of its outputs.
These partnerships will be deepened, and new partners will be engaged. The intention is to reduce the costs of the current operating model as
well as to broaden the scope of available data.
The branch aims to ensure that the capabilities of its members of staff are transformed. The continuous development of staff is vital to ensure
that the workforce is prepared to adjust to the expected changes in the business model. The teams must be equipped to function on an increasingly
professional level as the branch moves towards modernising its current data collection model.
Resource allocation
The primary cost driver is expenditure on compensation of employees. Within the remaining goods and services budget, the primary cost drivers
relate to the collection of questionnaires such as travel and subsistence and communications.

62
Expenditure trends and estimates
Economic Statistics expenditure trends and estimates by subprogramme and economic classification Subprogramme
Audited outcome Adjusted
appropriation
Average growth
rate (%)
Average: Expen- diture/
total (%)
Medium-term expenditure estimate
Average growth
rate (%)
Average: Expen- diture/
total (%)
R million 2016/17 2017/18 2018/19 2019/20 2016/17 - 2019/20
Special Adjusted
Appropriation 2020/21 2021/22 2022/23 2019/20 - 2022/23
Programme Management for
Economic Statistics
4.6 4.4 4.0 5.7 7.2% 1.9% 5.3 7.9 8.6 14.9% 2.2%
Business Cycle Indicators 30.9 33.3 35.1 45.0 13.4% 14.4% 39.7 45.3 47.6 1.9% 14.4%
Structural Industry Statistics 40.8 42.1 42.7 46.4 4.4% 17.2% 50.2 61.6 65.1 11.9% 18.2%
Price Statistics 73.5 77.2 81.3 86.9 5.7% 31.9% 88.2 104.9 110.3 8.3% 31.8%
Private Sector Finance Statistics 32.7 35.3 36.8 37.8 5.0% 14.3% 40.3 44.2 46.3 7.0% 13.7%
Government Finance Statistics 18.2 19.2 20.4 20.5 4.2% 7.8% 21.9 24.0 25.1 6.9% 7.4%
National Accounts 32.7 29.3 28.3 34.5 1.8% 12.5% 36.5 38.2 41.3 6.2% 12.2%
Total 233.3 240.7 248.5 276.8 5.9% 100.0% 282.1 326.1 344.4 7.6% 100.0%
Economic classification
Current payments 231.6 240.3 247.7 276.7 6.1% 99.7% 282.1 326.0 344.4 7.6% 100.0% Compensation of employees 210.4 219.9 230.3 243.4 5.0% 90.5% 257.9 300.8 315.4 9.0% 90.9%
Goods and services1
21.2 20.4 17.4 33.3 16.2% 9.2% 24.2 25.2 29.0 -4.5% 9.1%
of which:
Communication 1.7 3.2 1.9 2.7 16.9% 1.0% 2.6 2.7 3.6 9.7% 0.9%
Consultants: Business and advisory
services
8.1 4.0 2.4 5.5 -11.9% 2.0% 5.5 5.1 6.3 4.7% 1.8%
Consumables: Stationery, printing and
office supplies
0.3 0.9 0.7 0.9 37.5% 0.3% 1.0 0.8 1.0 2.4% 0.3%
Travel and subsistence 7.2 6.9 6.9 8.1 3.9% 2.9% 9.5 9.8 9.3 4.8% 3.0%
Training and development 0.5 0.2 0.4 0.9 25.3% 0.2% 0.6 1.6 3.1 51.1% 0.5%
Operating payments 2.5 4.1 4.3 3.9 16.8% 1.5% 3.1 2.7 2.4 -15.4% 1.0%
Transfers and subsidies1 0.4 0.2 0.7 0.0 -72.0% 0.1% – – – -100.0% –
Departmental agencies and accounts – – – 0.0 – – – – – -100.0% –
Households 0.4 0.2 0.7 0.0 -73.1% 0.1% – – – -100.0% –
Payments for capital assets 1.3 0.1 0.1 0.1 -56.7% 0.2% 0.1 0.1 0.0 -28.7% –
Machinery and equipment 1.3 0.1 0.1 0.1 -56.7% 0.2% 0.1 0.1 0.0 -28.7% –
Total 233.3 240.7 248.5 276.8 5.9% 100.0% 282.1 326.1 344.4 7.6% 100.0%
1. Estimates of National Expenditure data tables can be downloaded from www.treasury.gov.za. These tables contain detailed information by goods and services, and transfers and subsidies items by
programme.

63
Personnel information
Economic Statistics personnel numbers and cost by salary level¹
Number of posts estimated for
31 March 2020 Number and cost2 of personnel posts filled/planned for on funded establishment Number
Number of
funded posts
Number of posts
additional to the
establishment Actual Revised estimate Medium-term expenditure estimate
Average growth
rate (%)
Average: Salary
level/total (%)
2018/19 2019/20 2020/21 2021/22 2022/23 2019/20 - 2022/23
Economic Statistics Number Cost Unit cost Number Cost
Unit cost Number Cost
Unit cost Number Cost
Unit cost Number Cost
Unit cost
Salary level 563 – 509 230.3 0.5 489 243.2 0.5 483 257.9 0.5 544 300.8 0.6 530 315.4 0.6 2.7% 100.0%
1 – 6 266 – 261 76.2 0.3 241 81.7 0.3 241 87.8 0.4 302 119.0 0.4 288 121.6 0.4 6.1% 52.4%
7 – 10 209 – 174 79.5 0.5 174 85.7 0.5 168 89.2 0.5 168 95.6 0.6 168 102.3 0.6 -1.2% 33.1%
11 – 12 56 – 48 42.4 0.9 48 41.9 0.9 48 44.7 0.9 48 47.6 1.0 48 50.6 1.1 – 9.4%
13 – 16 32 – 26 32.3 1.2 26 33.9 1.3 26 36.1 1.4 26 38.5 1.5 26 40.9 1.6 – 5.1%
1. Data has been provided by the department and may not necessarily reconcile with official government personnel data.
2. Rand Million.
Strategic risks
The branch has identified the following strategic risks:
Risk Mitigation
Failure to maintain the quality of existing outputs and the inability to
respond to emerging user needs and quality improvements, due to
financial constraints
Engage external stakeholders on the granularity, accuracy and timeliness of
economic statistics
Monitor and identify critical gaps for intervention
Failure of organs of state and businesses to submit suitable data to Stats
SA for the compilation of various economic, environment and price
statistics
Amendment and enforcement of the Statistics Act
Partnerships with actors in the data-ecosystem
Implementation of the Integrated Communication, Marketing and Stakeholder
Management Strategy regarding response rates
Failure of ICT systems during the different stages of the statistical value
chain will impact on the reputation of the organisation
Continuous engagement with stakeholders to ensure that reliable ICT systems
are in place
Ensure disaster recovery plans are in place

64
2.3 Programme 3: Population and Social Statistics
Purpose: Produces population and social statistics to inform evidence-based socio-economic development
Subprogrammes:
Demographic and Population Statistics: collates and analyses data from censuses and other surveys, as well as administrative data to compile
mid-year population estimates, and publishes population statistics collected through population censuses and surveys.
Health and Vital Statistics: publishes statistics on births, deaths, marriages, divorces, tourism and migration based on administrative records.
Publications include documented immigrants, perinatal deaths, and comparative analysis between various data sources.
Social Statistics: provides information on living conditions, domestic tourism, education, crime and justice by means of conducting household
surveys. Publications include statistics for marginalised groups, gender series and periodic national household transport surveys.
Labour Statistics: provides information on employment levels in the formal, non-agriculture sector as well as labour market trends in South
Africa. Publications include quarterly release on employment levels, a quarterly publication on labour market trends, and a n annual report on
labour market dynamics in South Africa.
Poverty and Inequality Statistics: provides periodic information on poverty levels and income and expenditure trends in South Africa. One of
the key strategic targets over the medium term is the implementation of the Continuous Population Survey (CPS), depending on additional
allocation of funding.

65
Table 1: Outcomes, outputs, performance indicators and targets
Audited/actual performance
Estimated
performance Medium-term targets
No. Outcome Output Output indicators 2016/17 2017/18 2018/19 2019/20 2020/21 2021/22 2022/23
Programme 3: Population and Social Statistics (Subprogramme: Demographic & Population Statistics)
14. Insightful data Statistical
information on
the changing
dynamics of the
population
Number of
population
estimates
published
Published mid-
year population
estimates
Published mid-
year population
estimates
Local
municipality
and household
estimates were
not compiled
Published mid-
year population
estimates
Compiled local
municipality
and household
estimates
Publish
annual mid-
year
population
estimates
3 releases on
mid-year
population
estimates at
national,
provincial,
district and
metro levels
published
3 releases on
mid-year
population
estimates at
national,
provincial,
district and
metro levels
published
3 releases on
mid-year
population
estimates at
national,
provincial,
district and
metro levels
published
Reports on
demographic
and population
statistics
Percentage of
Census 2021
instruments
reviewed
Number of
technical
reports on
evaluation of
data for Census
2021 pilot
compiled
Compiled
institutionalised
population,
research papers
Compiled
reports on
thematic
analysis of
demography
Compiled
report on
Census 2021
new
methodologies
test
Content
development
for Census
2021
100% Census
2021
instruments
reviewed
1 technical
report on
evaluation of
data for
Census 2021
pilot
compiled
100%
Census 2021
content
developed
100% Census
2021
demographic
and
population
data assessed
100% key
Census 2021
products
developed
Reports on
demographic
and population
statistics
Number of
technical
reports on
demography
and population
science
published
Compiled
reports on
thematic
analysis of
demography
Compiled
thematic reports
based on
alternative data
sources
Thematic
report on
emerging
demographic
issues based
on various
data sources
1 technical
report on
demography
and
population
science
published
1 concept note
on the
migration
profile report
compiled
1 report on
migration
profile (multi-
stakeholder
report)
published

66
Table 2: Indicators, annual and quarterly targets
Quarterly targets
No. Output indicator Annual target Quarter 1 Quarter 2 Quarter 3 Quarter 4
Programme 3: Population and Social Statistics (Subprogramme: Demographic & Population Statistics)
14.1 Number of releases on population estimates
published
1 release on mid-year population estimates at
national and provincial levels published by July
2020
1
1 release on mid-year population estimates at
district level published by November 2020
1
1 release on local municipal population and
household estimates published by March 2021
1
14.2 Percentage of Census 2021 instruments reviewed 100% Census 2021 instruments reviewed by
March 2021
100%
14.3 Number of technical reports on evaluation of data
for Census 2021 pilot compiled
1 technical report on evaluation of data for
Census 2021 pilot compiled by March 2021
1
14.4 Number of technical reports on demography and
population science published
1 technical report on demography and population
science published by March 2021
1

67
Table 1: Outcomes, outputs, performance indicators and targets
Audited/actual performance
Estimated
performance Medium-term targets
No. Outcome Output Output indicators 2016/17 2017/18 2018/19 2019/20 2020/21 2021/22 2022/23
Programme 3: Population and Social Statistics (Subprogramme: Health and Vital Statistics)
15. Insightful data Statistical
information on
international
tourism
Number of
releases on
international
tourism
published
Published
monthly
releases and
annual report
on international
tourism
Published
monthly
releases and
annual report
on international
tourism
Published
monthly
releases and
annual report
on international
tourism
Publish
monthly and
annual
international
tourism
statistics
12 monthly
releases and
1 annual
report on
international
tourism
statistics
published
12 monthly
releases and
1 annual
report on
international
tourism
statistics
published
12 monthly
releases and 1
annual report on
international
tourism statistics
published
Statistical
information on
vital statistics
Number of
releases on vital
statistics (births)
published
Published
reports on
recorded live
births
Published
reports on
recorded live
births
Published
annual release
on recorded live
births
Publish annual
vital statistics
1 annual
release on
recorded live
births (2019)
published
1 annual
release on
recorded live
births (2020)
published
1 annual release
on recorded live
births (2021)
published
Statistical
information on
vital statistics
Number of
releases on vital
statistics (deaths(
published
Published
reports on
mortality and
causes of death
Additional
variables for
immigrants and
self-assessment
on the mortality
and causes of
death were not
done
The annual
release on
mortality and
causes of death
was not
published
Publish annual
vital statistics
1 annual
release on
mortality and
causes of
death (2019)
published
1 annual
release on
mortality and
causes of
death (2020)
published
1 annual release
on mortality and
causes of death
(2021) published
Statistical
information on
vital statistics
Number of
releases on vital
statistics
(marriages and
divorces)
published
Published
reports on
marriages and
divorces
Published
reports on
marriages and
divorces
Published
annual release
on marriages
and divorces
Publish annual
vital statistics
1 annual
release on
marriages
and divorces
(2019)
published
1 annual
release on
marriages
and divorces
(2020)
published
1 annual release
on marriages and
divorces (2021)
published
Statistical
information on
health
Number of
reports on health
statistics
published
The key
indicators report
on SADHS was
not published
The SADHS
report was
compiled but
not published
Compiled
report on non-
communicable
diseases as
scheduled
Compile
analytical report
on various data
sources on health
1 annual
report on
health
statistics
published
1 annual
report on
health
statistics
published
1 annual report
on health statistics
published

68
Table 1: Outcomes, outputs, performance indicators and targets (concluded)
Audited/actual performance
Estimated
performance Medium-term targets
No. Outcome Output Output indicators 2016/17 2017/18 2018/19 2019/20 2020/21 2021/22 2022/23
Programme 3: Population and Social Statistics (Subprogramme: Health and Vital Statistics)
15. Insightful data Statistical
information on
health
Number of
releases on
health statistics
published
1 biannual
release on
recorded live
births statistics
introduced
1 in-depth
analysis of the
National
Population
Register (NPR)
conducted
1 report on
documented
immigrants
reintroduced
(incorporation of
refugees and
asylum seekers
data)
Table 2: Indicators, annual and quarterly targets
Quarterly targets
No. Output indicator Annual target Quarter 1 Quarter 2 Quarter 3 Quarter 4
Programme 3: Population and Social Statistics (Subprogramme: Health and Vital Statistics)
15.1 Number of releases on international tourism
published, 2 months after the reference period
12 monthly releases on international tourism
published as scheduled
3 3 3 3
15.2 Number of reports on international tourism
published
1 annual report on international tourism published
by April 2020
1
15.3 Number of releases on vital statistics (births)
published
1 annual release on recorded live births (2019)
published by August 2020
1
15.4 Number of releases on vital statistics (deaths)
published
1 annual release on mortality and causes of death
(2019) published by March 2021
1
15.5 Number of releases on vital statistics (marriages
and divorces) published
1 annual release on marriages and divorces
(2019) published by February 2021
1
15.6 Number of reports on health statistics published 1 annual report on health statistics published by
February 2021
1

69
Table 1: Outcomes, outputs, performance indicators and targets
Audited/actual performance
Estimated
performance Medium-term targets
No. Outcome Output Output indicators 2016/17 2017/18 2018/19 2019/20 2020/21 2021/22 2022/23
Programme 3: Population and Social Statistics (Subprogramme: Social Statistics)
16. Insightful data Statistical
information on
domestic
tourism
Number of
reports on
domestic
tourism
statistics
published
Published
report on
domestic
tourism survey
Biannual report
on the DTS was
not published
Published
annual report
on the DTS
Published
biannual report
on the DTS
Published
annual report
on the DTS
Published
biannual report
on the DTS
Publish
annual report
on the DTS
Publish
biannual
report on the
DTS
1 annual
release on
domestic
tourism
published
1 biannual
release on the
DTS published
1 annual
release on
domestic
tourism
published
1 biannual
release on the
DTS published
1 annual
release on
domestic
tourism
published
1 biannual
release on the
DTS published
Technical
report on
domestic
tourism
Report on
domestic
tourism
improved
A comparative
analysis was
not conducted
Conducted
assessment on
the future of
the DTS
1 technical
report on the
integration of
the national
domestic
tourism
compiled
1 technical
report on the
integration of
the national
domestic
tourism
compiled
1 technical
report on the
integration of
the national
domestic
tourism
compiled
Statistical
information on
transport
Number of
releases on
transport
statistics
published
Compiled
research report
Drafted report
on RTMC
Compiled
report on
technical
support
provided to
RTMC
Compiled
report on
technical
support
provided
1 release on
transport
statistics
published
9 releases on
provincial
transport
statistics
published
1 thematic
report on
transport
statistics
published
Statistical
information on
social and
household
service delivery
statistics
Number of
releases on
social and
household
service delivery
statistics
published
Published
release on
GHS 2015
Published
release on
GHS 2016
Published
release on
GHS 2017
Publish
annual social
and
household
service
delivery
statistics
1 annual
release on
social and
household
service delivery
published
1 annual
release on
social and
household
service delivery
published
1 annual
release on
social and
household
service
delivery
published
Development
indicators
publication
Number of
releases on
development
indicators
published
Published
report on
development
indicators
Published
reports on
development
indicators and
metro
development
indicators
Compiled
development
indicators and
metro
development
indicators
2 annual
releases on
development
indicators
published
2 annual
releases on
development
indicators
published
2 annual
releases on
development
indicators
published
Statistical
information on
marginalised
groups
Number of
statistical
releases on
marginalised
groups
published
Compiled
reports on
vulnerable
group
indicators and
on the elderly
Compiled
report on
vulnerable
group
indicators
Compiled
report on
vulnerable
group
indicators
Publish
statistical report
on
marginalised
groups
1 release on
annual
marginalised
groups indicator
published
1 release on
annual
marginalised
groups
indicator
published
1 release on
annual
marginalised
groups
indicator
published

70
Table 1: Outcomes, outputs, performance indicators and targets (continued)
Audited/actual performance
Estimated
performance Medium-term targets
No. Outcome Output Output indicators 2016/17 2017/18 2018/19 2019/20 2020/21 2021/22 2022/23
Programme 3: Population and Social Statistics (Subprogramme: Social Statistics)
16. Insightful data Statistical
information on
marginalised
groups
Number of
statistical
releases on
marginalised
groups
published
Compiled
reports on
vulnerable
group indicators
and on the
elderly
Compiled
report on
vulnerable
group indicators
series 3: The
social profile of
children
Compiled
report on
technical
support to
stakeholders
1 annual
release on
marginalised
groups
indicators
published:
Series 6 on
elderly
1 annual
release on
marginalised
groups
indicators
published:
Series 7 on
youth
1 annual
release on
marginalised
groups
indicators
published:
Series 8 on
elderly
Statistical
information on
gender
Number of
statistical
releases on
gender
published
Compiled
report on
gender
disparities
A report on
violence against
women was not
compiled
Published
gender series 4
on economic
empowerment
Compiled
report on
technical
support to
stakeholders
Publish
statistics on
gender:
series 6:
gender and
education
1 annual
release on
gender series
7 published
1 annual
release on
gender series
8 published
1 annual
release on
gender series
9 published
Statistical
information on
safety and
security
Number of
statistical
releases on
safety and
security statistics
published
Published
annual release
on Victims of
Crime Survey
Published
annual release
on Victims of
Crime Survey
Published
annual release
on Victims of
Crime Survey
Publish
annual
victims of
crime
statistics
1 annual
release on
victims of
crime
statistics
published
1 annual
release on
victims of
crime
statistics
published
1 annual
release on
victims of
crime
statistics
published
Statistical
information on
governance
Number of
statistical
releases on
governance
statistics
published
Compiled
report on
scoping exercise
Established
functional
governance unit
within the
existing
structure
Developed
sector strategy
and plan for
measurement of
governance and
public sector
management
Publish
annual
governance
statistics
1 annual
release on
governance
statistics
published
1 annual
release on
governance
statistics
published
Statistical
information on
education
Number of
reports on
education and
child statistics
Published
thematic report
on education
Compiled
thematic report
on early
childhood
development
Published
thematic report
on post-
secondary
attainments
Compile
education
series 6
report
1 annual
report on
education
statistics
published:
Series 7
1 annual
report on
education
statistics
published:
Series 8
1 annual
report on
education
statistics
published:
Series 9

71
Table 1: Outcomes, outputs, performance indicators and targets (concluded)
Audited/actual performance
Estimated
performance Medium-term targets
No. Outcome Output Output indicators 2016/17 2017/18 2018/19 2019/20 2020/21 2021/22 2022/23
Programme 3: Population and Social Statistics (Subprogramme: Social Statistics)
16. Insightful data Research on
education
statistics
Number of
reports on
education and
child statistics
Compiled
report on
technical
support to
stakeholders
Publish
education
statistics
(annual
education
statistics are
published as
part of GHS
release)
1 research
report on
alternative
data sources
on education
data
compiled
1 research
report on
alternative
data sources
on education
compiled
1 research
report on
alternative
data sources
on education
compiled

72
Table 2: Indicators, annual and quarterly targets
Quarterly targets
No. Output indicator Annual target Quarter 1 Quarter 2 Quarter 3 Quarter 4
Programme 3: Population and Social Statistics (Subprogramme: Social Statistics)
16.1 Number of releases on domestic tourism statistics
published
1 annual release on domestic tourism statistics
published by October 2020
1
16.2 Number of reports on domestic tourism statistics
improved
1 technical report on the integration of the
national Domestic Tourism Surveys compiled by
March 2021
1
16.3 Number of releases on transport statistics
published
1 release on transport statistics published by
January 2021
1
16.4 Number of releases on social and household
service delivery statistics published
1 annual release on social and household service
delivery statistics published by May 2020
1
16.5 Number of releases on development indicators
published
1 annual release on development indicators
published by May 2020
1
1 annual release on metro development indicators
published by May 2020
1
16.6 Number of releases on marginalised groups
published
1 annual release on marginalised groups
indicators published by March 2021
1
1 annual release on series 6 on the elderly
published by March 2021
1
16.7 Number of releases on gender published 1 annual release on gender series 7 published by
December 2020
1
16.8 Number of releases on safety and security statistics
published
1 annual release on victims of crime statistics
published by November 2020
1
16.9 Number of releases on governance statistics
published
1 annual release on governance statistics
published by October 2020
1
16.10 Number of reports on education and child
statistics compiled
1 research report on alternative data sources on
education data compiled by March 2021
1
1 thematic report on education series 7 compiled
by March 2021
1

73
Table 1: Outcomes, outputs, performance indicators and targets
Audited/actual performance
Estimated
performance Medium-term targets
No. Outcome Output Output indicators 2016/17 2017/18 2018/19 2019/20 2020/21 2021/22 2022/23
Programme 3: Population and Social Statistics (Subprogramme: Labour Statistics)
17. Insightful data Statistical
information on
employment
and earnings
releases
Number of
releases on
employment
and earnings
published
Published
quarterly
releases on
employment
and earnings
Published
quarterly
releases on
employment
and earnings
Published
quarterly
releases on
employment
and earnings
Publish
quarterly
releases on
employment
and earnings
4 quarterly
releases on
employment
and earnings
published
4 quarterly
releases on
employment
and earnings
published
4 quarterly
releases on
employment
and earnings
published
Discussion
document on
the vacancy rate
survey
Number of
discussion
documents on
the vacancy rate
survey compiled
Compiled
report on lower
level industry
data
Compiled
research report
on vacancy
rates in the
formal economy
Conduct
research on
job vacancy
rates
1 discussion
document on
vacancy rate
survey
compiled
1 series to
cover industry
data and
vacancy rates
expanded
1 series to
cover industry
data and
vacancy rates
expanded
Statistical
information on
labour market
releases
Number of
releases and
reports on
labour market
statistics
published
Published
quarterly
releases on
labour market
information and
annual report
on labour
market
dynamics in SA
Published
quarterly
releases on
labour market
information and
annual report
on labour
market
dynamics in SA
Published
quarterly
releases on
labour market
information and
annual report
on labour
market
dynamics in SA
Publish
quarterly
releases on
labour market
information
Publish
annual report
on labour
market
dynamics in
SA
4 quarterly
releases on
labour market
information
published
1 annual
report on
labour market
dynamics in
SA published
4 quarterly
releases on
labour market
information
published
1 annual
report on
labour market
dynamics in
SA published
4 quarterly
releases on
labour market
information
published
1 annual
report on
labour market
dynamics in
SA published
Statistical
information on
activities of
young people
Number of
reports on child
labour
published
Published SAYP
report
Compiled
research report
on Volunteer
Activities Survey
Developed
SAYP module
Publish report
on volunteer
activities
survey
Conduct
research on
time use
survey
1 report on
child labour
published
1 research
report on
alternative
ways on time
use statistics
compiled
1 report on
informal
sector
published

74
Table 2: Indicators, annual and quarterly targets
Quarterly targets
No. Output indicator Annual target Quarter 1 Quarter 2 Quarter 3 Quarter 4
Programme 3: Population and Social Statistics (Subprogramme: Labour Statistics)
17.1 Number of releases on employment and earnings
published, 12 weeks after the reference month
4 quarterly releases on employment and earnings
published as scheduled
1 1 1 1
17.2 Number of discussion documents on the vacancy
rate survey compiled
1 discussion document on the vacancy rate survey
compiled by March 2021
1
17.3 Number of releases on labour market information
published, 4 weeks after the end of the quarter
(last publication will be released 8 weeks after the
end of the quarter)
4 quarterly releases on labour market information
published as scheduled
1 1 1 1
17.4 Number of reports on labour market statistics
published
1 annual report on labour market statistics
published by September 2020
1
17.5 Number of reports on child labour published 1 report on child labour published by March 2021 1

75
Table 1: Outcomes, outputs, performance indicators and targets
Audited/actual performance
Estimated
performance Medium-term targets
No. Outcome Output Output indicators 2016/17 2017/18 2018/19 2019/20 2020/21 2021/22 2022/23
Programme 3: Population and Social Statistics (Subprogramme: Poverty and Inequality Statistics)
18. Insightful data Statistical
information on
poverty and
inequality
Number of
reports on life
circumstances,
poverty and
inequality
published
Published
release on the
poverty profile
and expenditure
patterns of
households in
South Africa
Published
thematic report
on men, women
and children
Compiled
report on
poverty
indicators
The thematic
report on
subjective
poverty was not
compiled
Published report
on food security
in SA
Compiled
poverty
mapping report
Compiled 2018
poverty lines
An inequality
trends report
was not
compiled
Publish
national
poverty lines
for 2019
Compile child
poverty report
Compile
inequality
trends report
1 report on
national
poverty lines
for 2020
published
1 report on
national
poverty lines
for 2021
published
1 report on
national
poverty lines
for 2022
published
1 report on
poverty trends
published
1 report on
food security
published
Document on
IES
methodology
IES
methodology
document
compiled
Compiled
Methodologies
for generation
of poverty
estimates for
small areas
using IES, LCS
and census
data
Developed and
tested CPS
modules
Compiled CPS
pilot report
Compiled CPS
methodology
document
1 IES
methodology
document
compiled
1 report on
household
income and
expenditure
published
Discussion
document on
the introduction
of an annual
SAMPI based
on GHS 2019
Discussion
document on
the introduction
of an annual
SAMPI based
on GHS 2019
compiled
Compile
document on
improvements
to the SAMPI
Assess NIDS
data
1 discussion
document on
the
introduction
of an annual
SAMPI based
on GHS
2019
compiled
1 document
on subjective
poverty based
on GHS
2019
compiled
1 SAMPI
based on
Census 2021
published
Interconnected
statistical
systems
Research report
on external data
sources on
household
income and
expenditure,
poverty and
inequality
Research on
household
income and
expenditure,
poverty, and
inequality
conducted
1 discussion
document on
external data
sources for
household
income and
expenditure,
poverty, and
inequality
compiled
1 SASQAF
assessment of
selected
external data
sources based
on research
done in
2020/21
compiled
1 discussion
document on
the
introduction
of selected
external data
sources for IIF
reporting
compiled

76
Table 2: Indicators, annual and quarterly targets
Quarterly targets
No. Output indicator Annual target Quarter 1 Quarter 2 Quarter 3 Quarter 4
Programme 3: Population and Social Statistics (Subprogramme: Poverty and Inequality Statistics)
18.1 Number of reports on life circumstances, poverty
and inequality published
1 report on national poverty lines for 2020
published by December 2020
1
18.2 Discussion document on the introduction of an
annual SAMPI based on GHS 2019 compiled
1 discussion document on the introduction of an
annual SAMPI based on GHS 2019 compiled by
December 2020
1
18.3 IES methodology document compiled 1 IES methodology document compiled by
October 2020
1
18.4 Research on household income and expenditure,
poverty, and inequality conducted
1 research report on external data sources for
household income and expenditure, poverty and
inequality compiled by March 2021
1

77
Programme 3: Explanation on planned performance
Stats SA has to grow and move from only data and information production to an information and knowledge-based organisation. There is an
ever-increasing demand for data and information in South Africa in relation to understanding the evolution of social phenomena. Th e
organisation will have to increase its responsiveness to user needs through deeper analysis and explore the use of alternative data sources by
harnessing and unlocking data in the broader ecosystem, while maintaining the quality of key national indicators. Population and Social Statistics
as a branch subscribes to insightful data as its primary strategic outcome.
Insightful data: Population and Social Statistics will continue to sustain the quality of key national indicators and to increase responsiveness to
users’ basic statistical needs and demands by collecting and analysing data across a range of themes, including living condit ions, domestic
tourism, transport, education, gender and marginalised groups, governance, crime and safety, employment, poverty and inequality, the
demographic profile of the country and substantive analysis of key analytical themes related to the demography of the country, e.g. mortality,
fertility, migration, mortality and causes of death, recorded live births, health reports, marriages and divorces, tourism and migration monthly
and annual reports. Furthermore, in-depth thematic research reports will occur annually which may look to explore innovative methods but also
to cover analytical themes related to the demography of the country but also towards themes that focus on women, children and the disabled.
The demography of the country will occur by means of the mid-year population estimates produced annually at various geographic levels as well
as projections which form part of the suite of products of the population estimates programme. In addition to this the inputs to the 2021 Population
and Housing Census in the form of the design of the questionnaire, edit specifications, evaluation of data and product development will cont ribute
greatly towards the execution of the 2021 Census, which will form the basis of many planning activities. The main outputs from the Population
and Social Statistics branch contribute towards the organisation achieving the strategic outcome, Insightful data.
The high levels of inequality and challenges in reducing poverty; the need to frequently update the CPI basket of goods and services; and the
increasing concerns about food security globally as well as nationally require proper and speciali sed measurement of income, poverty and
inequality, multidimensional poverty, household income and expenditure as well as household food security. Stats SA has received a once off
allocation to conduct an Income and Expenditure Survey (IES)/Living Conditions Survey (LCS). The IES/LCS is scheduled to commence in 2020/21
and will cover a data collection survey period of 12 months. Data collection will be concluded in September 2021.
These themes feed into the integrated indicator framework (IFF) and contribute to evidence-based policymaking across government. Issues related
to women, children and people with disabilities are integrated into the various Population and Social Statistics outputs. Outputs specifically
include an annual indicator report on marginalised groups (women, youth, older persons, and people with disabilities), as wel l as various thematic
reports on issues relating to gender and marginalised groups, respectively. Statistics produced by the branch is disaggregated by sex and age to
allow for broader understanding of women’s and children’s living circumstances. Thematic reports on health, child poverty, and men, women
and children reports, fertility, mortality and education give deeper analysis on marginalised and vulnerable groups focusing on socio-economic
issues that involve children and women.
The outputs produced within the Population and Social Statistics branch will contribute towards monitoring of the MTSF 2020–2024, the National
Development Plan goals and indicators, Agenda 2063 as well as the Sustainable Development Goals , which are outlined in the integrated
indicator framework.
Agile operating model: The strategic intent of this programme is to integrate survey content through the Continuous Population Survey. Stats SA
is currently collecting statistical information on living conditions, service delivery and poverty through the General Household Survey (GHS), the
Income and Expenditure Survey (IES), the Living Conditions Survey (LCS) and the Community Survey (CS). In response to growing user demands
and an increasing demand for data at subprovincial level, as well as ensuring high-quality timely products, Stats SA is embarking on a process
of reviewing the content of the questionnaires of these surveys as well as the survey methodology. One of the outcomes of this process is the
introduction of a modular approach, where a rotational system of in-depth service delivery modules will be developed and implemented at

78
regular intervals as part of a continuous population survey for household surveys. Continuous collection is expected to better capture seasonality
in the data and to provide more opportunities for quality assurance. The Continuous Population Survey (CPS) will integrate three current survey
instruments – the General Household Survey (GHS), Living Conditions Survey (LCS) and Income and Expenditure Survey (IES) – and will provide
an integrated tool for the collection of living conditions, life circumstances and poverty data. The CPS will be implemented over the medium
term; that is, towards the end of the five-year period, depending on the additional allocation of funding. This survey will create a more agile and
cost-effective operating model for survey data collection, as it would provide a broad platform to cover a range of thematic areas (inter alia
expenditure data, living conditions, service delivery, health and demographic data, education) on a regular basis.
This programme plays a pivotal role in the operational inputs that contribute towards achieving other strategic outcomes. In specific the
digitalisation of relevant phases in the statistical value chain (development of electronic questionnaires) contributes towards achiev ing an Agile
operating model. During the 2020/21 financial year, this programme will be closely involved with mapping the To-Be process of CAPI.
Interconnected statistical system: The key strategic intent of this programme is to explore and increase the use of administrative data as alternative
data sources to complement existing publications or produce new indicators. Although Population and Social Statistics will continue to use survey
data into the foreseeable future, it will also investigate the availability and use of various administrative data sources th rough harnessing and
unlocking data in the ecosystem to complement and, perhaps, eventually replace existing survey data sources that are connected through
statistical principles, standards and frameworks. Two areas are the Learner Unit Record and Information Tracking System (LURITS) of the
Department of Basic Education, and the Higher Education Management Information System (HEMIS) of the Department of Higher Education and
Training that are already being used in addition to GHS and other survey data to produce statistical information and reports.
Transformed capability: The strategic intent is extensive skilling and reskilling in data analytics and related digital capabilities in order to meet the
requirement of the new data ecosystem. We will invest in building a diverse, skilled and versatile workforce that embrace change and are able
to deliver innovative solutions. Specific training in data science, big data analysis, data mining, to mention a few areas, will be required. This will
create a cadre of analytical capability to drive value in the data ecosystem.
Resource allocation
The primary cost driver is expenditure on compensation of employees. Within the remaining goods and services budget, the primary cost drivers
relate to communication, data costs and training costs.

79
Expenditure trends and estimates
Population and Social Statistics expenditure trends and estimates by subprogramme and economic classification
Subprogramme
Audited outcome Adjusted
appropriation
Average growth
rate (%)
Average: Expen- diture/
total (%)
Medium-term expenditure estimate
Average growth
rate (%)
Average: Expen- diture/
total (%)
R million 2016/17 2017/18 2018/19 2019/20 2016/17 - 2019/20
Special Adjusted
Appropriation 2020/21 2021/22 2022/23 2019/20 - 2022/23
Programme Management for
Population and Social Statistics
3.3 1.2 0.6 2.0 -15.3% 1.2% 1.9 1.9 2.2 2.4% 1.1%
Demographic and Population Statistics 24.3 27.1 25.3 29.0 6.1% 18.2% 28.2 27.5 29.4 0.4% 15.9%
Health and Vital Statistics 10.9 10.1 9.3 13.6 7.4% 7.6% 11.1 11.3 12.0 -4.0% 6.7%
Social Statistics 17.6 16.7 18.8 18.2 1.2% 12.3% 19.2 18.5 19.6 2.6% 10.5%
Labour Statistics 37.3 39.4 89.1 94.0 36.1% 44.8% 40.7 39.4 41.9 -23.6% 30.2%
Poverty and Inequality Statistics 21.1 22.4 25.8 23.2 3.3% 15.9% 23.1 78.4 130.2 77.6% 35.6%
Total 114.5 116.9 168.9 180.1 16.3% 100.0% 124.2 176.9 235.1 9.3% 100.0%
Economic classification
Audited outcome Adjusted
appropriation
Average growth
rate (%)
Average: Expen- diture/
total (%)
Medium-term expenditure estimate
Average growth
rate (%)
Average: Expen- diture/
total (%)
R million 2016/17 2017/18 2018/19 2019/20 2016/17 - 2019/20
Special Adjusted
Appropriation 2020/21 2021/22 2022/23 2019/20 - 2022/23
Current payments 113.1 116.1 161.5 179.5 16.7% 98.2% 123.6 176.4 234.7 9.3% 99.7%
Compensation of employees 101.5 100.3 134.8 109.8 2.7% 76.9% 106.6 119.6 125.2 4.5% 64.4%
Goods and services1 11.6 15.7 26.7 69.7 81.7% 21.3% 16.9 56.8 109.5 16.2% 35.3%
of which:
Communication 0.8 1.3 2.4 1.5 24.6% 1.0% 5.9 4.8 6.1 58.7% 2.6%
Agency and support/outsourced
services
0.1 0.0 0.0 38.6 811.4% 6.7% 0.5 0.5 0.5 -76.1% 5.6%
Fleet services (including government
motor transport)
0.1 0.1 0.0 0.0 -61.1% – - 18.2 34.9 1811.3% 7.4%
Consumables: Stationery, printing and
office supplies
0.5 0.7 0.4 0.5 -1.0% 0.3% 1.0 2.2 6.1 134.0% 1.4%
Travel and subsistence 3.5 5.4 17.0 22.6 86.7% 8.4% 5.6 23.3 52.1 32.2% 14.5%
Operating payments 5.7 7.0 4.1 3.4 -15.6% 3.5% 3.2 3.7 3.9 4.9% 2.0%
Transfers and subsidies1 0.5 0.5 0.5 0.0 -56.0% 0.3% 0.0 0.0 0.0 -37.5% –
Public corporations and private
enterprises
Non-profit institutions
Households
Payments for capital assets 0.9 0.4 0.4 0.5 -17.7% 0.4% 0.5 0.5 0.5 -3.3% 0.3%
Machinery and equipment
Software and other intangible assets
Payments for financial assets – – 6.5 – – 1.1% – – – – – Total 114.5 116.9 168.9 180.1 16.3% 100.0% 124.2 176.9 235.1 9.3% 100.0%
1 Estimates of National Expenditure data tables can be downloaded from www.treasury.gov.za. These tables contain detailed information by goods and services, and transfers and subsidies items by
programme.

80
Personnel information
Population and Social Statistics personnel numbers and cost by salary level¹
Number of posts estimated for
31 March 2020 Number and cost2 of personnel posts filled/planned for on funded establishment Number
Number of
funded posts
Number of posts
additional to the
establishment Actual Revised estimate Medium-term expenditure estimate
Average growth
rate (%)
Average: Salary
level/total (%)
2018/19 2019/20 2020/21 2021/22 2022/23 2019/20 - 2022/23
Population and Social Statistics Number Cost Unit cost Number Cost
Unit cost Number Cost
Unit cost Number Cost
Unit cost Number Cost
Unit cost
Salary level 200 – 164 134.8 0.8 154 109.8 0.7 144 106.6 0.7 150 119.6 0.8 145 125.2 0.9 -2.0% 100.0% 1 – 6 59 – 56 16.3 0.3 57 21.7 0.4 57 23.4 0.4 57 25.1 0.4 52 24.6 0.5 -3.0% 37.6%
7 – 10 61 – 47 21.4 0.5 41 23.2 0.6 36 21.6 0.6 36 23.2 0.6 36 24.8 0.7 -4.2% 25.1%
11 – 12 44 – 35 47.8 1.4 24 22.3 0.9 24 23.8 1.0 28 29.3 1.0 28 31.2 1.1 5.3% 17.5%
13 – 16 35 – 26 49.3 1.9 32 42.5 1.3 27 37.9 1.4 28 42.0 1.5 28 44.7 1.6 -4.4% 19.4%
Other 1 – – – – – – – – – – 1 – – 1 – – – 0.3%
1. Data has been provided by the department and may not necessarily reconcile with official government personnel data.
2. Rand million.
Strategic risks and mitigation
The branch has identified the following strategic risks:
Strategic risks Mitigation strategy
Lack of adequate funding to conduct an expenditure survey Continue engagements with National Treasury on funding for the CPS
Data quality is at risk due to decline in resources
Map data quality indicators on statistical value chain and define roles
and responsibilities
Inadequate geographic alignment of data to the most recent
geographic boundaries
Adopt GGSF in the organisation to facilitate integration of statistics
and geospatial information
Failure of the organisation to adopt big data principles Develop a big data strategy and framework that outlines big data
principles

81
2.4 Programme: Methodology & Statistical Infrastructure
Purpose: Develops standards, statistical frames, methodologies and conduct statistical research
Subprogrammes:
Statistical Methods: provides technical expertise on methodological practices for producing official statistics in economic and social statistics.
Statistical Standards: develops standards, classifications, and definitions for surveys undertaken by the department. Statistical Standards adopts
and adapts internationally acclaimed practices.
Business Register: maintains and improves the sampling frame for economic statistics. The main focus is on developing a preliminary financial
sampling frame and a final financial sampling frame.
Geography: provides a sampling frame for household surveys and censuses and provides geospatial information and analysis, and spatial tools.
Survey Monitoring and Evaluation: monitors the quality of field operations of household surveys and censuses and conducts independent
evaluations. Survey Monitoring and Evaluation collects, processes, analyses and coordinates monitoring and evaluation information of surveys.
Innovation and Research: researches and innovates statistical methods, practices and processes in order to improve production systems and
procedures for greater efficiency and modernisation.

82
Table 1: Outcomes, outputs, performance indicators and targets
Audited/actual performance
Estimated
performance Medium-term targets
No. Outcome Output Output indicators 2016/17 2017/18 2018/19 2019/20 2020/21 2021/22 2022/23
Programme 4: Methodology and Statistical Infrastructure (Subprogramme: Statistical Methods)
19. Agile operating
model
Report on Post-
enumeration
Survey (PES) for
Census 2021
pilot
PES for Census
2021 pilot
conducted
Conducted CS
2016
evaluation
Designed PES
methodology
for Census
2021
Conduct PES
pilot for
Census 2021
(moved to
2020/21)
Conduct PES
2021 tests
1 PES for
Census 2021
pilot
conducted
1 PES for
Census 2021
conducted
1 PES results
released
Table 2: Indicators, annual and quarterly targets
Quarterly targets
No. Output indicator Annual target Quarter 1 Quarter 2 Quarter 3 Quarter 4
Programme 4: Methodology and Statistical Infrastructure (Subprogramme: Statistical Methods)
19.1 PES for Census 2021 pilot conducted 1 Post-enumeration Survey (PES) for Census 2021
pilot conducted by March 2021
1

83
Table 1: Outcomes, outputs, performance indicators and targets
Audited/actual performance
Estimated
performance Medium-term targets
No. Outcome Output Output indicators 2016/17 2017/18 2018/19 2019/20 2020/21 2021/22 2022/23
Programme 4: Methodology and Statistical Infrastructure (Subprogramme: Statistical Methods)
20. Agile operating
model
National
ecosystem
classification for
South Africa
standard
National
ecosystem
classification for
South Africa
standard
adopted
Created
awareness
about standards
in provinces,
Compiled
standards
registry and
identified
priority
standards
Reviewed
standards on:
Data
dissemination,
data imputation
questionnaire
development,
and sample
maintenance for
economic
statistics
Research was
conducted on
BEC and SICTA
The domain-
specific data
revision policy
was not
compiled
Reviewed
standards on
weighting
methodology,
tables and
charts,
document
versioning,
and seasonal
adjustment
Review and
evaluate the
standards
development
processes and
methodology
Implement a
standards
advocacy
programme
1 national
ecosystem
classification
for South
Africa
standard
adopted
1 inter-
national
standard to
improve
statistical
practices
adopted
1 inter-
national
standard to
improve
statistical
practices
adopted
Table 2: Indicators, annual and quarterly targets
Quarterly targets
No. Output indicator Annual target Quarter 1 Quarter 2 Quarter 3 Quarter 4
Programme 4: Methodology and Statistical Infrastructure (Subprogramme: Statistical Standards)
20.1 National ecosystem classification for South Africa
standard adopted
1 national ecosystem classification for South Africa
standard adopted by March 2021
1
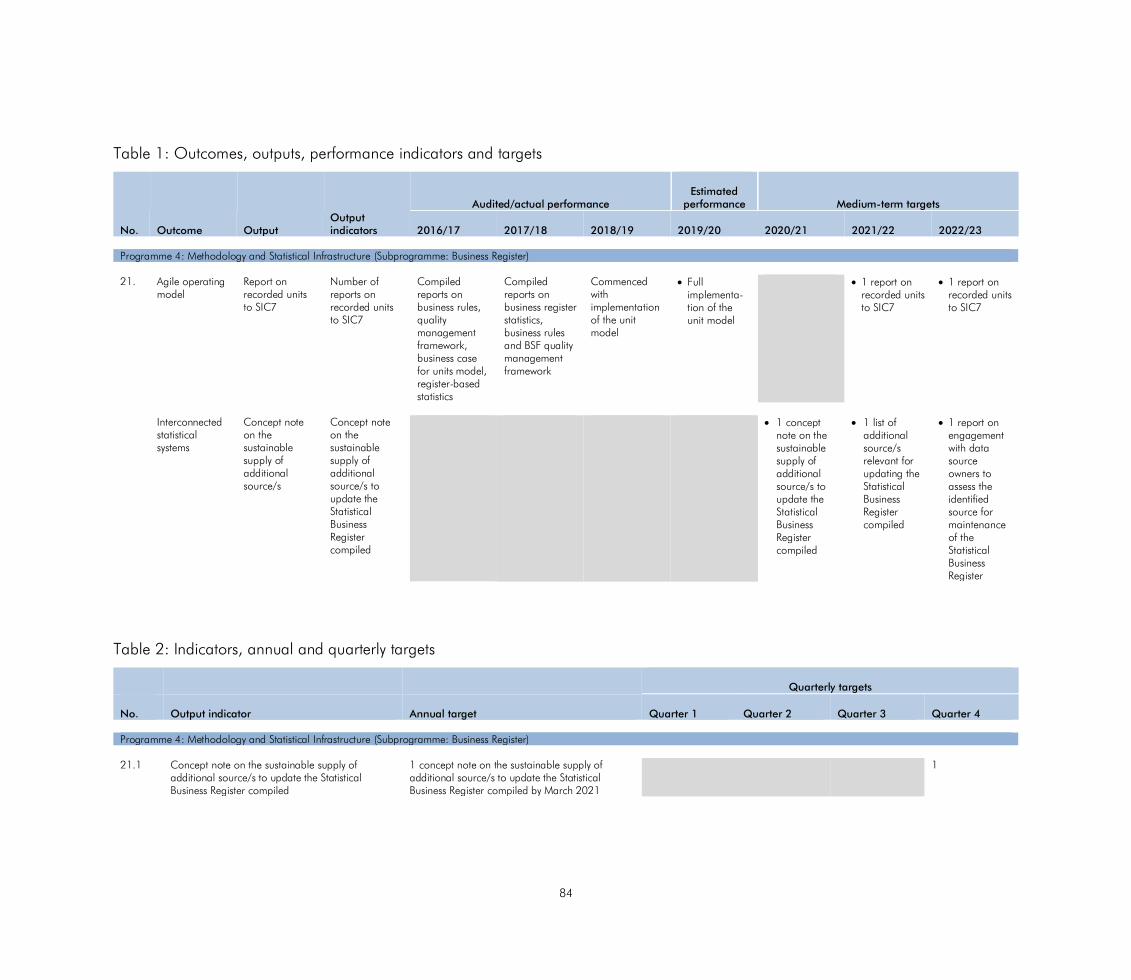
84
Table 1: Outcomes, outputs, performance indicators and targets
Audited/actual performance
Estimated
performance Medium-term targets
No. Outcome Output Output indicators 2016/17 2017/18 2018/19 2019/20 2020/21 2021/22 2022/23
Programme 4: Methodology and Statistical Infrastructure (Subprogramme: Business Register)
21. Agile operating
model
Report on
recorded units
to SIC7
Number of
reports on
recorded units
to SIC7
Compiled
reports on
business rules,
quality
management
framework,
business case
for units model,
register-based
statistics
Compiled
reports on
business register
statistics,
business rules
and BSF quality
management
framework
Commenced
with
implementation
of the unit
model
Full
implementa-
tion of the
unit model
1 report on
recorded units
to SIC7
1 report on
recorded units
to SIC7
Interconnected
statistical
systems
Concept note
on the
sustainable
supply of
additional
source/s
Concept note
on the
sustainable
supply of
additional
source/s to
update the
Statistical
Business
Register
compiled
1 concept
note on the
sustainable
supply of
additional
source/s to
update the
Statistical
Business
Register
compiled
1 list of
additional
source/s
relevant for
updating the
Statistical
Business
Register
compiled
1 report on
engagement
with data
source
owners to
assess the
identified
source for
maintenance
of the
Statistical
Business
Register
Table 2: Indicators, annual and quarterly targets
Quarterly targets
No. Output indicator Annual target Quarter 1 Quarter 2 Quarter 3 Quarter 4
Programme 4: Methodology and Statistical Infrastructure (Subprogramme: Business Register)
21.1 Concept note on the sustainable supply of
additional source/s to update the Statistical
Business Register compiled
1 concept note on the sustainable supply of
additional source/s to update the Statistical
Business Register compiled by March 2021
1

85
Table 1: Outcomes, outputs, performance indicators and targets
Audited/actual performance
Estimated
performance Medium-term targets
No. Outcome Output Output indicators 2016/17 2017/18 2018/19 2019/20 2020/21 2021/22 2022/23
Programme 4: Methodology and Statistical Infrastructure (Subprogramme: Geography)
22.
Agile operating
model
Geospatial
Information
Frame (GIF)
Geospatial
Information
Frame (GIF)
maintained
Published
dwelling frame
at metro, city
and regional
service centres
levels
Updated EA
layers in the
Free State and
Northern Cape
Demarcated 4
provinces
Migrated
master sample
to the SIF
Published
dwelling frame
at metro, city
and regional
service centre
levels
Demarcated 1
province
Publish a
complete
dwelling
frame at
metro, city,
regional
service centre
levels
Demarcate 1
province
1 GSGF
adopted
1 geo-
enabled
statistical
product for
the output
areas
developed
1 statistical
frame
innovated
and geo-
enabled(using
SBR, DHA,
SARS Deeds)
Geospatial
platform for
surveys and
census support
Geospatial
platform for
surveys and
census support
developed
Platforms were
not established
Prepare EA
and PN layer
for Census
2021
Update GIF
on selected
EAs
Prepare
sampling
frame for
household
surveys
1 geospatial
management
platform for
regular
surveys and
Census 2021
developed
1 end-to-end
geospatial
workflow
management
platform
established
1 geo-portal
for
dissemination
of geo-
enabled
statistical
products
implemented

86
Table 2: Indicators, annual and quarterly targets
Quarterly targets
No. Output indicator Annual target Quarter 1 Quarter 2 Quarter 3 Quarter 4
Programme 4: Methodology and Statistical Infrastructure (Subprogramme: Geography)
22.1 Geospatial Information Frame (GIF) maintained 1 GSGF adopted by March 2021 1
22.2 Geospatial platform for surveys and census
support developed
1 geospatial management platform for regular
surveys and Census 2021 developed by March
2021
1

87
Table 1: Outcomes, outputs, performance indicators and targets
Audited/actual performance
Estimated
performance Medium-term targets
No. Outcome Output Output indicators 2016/17 2017/18 2018/19 2019/20 2020/21 2021/22 2022/23
Programme 4: Methodology and Statistical Infrastructure (Subprogramme: Survey Monitoring and Evaluation)
23. Agile operating
model
Assessment
report on QMS
Assessment of
QMS (phase 1)
conducted
Outlined
practices and
procedure for a
quality
management
system
Developed
quality
management
system as
scheduled
Develop
quality
management
system (phase
2)
1 assessment
report on
QMS
compiled
1 quality
management
system (phase
1 & 2)
implemented
1 quality
management
system (phase
1 & 2)
implemented
Table 2: Indicators, annual and quarterly targets
Quarterly targets
No. Output indicator Annual target Quarter 1 Quarter 2 Quarter 3 Quarter 4
Programme 4: Methodology and Statistical Infrastructure (Subprogramme: Survey Monitoring and Evaluation)
23.1 Assessment of QMS (phase 1) conducted 1 assessment report on QMS compiled by March
2021
1

88
Programme 4: Explanation on planned performance
The programme contributes towards achieving the organisational strategic outcomes of agile operating model and interconnected statistical
systems. The key deliverables are an essential and critical element which form the support system and foundations of core statistical products.
Statistical standards are the enablers of achieving uniformity, consistency, comparability, integration and ultimately data sharing and thus
increased use of statistical products. Correct implementation of statistical standards promotes efficiency of operations and increases productivity.
Standards are a precondition for production of good quality statistics. The branch has to ensure availability and use of relevant statistical standards
and classifications for Stats SA and SANSS partners.
The geo-enabled statistical frames and geospatial support services to Stats SA and the external stakeholder community enable the crea tion and
use of geospatial frames, the application of geospatial tools and support on geo-statistical analyses. The Geospatial Information Frame (GIF) is
an input frame in the statistical value chain and consists of layers of georeferenced structures such as dwellings, businesses, place names,
enumeration areas and small areas. The GIF forms the base reference for the planning, operations and dissemination of censuses and surveys.
Geospatial information and reliable evidence are fundamental to achieving South Africa's development agenda. Despite the cons titutional
imperatives which state that the three spheres should assist and support one another, share information and coordinate their efforts, in practice
this has limited success. The lack of common and reliable information for planning is a major constraint in attaining policy targets and guiding
decision-making concerning available resources, service backlogs, inputs required, etc. It is fundamental therefore, that this process be based
on a foundation of reliable data, as the quality of decisions depends on the timeliness, applicability and accuracy of the in formation on which
they are based. Further to this, the necessary skills and competencies to sufficiently understand, analyse and utilise geospatial information are
vital.
The Statistical Business Register serves as a basis for all economic sample surveys conducted by Statistics South Africa. It is a database containing
selected information of all formal businesses in South Africa, irrespective of size and economic activity performed, that have registered their
business with at least one of the following government authorities i.e. the Department of Trade and Industry and the South African Revenue
Service (SARS). In order to innovate, geo snapshot and frame creation will be further automated. Initiatives to compile an inventory of admin
data sources in the state that are relevant for the maintenance of the Statistical Business Register and development of a strategy for sourcing data
from private and public data source producers will be pursued.
The branch also provides technical expertise on methodologies for producing official and other statistics, and reviews surveys as to their
methodological compliance and alignment with international frameworks and practices to render quality statistics able to info rm debate, research
and decision-making. Application of sound statistical methods is the cornerstone of quality statistics.
For the organisation to sustain the quality of key indicators and to curb the challenges of declining quality of data there i s a need to reposition
and strengthen monitoring and evaluation within the statistical system. This will only be achieved through building of a quality management
system that will have to be tested, integrated, interfaced and institutionalised across the organisation. Monitoring compliance of the application
of the statistical standards and quality dimensions across the statistical value chain is key to improvement of quality of statistics across the
organisation.
The transition of statistical production processes from manual systems to digital platforms requires the branch to upskill and re-skill its personnel
to ensure that they provide the relevant and necessary support to production systems.

89
Resource allocation
The primary cost driver is expenditure on compensation of employees. Within the remaining goods and services budget, the primary cost drivers
relate to communication, data costs and training costs.
Expenditure trends and estimates
Methodology and Statistical Infrastructure expenditure trends and estimates by subprogramme and economic classification Subprogramme
Audited outcome Adjusted
appropriation
Average growth
rate (%)
Average: Expen- diture/
total (%)
Medium-term expenditure estimate
Average growth
rate (%)
Average: Expen- diture/
total (%)
R million 2016/17 2017/18 2018/19 2019/20 2016/17 - 2019/20
Special Adjusted
Appropriation 2020/21 2021/22 2022/23 2019/20 - 2022/23
Programme Management for
Methodology and Statistical
Infrastructure
4.3 4.4 4.4 5.0 5.1% 3.4% 3.9 3.8 4.0 -7.0% 2.4%
Statistical Methods 18.7 20.2 20.3 23.5 7.9% 15.6% 19.9 28.4 29.8 8.3% 14.5%
Statistical Standards 9.4 9.6 9.4 11.7 7.6% 7.6% 10.6 11.4 12.0 0.9% 6.5%
Business Register 33.7 33.1 34.0 38.6 4.6% 26.3% 39.3 63.3 67.7 20.6% 29.8%
Geography Frames and Services 40.8 41.7 44.3 49.8 6.9% 33.3% 47.9 67.4 70.5 12.3% 33.6%
Survey Monitoring and Evaluation 16.7 17.1 18.2 20.9 7.8% 13.8% 20.8 21.7 22.9 3.1% 12.3%
Innovation and Research – – – – – – 2.0 2.1 2.2 – 0.9%
Total 123.5 126.1 130.5 149.4 6.6% 100.0% 143.8 198.2 209.0 11.8% 100.0%
Economic classification Current payments 121.6 125.5 129.0 149.1 7.0% 99.2% 143.8 197.8 208.7 11.9% 99.9%
Compensation of employees 115.0 118.5 122.7 133.9 5.2% 92.5% 131.3 167.4 174.9 9.3% 86.7%
Goods and services1
6.6 7.0 6.3 15.2 32.2% 6.6% 12.2 30.3 33.8 30.5% 13.1%
of which:
Communication 0.5 1.4 1.0 1.0 27.9% 0.7% 1.3 1.5 1.5 15.9% 0.8%
Computer services 0.7 – 1.1 1.3 23.6% 0.6% 1.3 1.2 1.3 0.2% 0.7%
Agency and support/outsourced services – – – 2.6 – 0.5% - 16.6 19.5 96.7% 5.5%
Consumables: Stationery, printing and
office supplies
0.0 0.2 0.2 0.4 110.4% 0.2% 0.8 0.7 0.8 29.8% 0.4%
Travel and subsistence 3.7 3.4 2.6 7.3 25.6% 3.2% 6.6 7.4 7.7 1.6% 4.1%
Operating payments 0.7 1.4 1.0 1.1 14.8% 0.8% 1.1 1.5 1.4 8.4% 0.7%
Transfers and subsidies1 0.4 0.0 0.4 0.0 -56.3% 0.2% – 0.1 – -100.0% – Households 0.4 0.0 0.4 0.0 -56.3% 0.2% – 0.1 – -100.0% –
Payments for capital assets 1.6 0.6 1.1 0.3 -42.8% 0.7% 0.2 0.3 0.4 6.2% 0.2% Total 123.5 126.1 130.5 149.4 6.6% 100.0% 143.8 198.2 209.0 11.8% 100.0%
1. Estimates of National Expenditure data tables can be downloaded from www.treasury.gov.za. These tables contain detailed information by goods and services, and transfers and subsidies
items by programme.

90
Personnel information
Methodology and Statistical Infrastructure personnel numbers and cost by salary level¹
Number of posts estimated for
31 March 2020 Number and cost2 of personnel posts filled/planned for on funded establishment Number
Number of
funded posts
Number of posts
additional to the
establishment Actual Revised estimate Medium-term expenditure estimate
Average growth
rate (%)
Average: Salary
level/total (%)
2018/19 2019/20 2020/21 2021/22 2022/23 2019/20 - 2022/23
Methodology and Statistical Infrastructure Number Cost
Unit cost Number Cost
Unit cost Number Cost
Unit cost Number Cost
Unit cost Number Cost
Unit cost
Salary level 230 – 196 122.7 0.6 196 133.7 0.7 183 131.3 0.7 213 167.4 0.8 202 174.9 0.9 1.0% 100.0% 1 – 6 27 – 29 5.9 0.2 21 5.5 0.3 21 5.9 0.3 27 6.8 0.3 21 6.8 0.3 – 11.3%
7 – 10 124 – 103 52.5 0.5 111 60.4 0.5 111 64.8 0.6 111 69.3 0.6 106 71.1 0.7 -1.5% 55.3%
11 – 12 48 – 38 31.1 0.8 38 34.4 0.9 25 25.0 1.0 44 46.4 1.1 44 49.3 1.1 5.0% 19.0%
13 – 16 31 – 26 33.1 1.3 26 33.5 1.3 26 35.8 1.4 31 45.0 1.5 31 47.8 1.5 6.0% 14.4%
1. Data has been provided by the department and may not necessarily reconcile with official government personnel data.
2. Rand million.
Strategic risks and mitigation
The branch has identified the following strategic risks:
Strategic risks Mitigation strategy
Failure to implement internationally adopted standards (ISIC4) may
impact on the comparability of statistical information internationally
Develop a project plan for the implementation of SIC7 in
collaboration with SARS
Reprioritise funding in 2020 to facilitate the implementation of
SIC7, the local adaptation of ISIC4
Inability to maintain and update the statistical business register
timeously due to late receipt of administrative source information
from external stakeholders leading to an incomplete sampling
frame for economic statistics
Commitment by all parties to honour the signed MoU
Strengthen collaboration between Stats SA and SARS (work
streams)
Conduct a snapshot analysis

91
2.5 Programme: Statistical Support and Informatics
Purpose: Enables statistical production through technology and promotes the use of statistics
Subprogrammes:
Communication and Marketing: manages internal and external communications in the department and maintains relations with stakeholders
across the country. Business Modernisation: improves data and information management across the department by modernising the way business is conducted,
supported by technology. Publication Services: provides editing, publishing and distribution services to survey areas. It provides electronic statistical datasets to users and
data warehousing to the department.
Information, Communication and Technology: provides technology infrastructure to the department and supports data management across
statistical series.
Analytical Studies: provides integrative statistical advice and support to policy planners and development practitioners, and participates in
knowledge research and innovation on key development themes.

92
Table 1: Outcomes, outputs, performance indicators and targets
Audited/actual performance
Estimated
performance Medium-term targets
No. Outcome Output Output indicators 2016/17 2017/18 2018/19 2019/20 2020/21 2021/22 2022/23
Programme 5: Statistical Support and Informatics (Subprogramme: Communication and Marketing)
24. Insightful data
Stats SA
branding
management
strategy
Stats SA brand
management
strategy
implemented
Compiled user
satisfaction
report and
disseminated
CS 2016
products,
Compiled user
satisfaction
report
The CRM
system was not
assessed
Compiled user
satisfaction
report
Compiled joint
statistical
publication
Develop a
dissemination
plan for
Census 2021
Evaluate
dissemination
platforms
Develop a
branding
strategy
1 Stats SA
brand
management
strategy
implemented
1 report on
Stats SAs
position
relative to
other
competitors in
the data
ecosystem
compiled
1 report on
Stats SA as a
leading
statistical
provider
within the
data
ecosystem
compiled
Transformed
capability
Report on
communication
and marketing
support for
Census 2021
pilot
Percentage of
communication
and marketing
support
provided to
Census 2021
pilot
Integration of
survey data and
geography,
access to public
data files and
monitoring
usage of CRM
system were not
done
Develop a
stakeholder
management
and
marketing
plan for
Census 2021
100%
communi-
cation and
Marketing
support to
Census 2021
pilot provided
100%
communi-
cation and
Marketing
support to
Census 2021
and PES
2021
provided
100%
communi-
cation and
Marketing
support to
dissemination
of Census
2021 and
PES 2021
provided
Table 2: Indicators, annual and quarterly targets
Quarterly targets
No. Output indicator Annual target Quarter 1 Quarter 2 Quarter 3 Quarter 4
Programme 5: Statistical Support and Informatics (Subprogramme: Communication and Marketing)
24.1 Stats SA brand management strategy implemented 1 Stats SA brand management strategy
implemented by March 2021
1
24.2 Percentage of communication and marketing
support provided to Census 2021 pilot
100% communication and marketing support
provided to Census 2021 pilot by March 2021
100%

93
Table 1: Outcomes, outputs, performance indicators and targets
Audited/actual performance
Estimated
performance Medium-term targets
No. Outcome Output Output indicators 2016/17 2017/18 2018/19 2019/20 2020/21 2021/22 2022/23
Programme 5: Statistical Support and Informatics (Subprogramme: Business Modernisation)
25. Transformed
capability
Enterprise
architecture
Number of
enterprise
architecture
domains
established
Implemented
enterprise
architecture
programme and
capability
Compiled
enterprise
architecture
report
Implemented 2
solutions to
improve
business
processes
Compiled
document on
enterprise
architecture
Research
enterprise
architecture
1 enterprise
architecture
domain
(1 of 4)
established
2 enterprise
architecture
domains
(2 of 4)
established
Applications
and systems for
Census 2021
Percentage of
applications
and systems for
Census 2021
processes
developed
Provide
systems
support to
Census 2021
100%
applications
and systems
for Census
2021
processes
developed
100%
applications
and systems
for Census
2021
processes
developed
100%
applications
and systems
for Census
2021
processes
developed
Table 2: Indicators, annual and quarterly targets
Quarterly targets
No. Output indicator Annual target Quarter 1 Quarter 2 Quarter 3 Quarter 4
Programme 5: Statistical Support and Informatics (Subprogramme: Business Modernisation)
25.1 Percentage of applications and systems for
Census 2021 processes developed
100% applications and systems for Census 2021
processes developed by March 2021
100%

94
Table 1: Outcomes, outputs, performance indicators and targets
Audited/actual performance
Estimated
performance Medium-term targets
No. Outcome Output Output indicators 2016/17 2017/18 2018/19 2019/20 2020/21 2021/22 2022/23
Programme 5: Statistical Support and Informatics (Subprogramme: Publication Services)
26. Insightful data Databases
within generic
data storage
developed and
linked to
dissemination
tools
Interface
between generic
data storage
and
dissemination
tools developed
Research on
data repository
and alternative
data delivery
channels was
not conducted
The proposal
on the
establishment of
a data
repository was
not compiled
Data delivery
channels were
not
implemented
Data
warehouse
procedures
were not
developed
Implement
data
warehouse
procedures
Research
municipal
publication
for IDP
compilation
50 databases
within generic
data storage
developed
100
databases
within generic
data storage
developed
200
databases
within generic
data storage
developed
Table 2: Indicators, annual and quarterly targets
Quarterly targets
No. Output indicator Annual target Quarter 1 Quarter 2 Quarter 3 Quarter 4
Programme 5: Statistical Support and Informatics (Subprogramme: Publication Services)
26.1 Interface between generic data storage and
dissemination tools developed
50 databases within generic data storage
developed by March 2021
50

95
Table 1: Outcomes, outputs, performance indicators and targets
Audited/actual performance
Estimated
performance Medium-term targets
No. Outcome Output Output indicators 2016/17 2017/18 2018/19 2019/20 2020/21 2021/22 2022/23
Programme 5: Statistical Support and Informatics (Subprogramme: Information Communication and Technology)
27. Transformed
capability
ICT upgrade
initiatives
Number of ICT
environment
initiatives
upgraded
ICT targets were
not achieved
Commissioned
dedicated
network
infrastructure
for digital data
collection
Implemented
ICT
infrastructure to
support digital
data collection
Developed
provincial and
district offices
ICT services
centralisation
strategy
Review
network
infrastructure
for digital
data
collection
Implement CT
services
centralisation
strategy
1 ICT
environment
initiative
upgraded
1 ICT
environment
initiative
upgraded
1 ICT
environment
initiative
upgraded
Data
governance and
management
assessment
report
Data
governance and
management
assessment
conducted
1 data
governance
and
management
assessment
conducted
1 business
proposal for
stakeholder
engagement
compiled
Census 2021
ICT
infrastructure
platforms (built
and tested)
Percentage of
Census 2021
ICT
infrastructure
platforms
provided
Develop ICT
strategy and
plan for
Census 2021
mini-test
100% Census
2021 ICT
infrastructure
platforms
provided
100% ICT
infrastructure
and platforms
maintained
for Census
2021
100% ICT
infrastructure
platforms
maintained
for Census
2021

96
Table 2: Indicators, annual and quarterly targets
Quarterly targets
No. Output indicator Annual target Quarter 1 Quarter 2 Quarter 3 Quarter 4
Programme 5: Statistical Support and Informatics (Subprogramme: Information Communication and Technology)
27.1 Number of ICT environment initiatives upgraded 1 ICT environment initiative upgraded by March
2021
1
27.2 Percentage of Census 2021 ICT infrastructure
platforms provided
100% Census 2021 ICT infrastructure platforms
provided by March 2021
100%

97
Table 1: Outcomes, outputs, performance indicators and targets
Audited/actual performance
Estimated
performance Medium-term targets
No. Outcome Output Output indicators 2016/17 2017/18 2018/19 2019/20 2020/21 2021/22 2022/23
Programme 5: Statistical Support and Informatics (Subprogramme: Analytical Studies)
28. Insightful data Spatial analysis
research reports
Research on
spatial analysis
conducted
Compiled
research reports
on improving
government’s
socio-economic
planning and
spatial analysis
Reports on
socio-
economic,
demographic
and
development
issues were not
compiled
Compiled
research reports
on improving
government’s
socio-economic
planning and
spatial analysis
Redefined
experimental
growth
accounting
framework
Compiled
research reports
on improving
government’s
socio-economic
planning and
spatial analysis
Refined
estimation
techniques of
the GAF
Compiled
reports on the
demographic
dividend
analysis
Conduct
research and
analysis on
emerging
socio-
economic
issues
Conduct
research on
spatial
analysis
2 research
reports on
spatial
analysis
compiled
2 research
reports on
spatial
analysis
compiled
2 research
reports on
spatial
analysis
compiled
Table 2: Indicators, annual and quarterly targets
Quarterly targets
No. Output indicator Annual target Quarter 1 Quarter 2 Quarter 3 Quarter 4
Programme 5: Statistical Support and Informatics (Subprogramme: Analytical Studies)
28.1 Research on spatial analysis conducted 2 research reports on spatial analysis compiled by
March 2021
2

98
Programme 5: Explanation on planned performance
Insightful data: The programme exists to utilise technology to optimise the data ecosystems to service current user needs and to meet unmet user
needs as defined in the integrated indicator framework (IIF) from potential users. Key outputs to achieve insightful data include the implementation
of the branding strategy which aims to place stakeholders at the centre of our operations by delivering products and services that are in line with
user requirements; developing innovative communication products to create a better understanding and insight into data and statistics; and to
compile specialised research reports and knowledge products for better insights into planning and policy development processes.
Transformed capability: The programme provides the technology backbone in the form of an enterprise architecture (EA) that is able to anticipate
growing demand and will have the foresight to increase capacity when required and to scale down to save costs based on system requirements.
A well-designed EA provides an organisation with an environment that allows easy and faster adoption of newer technologies while supporting
smooth organisational transformation. An EA offers dexterity, effectiveness and robustness in unifying and coordinating different foundational
aspects of an organisation, from planning and prioritising to identifying and managing interdependencies, risks and enabling governance. It
amalgamates and integrates the organisation’s fundamental elements in order to streamline efforts, reduce costs and bring about the required
value in the shortest timespan possible.
The exponential growth of the digital world has impacted on how organisations carry out their business and those who do not adapt are
guaranteed to face difficulties and possible cease of business altogether. In order for Stats SA to keep up with this digital growth and possibilities,
the ICT infrastructure and staff need to keep abreast with capacity and skills required to enable the organisation to prosper in a mul tiple data
ecosystem environment. Investments in digital capability will also focus on ensuring that staff members are equipped with the necessary capabilities
to learn, live and work in the digital society.
Resource allocation
The primary cost driver is expenditure on compensation of employees. Within the remaining goods and services budget, the primary cost drivers
relate to communication, data costs and training costs.

99
Expenditure trends and estimates
Statistical Support and Informatics expenditure trends and estimates by subprogramme and economic classification Subprogramme
Audited outcome Adjusted
appropriation
Average growth
rate (%)
Average: Expen- diture/
total (%)
Medium-term expenditure estimate
Average growth
rate (%)
Average: Expen- diture/
total (%)
R million 2016/17 2017/18 2018/19 2019/20 2016/17 - 2019/20
Special Adjusted
Appropriation 2020/21 2021/22 2022/23 2019/20 - 2022/23
Programme Management for Statistical
Support and Informatics
10.3 10.2 10.1 12.0 5.4% 4.2% 14.3 15.2 16.0 9.9% 4.8%
Communication and Marketing 36.0 37.9 38.0 42.2 5.4% 15.1% 34.9 37.1 39.0 -2.6% 12.9%
Business Modernisation 47.7 49.7 47.7 55.1 4.9% 19.6% 52.3 55.9 59.2 2.5% 18.7%
Publication Services 20.2 23.2 23.6 28.9 12.8% 9.4% 34.7 36.4 38.8 10.3% 11.7%
Information, Communication and
Technology
135.1 118.8 128.9 143.5 2.0% 51.6% 145.3 156.7 171.1 6.0% 51.9%
Total 249.3 239.8 248.3 281.7 4.2% 100.0% 281.5 301.3 324.1 4.8% 100.0%
Economic classification
Current payments 221.9 219.9 223.6 257.5 5.1% 90.6% 263.5 286.9 308.6 6.2% 93.9% Compensation of employees 127.8 133.0 137.2 145.5 4.4% 53.3% 144.0 159.2 166.4 4.6% 51.7%
Goods and services1
94.2 86.9 86.4 112.0 5.9% 37.2% 119.5 127.7 142.1 8.3% 42.2%
of which:
Communication 4.0 4.9 2.3 2.2 -17.7% 1.3% 0.8 1.0 1.2 -18.0% 0.4%
Computer services 80.2 70.8 73.8 90.0 3.9% 30.9% 107.1 110.1 122.6 10.8% 36.2%
Contractors 3.6 4.2 3.7 6.7 23.8% 1.8% 3.6 7.2 7.7 4.4% 2.1 %
Agency and support/outsourced
services
0.6 0.7 0.9 1.1 23.0% 0.3% 0.7 0.7 0.8 -11.6% 0.3%
Travel and subsistence 2.7 2.2 1.5 2.7 0.5% 0.9% 2.6 3.4 4.1 14.5% 1.1%
Operating payments 1.4 2.3 2.7 3.1 29.3% 0.9% 2.1 2.6 2.7 -4.1% 0.9%
Transfers and subsidies1 0.1 0.3 0.1 0.1 14.9% 0.1% – – – -100.0% –
Departmental agencies and accounts 0.0 0.0 0.0 – -100.0% – – – – – –
Households 0.1 0.3 0.1 0.1 18.6% 0.1% – – – -100.0% –
Payments for capital assets 27.3 19.6 20.4 24.1 -4.0% 9.0% 18.1 14.4 15.6 -13.6% 6.1% Machinery and equipment 24.9 14.1 16.3 17.9 -10.4% 7.2% 16.5 13.7 14.9 -5.9% 5.3%
Software and other intangible assets 2.4 5.5 4.0 6.2 37.7% 1.8% 1.6 0.6 0.6 -53.2% 0.8%
Payments for financial assets – – 4.2 – – 0.4% – – – – –
Total 249.3 239.8 248.3 281.7 4.2% 100.0% 281.5 301.3 324.1 4.8% 100.0%
1. Estimates of National Expenditure data tables can be downloaded from www.treasury.gov.za. These tables contain detailed information by goods and services, and transfers and subsidies items by
programme.

100
Personnel information
Statistical Support and Informatics personnel numbers and cost by salary level¹
Number of posts estimated for
31 March 2020 Number and cost2 of personnel posts filled/planned for on funded establishment Number
Number of
funded posts
Number of posts
additional to the
establishment Actual Revised estimate Medium-term expenditure estimate
Average growth
rate (%)
Average: Salary
level/total (%)
2018/19 2019/20 2020/21 2021/22 2022/23 2019/20 - 2022/23
Statistical Support and Informatics Number Cost Unit cost Number Cost
Unit cost Number Cost
Unit cost Number Cost
Unit cost Number Cost
Unit cost
Salary level 236 – 208 137.2 0.7 198 145.2 0.7 186 144.0 0.8 198 159.2 0.8 196 166.4 0.8 -0.3% 100.0%
1 – 6 38 – 40 9.3 0.2 32 9.2 0.3 35 10.4 0.3 42 13.7 0.3 44 15.3 0.3 11.2% 19.7%
7 – 10 94 – 80 43.6 0.5 78 46.0 0.6 68 41.5 0.6 73 47.4 0.6 73 50.7 0.7 -2.2% 37.5%
11 – 12 69 – 59 50.5 0.9 59 52.9 0.9 50 46.5 0.9 50 49.6 1.0 46 48.7 1.1 -8.0% 26.3%
13 – 16 35 – 29 33.8 1.2 29 37.0 1.3 33 45.6 1.4 33 48.6 1.5 33 51.6 1.6 4.4% 16.5%
1. Data has been provided by the department and may not necessarily reconcile with official government personnel data.
2. Rand million.
Strategic risks and mitigation
Programme 5 has identified the following strategic risks:
Strategic risks Mitigation strategy
Unreliable SITA services Continue with the engagements in an attempt to remedy the situation
Consider excluding other services from the current SITA contract with the
organisation and obtain them from other independent service providers
Incomplete enterprise architecture Employ the necessary skills to fast track the development of a holistic
and integrated architecture
The risk that the low public trust in government whose corporate
identity Stats SA shares negatively affects our trusted and
independence position
Elevate Stats SA’s media profile and public image as a scientific and
professionally independent organisation
The risk that a lack of resources to advertise the Stats SA
corporate brand results in poor corporate brand awareness and
identification
Elevate the Stats SA corporate brand in all Census 2021 paid-for
advertising
Maximise free publicity opportunities in the media and community
engagements and innovate our marketing and communication channels
The risk that inconsistent brand application across our extensive
national footprint of offices and fieldwork staff leads to confusion
amongst stakeholders and impacts negatively on the Stats SA
brand
Implement the standardised Stats SA corporate brand across all office
buildings, including fieldwork gear

101
2.6 Programme: Statistical Operations and Provincial Coordination
Purpose: Collects and processes data, and interacts with stakeholders and users at provincial and local levels
Subprogrammes:
Provincial and District Offices: provides integrated data collection and dissemination services, and promotes the use and coordination of
official statistics to provincial and local stakeholders. Data Operations: manages the editing and data operations for processing. Coordinates data processing of censuses, household surveys, civil
registration and ad-hoc surveys. Household Surveys and Censuses: coordinates and integrates collection activities across surveys and conducts periodic population censuses
or large-scale population surveys.

102
Table 1: Outcomes, outputs, performance indicators and targets
Audited/actual performance
Estimated
performance Medium-term targets
No. Outcome Output Output indicators 2016/17 2017/18 2018/19 2019/20 2020/21 2021/22 2022/23
Programme 6: Statistical Operations and Provincial Coordination (Subprogramme: Provinces)
29. Agile operating
model
Integrated
fieldwork model
Document on
integrated
fieldwork to
streamline
statistical
operations
finalised
Conducted:
QLFS - 92,4%
GHS - 92,1%
DTS - 82,5%
VOCS - 92,9%
Conducted
QLFS with an
average
response rate of
92%
Conducted
household
surveys with an
average
response rate of
92%
Conducted
QLFS with an
average
response rate of
92%
Conducted
CDC with an
average
response rate of
92%
Provincial plans
for Census
2021 were not
compiled
Conduct
integrated
fieldwork
Conduct
integrated
communi-
cation,
marketing
and publicity
Compile
provincial
plan for
Census 2021
1 proposal
for integrated
fieldwork to
streamline
statistical
operations
compiled
1 proposal
for integrated
fieldwork to
streamline
statistical
operations
approved
1 integrated
fieldwork
approach
piloted
1 fieldwork
model
adopted
Population
Census 2021
pilot
Census 2021
pilot data
collection
conducted
9 reports on
data
collection for
Population
Census 2021
pilot
compiled
9 reports on
data
collection for
Population
Census 2021
compiled
9 reports on
Census 2021
results
disseminated

103
Table 2: Indicators, annual and quarterly targets (Provincial Offices)
Quarterly targets
No. Output indicator Annual target Quarter 1 Quarter 2 Quarter 3 Quarter 4
Programme 6: Statistical Operations and Provincial Coordination (Subprogramme: Provinces)
29.1 Document on integrated fieldwork to streamline
statistical operations finalised
1 proposal for integrated fieldwork to streamline
statistical operations compiled by March 2021
1
29.2 Census 2021 pilot data collection conducted 9 reports on Census 2021 pilot data collection
compiled by March 2021
9

104
Table 1: Outcomes, outputs, performance indicators and targets
Audited/actual performance
Estimated
performance Medium-term targets
No. Outcome Output Output indicators 2016/17 2017/18 2018/19 2019/20 2020/21 2021/22 2022/23
Programme 6: Statistical Operations and Provincial Coordination (Subprogramme: Data Operations)
30. Agile operating
model
Concept note
on multimode
data operation
approaches
Research on
multimode data
operation
approaches
conducted
Digital data
collection for
household
surveys was not
piloted
Compiled
report on
processing
Community
Survey data
using new
technology
Compiled
report on
implementation
of Phase 1 of
digital data
collection
Compiled
report on
implementation
of digital data
collection
Prepare for
Census 2021
processing
Process
additional
administrative
sources (user
paid)
1 concept
note on
multimode
data
operations
approaches
compiled
1 business
processes
tested
1 multimode
data
operations
Phase 1
implemented
Transformed
capability
Data processing
report
Data processing
support to
Census 2021
pilot
1 Report on
Census 2021
pilot data
processed
1 report on
Census 2021
pilot data
processed
1 report on
Census 2021
main and PES
data processed
1 report on
Census 2021
main data
processed
Table 2: Indicators, annual and quarterly targets
Quarterly targets
No. Output indicator Annual target Quarter 1 Quarter 2 Quarter 3 Quarter 4
Programme 6: Statistical Operations and Provincial Coordination (Subprogramme: Data Operations)
30.1 Research on multimode data operation
approaches conducted
1 concept note on multimode data operation
approaches compiled by March 2021
1
30.2 Data processing support to Census 2021 pilot 1 report on Census 2021 pilot data processed by
March 2021
1

105
Table 1: Outcomes, outputs, performance indicators and targets
Audited/actual performance
Estimated
performance Medium-term targets
No. Outcome Output Output indicators 2016/17 2017/18 2018/19 2019/20 2020/21 2021/22 2022/23
Programme 6: Statistical Operations and Provincial Coordination (Subprogramme: Household Surveys and Censuses)
31. Agile operating
model
National
Census 2021
pilot
National
Census 2021
pilot
coordinated
Report on
collaborating
and partnering
in design of
innovative data
collection
methodologies
for census was
not done
Compiled
research reports
on the dwelling
frame, ‘Reach-
out’ interview
design test and
field operation
methodology
Compiled
reports on new
methodologies
on data
collection,
training,
logistics, and
publicity and
advocacy
Compiled field
operations
quality plan for
Census 2021
test
Conduct
Census 2021
mini-test
Compile
plans for
Census 2021
pilot
Compile
report on
Census 2021
mini-test
1 national
debriefing
report on
Census 2021
pilot
compiled
1 national
debriefing
report on
Census 2021
compiled
100% Census
2021 field
operations
evaluated
1 research
report on
innovations
for the
upcoming
Census and
community
survey
compiled
National report
on digital data
collection for
household
surveys
National report
on digital data
collection for
household
surveys
compiled
1 national
report on
digital data
collection for
household
surveys
compiled
100% digital
data
collection for
all household
surveys
through CAPI
conducted
1 quality
assurance
tool
developed
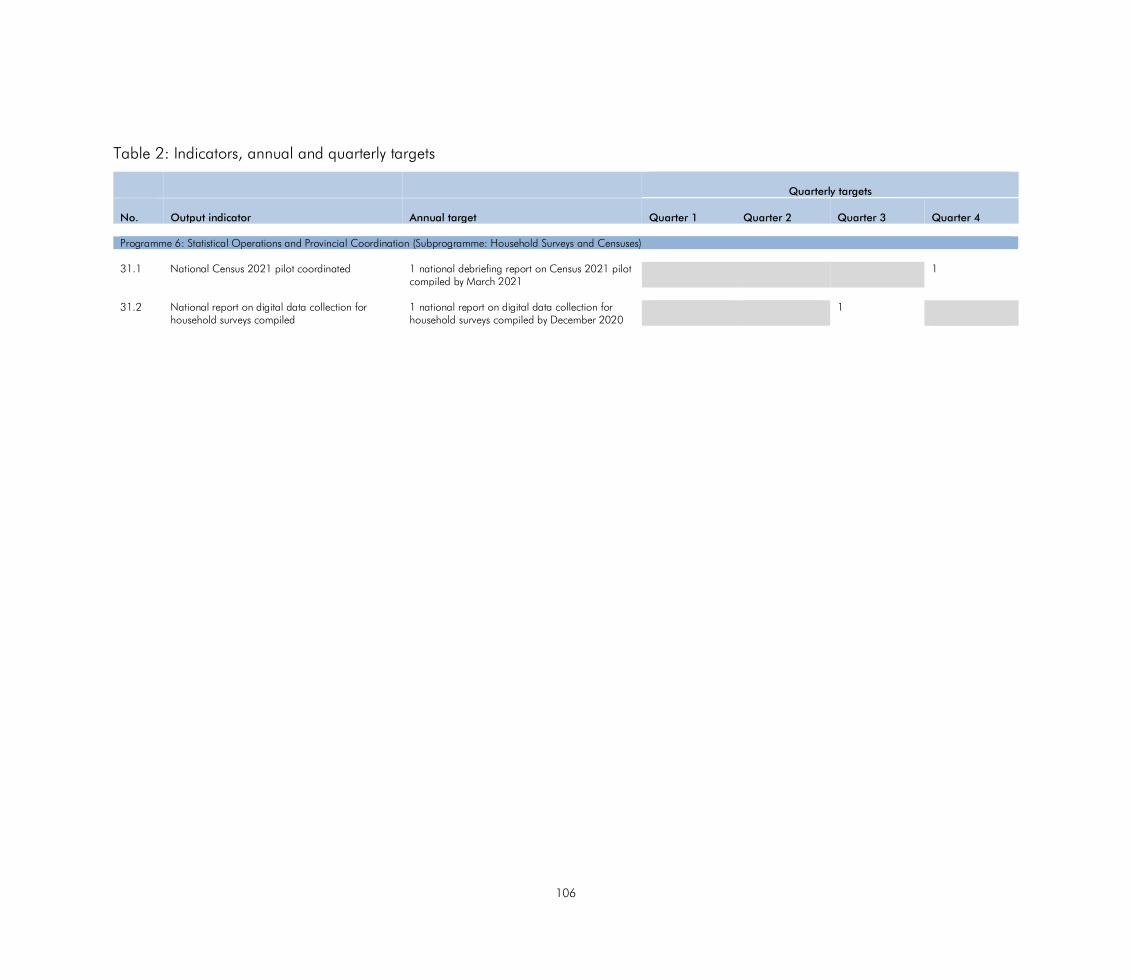
106
Table 2: Indicators, annual and quarterly targets
Quarterly targets
No. Output indicator Annual target Quarter 1 Quarter 2 Quarter 3 Quarter 4
Programme 6: Statistical Operations and Provincial Coordination (Subprogramme: Household Surveys and Censuses)
31.1 National Census 2021 pilot coordinated 1 national debriefing report on Census 2021 pilot
compiled by March 2021
1
31.2 National report on digital data collection for
household surveys compiled
1 national report on digital data collection for
household surveys compiled by December 2020
1

107
Programme 6: Explanation on planned performance
The strategic intent of the Statistical Operations branch within the data ecosystem is mainly that of well-coordinated, quality-assured data
collection and dissemination of statistical information, where 100% of household surveys and population census collections are technology-
driven and all fieldwork staff are reskilled in the use of new technology by 2025.
The key strategic priority and output of this programme is to pilot the census in October 2020 and conduct the population census in October
2021. The statistical outputs of the census forms the baseline of the statistical information system in the country and provides the most
comprehensive statistics at the lowest geographic level to provide insights on various socio-economic phenomena. This programme’s contribution
is to drive agile statistical household operations at national, provincial and local levels by employing multimode data collection methodologies
that are technology driven.
Resource allocation
The primary cost driver is expenditure on compensation of employees. Within the remaining goods and services budget, the primary cost drivers
relate to fleet, communication, and travel and subsistence.

108
Expenditure trends and estimates
Statistical Operations and Provincial Coordination expenditure trends and estimates by subprogramme and economic classification Subprogramme
Audited outcome Adjusted
appropriation
Average growth
rate (%)
Average: Expen- diture/
total (%)
Medium-term expenditure estimate
Average growth
rate (%)
Average: Expen- diture/
total (%)
R million 2016/17 2017/18 2018/19 2019/20 2016/17 - 2019/20
Special Adjusted
Appropriation 2020/21 2021/22 2022/23 2019/20 - 2022/23
Programme Management for Statistical
Operations and Provincial
Coordination
8.4 6.5 3.4 9.3 3.4% 0.8% 7.6 7.5 7.9 -5.5% 0.5%
Provincial and District Offices 578.7 591.4 614.2 639.1 3.4% 68.6% 692.9 720.0 759.0 5.9% 42.0%
Data Operations 74.9 81.0 83.0 81.9 3.0% 9.1% 96.8 102.5 107.4 9.5% 5.8%
Household Survey and Censuses 399.0 84.6 72.5 205.7 -19.8% 21.6% 916.6 2 272.0 74.2 -28.8% 51.8%
Total 1 061.0 763.4 773.1 935.9 -4.1% 100.0% 1 713.9 3 102.0 948.5 0.4% 100.0%
Economic classification
Current payments 1 037.6 750.0 767.1 846.3 -6.6% 96.2% 1 683.9 3 083.3 944.0 3.7% 97.9%
Compensation of employees 582.7 595.6 617.3 624.2 2.3% 68.5% 748.9 769.9 782.3 7.8% 43.7%
Goods and services1
454.9 154.4 149.8 222.1 -21.3% 27.8% 934.9 2 313.4 161.7 -10.0% 54.2%
of which:
Advertising 6.1 0.2 0.1 4.5 -9.8% 0.3% 55.2 254.8 0.9 -40.7% 4.7%
Minor assets 32.0 0.1 0.1 2.2 -58.8% 1.0% 649.0 0.8 0.3 -50.3% 9.7%
Catering: Departmental activities 2.5 1.1 0.9 6.1 35.1% 0.3% 3.7 110.4 2.5 -25.8% 1.8%
Agency and support/outsourced
services
130.0 0.0 0.4 33.7 -36.2% 4.6% 7.9 1 276.1 0.0 -91.9% 19.7%
Operating leases 55.2 64.4 67.9 69.6 8.1% 7.3% 69.0 106.0 79.6 4.6% 4.8%
Travel and subsistence 147.2 26.7 26.9 43.8 -33.2% 6.9% 50.0 246.3 27.9 -14.0% 5.5%
Subprogramme
Audited outcome Adjusted
appropriation
Average growth
rate (%)
Average: Expen- diture/
total (%)
Medium-term expenditure estimate
Average growth
rate (%)
Average: Expen- diture/
total (%)
R million 2016/17 2017/18 2018/19 2019/20 2016/17 - 2019/20
Special Adjusted
Appropriation 2020/21 2021/22 2022/23 2019/20 - 2022/23
Transfers and subsidies1 1.9 2.3 1.9 1.6 -5.8% 0.2% 0.2 4.2 0.1 -56.7% 0.1% Departmental agencies and accounts 0.0 0.0 0.0 0.0 – – 0.0 0.0 0.0 – –
Public corporations and private
enterprises
0.0 – – – -100.0% – – – – – –
Households 1.9 2.3 1.9 1.6 -5.3% 0.2% 0.2 4.2 0.1 -56.8% 0.1%
Payments for capital assets 21.5 11.1 4.1 88.0 59.9% 3.5% 29.9 14.5 4.4 -63.2% 2.0%
Machinery and equipment 21.3 5.2 4.1 60.0 41.2% 2.6% 21.3 14.5 4.4 -58.2% 1.5%
Software and other intangible assets 0.2 5.9 – 28.0 394.6% 1.0% 8.6 – – -100.0% 0.5%
Total 1 061.0 763.4 773.1 935.9 -4.1% 100.0% 1 713.9 3 102.0 948.5 0.4% 100.0%
Details of transfers and subsidies
Households Social benefits Current 1.8 1.5 1.7 1.5 -5.8% 0.2% 0.2 4.0 0.1 -56.1% 0.1% Employee social benefits 1.8 1.5 1.7 1.5 -5.8% 0.2% 0.2 4.0 0.1 -56.1% 0.1%
1. Estimates of National Expenditure data tables can be downloaded from www.treasury.gov.za. These tables contain detailed information by goods and services, and transfers and subsidies items by
programme.

109
Personnel information
Statistical Operations and Provincial Coordination personnel numbers and cost by salary level¹
Number of posts estimated for
31 March 2020 Number and cost2 of personnel posts filled/planned for on funded establishment Number
Number of
funded posts
Number of posts
additional to the
establishment Actual Revised estimate Medium-term expenditure estimate
Average growth
rate (%)
Average: Salary
level/total (%)
2018/19 2019/20 2020/21 2021/22 2022/23 2019/20 - 2022/23
Statistical Operations and Provincial Coordination Number Cost
Unit cost Number Cost
Unit cost Number Cost
Unit cost Number Cost
Unit cost Number Cost
Unit cost
Salary level 1 535 – 1 390 617.3 0.4 1 303 624.2 0.5 1 457 748.9 0.5 1 427 769.9 0.5 1 370 782.3 0.6 1.7% 100.0% 1 – 6 885 – 830 244.8 0.3 823 266.2 0.3 885 308.9 0.3 913 343.0 0.4 903 363.9 0.4 3.1% 63.4%
7 – 10 430 – 379 197.4 0.5 299 172.2 0.6 404 256.0 0.6 333 215.9 0.6 286 194.1 0.7 -1.5% 23.8%
11 – 12 167 – 136 119.8 0.9 136 129.5 1.0 116 114.5 1.0 136 147.1 1.1 136 156.4 1.1 – 9.4%
13 – 16 53 – 45 55.4 1.2 45 56.3 1.3 52 69.4 1.3 45 63.9 1.4 45 67.9 1.5 – 3.4%
1. Data has been provided by the department and may not necessarily reconcile with official government personnel data.
2. Rand million.
Strategic risks and mitigation
Programme 6 has identified the following strategic risks:
Strategic risks Mitigation strategy
Business continuity: Lack of business continuity in the event of disaster or
disruption
Define and outline business continuity/disaster recovery plan
Business operations: Outdated structure and high number of vacancies Ad hoc projects to provide adequate resources to support contract positions to
fill critical vacancies
Geographic information: Geographic frame not updated to support
operations
Frame update plan with Geography (accurate updating of frames)
Integrated digital fieldwork: Change management of CAPI transition and
integrating operations
Staff consultation and facilitation of change process
Fieldwork planning integrated across projects (training)
CAPI standard operating procedures
Statistical information: Lack of relevant, accurate data that meets
provincial and municipal stakeholder needs
Facilitate organisational response to failures in responsiveness
Align SSI plans to prioritise municipal, OTP and legislature partnerships
Census 2021: Failure to achieve the objectives of Census 2021 Conduct Census 2021 mini-test and pilot to ensure that the processes and
methodologies are thoroughly tested and adjusted accordingly
Implement the Census 2021 operational risk plan and monitor progress
quarterly

110
2.7 Programme: South African National Statistics System
Purpose: Develops and coordinates the national statistics system in South Africa
Subprogrammes:
Economic Subsystem: coordinates the production of economic and environmental statistics amongst entities on the national statistics system.
Social Subsystem: coordinates the production of social, governance, peace, justice and security statistics amongst entities on the national
statistics system. Independent Quality Assessment: assesses the quality of statistics of data producers and designates as official Statistical Reporting: coordinates the reporting of statistics in fulfilment of the country’s reporting obligations.
Data and Information: coordinates and manages the transfer and sharing of data amongst entities on the national statistics system.

111
Table 1: Outcomes, Outputs, Performance Indicators and Targets
Audited/actual performance
Estimated
performance Medium-term targets
No. Outcome Output Output Indicators 2016/17 2017/18 2018/19 2019/20 2020/21 2021/22 2022/23
Programme 7: South African National Statistics System (Subprogramme: Economic Subsystem)
32. Insightful data
Clearance
report for
economic
statistics
subsystem
Integrated
indicator
framework (IIF)
Clearance
report for
economic
statistics
subsystem
compiled
Integrated
indicator
framework (IIF)
for economic
statistics
subsystem
reviewed
Memorandum
of
Understanding
(MoU)/Service
Level
Agreement
(SLA) for
economic
statistics
subsystem
signed
The NSDS was
not developed
Implemented
protocol for
SAPS
Applied
SASQAF Lite in
the SA Police
Service and the
Department of
Science and
Technology
The strategy
and plan was
not developed
The NSDS was
not developed
Applied
clearance
protocols to
surveys from the
DST and the
SAPS
Applied
SASQAF Lite to
surveys from the
DST and SAPS
Compiled
consolidated
reports on
economic and
social
subsystem
activities
Applied
clearance
protocol to the
Research and
Development
Survey from the
DST
Applied
SASQAF Lite to
SAPS and
RTMC
Apply the
‘clearance’
protocol
Apply
SASQAF Lite
to relevant
data
Formalise
partnership
and
coordination
through
MoUs/SLAs
1 clearance
report for
economic
statistics
subsystem
compiled
1 integrated
indicator
framework
(IIF) for
economic
statistics
subsystem
reviewed
1 MoU/SLA
for economic
statistics
subsystem
signed
1 clearance
report for
economic
statistics
subsystem
compiled
1 integrated
indicator
framework
(IIF) for
economic
statistics
subsystem
reviewed
1 MoU/SLA
for economic
statistics
subsystem
signed
1 clearance
report for
economic
statistics
subsystem
compiled
1 integrated
indicator
framework
(IIF) for
economic
statistics
subsystem
reviewed
1 MoU/SLA
for economic
statistics
subsystem
signed
Interconnected
statistical system
Economic
statistics sector
plan
Economic
statistics sector
plan developed
1 sector plan
on economic
statistics
subsystem
developed
1 research
report on
NSDS
compiled

112
Table 2: Indicators, Annual and Quarterly Targets
Quarterly targets
No. Output indicator Annual target Quarter 1 Quarter 2 Quarter 3 Quarter 4
Programme 7: South African National Statistics System (Subprogramme: Economic Subsystem)
32.1 Clearance report for economic statistics subsystem
compiled
1 clearance report for economic statistics
subsystem compiled by March 2021
1
32.2 Integrated indicator framework (IIF) for economic
statistics subsystem reviewed
1 integrated indicator framework (IIF) for
economic statistics subsystem reviewed by March
2021
1
32.3
Memorandum of Understanding MoU/SLA for
economic statistics subsystem signed
1 MoU/SLA for economic statistics subsystem
signed by March 2021
1

113
Table 1: Outcomes, Outputs, Performance Indicators and Targets
Audited/actual performance
Estimated
performance Medium-term targets
No. Outcome Output Output Indicators 2016/17 2017/18 2018/19 2019/20 2020/21 2021/22 2022/23
Programme 7: South African National Statistics System (Subprogramme: Social Subsystem)
33. Insightful data
Clearance
report for social
statistics
subsystem
Integrated
indicator
framework (IIF)
for social
statistics
subsystem
Clearance
report for social
statistics
subsystem
compiled
Integrated
indicator
framework (IIF)
for social
statistics
subsystem
reviewed
(MoU)/SLA for
social statistics
subsystem
signed
The NSDS was
not developed
Implemented
protocol for
SAPS
Applied
SASQAF Lite in
the SAPS and
Department of
Science and
Technology
The strategy
and plan was
not developed
The NSDS was
not developed
Applied
clearance
protocols to
surveys from the
DST and the
SAPS
Applied
SASQAF Lite to
surveys from the
DST and SAPS
Applied
clearance
protocol to the
Research and
Development
Survey from the
DST
Applied
SASQAF Lite to
SAPS and
RTMC
Apply the
‘clearance’
protocol
Apply
SASQAF Lite
to relevant
data
Formalise
partnership
and
coordination
through
MoUs/SLAs
1 clearance
report for
social
statistics
subsystem
compiled
1 integrated
indicator
framework
(IIF) for social
statistics
subsystem
reviewed
1 MoU/SLA
for social
statistics
subsystem
signed
1 clearance
report for
social
statistics
subsystem
compiled
1 integrated
indicator
framework
(IIF) for social
statistics
subsystem
reviewed
1 MoU/SLA
for social
statistics
subsystem
signed
1 clearance
report for
social
statistics
subsystem
compiled
1 integrated
indicator
framework
(IIF) for social
statistics
subsystem
reviewed
1 MoU/SLA
for social
statistics
subsystem
signed
Interconnected
statistical system
Social statistics
sector plan
Social statistics
sector plan
developed
1 sector plan
on social
statistics
subsystem
developed
1 research
report on
NSDS
compiled

114
Table 2: Indicators, Annual and Quarterly Targets
Quarterly targets
No. Output indicator Annual target Quarter 1 Quarter 2 Quarter 3 Quarter 4
Programme 7: South African National Statistics System (Subprogramme: Social Subsystems)
33.1 Clearance report for social statistics subsystem
compiled
1 clearance report for social statistics subsystem
compiled by March 2021
1
33.2 Integrated indicator framework (IIF) for social
statistics subsystem reviewed
1 integrated indicator framework (IIF) for social
statistics subsystem reviewed by March 2021
1
33.3 Memorandum of Understanding MoU/SLA for
social statistics subsystem signed
1 /SLA for social statistics subsystem signed by
March 2021
1

115
Table 1: Outcomes, outputs, performance indicators and targets
Audited/actual performance
Estimated
performance Medium-term targets
No. Outcome Output Output indicators 2016/17 2017/18 2018/19 2019/20 2020/21 2021/22 2022/23
Programme 7: South African National Statistics System (Subprogramme: Independent Quality Assessment)
34. Insightful data Quality
assessment
Quality
assessment
conducted
Published
guidelines and
handbook for
independent
assessments
Compiled
report on
implementing a
SASQAF roll-
out strategy and
plan
Reviewed
SASQAF
Compiled
SASQAF quality
statements for
the IES and
Crime Statistics
Developed
proposal for
modernising the
assessment
process
Produce 2
SASQAF
quality
statements
Review
SAAQAF
Test
automated
assessment
system
1 SASQAF
statement
compiled
1 SASQAF
statement
compiled
1 quality
assessment
(applying
SASQAF
edition 3)
conducted
SASQAF review
SASQAF
reviewed
Review
SASQAF
(edition 3
version 1)
1 SASQAF
(edition 3
version 2)
reviewed
1 SASQAF
(edition 3
version 2)
piloted
1 SASQAF for
administrative
data sources
developed
Table 2: Indicators, annual and quarterly targets
Quarterly targets
No. Output indicator Annual target Quarter 1 Quarter 2 Quarter 3 Quarter 4
Programme 7: South African National Statistics System (Subprogramme: Independent Quality Assessment)
34.1 Quality assessment conducted
1 SASQAF statement compiled by March 2021 1
34.2 SASQAF reviewed
1 SASQAF (edition 3 version 2) reviewed by
March 2021
1

116
Table 1: Outcomes, outputs, performance indicators and targets
Audited/actual performance
Estimated
performance Medium-term targets
No. Outcome Output Output indicators 2016/17 2017/18 2018/19 2019/20 2020/21 2021/22 2022/23
Programme 7: South African National Statistics System (Subprogramme: Statistical Reporting)
35. Insightful data Integrated
indicator
framework
Integrated
indicator
framework
updated
Compiled
report on SDG
indicators
Compiled
report on SDG
indicators
Implemented
protocols for
the
development,
compliance and
reporting of
indicators
through the
SDG reporting
process
Compiled
report on SDG
indicators
Maintained
protocols for
the
development,
compliance and
reporting of
indicators
Updated
integrated
indicator
framework
Update and
refine
integrated
indicator
framework
1 integrated
indicator
framework
updated
1 integrated
indicator
framework
updated
Interconnected
statistical
systems
Draft Bill
submitted for
approval
Number of
reports on
legislative
reform
compiled
Consultation
with
international
statistical
agencies is in
progress for a
draft
Amendment Bill
Work has not
yet commenced
on regulations
to roll out the
Statistics Act
and the strategy
Amendments to
statistics
legislations
were not
finalised
A draft Bill on
legislative
changes was
not submitted to
Parliament
Compile report
on progress
with
implementation
of changes
1 report on
legislative
reform
compiled

117
Table 2: Indicators, annual and quarterly targets
Quarterly targets
No. Output indicator Annual target Quarter 1 Quarter 2 Quarter 3 Quarter 4
Programme 7: South African National Statistics System (Subprogramme: Statistical Reporting)
35.1 Number of reports on legislative reform compiled 1 report on legislative reform compiled by March
2021
1

118
Table 1: Outcomes, outputs, performance indicators and targets
Audited/actual performance
Estimated
performance Medium-term targets
No. Outcome Output Output indicators 2016/17 2017/18 2018/19 2019/20 2020/21 2021/22 2022/23
Programme 7: South African National Statistics System (Subprogramme: Data and Information Management))
36. Insightful data Integrated
indicator
framework (IIF)
dissemination
portal
IIF
dissemination
portal
implemented
Signed
agreements with
SAPS and the
DST
Developed data
repository
Compiled
reports on
expanding the
use of the e-
data transfer
and
dissemination
tools
Piloted data
repository
Expanded the
use of the e-
data transfer
and
dissemination
tools amongst
SANSS partners
Developed
strategy and
protocol on
data sharing
Expanded e-
data transfer
and
dissemination
tools amongst
SANSS partners
Develop
strategy and
protocol for
data sharing
1 IIF
dissemination
portal
implemented
1 IIF
dissemination
portal
updated
1 IIF
dissemination
portal
updated
Online system
for SASQAF
self-assessment
Online system
for SASQAF
self-assessment
developed
1 online
system for
SASQAF self-
assessment
developed
1 online
system for
SASQAF self-
assessment
developed
1 online
system for
SASQAF self-
assessment
developed
Table 2: Indicators, annual and quarterly targets
Quarterly targets
No. Output indicator Annual target Quarter 1 Quarter 2 Quarter 3 Quarter 4
Programme 7: South African National Statistics System (Subprogramme: Data and Information Management)
36.1 IIF dissemination portal implemented 1 IIF dissemination portal implemented by March
2021
1
36.2 Online system for SASQAF self-assessment
developed
1 online system for SASQAF self-assessment
developed by March 2021
1

119
Programme 7: SANSS – Explanation on planned performance
Partnerships with all actors in the data ecosystem are essential to realise the full benefits of the data revolution and modernised national statistics
systems. The statistics system is composed of entities of the NSS which must subscribe to governance and ethical principles for all producers of
statistics. Additionally, insofar as production activities are concerned, all entities of the NSS subscribe to standards and frameworks as directed
by the SG under the mandate of the Statistics Act. The integrated indicator framework (IIF) is a tool to promote coordination among producers
of official and other statistics in order to advance quality, comparability and optimum use of official statistics. It is also a key contributor to the
achievement of the interconnected statistics system. Increasing the number of frameworks within the IIF will expand the indicators of national
importance that comply with statistical principles as directed by the SG. Once fully developed, the IIF will be able to ascertain what the information
gap is in the statistics system. The development and implementation of the National Strategy for Development of Statistics (NSDS) will build
capacity and strengthen coordination amongst entities of the NSS. Through the NSDS, NSS entities will be able to set up statistical units and
compile annual statistical plans informed by the IIF. All data that will be used to report on the IIF will be taken through a quality assessment
process using the South African Statistical Quality Assessment Framework (SASQAF). The latter is used as a framework for designating statistics
as official by the Statistician-General as per his mandate in the Statistics Act.
Through the NSDS, the technical support that will be given to entities of the NSS and the implementation of the IIF, the coordination part of the
Statistics Act will be fully realised. The online platforms that will be used for assessments and reporting on development frameworks will ensure
there is access to data towards the achievement of priorities of women, children and people with disabilities.
Resource allocation
The primary cost driver is expenditure on compensation of employees. Within the remaining goods and services budget, the primary cost drivers
relate to communication, data costs and training costs.

120
Expenditure trends and estimates
South African National Statistics System expenditure trends and estimates by subprogramme and economic classification Subprogramme
Audited outcome Adjusted
appropriation
Average growth
rate (%)
Average: Expen- diture/
total (%)
Medium-term expenditure estimate
Average growth
rate (%)
Average: Expen- diture/
total (%)
R million 2016/17 2017/18 2018/19 2019/20 2016/17 - 2019/20
Special Adjusted
Appropriation 2020/21 2021/22 2022/23 2019/20 - 2022/23
Programme Management for South
African National Statistics System
6.2 5.6 5.4 7.9 8.3% 22.6% 10.2 10.9 11.3 12.6% 24.1%
Economic Subsystem 3.0 2.8 3.0 3.5 5.9% 11.0% 5.5 5.7 6.0 19.5% 12.4%
Social Subsystem 6.2 5.8 6.6 4.9 -7.8% 21.0% 8.0 8.4 9.0 22.5% 18.1%
Independent Quality Assessment 4.0 2.5 3.0 3.3 -6.0% 11.5% 5.8 6.2 6.3 24.2% 12.9%
Statistical Reporting 9.7 3.6 6.3 7.7 -7.7% 24.5% 7.3 7.8 8.0 1.4% 18.4%
Data and Information Management 2.1 2.3 2.5 3.7 20.0% 9.5% 6.5 6.8 7.0 24.0% 14.3%
Total 31.2 22.6 26.8 30.9 -0.3% 100.0% 43.3 45.7 47.6 15.4% 100.0%
Economic classification
Current payments 24.0 22.5 26.7 30.9 8.9% 93.3% 43.1 45.5 47.4 15.3% 99.6% Compensation of employees 18.5 18.9 19.8 18.3 -0.3% 67.7% 32.9 35.1 35.4 24.5% 73.1%
Goods and services1
5.5 3.6 6.8 12.6 32.1% 25.6% 10.3 10.4 12.0 -1.5% 26.7%
of which:
Bursaries: Employees 0.2 0.2 0.1 0.4 26.1% 0.9% 0.8 0.8 0.9 28.2% 1.7%
Consultants: Business and advisory
services
– – 2.7 3.7 – 5.7% 0.6 0.7 0.7 -41.8% 3.4%
Consumables: Stationery, printing and
office supplies
0.0 0.2 0.1 0.4 111.3% 0.6% 0.8 0.7 0.7 20.9% 1.6%
Travel and subsistence 3.0 1.8 2.0 4.6 15.3% 10.2% 5.6 5.6 6.9 14.4% 13.3%
Training and development 0.3 0.5 0.1 0.9 50.5% 1.5% 0.6 0.7 0.7 -5.9% 1.7%
Operating payments 0.2 0.5 0.6 0.5 30.8% 1.6% 0.9 1.0 1.0 28.8% 2.0%
Transfers and subsidies1 0.5 0.0 – – -100.0% 0.5% – – – – –
Households 0.5 0.0 – – -100.0% 0.5% – – – – –
Payments for capital assets 0.6 0.0 0.1 0.0 -63.5% 0.7% 0.2 0.2 0.2 94.0% 0.4%
Machinery and equipment 0.6 0.0 0.1 0.0 -63.5% 0.7% 0.2 0.2 0.2 94.0% 0.4%
Payments for financial assets 6.2 – – – -100.0% 5.6% – – – – –
Total 31.2 22.6 26.8 30.9 -0.3% 100.0% 43.3 45.7 47.6 15.4% 100.0%
1. Estimates of National Expenditure data tables can be downloaded from www.treasury.gov.za. These tables contain detailed information by goods and services, and transfers and subsidies items by
programme.

121
Personnel information
South African National Statistics System personnel numbers and cost by salary level¹
Number of posts estimated for
31 March 2020 Number and cost2 of personnel posts filled/planned for on funded establishment Number
Number of
funded posts
Number of posts
additional to the
establishment Actual Revised estimate Medium-term expenditure estimate
Average growth
rate (%)
Average: Salary
level/total (%)
2018/19 2019/20 2020/21 2021/22 2022/23 2019/20 - 2022/23
South African National Statistics System Number Cost Unit cost Number Cost
Unit cost Number Cost
Unit cost Number Cost
Unit cost Number Cost
Unit cost
Salary level 32 – 21 19.8 0.9 16 18.8 1.2 26 32.9 1.3 26 35.1 1.3 25 35.4 1.4 16.0% 100.0% 1 – 6 2 – 1 0.3 0.3 – – – – – – – – – – – – – –
7 – 10 10 – 9 4.6 0.5 4 2.3 0.6 7 4.5 0.6 7 4.8 0.7 7 5.1 0.7 20.5% 26.9%
11 – 12 5 – 3 2.8 0.9 3 3.2 1.1 3 3.4 1.1 3 3.6 1.2 3 3.8 1.3 – 12.9%
13 – 16 15 – 8 12.2 1.5 9 13.3 1.5 16 25.1 1.6 16 26.7 1.7 15 26.4 1.8 18.6% 60.2%
1. Data has been provided by the department and may not necessarily reconcile with official government personnel data.
2. Rand million.
Strategic risks and mitigation
Programme 7 has identified the following strategic risks:
Strategic risks Mitigation strategy
Inability to coordinate and synergise SANSS activities
Review of legislation (legislative reform) to address and strengthen
coordination
Design a National Strategy for the Development of Statistics (NSDS)
Inability to close that data gap within the IIF
Implement the reviewed Statistics Act
Statistical plans approved by the SG
Increased assessment of external data sources
Inability to provide statistical support and advice
Request additional funding to fill required posts
Support and advice given based on the integrated indicator framework
Signed agreement by relevant Chief Directors for projects

122

123

124
Stakeholders and the environment

125
3. Stakeholders and the environment
The preceding chapters focused on the strategic direction of the organisation and the annual performance plan to implement the strategic
outcomes. This chapter focuses on stakeholders and their needs, the service delivery improvement plan, and the resource management plan to
implement the strategy.
3.1 Statistics Council
Section 8 of the Statistics Act (Act No. 6 of 1999) provides for the establishment of a Statistics Council consisting of between 18 and 25 members,
appointed by the Minister after consultation with the Cabinet. Members include one representative from each province, and nominated members
from organs of state, producers of statistics, organised business and labour, specialist and research interests, economic and financial interests
and the public.
The role of the Statistics Council can be summarised as follows:
a) Advise the Minister, the Statistician-General and other organs of state on statistical matters with regard to:
• The collection, processing, analysis, documentation, storage and dissemination of statistics, including the undertaking of a population
census, and
• The elimination of unnecessary overlapping or duplication with regard to the collection or publication of statistics by organs of state;
b) Promote and safeguard official statistics and the coordination of statistical activities;
c) Furnish the Minister and the Statistician-General with an annual report, which must be tabled in Parliament; and
d) Issue public statements on any matter relating to its functions in terms of the Act, but only after consultation with the organ of state, business
or organisation involved.
3.2 Stakeholders and their needs
Stats SA interacts with a range of stakeholders from whom information is collected, and to whom information is supplied. Our key stakeholders
include:
• Government: National, provincial and local governments use statistical information to inform policy development and to measure the impact
of government programmes on economic and social development. Government is both a major user and a major supplier of data. There is
a growing need for accurate statistical information at local government level. Except for the population census information, most of the
statistical information produced by Stats SA is on a national and provincial level. The challenge for Stats SA is to develop alternative strategies
with its NSS partners to meet this growing demand for small-area statistics.
• The public: The public is mainly interested in basic information on the economy and society such as economic growth, employment, inflation,
and population dynamics. This information is largely communicated through the media. Stats SA’s strategy strives to inspire confidence in the
quality of these key measurements. The public also supplies data through household survey collections and the census. The cha llenge for
Stats SA is to promote its information outputs to the public in a manner that inspires them to participate willingly in household and other main
surveys.

126
• The media: The media plays an important role in the publication of statistical information, both nationally and locally. Stats SA has embarked
on a communication and development strategy to empower key role players in the media arena. This ensures that the right information is
published at the right time and that it is properly described and imparted in the appropriate form to the public.
• Business: The business community shares similar interests in quantitative information, and in principle, all economic variables are potential
subjects for comparison. Important indicators include employment and unemployment, the size of the market, and the rate at which prices
are changing. Businesses are also important sources of statistical information. Reducing the burden of surveys on the business community
continues to be an important factor in the design of statistical programmes. Convincing businesses of the importance of their information in
arriving at economic and financial indicators remains a challenge.
• The academic sector: The academic sector uses statistical information for research, analysis and teaching purposes. While other users require
statistics to inform decision-making, the academic community is interested in how the data are generated and what the data show over time.
The academic sector can play a strategic role in evaluating the quality of statistics produced, and promoting interest in sta tistics among
students. The academic sector can also in future partner with local government to produce quali ty statistical information.
• Parliamentarians: Political representatives are responsible for entrenching and voicing the interests of their voters in Parl iament and the
National Assembly. They are also interested in what statistics say about specific pol icies that were introduced by the democratic government
of the day. Researchers in Parliament conduct research to obtain information on behalf of the political parties. Parliament ’s library collects
and files political and national information that can be used by parliamentarians and visiting international delegates.
• Non-governmental organisations (NGOs): NGOs monitor the government’s progress in many areas such as sustainable development and
service delivery. NGOs also work for the upliftment of communities and implement development projects. They can use census and other
Stats SA data to monitor government’s progress and to aid decision-making for their own projects.
• Constitutional institutions and major public entities: Constitutional institutions (such as the Commission on Gender Equality, the Financial and
Fiscal Commission, and the Public Protector) ensure that the major elements of the Constitution (Act No. 108 of 1996) are fol lowed throughout
the country. Major public entities (such as Eskom, Telkom, museums, etc.) work with government to provide infrastructure, service delivery
and information on a national level.
• Foreign and international bodies: Official statistical information is an essential basis for mutual knowledge, comparison and trade among
countries. It is for this reason that Stats SA meets the international information requirements of bodies such as the IMF and ILO. Stats SA also
has regular contact with other international statistical agencies to share professional expertise and experiences. This promotes the adoption
of common concepts, standards, classifications and practices that support the international comparison of statistics. Stats SA plays a leading
role in Africa in the development of statistics.

127
3.3 Service delivery improvement plan
In the SONA 2019, President Cyril Ramaphosa stated, ‘It is about smarter, more responsive, more effective governance. To ensure that we
effectively and with greater urgency harness technological change in pursuit of inclusive growth and social development, I have appointed a
Presidential Commission on the 4th
Industrial Revolution.’
Stats SA, since 2015, has registered its strategic intent to close the data gaps and strengthen the capability of the National Statistics System (NSS)
to be responsive to the growing demand. The organisation has assessed new opportunities linked to innovation and technological development
as well as the surge of new public and private data providers. These have presented an opportunity for Stats SA to rethink cu rrent modes of
service delivery to address its challenges though digital transformation. The piloted innovative methods of work (computer-assisted personal
interviewing [CAPI], online enumeration, etc.) have proven to be better, faster, more flexible and cheaper, enabling efficiency and innovation of
operations. Discussions, testing and preparations to transit from PAPI and the use of the master sample to CAPI and a geospatial information
sampling frame were conducted for most of 2017, a process that culminated with pilot surveys to test the implications of the change in data
collection mode. These have served as an initial phase of digital transformation in line with key priorities of Stats SA for the next MTEF, which is
expected to be eventually implemented for all household surveys conducted by Stats SA progressively.
During 2018/19, three household surveys have transited from PAPI to CAPI, that is, GPSJS from April 2018 as well as GHS and DTS which
commenced with the transition to CAPI in January 2019. QLFS is still in its testing phase through a parallel run which commenced in October
2018. Transforming the operating model of Stats SA in terms of data collection and processing will continue in 2019/20. These efforts are in
line with government’s intent to accelerate and improve service delivery.
The DPSA has also issued an Operations Management Framework (OMF) in 2017 in order to bridge the gap between strategy and delivery of
services. The OMF assists governmental institutions to plan, structure, execute and continuously improve operations for the effective and efficient
delivery of services.
In 2020/21, Stats SA aims to implement the OMF through:
• Mapping business processes for CAPI (To-Be);
• Developing standard operating procedures for CAPI;
• Publishing and monitoring service standards;
• Implementing the realigned structure;
• Developing operational plans; and
• Publishing the service charter on the website.
Stats SA’s SDIP will continue its focus on improving timeliness and access to statistics as well as improving stakeholder management, mainly for
transiting surveys by:
• Monitoring response rates for transiting surveys;
• Formalising consultation arrangements with stakeholders impacted by the transition;
• Enhancing training of staff members dealing with stakeholders at all levels to include Stats SA values and Batho Pele principles; and
• Monitoring use of statistical products through Stats SA platforms and contact points.

128
To this end, a complaints mechanism was developed, and a compendium of services document was published that describes the service delivery
standards in terms of response times. Queries and complaints can be lodged on Stats SA’s website and are responded to within the specified
time frames. A concerted effort has been made by Stats SA to ensure that publications are published with comprehensive metadata to promote
transparency, understanding and usage of data.

129
3.3.1 Providing statistical information
Stats SA aims to assist and encourage informed decision-making, research and discussion within the state and the community by providing high-
quality, objective, reliable and responsive statistical products and services. Thus, Stats SA provides a wide range of statistical information on
economic and social matters to government, business and the community in general. The statistics are released in hard-copy paper and electronic
publications, reports and other digital products. Stats SA’s commitment to improved service delivery is described below:
a) User Information Services
User Information Services is the first point of direct contact with our customers who prefer a face-to-face interface, telephonic/fax communication
and/or email. This centre is the gateway to personal access to statistical information, especially if the information required is not easily retrieved
from the website. Staff members are trained to handle telephone, email, fax and written enquiries. Customers can also approach User Information
Services in the provinces to request prompt responses on published data. Stats SA can be contacted at 012 310 8600 for telephonic enquiries,
012 310 8500 for fax enquiries or [email protected] for email enquiries.
b) Subscription service
Stats SA’s standard products can be acquired through subscription to specific established publications. Customers may indicate whether the
publication should be emailed or posted to them, free of charge.
c) Stats SA website
Stats SA publications and datasets can be viewed, accessed and downloaded free of charge from the Stats SA website at www.statssa.gov.za.
Statistical information is placed on the website at the exact time of release to ensure that everyone has equal access to inf ormation at the same
time. A newsletter is emailed each week to inform stakeholders of the current activities and releases for the following week.
d) Personal visits
Customers can personally visit the Stats SA Head Office or any provincial Stats SA office to obtain access to statistical products and services.
Head Office also provides a library facility to users. This facility is mainly used for research purposes.
e) Consultation
Stats SA’s credibility rests on its ability to produce quality statistics that can stand up to public scrutiny. Through a better understanding of Stats SA’s
stakeholders, our interactions with suppliers and users of information are becoming more effective, ultimately leading to the portrayal of the
organisation as a credible, responsive and reliable source of statistics. The outputs of surveys will be communicated in a way that is well
understood by users and that meets their information needs. In addition, Stats SA conducts annual stakeholder workshops such as the ISIbalo
symposia, combining training and information-sharing about economic and social statistical data products. Stats SA also participates in
exhibitions in an effort to increase awareness of what the organisation offers.
f) Openness and transparency
Stats SA has a catalogue of its reports and releases that is available in hard copy, as well as on the website. In addition, the website advertises
releases planned for the forthcoming week, as well as all releases planned for the quarter. The weekly schedule indicates the specific time that
the statistics will be released. The introduction of SASQAF is aimed at improving the quality of explanatory notes on reports and releases, thus
improving the openness and transparency of releases.

130
3.3.2 Consultation arrangements: The Statistics Council, Advisory Committees, and the National
Statistics System
The Statistics Council represents a range of stakeholders and users, and meets four times a year to provide advice to the Minister and the
Statistician-General on statistical matters, including the needs of users. Council members are required to represent the needs of their
constituencies and should therefore consult with them to ensure sound advice to the Minister and the Statistician-General.
Stats SA has established a number of advisory committees comprising key stakeholders that meet periodically to advise on statistical series.
Stats SA also conducts periodic workshops in order to seek advice, comments and suggestions from broader stakeholder groups. The National
Statistics System branch, in partnership with organs of state, aims at ensuring coherence in statistical information produced by different producers
of statistics, and promotes the use of statistics in evidence-based decision-making.

131

132
3.4 Resource management plan
The Stats SA Head Office is located in Pretoria. There are nine provincial offices and sixty-three district offices in the process of being resourced
and fully utilised. Provincial and district offices play a key role in user liaison and data collection at provincial and municipal levels. Stats SA has
developed a number of strategies in support of the strategic direction. Below is a summary of the ICT and human resource management strategies
over the medium term.
3.4.1 Information Communication and Technology Strategy
We have entered a new and exciting technological era that provides alternative ways of conducting business, which seemingly offers endless
possibilities for innovation and growth. The Fourth Industrial Revolution (4IR) is characterised by a number of technologies which have brought
disruptions in the data ecosystem, presenting new global risk shared by all sectors, big and small as well as profit and non-profit. The only way
to mitigate the risk is to adapt, evolve and embrace the elements of the 4IR in our statistical systems. Statistics South Africa (Stats SA) is taking on
digitalisation by modernising its value chains in order to avail its products and services faster and closer to stakeholders, and also to secure its
place in the data ecosystem. ICT has therefore positioned itself as a strategic partner in delivering innovative and trusted solutions, which will be
achieved through integrated ICT solutions that will enable and transform the statistical systems. The new strategy outlines the following outcomes
and objectives:
Trusted partners
ICT is a trusted partner with the business, committing to be proactive in its service offerings, to communicate better, keep stakeholders informed
of progress and important decision or events as well as upcoming innovations that will improve or disrupt business as usual ahead of exte rnal
disruptors. The following strategic objectives will guide the achievement of the strategic outcome:
Establish strategic partnership with all the organisation’s branches
Establish business analysis functionality at an organisational level
Partner with industries on disruptive/emerging technologies.
Integrated end-to-end systems
Integrated end-to-end systems are in place to provide the organisation with a seamless user experience, reduction of multitudes of system
applications, improved data integrity, and overall simplicity in streamlining business processes. The following strategic obj ectives will guide the
achievement of the strategic outcome:
Establish and institutionalise enterprise architecture
Integrate and standardise ICT solutions and services aligned to enterprise architecture.
Enabling ICT environment
Stats SA’s ICT environment is well governed, secured, and responsive to stakeholder needs and facilitates business innovation. The following
strategic objectives will guide the achievement of the strategic outcome:
Strengthen ICT security and governance
Institutionalise an agile ICT service delivery model
Invest in a knowledge-sharing platform.

133
Capable people
The staff members and other stakeholders are capacitated to take advantage of new digital technologies in the data ecosystem. Stats SA will
prioritise ICT talent and skills management, retention strategies and proper succession planning within ICT areas. The following strategic
objectives will guide the achievement of the strategic outcome:
Strengthen ICT capabilities
Invest in digital capabilities at an organisational level
Invest in ICT leadership and management capabilities
Build an ICT culture based on organisational values
Invest in ICT research and development.
The strategy provides synergy amongst all ICT units optimising ICT resource utilisation to better support the Stats SA ’s mandate.
3.4.2 Human Resource Management Strategy
Delivering high-quality statistical information is dependent on a highly qualified, motivated workforce and skilled staff complement. The new
strategic direction calls for a new skills set for the future and an agile workforce that can adapt to the fast pace of change. Changing processes,
systems and technology will continue to change and will have an impact on work design, structure, roles and responsibilities and skills
requirements. Stats SA will be embarking on a process to realign its human resource management and development strategy to respond to the
new environment. The aim of the current strategy is to maintain a highly qualified and motivated workforce and to provide an environment to
support them.
HRM goals for 2020/21
Goal 1 Harness the retention of scarce skills
Goal 2 Place staff in line with strategic priority areas
Goal 3 Provide human resource management support to Census 2021 and other ad hoc projects
Goal 4 Build labour relations management capacity
Goal 5 Realign the human resource management and development strategy to the new strategic direction
Goal 6 Strengthen employee wellness and diversity programmes
Goal 7 Institutionalise talent management.
3.5 Long-term infrastructure plans
3.5.1 Background
Stats SA registered its building project as a Public Private Partnership (PPP) with National Treasury in August 2010, which has been delivered in
August 2016. This resulted in bringing together all Stats SA employees, who were previously accommodated in four different buildings.

134
3.5.2 Progress
Construction of the new building was finalised and Stats SA moved into the new building at the end of August 2016.
The PPP contract is for a period of 26 years, and 5 years of the contract have been exhausted (2 years for construction and 3 years for operations).
Currently the Facilities Management, Logistics and Security Division is monitoring the performance of the operations in relation to the PPP
contract. Monthly ISIbalo House Steering Committee meetings are held with representatives of Dipalopalo Concession and Dipalopalo Facilities
Management to discuss all issues in relation to the operational phase of the PPP contract.
3.5.3 Financial implications
The building project is affordable and value for money. Stats SA has no other long-term infrastructure programmes planned for the future.
3.6 Evaluation plan
3.6.1 Background
Stats SA introduced evaluations a number of years ago, from both a design perspective as well as an independent assessment for designating
statistics as official. Since the importance of evaluation has been highlighted by government, the organisation is in the process of reviewing its
evaluation framework in order to promote, facilitate and institutionalise the use of evaluation in Stats SA.
3.6.2 Aim of evaluation in Stats SA
The aim of evaluation in Stats SA is to:
Foreground the importance and use of evaluation in management and decision-making;
Improve performance (evaluation for learning);
Improve accountability (making evaluation results available);
Generate knowledge (what works and what does not); and
Improve planning and decision-making.
3.6.3 The evaluation plan
Stats SA will be conducting the following evaluations over the medium-term:
Design evaluation:
o Conduct a pilot census to test all processes and systems in 2020/21 in preparation for the main census in 2021.
Implementation evaluation:
o Independent evaluation through conducting post-enumeration surveys on the mini-test in 2019/20, the pilot in 2020/21 and the main
census in 2021/22.
o Independent evaluation on household surveys: Target for 2020/21 is to conduct an evaluation on the Quarterly Labour Force Survey.

135

136
137
Annexure 1: The fundamental principles of official statistics
In order to safeguard official statistics and guide national statistics offices in their work, the United Nations has adopted the following fundamental
principles of official statistics:
a) Impartiality: Official statistics provide an indispensable element in the information system of a democratic society, serving the government,
the economy and the public with data about the economic, demographic, social, and environmental situation. To this end, official statistics
that meet the test of practical utility are to be compiled and made available on an impartial basis by official statistical agencies to honour
citizens’ entitlement to public information.
b) Professional independence: To retain trust in official statistics, the statistical agency needs to decide, according to strictly professional
considerations, including scientific principles and professional ethics, on the methods and procedures for the collection, processing, storage
and presentation of statistical data.
c) Transparency of methods applied: To facilitate a correct interpretation of the data, the statistical agency is to present information according
to scientific standards on the sources, methods and procedures of the statistics.
d) The statistical agency is entitled to comment on erroneous interpretation and misuse of statistics.
e) Use the most efficient sources: Data for statistical purposes may be drawn from all types of sources, be they statistical surveys or
administrative records. The statistical agency is to choose the source with regard to quality, timeliness, costs and the burden of respondents.
f) Confidentiality: Individual data collected by the statistical agency for statistical compilation, whether they refer to natural or legal persons,
are to be strictly confidential and used exclusively for statistical purposes.
g) Transparency of laws: The laws, regulations and measures under which the statistical system operates are to be made public.
h) Cooperation among institutions: Coordination among statistical agencies within countries is essential to achieve consistency and efficiency
in the statistical system.
i) Adherence to international standards: The use, by the statistical agency in each country, of international concepts, classifications and
methods promotes the consistency and efficiency of statistical systems at all official levels.
j) International cooperation: Bilateral and multilateral cooperation in statistics contributes to the improvement of the system of official statistics
in all countries.

138
Annexure 2: African Charter on Statistics
The Charter outlines what should be achieved and in this regard, the African Statistics System (ASS) organisations, African statisticians and all
those operating in the field of statistics at the national, regional and continental levels shall respect the principles enshrined in the Resolution on
the fundamental principles of official statistics adopted by the United Nations Commission for Statistics in April 1994. They shall also apply the
best practices principles hereunder defined:
Principle 1: Professional independence
Scientific independence: Statistics authorities must be able to carry out their activities according to the principle of scientific independence,
particularly vis-à-vis the political authorities or any interest group; this means that the methods, concepts and nomenclatures used in statistical
operation shall be selected only by the statistics authorities without any interference whatsoever and in accordance with the rules of ethics and
good practice.
Impartiality: Statistics authorities shall produce, analyse, disseminate, and comment on African statistics in line with the principle of scientific
independence, and in an objective, professional and transparent manner.
Responsibility: Statistics authorities and African statisticians shall employ unambiguous and relevant methods in the collection, processing,
analysis and presentation of statistical data. Statistics authorities shall also have the right and duty to make observations on erroneous
interpretations and improper use of the statistical information that they disseminate.
Transparency: To facilitate proper interpretation of data, statistics authorities shall provide information on their sources, methods and
procedures that have been used in line with scientific standards. The domestic law governing operation of the statistical sys tems must be made
available to the public.
Principle 2: Quality
Relevance: African statistics shall meet the needs of users.
Sustainability: African statistics shall be conserved in as detailed as possible a form to ensure their use by future generations, while preserving
the principles of confidentiality and protection of respondents.
Data sources: Data used for statistical purposes may be collected from diverse sources such as censuses, statistics surveys and/or
administrative records. The statistics organisations shall choose their sources in consideration of the quality of data offer ed by such sources
and their topicality, particularly the costs incurred by the respondents and sponsors. The use by statistics authorities of administrative records
for statistical purposes shall be guaranteed by domestic law, provided that confidentiality is preserved.
Accuracy and reliability: African statistics shall be an accurate and reliable reflection of the reality. Continuity: Statistics authorities shall ensure continuity and comparability of statistical information over time.

139
Coherence and comparability: African statistics shall be internally coherent over time and allow for comparison between regions and
countries. To this end, these statistics shall make combined use of related data derived from different sources. They shall employ internationally
recognised and accepted concepts, classifications, terminologies and methods.
Timeliness: African statistics shall be disseminated in good time and, as far as possible, according to predetermined calendar.
Topicality: African statistics shall reflect current and topical events and trends.
Specificities: Statistical data production and analytical methods shall take into account African peculiarities.
Awareness-building: State parties shall sensitise the public, particularly statistical data providers, on the importance of statistics.
Principle 3: Mandate for data collection and resources
Mandate: Statistics authorities shall be endowed with a clear legal mandate empowering them to collect data for production of African
statistics. At the request of statistics authorities, public administrations, business establishments, households and the general public may be
compelled by domestic law to allow access to the data in their possession or provide data for the purpose of compilation of A frican statistics.
Resource adequacy: As far as possible, the resources available to statistics authorities shall be adequate and stable to enable them to meet
statistics needs at national, regional and continental levels. Governments of state parties shall have the primary responsibi lity to provide such
resources.
Cost-effectiveness: Statistics authorities shall use the resources so provided effectively and efficiently. This presupposes, in particular, that
operations shall as far as possible, be programmed in an optimal manner. Every effort shall be made to achieve improved production and
use of the statistics derived from administrative records, to reduce the costs incurred by respondents and, as far as possible, avoid expensive
direct statistical surveys.
Principle 4: Dissemination
Accessibility: African statistics shall not be made inaccessible in any way whatsoever. This concomitant right of access for all users without
restriction shall be guaranteed by domestic law. Micro-data may be made available to users on condition that the pertinent laws and
procedures are respected and confidentiality is maintained.
Dialogue with users: Mechanisms for consultation with all African statistics users without discrimination shall be put in place with a view to
ensuring that the statistical information offered are commensurate with their needs.
Clarity and understanding: Statistics shall be presented in a clear and comprehensible form. They shall be disseminated in a practical and
appropriate manner, be available and accessible to all and accompanied by the requisite metadata and analytical commentaries.
Simultaneity: African statistics shall be disseminated in a manner that ensures that all users are able to use them simultaneously. Where
certain authorities receive advance information under embargo, to allow them time to respond to possible questions, public announcement
shall be made indicating the nature of such information, the identity of the recipients and the set timeframe before its public dissemination.

140
Correction: Statistics authorities shall correct publications containing significant errors using standard statistical practices or, for very serious
cases, suspend dissemination of such statistics. In that event, the users shall be informed in clear terms of the reasons for such corrections or
suspension.
Principle 5: Protection of individual data, information sources and respondents
Confidentiality: National statistics authorities, African statisticians and all those operating in the field of statistics in Africa shall absolutely
guarantee the protection of the private life and business secrets of data providers (households, companies, public institutions and other
respondents), the confidentiality of the information so provided and the use of such information for strictly statistical purposes.
Giving assurances to data providers: Persons or entities interviewed during statistical surveys shall be informed of the objective of such
interviews and of the measures put in place to protect the data provided.
Objective: Data concerning individuals or entities collected for statistical purposes shall in no circumstance be used for judicial proceedings
or punitive measures or for the purpose of taking administrative decisions against such individuals or entities.
Rationality: Statistics authorities shall not embark upon statistical surveys except where pertinent information is unavailable from administrative
records or the quality of such information is inadequate in relation to the quality requirements of statistical information.
Principle 6: Coordination and cooperation
Coordination: Coordination and collaboration amongst statistics authorities in a given country are essential in ensuring quality and
harmonious statistical information. Similarly, coordination and dialogue amongst all members of the African Statistical System are vital for
harmonisation, production and use of African statistics.
Cooperation: Bilateral and multilateral statistics cooperation shall be encouraged with a view to upgrading African statistics production
systems.

141
Annexure 3: Planning, monitoring and reporting
As a national government department, Stats SA has to comply with the Statistics Act (Act No. 6 of 1999), the Public Finance Management Act
(Act No. 1 of 1999), and Treasury Regulations for government departments, issued in terms of the PFMA (May 2002) with respect to planning
and monitoring.
Planning
Stats SA conducts three annual planning sessions: strategic planning, business planning, and integrative operational planning.
The outputs of these planning sessions are as follows:
a) Strategic planning: A strategic plan and annual work programme that are approved by the Minister in the Presidency and tabled in
Parliament.
b) Business planning: Divisional strategic plans that outline annual outputs and targets to be achieved for the financial year.
c) Integrative operational planning: Detailed project and operational plans that outline activities and tasks to be conducted monthly.
Monitoring and reporting
In order for Stats SA to achieve its mandate, the organisation has put measures in place to monitor and report on its progress and overall performance.
a) Annual reporting: An annual report on the overall performance of the organisation in terms of the annual targets outlined in the strategic
plan and/or work programme is compiled and tabled in Parliament.
b) Quarterly reporting: Quarterly reports outlining progress made against targets as stated in the work programme are compiled and
submitted to the Minister and Treasury. These reports are supported by evidential documentation.
c) Monthly reporting: Monthly reports are compiled as an early warning system and are submitted to the internal executive committee of the
organisation.

142
Annexure 4: Strategy map
The following strategy map outlines the theory of change in picture format of how Stats SA aims to achieve its vision “ Improving lives through data ecosystems”.

143
Annexure 5: Summary of publications
Monthly
Consumer price index (CPI)
Contract price adjustment provisions work group
Electricity generated and available for distribution
Export and import price indices
Food and beverages
Land Transport Survey
Manufacturing: Production and sales
Mbalo Brief
Mining: Production and sales
Motor trade sales
Producer price index (PPI)
Retail trade sales
Selected building statistics of the private sector as reported by local government institutions
Statistics of civil cases for debt
Statistics of liquidations and insolvencies
Tourism and migration
Tourist accommodation
Wholesale trade sales
Quarterly
Bulletin of Statistics
Gross domestic product (GDP)
Manufacturing: Utilisation of production capacity by large enterprises
Quarterly employment statistics (QES)
Quarterly financial statistics (QFS)
Quarterly financial statistics of municipalities
Quarterly Labour Force Survey (QLFS)
Annually
Agricultural Survey
Annual financial statistics (AFS)
Building statistics
Capital expenditure by the public sector
Documented immigrants in South Africa
Domestic Tourism Survey (DTS)
Environmental economic accounts, fishery accounts for South Africa
Financial census of municipalities
Financial statistics of consolidated general government
Financial statistics of extra-budgetary accounts and funds

144
Financial statistics of higher education institutions
Financial statistics of national government
Financial statistics of provincial government
General Household Survey (GHS)
GHS series V: Energy
GHS series volume IV: Food security and agriculture
Labour Market Dynamics in South Africa
Marriages and divorces
Mid-year population estimates
Mineral accounts for South Africa
Mortality and causes of death in South Africa
Non-financial census of municipalities
Recorded live births
SA Statistics
Periodic (5–10 yearly)
A Survey of Time Use
Census 2011 Agricultural households
Census 2011 products: Statistical release
Compendium of Industrial Statistics
Construction industry
Consumer price index (CPI) weights (All urban)
Consumer price index (CPI) weights (Total country)
Electricity, gas and water supply
Energy accounts for South Africa
Income and expenditure of households
Men, women and children: Findings of the Living Conditions Survey
Post and telecommunications industry
Poverty profile of South Africa: Application of the poverty lines on the LCS
South Africa’s young children: their parents and home environment
Subjective poverty in South Africa: Findings of the Living Conditions Survey
Transport and storage industry
Women and Men in South Africa: Ten years on

145
Annexure 6: List of abbreviations and acronyms
AC Audit Committee
AENE Adjusted Estimates of National Expenditure
AfDB African Development Bank
AFS Annual Financial Statements
AFS Annual Financial Statistics
AG Auditor-General
ANA Annual National Assessments
APAI-CRVS Africa Programme on Accelerated Improvement of Civil Registration and Vital Statistics
ASS African Statistical System
ASSD Africa Symposium on Statistical Development
AUC African Union Commission
BEE Black Economic Empowerment
BRICS Brazil, Russia, India, China and South Africa
BSF Business Sampling Frame
CAPI Computer Assisted Personal Interview
CAT Commitments and Accruals Tool
CDC Continuous data collection
CIPC Companies and Intellectual Properties Commission
CPI Consumer price index
CPS Continuous Population Survey
CRM Client Relationship Management
CRUISE Centre for Regional and Urban Innovation and Statistical Exploration
CRVS Civil Registration and Vital Statistics
CS Community Survey
CSP Cities Support Programme
DBE Department of Basic Education
DCS Department of Correctional Services
DDG Deputy Director-General
DHS Domestic Household Survey
DoJ&CD Department of Justice and Constitutional Development
DPSA Department of Public Service and Administration
DST Department of Science and Technology
DTS Domestic Tourism Survey
DU Dwelling unit
EA Enumeration area

146
EC Eastern Cape
EEAs Environmental Economic Accounts
ENE Estimates of National Expenditure
EPWP Expanded Public Works Programme
Exco Executive Committee
FMLS Facilities Management, Logistics and Security
FS Free State
GAF Growth accounting framework
GDP Gross domestic product
GFS Government Financial Statistics
GHS General Household Survey
GIF Geospatial Integrated Framework
GIS Geographic Information System
GP Gauteng
GPSJS Governance, Public Safety and Justice System
HR Human Resources
HRD Human Resource Development
HRM Human Resources Management
ICT Information and Communication Technology
IDP Integrated Development Plan
IES Income and Expenditure Survey
IIA Institute of Internal Auditors
ISIC International Standard Industrial Classification of all Economic Activities
IT Information Technology
IUDF Integrated Urban Development Framework
KZN KwaZulu-Natal
LCS Living Conditions Survey
LP Limpopo
M&E Monitoring and Evaluation
MDG Millennium Development Goal
MEC Member of the Executive Council
MFMA Municipal Finance Management Act
MoU Memorandum of Understanding
MP Mpumalanga
MS Master sample
MTBPS Medium Term Budget Policy Statement
MTEF Medium Term Expenditure Framework

147
MTSF Medium Term Strategic Framework
NBP New Building Project
NC Northern Cape
NDP National Development Plan
NHTS National Household Travel Survey
NPA National Prosecuting Authority
NPR National Population Register
NSDS National Strategy for the Development of Statistics
NSS National Statistics System
NW North West
OCPO Office of the Chief Procurement Officer
OHSA Occupational Health and Safety Act
PAPI Paper Assisted Personal Interview
PES Post-enumeration Survey
PFMA Public Finance Management Act
PPI Producer price index
PPP Public Private Partnership
PSETA Public Service Sector Education and Training Authority
PSR Public Service Regulations
PSU Primary sampling unit
QA Quality assurance
QES Quarterly Employment Statistics
QFS Quarterly Financial Statistics
QLFS Quarterly Labour Force Survey
QMS Quality Management System
RMSC Risk Management Steering Committee
RPPI Residential Property Price Index
RSC Regional Service Council
RTMC Road Traffic Management Corporation
SA South Africa/n
SABS South African Bureau of Standards
SADC Southern African Development Community
SADHS South Africa Demographic and Health Survey
SAE Small-area estimation
SADT South African Domestic Tourism
SANSS South African National Statistics System
SAPS South African Police Service

148
SARB South African Reserve Bank
SARS South African Revenue Service
SASQAF South African Statistical Quality Assessment Framework
SAT South African Tourism
SAYP Survey of Activities of Young People
SBR Statistical Business Register
SCM Supply Chain Management
SDGs Sustainable Development Goals
SDIP Service Delivery Improvement Plan
SESE Survey of Employers and the Self-employed
SG Statistician-General
SHaSA Strategy for the Harmonisation of Statistics in Africa
SHERQ programme Safety, Health, Environment, Risk and Quality programme
SIC Standard Industrial Classification
SIF Spatial Information Framework
SIS Structural Industry Statistics
SMEs Small and medium-sized enterprises
SMMEs Small, medium and micro-sized enterprises
SMS Senior Management Staff
SMS Stakeholder Management System
SRM Stakeholder Relations Management
Stats SA Statistics South Africa
SUT Supply and Use Tables
SVC Statistical value chain
SWTS School to Work Transition Survey
TaCT Transformation and Change Team
TFP Total Factor Productivity
TSA Tourism Satellite Account
TUS Time Use Survey
UN United Nations
UNECA United Nations Economic Commission for Africa
USS User Satisfaction Survey
VAS Volunteer Activities Survey
VOCS Victims of Crime Survey
WC Western Cape
WHO World Health Organization

149

ISBN: 978-0-621-48227-0RP124/2020