work improvement at a car manufacturing companyeprints.utm.my/id/eprint/1325/1/jt37a6.pdf · of the...
TRANSCRIPT

WORK IMPROVEMENT AT A CAR MANUFACTURING COMPANY 73
Jurnal Teknologi, 37(A) Dis. 2002: 73–87© Universiti Teknologi Malaysia
WORK IMPROVEMENT AT A CAR MANUFACTURINGCOMPANY
MUHAMAD ZAMERI MAT SAMAN & LAW CHEAK YING
Abstract. Productivity has been identified as an important role in any organization, especially formanufacturing sectors to gain more profit that leads to prosperity [1]. This paper reports a workimprovement project in a car manufacturing company. It involves problem identification at the metalfinish line and proposing recommendation to improve the current situation more efficiently. Based onthe observation and data online work-in-progress (WIP) has been identified as a major problem andthis is caused by the insufficient movements due to material handlings and unbalanced workload.
Method improvement technique is used to determine the best method of carrying out a task inorder to eliminate the unnecessary movements. Then, line-balancing technique is used to minimizethe idle time at every station or the percentage of line balance loss (LBL). In order to verify the resultsthat were obtained from the generated line-balancing alternative, Witness simulation package is used toobtain the output. One effective alternative is chosen based on the results obtained from the simulationand cost justification. Then, a proper planning is suggested to maximize the resource utilization at themetal finish line.
Simulation results showed that productivity increases roughly three times higher than the currentsituation. However, the results were obtained based on several assumptions that had been made duringcarry out this project.
Key words: On-line Work-In-Progress (WIP), Off-line Work-In-Progress (WIP), method improvement,line balancing, simulation, cost justification, resource planning and allocation
Abstrak. Produktiviti merupakan sesuatu yang amat penting bagi sesebuah organisasi, terutamanyabagi sektor pembuatan ke arah meningkatkan keuntungan untuk memajukan syarikat. Kertas kerja inimelaporkan satu kajian kes bagi pembaikan kerja di sebuah syarikat pengeluaran kereta. Kajian kes initerbahagi kepada dua bahagian iaitu mengenalpasti masalah di lini pemasangan utama danmencadangkan pembaikan ke arah meningkatkan kecekapan sistem yang sedia ada. Berdasarkankepada pemerhatian dan juga data yang dipungut, kerja tergendala di lini pengeluaran adalah merupakanmasalah utama. Ia disebabkan oleh sistem pengangkutan bahan yang kurang cekap dan pembahagiankerja yang tidak seimbang.
Teknik pembaikan kerja digunakan untuk mencari penyelesaian yang terbaik bagi mengatasimasalah di atas. Kemudian, kaedah keseimbangan lini digunakan untuk meminimumkan masamelahu pada setiap stesen kerja. Untuk mengesahkan keputusan daripada alternatif-alternatif yangdicadangkan, simulasi dengan menggunakan perisisan Witness telah digunakan. Satu alternatif terbaikdipilih berdasarkan kepada keputusan daripada simulasi dan juga justifikasi kos. Akhir sekali, perancangansumber dijalankan ke arah memenuhi permintaan dan juga memaksimumkan penggunaan sumber.
Daripada keputusan simulasi bagi sistem yang dicadangkan, menunjukkan bahawa produktivitimeningkat sebanyak tiga kali ganda berbanding dengan sistem yang sediada. Walaubagaimanapun,keputusan ini adalah berdasarkan kepada beberapa andaian yang dibuat semasa projek dijalankan.
* Department of Manufacturing & Industrial Engineering, Faculty of Mechanical Engineering, UniversitiTeknologi Malaysia, 81310 UTM Skudai, Johor. E-mail: [email protected]
jt37A[6].pmd 02/16/2007, 19:3373

MUHAMAD ZAMERI MAT SAMAN & LAW CHEAK YING74
Kata kunci: Kerja dalam proses (tergendala) di lini pengeluaran, Kerja dalam proses (tergendala) diluar lini pengeluaran, pembaikan kaedah, keseimbangan lini, simulasi, justifikasi kos, perancangansumber
1.0 INTRODUCTION
Effort to increase the productivity is an important factor for any organization, especiallyfor the manufacturing industries. Productivity may be defined as the ratio of outputagainst input [2]. Utilization of inputs or resources may give the greatest scope for costreduction. Efficiency is a tool to measure any industry organization’s performancewhile productivity used to measure this efficiency [3,4].
In order to improve productivity, various techniques have been developed to tackleproblems from different area such as work study, method improvement, qualityimprovement tools, line balancing technique and simulation approach.
This study investigates the problems that arise at the metal finish line of a carmanufacturing company (for one model only). This is done in order to improve thecurrent situation through work improvement. Metal finish is the second process forthis automobile manufacturer. Improvements had been recommended through thisstudy to improve current situation by carrying out method improvement, linebalancing, simulation using Witness, cost justification and also resources planningand allocation.
2.0 PROBLEM IDENTIFICATION
2.1 Background
Previously, the production capacity of a car manufacturing company is around 2000unit/shift/month. However, due to the unexpected economy crisis, their productiondropped approximately 80% from the previous market demand. The economycrisis also contributed to a high degree of demand fluctuations of productionschedules.
Based on the past one-year data, work-in-progress (WIP) is the major problem amongall of the observed problems as shown in Figure 1. Two types of WIP occurred in thecurrent situation, these are on-line and off-line. The off-line WIP includes cars waitingfor repairs and also those waiting to be sent to paint shop. Meanwhile, the on-line WIPis a queuing problem in the production line. However, this study will concentrate onthe effort to reduce the on-line WIP only.
The causes that contribute to the on-line WIP were identified after conducting aninvestigation from the viewpoint of 4M (man, machine, material and method) as shownin Figure 2. However, from the brainstorming session, the most probably causes thatcontribute the on-line WIP are related to the method that used to carry out jobs atmetal finish line. Basically, the two causes are,
jt37A[6].pmd 02/16/2007, 19:3374

WORK IMPROVEMENT AT A CAR MANUFACTURING COMPANY 75
(i) The operation performed in metal finish line involves a lot of movement aroundthe working area in order to get the materials (parts) and equipment. This problemoccurred due to the workplace arrangement and also material handling system.
(ii) The workload among station is not equal. Some of the station needs higher cycletime to perform several jobs. Some need more time due to repeated manualhandling of heavy parts.
Figure 1 The three major problems identified at metal finish line
PARETO DIAGRAM BY THE MAJOR PROBLEM AT THE METAL FINISH LINE
WIP Count ofnonconformities
Production thatcannot achieve target
100.00%
90.00%
80.00%
70.00%60.00%
50.00%
40.00%
30.00%
20.00%
10.00%
0.00%
Per
cent
age
100.0%
90.0%
80.0%
70.0%
60.0%
50.0%
40.0%
30.0%
20.0%
10.0%0.0%
Cu
mu
lati
ve e
rcen
tag
e
Type the problem
Figure 2 A couse and effect diagram of on-line WIP
Poorskill
Quality issue of rawmaterial/parts
Materialshortage
Breakdowndue to setup
High fatigue
Unbalanceworkload
Lots of movementdue to handling
No standardization ofthe operation steps
Material
OperatorMachine
Method
Breakdowndue topreventivemaintenance
Frequent of machinebreakdown
Online WIP
jt37A[6].pmd 02/16/2007, 19:3375
MUHAMAD ZAMERI MAT SAMAN & LAW CHEAK YING76
2.2 Metal Finish Line Process Flow
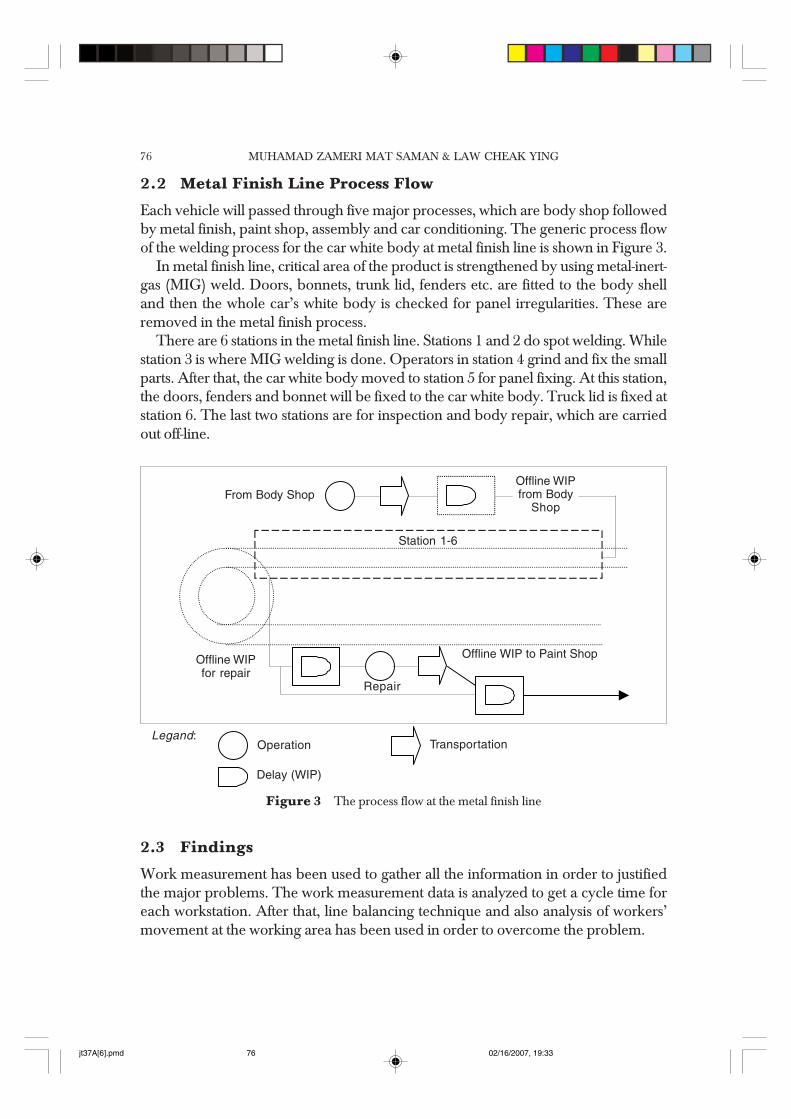
Each vehicle will passed through five major processes, which are body shop followedby metal finish, paint shop, assembly and car conditioning. The generic process flowof the welding process for the car white body at metal finish line is shown in Figure 3.
In metal finish line, critical area of the product is strengthened by using metal-inert-gas (MIG) weld. Doors, bonnets, trunk lid, fenders etc. are fitted to the body shelland then the whole car’s white body is checked for panel irregularities. These areremoved in the metal finish process.
There are 6 stations in the metal finish line. Stations 1 and 2 do spot welding. Whilestation 3 is where MIG welding is done. Operators in station 4 grind and fix the smallparts. After that, the car white body moved to station 5 for panel fixing. At this station,the doors, fenders and bonnet will be fixed to the car white body. Truck lid is fixed atstation 6. The last two stations are for inspection and body repair, which are carriedout off-line.
2.3 Findings
Work measurement has been used to gather all the information in order to justifiedthe major problems. The work measurement data is analyzed to get a cycle time foreach workstation. After that, line balancing technique and also analysis of workers’movement at the working area has been used in order to overcome the problem.
Figure 3 The process flow at the metal finish line
Legand:Operation
Delay (WIP)
Transportation
Station 1-6
Offline WIP to Paint Shop
Offline WIPfrom Body
Shop
Station 1-6
From Body Shop
Offline WIP to Paint Shop
Repair
Offline WIPfor repair
jt37A[6].pmd 02/16/2007, 19:3376

WORK IMPROVEMENT AT A CAR MANUFACTURING COMPANY 77
2.3.1 Work Measurement
The direct time study has been used to determine the cycle time for each workstation.Using a Westing House System of rating, the rating for operator can be judge asshown in Table 1 [5]. As a result, the calculated rating was 90%. But according to theforeman of metal finish line, the average rating for every station is around 75%. Therefore,the rating for the purpose of this project will be compromised between the WestingHouse System of rating and advise from foreman. The averageof both values, that is82.5% will be used.
Table 1 Calculating the rating by using westing house system
Skill C2 +0.03
Effort E2 –0.08
Condition E –0.03
Consistency E –0.02
Total –0.10
Meanwhile, allowances were based on the fatigue allowances suggested byInternational Labor Organization [5]. Before that, some assumptions had been madeas follows,
(i) Atmospheric condition = normal(ii) Noise = normal(iii) Light = normal(iv) The conveyor automatically moves the car white body
Table 2 shows how allowance is deduced. As a result, the calculated allowancewas 15%. After rating and allowance had been considered, the cycle time for eachworkstation and also the total time for a car metal finish line processes as shown inTable 3.
Table 2 The calculated allowance
Personnel 5%
Basic fatigue 4%
Standing 2%
Abnormal position 2%
Tediousness 2%
Total 15%
jt37A[6].pmd 02/16/2007, 19:3377

MUHAMAD ZAMERI MAT SAMAN & LAW CHEAK YING78T
able
3Su
mm
ary
of th
e w
ork
mea
sure
men
t ana
lysi
s
Mod
el:
Hon
da
Civ
ik 4
Doo
rsO
bse
rved
by:
Cyl
awL
ine:
Met
al F
inis
hin
gO
bse
rved
Dat
e:12
/01
/99
– 1
3/01
/99
Des
crip
tion
Stat
ion
Ope
ra-
Rea
ding
(Min
utes
)R
atin
gN
orm
alA
llow
ance
Stan
dard
tor
(s)
%T
imes
%T
imes
12
34
56
78
Ave
rage
Spot
Weld
ing
12
7.96
8.62
8.49
8.70
8.18
7.84
8.41
10.10
8.54
82.5
7.05
158.1
02
27.0
68.1
27.9
28.3
66.9
58.4
88.0
808
.067.8
882
.56.5
015
7.47
Mig
Weld
ing
32
12.98
11.72
13.2
213.6
311
.6011
.1811
.6711
.1812
.1582
.510
.0215
11.52
Fix
Small
Par
t4
210
.7310
.2311
.0610
.3911
.7510
.3211
.1810
.7410
.8082
.58.9
115
10.25
(6 p
arts)
, Grin
ding
& Fl
ange
s Kno
ckin
g
Doo
r, Fe
nder
&5
218
.9820
.9817
.7021
.7217
.2516
.1015
.6018
.0018
.2982
.515
.0915
17.35
Bonn
et
Truc
k Lid
61
5.65
6.33
5.55
6.87
4.85
5.13
5.23
5.43
5.63
82.5
4.64
155.3
4A
lignm
ent
Total
60.16
Assu
mpt
ion:
1W
orki
ng H
our/s
hift (
man
ual)
9 hr 2
3 min
utes
/day
2Pr
oduc
tion D
own T
ime
50 m
inut
es/d
ay3
Mate
rial D
own
Tim
e–
4M
achi
ne D
own T
ime
30 m
inut
es/d
ay5
Allo
wanc
e15
%6
Ratin
g75
%6
Prod
uctio
n Hou
r (m
anua
l)51
3 min
utes
7N
umbe
r of W
orke
rs15
8Th
e cyc
le ti
me f
or ev
ery s
tatio
n is
base
d on
the t
ime p
rese
nted
by o
ne o
f the
ope
rato
r with
the h
ighe
st w
orkl
oad
for t
hat s
tatio
n.
jt37A[6].pmd 02/16/2007, 19:3378

WORK IMPROVEMENT AT A CAR MANUFACTURING COMPANY 79
2.3.2 Analysis of Line Balancing
The summary of the data analysis in the Figure 4, shows that the production line at themetal finish line is not balance. Therefore, the following steps are used to determinethe balance loss ratio or line balancing loss (LBL).
Figure 4 Cycle time for every workstation
( )( )
17 35min
60.16 min
6
6 17 35 60 16LBL 100 100 42 21
6 17 35
max
i
max i
max
T .
t =
n
nT t . .% % % . %
nT .
=
=
− −= × × =
∑
∑
Thus, 42.21% of the production time is idle due to the imbalance line. From Figure4, the station 5 (door, fender and bonnet) currently controls the working speed in themetal finish line. It shows that on-line WIP will occur as station 5 is the main bottleneckstation while cycle time for other stations also varies from one another. It is noted thatthe maximum cumulated WIP in between station 4 and 5 is only 3 cars. This is due tothe space constraint. WIP will not be build up at other stations as there is no spaceprovided for this purpose. However, because of the variation in the cycle time and noWIP space is given, these will cause to other stations to slow down or because idlewhile waiting for parts to arrive.
5.34
17.35
10.2511.52
7.478.10
0.02.04.06.08.010.012.014.016.018.020.0
1 2 3 4 5 6
Work Station
Cyc
le ti
me/
wor
k st
atio
n (m
in)
Work Station
jt37A[6].pmd 02/16/2007, 19:3379

MUHAMAD ZAMERI MAT SAMAN & LAW CHEAK YING80
2.3.3 Analysis of Workers’ Movement
In the metal finish line, most of the workers have to move over certain distance to getthe equipments, materials or parts. Obviously, time and effort are wasted due to thenon-productive movement. Therefore, a study had been carried out to cumulate thetotal distance of worker’ movement.
For a purpose of studying their movement, a string diagram has been used to measurethe path of workers, materials or equipments [6]. To simplify the study, Euclideandistance is used to measure from the objects’ mid-point to another. This study isbased on the movement from the workstation to the bin, rack or shelves to getequipment or material. Table 4 had summarizes the cumulative movement, whichhad shown in string diagram.
Based on the unnecessary movement, the non value-added process time can becalculated. The percentages of the non value-added cycle time can be calculated bydividing the total time of movement with the total cycle time of each workstation. Thispercentage will show which station has the highest percentage of non value addedtime [7].
Total time for movementPercentage of non value-added = –––––––––––––––––––––––––––––––––––
Total cycle time for every workstation
Further analysis will be done on the most critical workstation and suggestimprovement that should be carried out in order to eliminate the unnecessary movementand reduce the cycle time.
2.3.4 Analysis of Finding
Refering to Table 3, the line is clearly not balanced with the highest cycle time at17.35 minutes against the lowest time at 5.34 minutes. Station 5 has the highest cycletime as the workload of both operators is heavy and involved lots of movement toget doors and bonnets. Station 3 also has a high cycle time caused by the unbalancedworkload and non-ergonomic working situation. In this station, both operators haveto weld the critical area that cannot reached by the spot welding gun, such as the floorand firewall of the white car body. Station 4 is the third highest cycle time because theoperators have to fix 6 parts located at different location of the car white body.
As a conclusion, there are two factors that consumes to the unbalanced line atmetal finish line.
(i) The workload between stations has not been equal. Therefore, a study has tocarried out to eliminate unnecessary activities, combine wherever possible,rearrange the sequence of operation and also simplify the operation.
jt37A[6].pmd 02/16/2007, 19:3380

WORK IMPROVEMENT AT A CAR MANUFACTURING COMPANY 81
(ii) The workplace arrangement is not suitable. In other word, the worker cannoteasily grasp tools or parts that are needed to perform their jobs.
2.4 Recommendations
Several recommendations will be suggested in order to overcome the aforementionedproblems at the metal finish line. First, method improvement will be suggested todesign tooling jigs and material handling devices and rearrangement of the workplacelayout. This will be followed by line balancing assuming that all of the suggestedmethod improvement (exclude partially automated for the welding processes) can beadopted into the current situation. This is to minimize the bias in the line balancingalternative, as there are too much non value-added cycle time in the present situation.
As implementation of these suggestions is not part of this study, Witness simulationpackage will be used to simulate the generate and evaluate alternatives. In order tochoose the optimum alternative, cost justification will be used. The alternative withthe minimum operation costs will be chosen. Finally, resources planning and allocationwill be conducted to maximize the utilization of the resources, as the current marketdemand is lower than the line capacity after improvement had been carried out.
Table 4 The measured movement of operators in carrying out their job
Station Description Operator Distant Total time % of non(s) (meters) of movement value added
Left Right (min) cycle time
1 Spot Welding 2 17.8 14.5 1.02 11.71
2 Sport Welding 2 09.0 09.0 2.00 12.36
3 Mig Welding 2 04.13 01.03 0.34 03.26
4 Fix small part 2 54.54 18.88 2.69 22.56(6 parts), Grinding &Flanges knocking
5 Door, Fender & 2 47.20 46.32 1.84 10.62Bonnet
6 Truck Lid Allignment 1 18.60 0.67 10.86
Assumption:
1. The distance that has been measured for every single station is based on the total distance(back and forth) from work station to the bin, rack or tooling.
2. Every distance is calculated based on Euclidean distance, which measures at the mid-point.Movement performed around the car body is neglected.
3. The distance of every grasp movement made by the welder as shown in the process chart isestimated as 1.5 m.
jt37A[6].pmd 02/16/2007, 19:3381

MUHAMAD ZAMERI MAT SAMAN & LAW CHEAK YING82
3.0 METHOD IMPROVEMENT
In the existing situation, there are too much loading and unloading of equipment,repeated manual handling of heavy parts (doors, bonnet and trunk lid) and materialtravelling distances. Therefore, suggestions to improve the current situation includeredesigning tooling the sand material handling devices and also rearrangement of thelayout of metal finish line.
3.1 Station 4
It is suggested that a trolley and tooling jigs is designed for station 4 to eliminate theunnecessary movement in processing parts and tools in order to reduce the cycletime. The principle of motion economy should be emphasized and tools should belocated within the maximum working area and as near to the worker as possible [8].Tools and jigs should be used to hold the torque wrench and grinder.
3.2 Station 5
The manual door fitting process (exclude handling time) need roughly 55% of the totalcycle time of station 5. This includes fifting of the front and rear door. The used ofsetting jigs is proposed to increase the effectiveness of door fixing process. The cardoor setting is placed with a setting jig to get a more effective fitting result.
3.3 Other Suggestions
(i) The implementation of partially automated welding process at metal finish linein order to reduce the cycle time and human error. Robot can also be programmedto carry a consistent numbers of optimum welding point to minimize the weldingcosts. However, manual welding gun cannot be fully replaced by the robot welderbecause certain points cannot be reached by robot arm especially those locatedat the inner side ot the product. Proper planning regarding implementation ofautomated robotic welder should also be carried out as it involves a substantialamount of investment and expertise. Manual-welding process should not becombined with automated welding process at the same station.
(ii) Rearrange and standardize the layout of metal finish line to minimize theunnecessary movement due to poor workplace arrangement and to keep the linetidy and clean. This may be achieve by relocating all of the parts and tools closeto the work station by using the material handling devices and jigs that has beensuggested. Categorize and differentiate all elements in the line to prevent fromunnecessary accidents such as workstation, on-line storage (part/material),accessories (equipment, rack/trolley, stool), scrap part and rework workstation.Identify and fix the location for every category in the line and also use colorful
jt37A[6].pmd 02/16/2007, 19:3382

WORK IMPROVEMENT AT A CAR MANUFACTURING COMPANY 83
tape to build the area for every category. Different color will represent differentmeaning.
(iii) Control the numbers of material in the line through top-up list (material handlingapproach). Parts are brought into the line according to daily production planningand the capacity of material handling device.
4.0 LINE BALANCING
Three manual line balancing method (Largest Candidate Rule, Kilbridge and WesterMethod and Ranked Positional Weight) and four generated alternatives had beenused to balance the current situation [9]. Two major assumptions that had been made,
(i) The aforementioned method improvement is adopted into the current situation(except automated welding processes) in order to eliminate all of the non-valueadded time and minimize the effect of the problems in the current situation.
(ii) The percentage of line balancing loss (%LBL) of 4 generated alternative differfrom the 3 manual line balancing as there is an assumption that the priorityrequirements changed due to relocation of equipment (especially spot guns).
Table 5 shows the results for these line balancing methods in term of percentage ofline balancing loss (%LBL). It shows that manual justification methods produce betterresult than manual line balancing methods. The line balancing loss is improved almostup to 50% by using manual justification. However, for the four generated alternatives,cost justification must be used to compare between them, as the conveyor speed isdifferent.
Table 5 Comparison of the %LBL between manual line balancing methods with other alternatives
Method % LBL Cycle Time
Largest Candidate Rules (LCR) 15.18 6 minutes/ car
Killbridge & Wester (K&W) 15.75 6 minutes/ car
Ranked Positional Weight (RPW) 16.73 6 minutes/ car
Alternative 1 7.48 6 minutes/ car
Alternative 2 7.38 6 minutes/ car
Alternative 3 9.16 5 minutes/ car
Alternative 4 6.47 5 minutes/ car
jt37A[6].pmd 02/16/2007, 19:3383

MUHAMAD ZAMERI MAT SAMAN & LAW CHEAK YING84
5.0 SIMULATION AND COST JUSTIFICATION
Simulation is used to obtain the daily output that can be achieved for every alternativewhile cost justification is used as an indicator to choose the best alternative. Thecomparison between the actual outputs with the simulated current model is used tovalidate the simulation model.
Several assumptions that had been made in the simulation model and costjustification are,
(i) JIT system is applied to the whole process from body shop until car conditioning.Rework operations is neglected.
(ii) Warm up period had been defined as 120 minutes.
(iii) The cost for every equipment is as shown in Table 6.
Table 6 Equipment costs
Items Cost
Spot gun RM 7,000/ unit
MIG Welder RM 1,500/ unit
Torque wrench RM 800/ unit
Grinder RM 800/ units
Trolley RM 500/ unit
Tooling jigs RM 300/ set
Door setting jigs RM 800/ unit
Hammer RM 100/ unit
Labor RM 800/month-person
Table 7 shows the results from the simulation experiments and the cost justification.Alternatives 1 and 2 is almost equal as the daily output and total cost of both alternativesis the same. But, alternative 4 is better than alternative 3 as it has the same output levelas alternative 3 but at a lower cost.
Alternatives 1 and 4 cannot be compared directly as they have different conveyorspeed. However, as compared to alternative 1, alternative 4 has a lower %LBL and a20% increase in output at 17% of initial investment increment. Thus alternative 4 ischosen as the best alternative and the following resources planning and allocation willbe based on this alternative.
jt37A[6].pmd 02/16/2007, 19:3384

WORK IMPROVEMENT AT A CAR MANUFACTURING COMPANY 85
6.0 RESOURCES PLANNING AND ALLOCATION
Alternative 4 is capable of generating around 100 cars per normal working day inmetal finish line and is suitable for high or heavy market demand. However, themarket demand is soft at this moment due to economy crisis that is only ≤ 50 cars perday. Therefore, a proper planning as shown in Table 8 is suggested to allocate resourcesduring soft demand period in order to produce the requirement output at the minimumcosts.
In order to come out with the resources planning and allocation for the soft demand,two major suggestions are,
(i) During soft demand, paint shop will only run once for every two days and onlythree ovens are used to minimize the production costs through reduction inelectricity usage.
(ii) Both body shop and metal finish line will share the same group of workers whenthe demand is soft as most of them are high skilled and experienced workersthat perform all of the job in both of this stations.
Table 7 Daily output and total costs of alternatives
Alternative Normal Working Daily Total Cost %LBLOutput (unit) (RM)
1 86 116,800.00 7.48
2 86 116,800.00 7.38
3 103 139,000.00 9.13
4 103 137,100.00 6.47
Table 8 Resources allocation during soft production period
Week –1 Week 1 Week 2
Fri Mon Tues Wed Thus Fri Mon Tues Wed Thus Fri
Body M – – – – – – – – – – –Shop
A 50 50 50 50 50 50 50 50 50 50 50
Metal M 50 50 50 50 50 50 50 50 50 50Finish
A – – – – – – – – – – –
Paint M &A – 100 – 100 – 100 – 100 – 100Shop(4 oven)
jt37A[6].pmd 02/16/2007, 19:3385

MUHAMAD ZAMERI MAT SAMAN & LAW CHEAK YING86
These operators will be allocated at the body shop in the afternoon section to buildabout 50 white car body to keep as offline WIP. These are to be sent to metal finishline the next morning. And, as paint shop will only switch on once every two days, itwill serve 50 cars for the metal finish line’s offline WIP and another 50 cars build atthat particular day. This cyclic process is suggested to maximize the resources utilizationduring soft demand.
7.0 CONCLUSION
The objective of this project had been achieved, which is to improve the current method,to balance the Metal Finish Line in order to increase the productivity and to optimizethe resources utilization in an efficient way.
The problem of online WIP is contributed by the unbalanced and poor layoutarrangement. Therefore, three recommendations are presented in this project to improvethe current situation. First, method improvement is recommended in order to reducethe non-value added cycle time or movement. Second, material handling device andjigs had been designed to help the operator to reduce unnecessary movement andhelp perform their work in a more efficient manner. Third, after assuming that all ofthe non-values add cycle time had been eliminated, effort to balance the line throughmanual line balancing and manual justification methods is made. Finally, Witnesssimulation package and cost justification method had been used to evaluate and choosean alternative capable of increasing the line capacity and also to optimize the resourcesutilization through better resources allocation.
From the results obtained, alternative 4 should be considered, as the productivity isincrease roughly 3 times from the current line capacity. However, this result is onlymeaningful during high demand. This cannot be used for the current situation as thedemand is soft due to economy crisis. Therefore, it is suggested that a proper planningregarding the allocation of the line resources should be conducted in order to maximizethe utilization of these resources at a minimum operating cost. Attention should alsobe given to the assumptions that had been made in this study during the imple-mentation of the recommendation outlined in this paper.
REFERENCES[1] Philip, E. H. 1994. Industrial Engineering and Management: A New Perspective. USA: McGraw-Hill.[2] International Labor Organization. 1986. Introduction To Work Study. India: Universal Publishing Corp.[3] Lawrence, S.A. 1992. Productivity Measurement and Productivity. USA: Prentice Hall.[4] Turner, W. C., Mize. J. H., Case, K. E. and Nazemetz, J. W. 1993. Introduction To Industrial And Systems
Engineering. USA: Prentice Hall.[5] Kanger, B. 1977. Engineered Work Measurement, 3rd ed., USA: Industrial Press.[6] Tompkims, J.A. 1996. Facilities Planning, John Wiley & Sons, Canada.[7] Gerald, N. 1957. Work Simplification. USA: McGraw-Hill Book Company.[8] Marvin E. M. 1985. Motion and Time Study, 6th ed., . USA: Prentice Hall.
jt37A[6].pmd 02/16/2007, 19:3386

WORK IMPROVEMENT AT A CAR MANUFACTURING COMPANY 87
[9] The Association for Overseas Technical Scholarship. 1994. Line-balancing Type Process Design. Japan:Kansai Kenshu Center.
[10] Witness Training Manual. 1994. AT&T ISTEL Limited.
jt37A[6].pmd 02/16/2007, 19:3387