work breaks, employee morale, and satisfaction in the
TRANSCRIPT

Walden UniversityScholarWorks
Walden Dissertations and Doctoral Studies Walden Dissertations and Doctoral StudiesCollection
2016
Work Breaks, Employee Morale, and Satisfaction inthe Restaurant IndustryLaura A. OliverWalden University
Follow this and additional works at: https://scholarworks.waldenu.edu/dissertations
Part of the Business Administration, Management, and Operations Commons, ManagementSciences and Quantitative Methods Commons, and the Organizational Behavior and TheoryCommons
This Dissertation is brought to you for free and open access by the Walden Dissertations and Doctoral Studies Collection at ScholarWorks. It has beenaccepted for inclusion in Walden Dissertations and Doctoral Studies by an authorized administrator of ScholarWorks. For more information, pleasecontact [email protected].

Walden University
College of Management and Technology
This is to certify that the doctoral dissertation by
Laura Oliver
has been found to be complete and satisfactory in all respects,
and that any and all revisions required by
the review committee have been made.
Review Committee
Dr. Steven Tippins, Committee Chairperson, Management Faculty
Dr. Godwin Igein, Committee Member, Management Faculty
Dr. Diane Stottlemyer, University Reviewer, Management Faculty
Chief Academic Officer
Eric Riedel, Ph.D.
Walden University
2016

Abstract
Work Breaks, Employee Morale, and Satisfaction in the Restaurant Industry
by
Laura Anne Oliver
MA, Webster University, 2011
BS, Hawaii Pacific University, 2008
Dissertation Submitted in Partial Fulfillment
of the Requirements for the Degree of
Doctor of Philosophy
Management – Human Resource Management
Walden University
October 2016

Abstract
Work breaks during an individual’s shift can be a powerful motivational tool for
management; however, not all individuals receive breaks during their shifts. The purpose
of this phenomenological, qualitative study was to explore how work breaks affect
employee morale and satisfaction in the casual and fine dining restaurant industry. The
questions explored in this study were related to the breaks effect employee satisfaction
and morale in the casual and fine dining restaurant industry. Thirteen participants with a
minimum of 5 years’ experience as wait staff who worked more than 6 hours per day
were interviewed using semi structured interviews. The results were analyzed using a
modified version of van Kaam’s method and MAXqda software. The results suggested
that breaks did not directly affect employee satisfaction and morale; however,
management style directly affected employee satisfaction and morale. The results from
this study may help managers have a better understanding of how their interactions and
dealings with employees affect employee satisfaction and morale. This research may spur
a field-changing management training, which could promote positive social change for
employees.

Work Breaks, Employee Moral, and Satisfaction in the Restaurant Industry
by
Laura Anne Oliver
MA, Webster University, 2011
BS, Hawaii Pacific University, 2008
Dissertation Submitted in Partial Fulfillment
of the Requirements for the Degree of
Doctor of Philosophy
Management – Human Resource Management
Walden University
October 2016

Dedication
This study is dedicated to my husband, Paul, and two children, Patricia and
Anthony. To my wonderful children, Patricia and Anthony, thank you for being patient
with me and understanding when I had to work on this study for the last two years. To
my dearest husband, Paul Oliver, without your constant support, love, guidance, patience,
and faith in me, this milestone would not be possible. Thank you for believing in me,
pushing me, and always being there for me. This great accomplishment would not have
happened without my awesome support system.

Acknowledgments
First, I’d like to thank God for giving me the patience, guidance, energy, and
courage to start and complete this journey.
Next, thank you to my committee members: Dr. Steven Tippins, my committee
chair and subject expert; Dr. Godwin Igien, the method expert on my committee; and Dr.
Diane Stottlemyer, my URR, for your guidance, support, and direction during this study.
I will be forever grateful to you all!
To my wonderful family and friends who have made this journey with me, thank
you for your support and encouragement. Special thanks to my best friend, Leslie Boyce,
for all the encouragement you gave me. To my father-in-law, John Oliver, thank you for
helping with the kids during my residencies. To my step-father, Paul Lukowich, and my
mother, Patricia Lukowich, without your constant support and help with the kids
(especially for the last two chapters), this paper would not be finished today. Last, to my
husband and children, I will be forever grateful for your love, patience, and
understanding!

i
Table of Contents
List of Figures ......................................................................................................................v
List of Tables ..................................................................................................................... vi
Chapter 1: Introduction ........................................................................................................1
Foundation of the Study .................................................................................................1
Background ....................................................................................................................1
Problem Statement .........................................................................................................3
Purpose of the Study ......................................................................................................4
Research Questions ........................................................................................................4
Conceptual Framework ..................................................................................................5
Figure 1. Intrinsic and extrinsic factors that can be affected by breaks. ..............................6
Nature of the Study ........................................................................................................6
Definitions......................................................................................................................8
Assumptions ...................................................................................................................9
Scope and Delimitations ..............................................................................................10
Limitations ...................................................................................................................11
Significance..................................................................................................................11
Significance to Practice......................................................................................... 11
Significance to Theory .......................................................................................... 12
Significance to Social Change .............................................................................. 13
Summary ......................................................................................................................14
Chapter 2: Literature Review .............................................................................................16

ii
Literature Search Strategy............................................................................................16
Conceptual Framework ................................................................................................17
Qualitative Research ............................................................................................. 18
Phenomenological Studies .................................................................................... 19
Literature Review.........................................................................................................21
Herzberg Two-Factor Theory ............................................................................... 21
Work Breaks ......................................................................................................... 25
Employee Morale .................................................................................................. 32
Employee Satisfaction .......................................................................................... 37
Motivation ............................................................................................................. 43
Restaurant Industry ............................................................................................... 47
Summary and Conclusions ..........................................................................................49
Chapter 3: Research Method ..............................................................................................51
Research Design and Rationale ...................................................................................51
Role of Researcher ................................................................................................ 53
Methodology ................................................................................................................54
Participant Selection Logic ................................................................................... 54
Instrumentation ..................................................................................................... 56
Pilot Study ............................................................................................................. 58
Procedures for Recruitment, Participation, and Data Collection .......................... 59
Data Analysis Plan ................................................................................................ 62
Issues of Trustworthiness .............................................................................................63

iii
Creditability .......................................................................................................... 64
Transferability ....................................................................................................... 64
Dependability ........................................................................................................ 65
Confirmability ....................................................................................................... 65
Ethical Procedures ................................................................................................ 65
Summary ......................................................................................................................66
Chapter 4: Results ..............................................................................................................67
Pilot Study ....................................................................................................................67
Research Setting...........................................................................................................68
Demographics ..............................................................................................................70
Data Collection ............................................................................................................72
Data Analysis ...............................................................................................................74
Evidence of Trustworthiness........................................................................................76
Credibility ............................................................................................................. 77
Transferability ....................................................................................................... 77
Dependability ........................................................................................................ 77
Confirmability ....................................................................................................... 78
Study Results ...............................................................................................................78
IQ1, 2, & 3: Ice breaker questions ........................................................................ 78
IQ4: Do you get breaks during your shift? ........................................................... 81
IQ5: Do you feel satisfied with your employer/work? ......................................... 83
IQ6: Do you feel your morale at work is good or bad? ........................................ 84

iv
IQ7: What could your employer do to increase your satisfaction? ....................... 85
IQ8: What could your employer do to increase your morale? .............................. 86
IQ9: When you get breaks during your shift, does it help your morale
improve? ................................................................................................... 87
IQ10: When you get breaks during your shift, does it help your
satisfaction improve? ................................................................................ 87
Summary ......................................................................................................................88
Chapter 5: Discussion, Conclusions, and Recommendations ............................................89
Interpretation of Findings ............................................................................................89
Research Question 1 ............................................................................................. 90
Research Question 2 ............................................................................................. 91
Research Data Versus Literature Review ............................................................. 92
Limitations of Study ....................................................................................................96
Recommendations ........................................................................................................97
Implications..................................................................................................................99
Conclusions ................................................................................................................101
References ........................................................................................................................102
Appendix A: Interview Questions ...................................................................................126

v
List of Figures
Figure 1. Intrinsic and extrinsic factors that can be affected by breaks. ............................. 6
Figure 2. How breaks affect morale and how to increase morale ..................................... 90
Figure 3. How breaks affect satisfaction and how to increase satisfaction....................... 91

vi
List of Tables
Table 1. Demographic Characteristics of Study Participants ........................................... 71
Table 2. Years of Participants’ Experience....................................................................... 79
Table 3. Positions Held by Participants ............................................................................ 80
Table 4. Typical Daily Duties of Participants ................................................................... 80
Table 5. Did Participant Get Meal Breaks ........................................................................ 81
Table 6. Did Participants Get Rest Breaks........................................................................ 82
Table 7. Length of Breaks ................................................................................................. 83
Table 8. Participants Satisfaction with Employer ............................................................. 83
Table 9. Participants Morale at Work ............................................................................... 85
Table 10. How Participant Thought to Increase Satisfaction ........................................... 86
Table 11. How Participant Thought to Increase Morale ................................................... 86
Table 12. How Breaks Affect Morale ............................................................................... 87
Table 13. How Breaks Affect Satisfaction ....................................................................... 88
Table 14. Fine Dining Participants vs. Casual Dining Participants .................................. 96

1
Chapter 1: Introduction
Foundation of the Study
Numerous employment laws have been enacted since the 1960s to help
employees create improved, safer work environments (Brooks, Dougherty, & Price,
2015). Although federal, state, and local governments have addressed several safety
concerns, few existing laws address breaks during the workday (Barker, 2014). An area
of concern for individuals in the workplace is the need for employees to take breaks
during their workday to recoup energy, stamina, and drive (Smith, 2013; Fritz, Demsky,
Lin, & Guros, 2013). Most studies on employee safety have focused on the service
industry (Easton, 2014), administrative positions (Trougakos, Hideg, Cheng, & Beal,
2014), and manufacturing (Tucker, 2003). Research on breaks in the restaurant industry
is scarce.
In this study, I reviewed research on employee morale, satisfaction, work-time
breaks, and other work conditions, and I found a gap in the literature. I will discuss the
problem statement, along with the purpose of the study. The research questions and
conceptual framework follow. I then discuss the nature of the study, definition of terms,
assumptions, and scope and delimitations. Finally, I address the limitations and
significance of the study.
Background
Many aspects of an employee’s work life are influenced by federal law, except for
rest and lunch breaks. During the early part of the 20th century, employer atrocities
spurred the Fair Labor Standards Act (FLSA) in 1938 (Lavin & DiMichele, 2016). This

2
law addressed minimum wage and rules for overtime pay, defined a workweek, included
provisions for child labor, and required paperwork for employees in the workplace (Lavin
& DiMichele, 2016). In the 1960s, lawmakers attempted to limit discrimination in the
workplace based on race, gender, religion, skin color, national origin, and age (U.S.
Equal Employment Opportunity Commission, 2016). In the 1970s, new laws protected
pregnant women and individuals with disabilities (U.S. Equal Employment Opportunity
Commission, 2016). In the 1990s, laws were strengthened for individuals with disabilities
(U.S. Equal Employment Opportunity Commission, 2016).
Work breaks are monitored by the U.S. Department of Labor (DOL), but only to
the extent that breaks may be paid or unpaid and not from mandates. At the state level,
fewer than half of the states have laws regulating the two types of employee breaks: rest
breaks and lunch breaks (Segal, 2013). Rest breaks are typically defined as breaks of 20
minutes or shorter during the workday. Lunch or meal breaks are typically breaks that are
30 minutes or longer. California has been a trendsetter with regard to state law and legal
challenges to work breaks. Suchyta (2014) recognized the need for additional research to
compel additional “legislation and litigation” on the topic (p. S-4).
Many researchers have examined work breaks during the workday and their
effects on employees. Trougakos et al. (2014) studied how employees recover from their
workday during lunch breaks. Tucker (2003) studied the effects that work breaks have on
accidents, fatigue, and performance. Bechtold, Janaro, and De Witt (1984) addressed the
effects that work breaks have on production. Binnewies, Sonnetag, and Mojza (2009) and
Demerouti, Bakker, Sonnentag, and Fullagar (2012) studied recovery and job

3
performance. Dababneh, Swanson, and Shell (2001) addressed the effects that rest breaks
have on workers’ well-being. More recently, Sung Doo et al. (2014) studied the effects of
on line work breaks and how they affected employee performance. However, research is
scarce on work breaks in the restaurant industry and their effects on employee motivation
and morale.
Problem Statement
The lack of rest or lunch breaks during a typical workday contributes to decreased
employee morale and satisfaction (Baltazar, 2014; Robison, 2012; Trougakos et al.,
2008). In light of sparse literature on the topic, more research is needed to understand the
effects that breaks have on individuals in the restaurant industry in particular. Results
may be useful to leaders in the restaurant industry and other industries and may help
develop field-changing management training.
Many people falsely assume that breaks during the workday are regulated by
federal or state law or corporate social responsibility (CSR). The only federal regulation
is that if a break is shorter than 30 minutes, the employer must pay the employee; breaks
of 30 minutes or longer can be unpaid (Lau, Albright, & Collis, 2013; Segal, 2013). Only
21 states regulate lunch or meal breaks (Suchyta, 2014), and only seven states regulate
rest breaks during the workday (Suchyta, 2014).
The federal government has only loosely defined what paid and unpaid breaks
(Lau et al., 2013; Segal, 2013). Dababneh et al. (2001) defined a lunch break as 30
minutes and rest breaks as 3, 9, and 15 minutes. Bechtold et al. (1988) described a rest
break as 15 minutes. Based on the loose definition of the U.S. DOL (2016) and other

4
researchers’ definitions (Bechtold el at., 1988; Dababneh et al., 2001), a rest break is
defined in this study as a paid break lasting 5–20 minutes; any unpaid break that lasts 30
minutes or longer is a lunch break.
Purpose of the Study
The main purpose of this phenomenological, qualitative study was to explore how
work breaks affect employee morale and satisfaction in the casual and fine dining
industry. Vagle (2014) suggested that researchers use phenomenological studies to better
understand certain phenomena.
According to Murphy, DiPietro, Rivera, and Muller (2009), employee morale and
satisfaction have a significant effect on turnover. With an approximate rate of 82% each
year, turnover is one of the most serious issues facing the restaurant business (Murphy et
al., 2009). Thus, it is important for the industry to learn how to keep employees and
reduce turnover rates. Previous research has shown that an increase in job satisfaction
creates less turnover (Hur & Adler, 2011; Murphy et al., 2009; Weyant, 2009) and
reduces the cost of locating, hiring, and training new employees.
Research Questions
I explored the following research questions in this study:
1. What is the impact of breaks on employee morale in the casual and fine
dining restaurant industry?
2. What is the impact of breaks on employee satisfaction in the casual and fine
dining restaurant industry?
The interview questions were as follows:

5
1. How many years of experience do you have in the restaurant industry?
2. How many different serving positions have you held?
3. How would you describe a typical day working as a server?
4. Do you get a break during your shift? When? How long? Why or why not?
5. Do you feel satisfied with working in the restaurant industry?
6. Do you feel your morale at work is good or bad?
7. What could your employer do to increase your satisfaction?
8. What could your employer do to increase your morale?
9. When you get breaks during your shift, does it help your morale improve?
10. When you get breaks during your shift, does it help your satisfaction
improve?
Conceptual Framework
In this study, I used phenomenological theory, using Herzberg’s two-factor theory
(Teck-Hong & Waheed, 2011), as the main qualitative design. In keeping with
Herzberg’s two-factor theory of motivation and hygiene factors (Buble et al., 2014;
Dartey-Baah. 2011; Teck-Hong & Waheed, 2011), I explored intrinsic and extrinsic
factors (Buble et al., 2014). Intrinsic factors, such as employee satisfaction and morale,
are internal factors located within the individual that “produce satisfaction” (Cinar,
Bektas, & Aslan, 2011, p. 691) and help motivate. Extrinsic factors, such as breaks given
by management, are external factors located outside an individual, typically associated
with managers (Cinar et al., 2011).

6
Herzberg’s theory provides a better understanding of how employee satisfaction
and morale are affected by breaks, or the lack thereof. With turnover rates being one of
the most important problems in the restaurant industry (Murphy et al., 2009), I designed
this study to help employers understand how employee satisfaction and morale affect the
turnover, which in turn may help improve human resource practices and improve
employee satisfaction and morale. One way to combat high turnover rates is to use
Herzberg’s two-factor theory to help motivate employees both internally and externally.
Figure 1. Intrinsic and extrinsic factors that can be affected by breaks.
Nature of the Study
I used a qualitative method because I examined a social issue (Schwandt, 2015),
which requires a more flexible (Astalin, 2013) approach than quantitative research could
provide (Maxwell, 2013). In addition, Astalin (2013) stated that qualitative research is
preferred when trying to understand “a social or cultural phenomena” (p. 118), whereas
quantitative research attempts to understand data based on objective methods. The
Employee
morale
(intrinsic factors)
Employee
satisfaction (intrinsic factors)
Work breaks
Motivation
(extrinsic factors)

7
philosophical assumption that was used is ontological because ontological communicates
reality. Real-world experience needed to be captured from the participants. I collected
data were through the main data collection tools used in qualitative research: video-chat
interviews, member checks, and other means of fieldwork in the restaurant industry
(Patton, 2015). Statistics were not appropriate for this study, and a small sample tested
will not necessarily help others, which excluded quantitative methods (Patton, 2015) for
this project.
A phenomenological design is used to study how an individual experiences a
phenomenon, given their experience (Vagle, 2014). Understanding how something is
experienced through the eyes of an individual living a phenomenon explains the
“lifeworld” (Vagle, 2014, p. 22) rather than the world that is measured, correlated, and
categorized. Individuals provided their version of events or situations, which in turn
helped have a better understanding how things manifest and appear to individuals in the
restaurant industry.
I considered other qualitative methods for this project; however, I rejected them
for various reasons. I considered grounded theory, but the main premise behind this
theory was to set new “theory of social phenomena” (Schwandt, 2015, p. 131). Based on
past research, I rejected this method because theory already exists regarding breaks in the
workplace. I also considered ethnography to study how a certain culture behaves
(Schwandt, 2015)—here, waiters and waitresses in the restaurant industry. However, I
rejected this method. I did not study the culture of the individuals; instead, I explored

8
how individuals react to breaks versus no breaks during a work shift lasting more than 6
hours.
Definitions
Employee morale – Along with job satisfaction, morale is developed by an
employee’s attitude of the organization in which he or she works (Arunchand &
Ramanathan, 2013).
Employee satisfaction – An employee’s positive emotional state about his or her
work environment (Mahmood, Attiq, & Azam, 2014).
Fatigue – Loss of alertness, energy, and motivation during the work day
(Subramanyam, Muralidhara, & Pooja, 2013).
Herzberg’s two-factor theory – Research-backed theory that states that certain job
factors cause job satisfaction, while others cause job dissatisfaction (Dartey-Baah &
Amoako, 2011).
Hygiene factors – Also referred to as environmental factors or extrinsic factors,
the factors not directly related to the job but that still have an effect on an employee
(Dartey-Baah & Amoako, 2011).
Lunch break – Rest periods during the workday lasting a minimum of 30 minutes
during which an employee is relieved from all work duties and receives no pay for the
time (Segal, 2013; U.S. DOL, 2016).
Motivation – “Establishing goal-oriented behavior” (Buble, Juras, & Matic, 2014,
p. 166).

9
Motivational factors – Also referred to as intrinsic factors, these are factors in the
workplace that are directly related to job (Dartey-Baah & Amoaka, 2011).
Rest break – Rest periods during the work day lasting between 5 and 20 minutes
and that are paid for by the company (Segal, 2013).
Restaurant industry – Single unit, independently owned facilities (Weyant, 2009).
Turnover – When individuals leave a place of employment and another individual
must be trained or moved into a position to fill the vacancy (Soltis, Agneessens,
Sasovova, & Labianca (2013).
Assumptions
Understanding and addressing the assumptions is vital to any research project
(Davis, 2013). Assumptions are “explicit mental acts” (Weidenfeld, 2011, p. 234) in
which an individual assumes the answer is already known. It also helps to focus on
validity (Weidenfeld, 2011) by bringing forward the assumptions that the researcher has.
The researcher can then create validity checks to ensure the collected data are valid.
I undertook the study with eight assumptions regarding the participants:
• Individuals wanted to participate in this study.
• Participants were honest in their answers.
• Managers were forth coming with honest information.
• All participants would participate fully to achieve a 100% participation rate.
• Managers and employees would have different answers to similar questions.
• Face-to-face (via video call) unstructured interviews would be the best method
to collect data for processing.

10
• Participants would not feel pressured into giving a certain answer or response.
• Participants would be too busy to receive breaks during a minimum of one shift
a week.
Scope and Delimitations
One of the areas in which quantitative and qualitative methods differ is in the
sampling size. Unlike quantitative research, qualitative methods, including
phenomenology, do not require a select percentage of the population (Berg & Lune,
2012); instead, researchers look for purposive sampling instead of random sampling
(Miles, Huberman, & Saldana, 2014). In addition, although there is no general rule
(Patton, 2015, p. 228) for qualitative sampling size, Hill and Williams (2012)
recommended a sample size between 12 and 15 participants because this number has
been shown to show consistency with results regarding participants’ answers. Therefore,
13 individuals participated.
Interviews are the main instrument for qualitative data collection (Patton, 2015);
however, I used triangulation to validate any findings (Miles et al., 2014; Patton, 2015). I
asked questions regarding participants’ workplace environment, their satisfaction at
work, their morale, and how their breaks affected their morale and satisfaction. The 13
participants were a mix of males and females with at least 5 years of restaurant
experience and included both managers and wait staff. My requirement for at least 5
years of restaurant experience ensured that participants had adequate experience within
the field to answer the interview questions.

11
Limitations
Limitations in research pertain to the potential weaknesses (Simon, 2011) that are
out of a researcher’s control during a study, which can occur regardless of the method
used (Patton, 2015). Limitations should be stated so readers can have a full understanding
of the circumstances under which the study was conducted (Patton, 2015). Other
researchers replicating a similar study can benefit from knowing the limitations. To
ensure the data collected were valid, I used triangulation during the data collection and
processing portion, by using interviews, voice recordings, and member checking.
Although the restaurant industry offers many avenues for research, this study was
limited to studying employee satisfaction and morale only. All interviewees were actively
working within a 50-mile radius of Clarksville, Tennessee, and had 5 or more years of
experience as servers. As a result, responses are limited by how breaks are given in this
region, by employee expectations, and by Tennessee laws.
Significance
Understanding the significance of a study is imperative to conducting a successful
research project (Maxwell, 2013). This study was designed to fill in a gap in research
regarding employee breaks in the restaurant industry. The study is significant to the
following: practice in the human resources (HR) profession and restaurant industry;
theory, which includes qualitative phenomenology; and social change.
Significance to Practice
Understanding what drives an employee’s loyalty and his or her job satisfaction is
an important part of organizational goals. Mahmood et al. (2014) examined the effects of
12
an “individual’s motivational factors” (p. 149) with regard to employee satisfaction. Van
Scheers and Botha (2014) examined the perceptions of job satisfaction of employees in
the retail industry to measure the relationship between job satisfaction and employee
motivation. However, there has been little linkage between rest and lunch breaks with
regard to employee motivation, which I examined.
No federal laws mandate work breaks (Gurchiek, 2011). The purpose of breaks is
not merely to treat employees well; breaks can help motivate employees, which can
increase employee morale and satisfaction (Bechtold et al., 1984; Dababneh et al., 2001;
Trougakos et al., 2014). Research shows that employees who are unhappy are less
productive: they tend to do only the bare minimum, and their attention to detail and
customers suffer (Robison, 2012). These issues are relevant to the HR community,
because humans are the greatest resource an organization can have (Onyema, 2014).
Thus, HR professionals must look for ways to improve employee morale and satisfaction.
Significance to Theory
Many researchers have studied breaks in the workplace, with the majority of the
research being conducted in the manufacturing area (Bechtold et al., 1984; Onyema,
2014; Trougakos et al., 2008, 2014). Implementing work breaks during the workday
helps employees maximize productivity (Bechtold et al., 1984); reduces fatigue
(Trougakos et al., 2014); reduces accident risk (Tucker, 2003); and helps employees
recover during the workday (Demerouti et al., 2011; Trougakos et al., 2008). A review of
the literature showed that in only one study, breaks failed to boost productivity (Fritz,
2012).
13
This study expands on recent research by looking at the effects of breaks on the
restaurant industry. Employers in the industry need to find ways to cut costs and improve
customer satisfaction (Gazzoli, Hancer, & Park, 2012; Murphy et al., 2009). Finding
ways to improve employees’ attitudes can increase customer satisfaction (Gazzoli et al.,
2012), which can mean repeat business and increased profits. Moreover, reducing costs is
necessary for a business to remain successful. In the restaurant industry, the highest cost
facing employers is turnover, which is strongly related to employee satisfaction (Murphy
et al., 2009). Given that Americans spend 47% of their money on food (Hur & Adler,
2011), understanding how to keep restaurant employees engaged, motivated, and satisfied
is an important research endeavor.
Significance to Social Change
Bringing about positive social change to the world can take place in terms of
“goals, objectives, and values” (Bano, 2014, p. 773). Social change is an important part
of educational programs (Bano, 2014), including Walden University, and the business
world (Singh & Dutch, 2014; Ebrashi, 2013). The effects of social change on a dynamic
business world are abundant, and being able to influence and enact positive change is an
important part of leadership (Singh & Dutch, 2014). Allowing managers and leaders to
use the human resources of a company to enact positive social change is imperative to
improving how businesses are run, how they grow, and how they increase their
profitability.
This research focused on the effect work breaks have on individual servers in the
restaurant industry. The positive social change aspects include potential reductions in

14
turnover along with increased customer and employee satisfaction and profit margins.
Human resources departments and leadership will benefit by knowing if employee breaks
can lead to increased employee morale and satisfaction. If restaurant employees describe
positive effects of breaks, future mandated work breaks could result in positive social
change in the employment world, in addition to field changing management training.
Summary
In this chapter, I provided an overview of work breaks in the United States. No
federal laws mandate work breaks in the workplace (U.S. DOL, 2016); furthermore,
fewer than half the states have laws regulating them (Segal, 2013). A lack of laws can
have negative effects on employee morale and satisfaction (Baltazar, 2014; Robison,
2012; Trougakos et al., 2008), which can hurt customers and ultimately lead to decreased
profitability and a damaged reputation.
I designed this phenomenological, qualitative study to investigate how work
breaks affect employee morale and satisfaction for servers in the casual and fine dining
restaurant industry. Using Herzberg’s two-factor theory (Teck-Hong & Waheed, 2011), I
explored intrinsic factors as the motivation factor and extrinsic factors as the hygiene
factor (Buble et al., 2014) to see how they affect employee morale and satisfaction. I
discussed operational definitions and assumptions, scope, delimitations, and limitations
were discussed. Last, I briefly addressed the significance of this study to the HR
profession, business leadership, scholarship, and social change.
In the next chapter, I offer a deeper look at the literature on employee breaks.
Further details of the research method appear in Chapter 3. In Chapter 4, I will detail the

15
pilot study and the regular study. In Chapter 5, I will discuss the results, conclusions, and
recommendations.

16
Chapter 2: Literature Review
In this study, I explored how a server’s morale and satisfaction are affected by
work breaks during a 6-hour or longer shift in the casual and fine dining restaurant
industry. The main purpose of this phenomenological, qualitative study was to explore
the effects on employee morale and satisfaction when giving servers in casual and fine
dining restaurants work breaks during a workday(Hur & Adler, 2011; Iqbal, Yusaf,
Munawar, & Naheed, 2012). A subsequent purpose of this study was to determine
whether employee morale and satisfaction have a positive or negative effect on the
restaurant business. According to Murphy et al. (2009), employee morale and satisfaction
have a considerable effect on turnover. The turnover rate of 82% each year is the most
serious problem facing the restaurant business (Murphy et al., 2009); therefore, it is
important to find if there is a link to increased morale and satisfaction causing less
turnover (Hur & Adler, 2011; Murphy et al., 2009; Weyant, 2009), which would help
organizations lower turnover costs.
In this chapter, I discuss the search strategy, databases, and key terms, which are
followed by the conceptual foundation and the background of the methodological choice.
The literature review covers breaks, employee morale, employee satisfaction, and
turnover.
Literature Search Strategy
According to Machi and McEvoy (2012), a literature search should consist of
“collecting, cataloging, and documenting data” (p. 38). For this literature review I

17
searched Business Source Complete, ABI/INFORM Complete, Google Scholar, and
Emerald Management databases. Initial search terms included work break, lunch break,
and rest break, followed by work breaks in the restaurant industry, lunch breaks in the
restaurant industry, and rest breaks in the restaurant industry. Next, I combined the
terms employee morale and employee satisfaction with in the restaurant industry. Then, I
combined and used breaks and employee morale and satisfaction were to find literature
that addressed both. Last, I combined breaks and employee morale and satisfaction with
restaurant industry, which produced no results. Other terms that I used for the restaurant
industry included casual and fining dining restaurant, food service, and service industry.
Other terms that I used for the literature were human resource, human resource
management, Herzberg, two-factor theory, qualitative research, phenomenology,
motivation, employee motivation, and social change. I combined these terms in many
ways. In addition, I initially searched articles regardless of the date of publication and
then narrowed to articles written only since 2011.
Conceptual Framework
As previously stated, I used phenomenological theory, using Herzberg’s two-
factor theory (Teck-Hong & Waheed, 2011; Islam & Ali, 2013) as the main qualitative
design. In this section, I examine the conceptual framework of qualitative research and
phenomenological methods and why I chose them for this project. I discuss Herzberg’s
two-factory theory in detail in the next section.
18
Qualitative Research
According to Patton (2015), some studies require “numerical answers; some
don’t” (p. 13). Quantitative research investigates a problem using counts and measures
(Berg & Lune, 2012); qualitative research methods address what, how, when, and where
to investigate. Quantitative research uses numerical answers based on variables and
statistics (Maxwell, 2013) to explain relationships or data during its experiments. The
main data collection used for this method is surveys and experiments (Parylo, 2012),
which allows for researchers to use different strategies, such as experimental design and
correlation studies (Parylo, 2012).
Rossiter (2008) argued that before the 1960s qualitative research was held as
inferior to quantitative methods; however, triangulation has improved the credibility of
qualitative research. Triangulation is a method employed in qualitative research wherein
a combination of methods are used to collect data during an experiment (Berg & Lune,
2012; Patton, 2015; Vizzuso, 2015). Qualitative research, which became popular in the
1960s, is defined as a nonstatistical way to evaluate, analyze, and interpret data by using
techniques such as unstructured open-ended interviews (Patton, 2015), observation, and
analyzing written documents to gather data (Patton, 2015; Schwart, 2007). Freeman,
Gergen, and Josselson (2015) contended qualitative research found its beginning in the
1960s and was spawned by the civil rights movement and the need to research certain
groups based on a more humanistic way than quantitative research methods provided
(Freeman et al., 2015). Feminist inquiry, queer theory, and ethnographic methods all
emerged at that time (Freeman et al., 2015; Patton, 2015).

19
Qualitative research differs from quantitative research in many ways. Qualitative
researchers, who seek to understand a social or cultural phenomenon (Astalin, 2013), do
not know the variables beforehand what and how they are related (Rossiter, 2008).
Instead, the variables are discovered organically (Astalin, 2013) during the study. The
relationships are then defined during data gathering (Rossiter, 2008). From there, a
testable “minitheory” emerges. In this way a qualitative researcher gathers data in real-
world situations (Rossiter, 2008).
The second way qualitative and quantitative research differ is in sampling size.
Where quantitative research requires a large enough sample to ensure the researcher has
enough participants to be able to capture a statistical significance (Miles et al., 2014),
qualitative research uses a method that generally requires fewer participants (Miles et al.,
2014; Suri, 2011). In purposeful sampling, a researcher gathers enough data regarding an
issue to learn the importance of the purpose being researched (Patton, 2015). The
appropriate sample size of a study can vary from one person to groups larger than 10
individuals (Marshall, Cardon, Poddar, & Fontenot, 2013; Miles et al., 2014; Patton,
2015). For this study, a sample of 13 participants was sufficient.
Phenomenological Studies
Astalin (2013) discussed the four most commonly used qualitative research
designs: ethnography, grounded theory, case study, and phenomenology. Ethnography,
also referred to as cultural anthropology (Patton, 2015; Schwandt, 2015), is used to study
the culture of people or a group of individuals who have something of culture in common
(Astalin, 2013). Ethnographic research is done with a considerable amount of fieldwork,

20
in which the researcher emerges himself or herself into the “life” of the culture being
studied (Brown, 2013). The fieldwork typically lasts 6 months to a year, which was not
conducive to this research project.
Grounded theory focuses on developing new ideas or theories (Patton, 2015;
Schwandt, 2015) that are “grounded in data” (Astalin, 2013). In this type of research,
researchers have no “predetermined theory” (Astalin, 2013); instead, they use specific
steps and procedures (Astalin, 2013), along with fieldwork (Patton, 2015), to explain how
the experiences studied generate new knowledge (Astalin, 2013; Patton, 2015). Grounded
theory involves using “inductive, deductive, and verification” (Schwandt, 2015) to collect
and process the data. Once the data start to come in, a hypothesis is then generated, which
spawns new questions to use for data collection (Schwandt, 2015). A new theory or idea
was not needed in this study; therefore, this method was ruled out for this study.
Case studies look at a single phenomenon (Schwandt, 2015) and its units, such as
people, events, and policies. (Astalin, 2002). The unit being studied is the focus of the
study, thereby making it a single case. This method is typically used to answer “how or
why questions” (Schwandt, 2015). These questions are not being address in this study,
therefore eliminating this method.
Phenomenology focuses on studying “lived experiences” (Abawi, 2012) from the
individuals experiencing it. Davis (2013) stated that there is a direct relationship between
the phenomenon under investigation and the environment in which it is happening. Often
times, this method can influence a researcher to look at the phenomenon a different way
and change how questions are asked based on responses and experiences of the

21
participants (Tomkins & Eatough, 2013). Phenomenology is a method of questioning that
allows the researcher to experience or receive a full understanding of what an individual
is experiencing (Van Manen, 2014), which is what this research project was designed to
accomplish.
According to Weidenfeld (2011), there are three assumptions that accompany
phenomenology. The first one relies on the experiences of the individuals, which are
referred to as “explicit mental acts” to be relayed to the researcher (Weidenfeld, 2011, p.
234). The second one focuses on the validity of the study and is referred to as
“subject/object distinction” (Weidenfeld, 2011, p. 234) because the subject acts as the
observer, which was the person conducting the research, and the object acts as the
observed, which was the participants . The third assumption is that the data are tied to the
intellectualist accounts of the participants, which is referred to as “propositional
knowledge” (Weidenfeld, 2011, p. 235).
Literature Review
The purpose of this literature review is to explore current research with regard to
key areas that directly relate to the research question. These topics include Herzberg’s
two-factor theory; work breaks (including lunch breaks and rest breaks); employee
satisfaction; employee morale, motivation, and turnover; and the restaurant industry.
Herzberg Two-Factor Theory
Herzberg’s two-factor theory is aligned with Maslow’s 1954 hierarchy of needs.
Maslow classified the basic needs of individuals into five separate categories:
“physiological, safety and security, belongingness, esteem, and self-actualization”

22
(Lester, 2013, p. 15). Maslow’s hierarchy sequenced the level of needs from when a
person was born through adulthood (Lester, 2013), whereas Herzberg’s two-factor theory
applied the levels of needs to the workplace in adulthood (Cinar et al., 2011; Dartey-Baah
& Amoako, 2011). According to Dartey-Baah and Amoako (2011), hygiene factors
include physiological, safety and security, and belongingness; and motivation factors
include esteem and self-actualization.
In 1959, Herzberg interviewed more than 200 managers in the manufacturing
field (Buble et al., 2014; Herzburg, Mausner, & Snyderman, 2010; Smith & Shields,
2013) to collect data on participants’ satisfaction and dissatisfaction at work (Smith &
Shields, 2013). These were labeled job attitudes (Herzberg et al., 2010). At the time of
the original study, although the employment rate was near or at 100% in the United
States, employee motivation and job satisfaction was very low (as discussed in Herzberg
et al., 2010). Herzberg wanted to figure out why job satisfaction was so low and how it
could be improved.
During this study, two factors for satisfaction and dissatisfaction were created
(Herzberg et al., 2010). The first-level factors focused on the persons being interviewed
and their internal or intrinsic feelings and attitudes (Cinar et al., 2011; Herzberg et al.,
2010; Hyun & Oh, 2011). These can be described as an “individual’s internal process”
(Islam & Ali, 2013) that is needed to help them find balance within themselves. Second-
level factors fed off the first-level factors (Herzberg et al., 2010) and were referred to as
extrinsic or external factors because they were influenced by factors located outside the
person themselves, such as in the environment or organization (Buble et al., 2014;

23
Furnham, Eracleous, & Chamorro-Premuzie, 2009; Herzberg et al., 2010). Both sets of
factors measured job satisfaction and job attitude, but separating them into intrinsic and
extrinsic factors better explained what actually motivates job satisfaction and employee
attitudes (Herzberg et al., 2010). This was due to Herzberg theorizing that a person’s
level of satisfaction is different than dissatisfaction (Islam & Ali, 2013).
Motivation factors (intrinsic factors). While motivation can have several
different meanings, Herzberg’s two-factor theory refers to factors that influence an
individual’s attitude toward his or her job, documented by first-hand accounts of
workplace events and personal experiences (Herzberg et al., 2010). Motivation, as
“establishing goal-oriented behavior” (Buble et al., 2014, p.166), will be discussed later
in this chapter. Intrinsic motivation (IM) factors, as they relate to Herzberg’s theory, are
important because ultimately they can lead to employee satisfaction and morale (Hyun &
Oh, 2011; Smith & Shields, 2012). Motivation is seen as how one motivates themselves,
which acts as an internal method within one’s self (Islam & Ali, 2013).
Herzberg defined motivation as internal factors, such as achievement, recognition
(Pepe, 2011), praise, advancement (Smith & Shields, 2012), and personal needs (Tech-
Hong & Waheed, 2011). Individuals need some type of intrinsic motivation to have job
satisfaction and success (Raus, 2014). Shin and Kelly (2013) linked self-determination
theory with intrinsic factors, in that individuals who use intrinsic factors find self-
fulfilling pleasure and satisfaction and use that as motivation to do well. Individuals who
lack intrinsic motivation “tend to have unstable goals” (Raus, 2014; Shin & Kelly, 2013,
p. 143) and are usually less optimistic than individuals who have intrinsic motivation.
24
When motivation is intrinsic, it can be created consciously or unconsciously
(Raus, 2014), depending on the “wants and desires” (p. 81) of the individual. Intrinsic
motivators include achievement, possibility or growth, interpersonal relationship on
different levels, responsibility, corporate culture, working conditions, and job security,
just to name a few (Herzberg et al., 2010). These factors have a direct effect on how one
is motivated because they directly effect how one feels regarding their work.
Hygiene factors (extrinsic factors). Hygiene factors are from external sources,
such as culture, salary, employee discontent, policies, working conditions, and job
structure (Cnar et al., 2011; Dartet-Baah & Amoako, 2011; Hyun & Oh, 2011; Pepe,
2010). These factors do not motivate an individual to work hard or to have job
satisfaction (Pepe, 2010) but contribute to dissatisfaction (Furnham et al., 2009).
Dissatisfaction can lead to lower employee morale (Bell, Sutanto, Baldwin, & Holloway,
2014). They can act as a starting point to motivate if dissatisfaction can be minimized
(Dartey-Baah & Amoako, 2011) and can help prevent workers’ unease (Hyun & Oh,
2011). Thus, hygiene factors do not have less effect than intrinsic factors (Cnar et al.,
2011). Both sets of factors need to be emphasized to have a more productive, positive
workforce (Cnar et al., 2011).
Outside factors, such as culture, salary, employee discontent, policies, working
conditions, and job structure (Cnar et al., 2011; Dartet-Baah & Amoako, 2011; Hyun &
Oh, 2011; Pepe, 2010*;) can have a direct effect on an employees’ morale, satisfaction
(Coughlan, Moolman, & Haarhoff, 2014), and performance (Prajogo & McDermott,
2014). Because external or extrinsic, factors can vary, their true purpose must be

25
researched (Prajogo & McDermott, 2014). Coughlan et al. (2014) suggested external
factors are the easier factors to change because it is easier to change a physical
environment than to change someone internally. Coughlan et al. (2014) also listed three
extrinsic factors that could help improve an employee’s satisfaction at work: trust in the
company’s leadership, the relationship one has with their supervisors, and how much
support leadership gives them (Coughlan et al., 2014).
Work Breaks
Breaks in the employment world are referred to with many terms: break, work
break, lunch, meal break, lunch break, smoke break, coffee break, rest break, and so
forth. Each term has a different meaning depending on the context in which it is used.
According to the U.S. DOL (2016), there are two types of breaks: short breaks and meal
breaks. Short breaks typically last 5 to 20 minutes and are paid for by the company
(USDOL, 2016; Segal, 2013). Meal breaks are any breaks from work that last at least 30
minutes are paid for by the employer (Segal, 2013; USDOL, 2016). In order for a lunch
break to be paid, an employer must ensure that the employee is relieved from all work
duties (Segal 2013).
One-third of workers are said to not take breaks during the work day (Gurchiek,
2011) because of their workload. Although some company policies and various state laws
require rest or meal breaks or both, many people do not receive them from their direct
supervisors, especially when the employees are busy (Hurtado, Nelson, Hashimoto, &
Sorensen, 2015). Yet employers who refuse to grant mandated breaks can be terminated,
fined, or sued, and in some state cases, they can face criminal sanctions (Barker, 2014). A

26
ruling in 2014 by California’s Supreme Court set a precedent that employers are required
only to provide breaks, not make sure the employees actually take them (Suchyta, 2014).
For those in the service industry, taking breaks may be difficult because employees are
needed, especially during busy time, to ensure the customers are taken care of (Suchyta,
2014). One way this can be addressed is to use staggered breaks, allowing one person to
break at a time and having someone to backfill the job while on break (Suchyta, 2014).
Past research has focused on the effect of breaks, or lack thereof, on accident risk,
fatigue, and performance (Trougakos et al., 2014; Tucker, 2003). Tucker (2003) studied
the relationship between breaks and accident risks, fatigue, and performance in the
workplace (Tucker, 2003). Three items were evaluated: (a) if there was any creditable
evidence linked accident risks to work breaks, or lack thereof; (b) if accident risk and/or
fatigue was decreased during a particular part of a shift; and (c) if rest breaks would help
workers increase an employee’s productivity. The results showed a positive correlation
between regular rest breaks and decreased accident risks as well as increased productivity
(Tucker et al., 2003).
Accident risks can be measured by organizing all accidents and near misses and
under what circumstances they happened (Tucker, 2003). One major cause of accidents is
fatigue (Trougakos et al., 2014; Tucker, 2003; Tucker et al., 2003; Wilkinson & Bell,
2015). Fatigue has been defined as the act of continuous work, whether mental or
physical, that adds a drained, tired, weary, and stressed feeling to an individual, thereby
reducing their ability to think clearly, react accurately, and/or affects their moods
negatively (Coombs, 2015; Robinson, 2014; Wilkinson & Bell, 2015). Many factors can

27
contribute to fatigue, such as lack of sleep (Coombs, 2015); continuous work without a
break (Wilkinson & Bell, 2015); poor planning (Othman, Gouw, & Bhuiyan, 2012);
health issues (Coombs, 2015); working conditions such as poor lighting, extreme
temperature, noise control, visual activity, and repetitive action (Coombs, 2015); and
overworking employees (i.e., consecutive days/weeks) (Wilkinson & Bell, 2005).
Researchers have consistently found a negative correlation with high fatigue equaling
low performance or below normal performance (Othman et al., 2012; Tucker, 2003;
Trougakos et al., 2014; Wilkinson & Bell, 2005).
Tucker (2003) found that driving behaviors are affected differently when an
individual takes a break from driving when he or she first feels fatigue versus waiting for
a scheduled stop. Individuals who stop when tired recover faster than those who wait for
a scheduled break. This type of finding implies that there is a direct link between rest
breaks, fatigue, and performance. Recovery for individuals can differ from person to
person or job to job. Many studies, including Binnewies et al. (2009), Demerouti et al.
(2011), and Trougakos et al. (2008, 2014), have been conducted on workplace recovery
at different stages and how it affects job performance and production. Binnewies et al.
(2009) studied how coming back to the workplace recovered from the previous workday
at the beginning of one’s shift has an effect on daily performance. Because employees’
performance can have a direct or indirect effect on the organization’s goals, companies
must understand how recovery and performance are linked to maximize production.
Biennewies et al. examined two different types of behaviors: personal initiative and
organizational citizenship behavior. Personal initiative is when an employee is proactive

28
and self-starting in order to approach and exceed expectations that are set by the
organization (Biennewies et al., 2009). Organizational citizenship behavior is when an
individual helps other individuals within an organization to build and promote
relationships, which can lead to interpersonal harmony (Biennewies et al., 2009).
Binnewies et al. hypothesized that if individuals come into work fully recovered from the
previous shift, then they will have a higher job performance. An initial general survey
was used to gather data, and then followed up with five consecutive daily surveys. The
results showed there was a positive correlation between an individual being fully
recovered from a previous shift and positive daily job performance (Binnewies et al.,
2009).
Trougakos et al. (2008) examined how service industry employees use their work
breaks to increase workplace performance. Employees who take their breaks completely
away from their workplace had a more positive attitude upon returning to the job, which,
in turn, increased employee morale and satisfaction (Trougakos et al., 2008). Employees
who leave the workplace were able to emotionally disconnect from their work
environment and come back after their break feeling refreshed and ready to complete the
rest of their day (Smith, 2013). However, researchers have shown that more and more
employees are opting to dine at their desk for lunch breaks to help combat performance
and productivity pressures on the job (Gurchiek, 2011).
Trougakos et al. (2014) studied how whether an individual spent a break during
the workday could dictate if their energy recovered at an increased or decreased rate. The
authors wished to test if minimizing fatigue did, in fact, increase an individual’s well-

29
being, as other studies have suggested (Binnewies et al., 2009, Trougakos et al., 2008;
Tucker, 2003). As noted above, there are two types of breaks in the workplace: short
breaks and meal breaks, although they are referred to in different ways. Short breaks
typically last 5 to 20 minutes (Segal, 2013). Meal breaks are any breaks from work that
last at least 30 minutes (Segal, 2013). Because meal breaks are typically the longest, this
is the best break for employees to use to try to recover from lost energy during the first
part of their workday (Trougakos et al., 2014).
With recent studies showing that employees are pressured to take shorter breaks
and often time dine at their desks (Gurchiek, 2011; Smith, 2013), it is imperative to
understand the link, if any, between breaks and recovery (Trougakos et al., 2014). In the
Trougakos et al. (2014) study, 103 participants answered questions for 10 consecutive
days regarding relaxing activities, work activities, social activities, break autonomy, and
fatigue. Employees who were completely relaxed during their lunch breaks were more
likely to be more recovered from the first part of their shift then those who did not fully
recover. Those individuals who engaged in work or social activities were not as
recovered as those who completely stepped away from the work environment (Trougakos
et al., 2014).
Demerouti et al. (2012) studied how daily recovery affects individuals, both at
home and at work. Fully recovering from work must be done during work shifts and at
home after the work day. Demerouti et al. defined recovery as one of two things. The first
is the set of processes can help an individual repair the effects of negative stressor. The
second set is the ability to recover energy lost and return it to pre-stressor levels. Eighty-

30
three Germans and Dutch were surveyed. The questions focused on workflow, recovery
during and after breaks, psychological detachment, exhaustion (both at work and home),
and vigor at both home and work. Vigor, which was defined as mental strength, had a
positive correlation to exhaustion, both at home and at work. The findings also suggested
that recovery helps control exhaustion and can positively effect flow (Demerouti et al.,
2012).
As noted above, work breaks and improving production are linked to a point
where recovery is being maximized (Bechtold et al., 1984; Dababneh et al., 2001).
Bechtold et al. (1984) investigated how rest breaks affect production and how, if done
correctly, they can maximize production. Dababneh et al. (2001) explored how added rest
breaks during the workday can improve production and the well-being of the workforce.
In the Bechtold et al. study, different types of recovery and breaks were examined to
measure their effects and see which had a greater positive effect to production. Two
initiatives can positively effect fatigue: focusing on what caused fatigue and establishing
“efficient work-rest policies” (Bechtold et al., 1984, p. 1442). Dababneh et al. used an
additional 36-minutes of break time outside the normal 30-minute meal and 2-15 minute
rest breaks during the studied work shifts. One group was given twelve 3-minute rest
breaks and the other was given four 9-minute rest breaks.
Both of the above studies used quantitative methods to complete their research
(Bechtold et al., 1984; Dababneh et al., 2001). Bechtold et al. (1984) founded that it helps
an individual’s late day fatigue when breaks are taken early in their shifts, which, in turn,
leads to higher production for the organization. Dababneh et al. (2001) found that the

31
regular breaks (one 30-minute meal break and two 15-minute rest breaks) did not have an
effect on production; however, when the added frequent short breaks were given, the late-
day production numbers were positively affected. One could imply that adding short
breaks, especially later in the day, can help improve production, instead of negatively
affecting production (Dababneh et al., 2001).
In a grounded theory study, Sung Doo et al. (2014) focused on technology and
two types of breaks: on-line breaks and off line breaks. On-line breaks were those that
individuals used technology for non-work related activities, such as computers, cell
phones, tablets, and so forth. Off-line breaks were those breaks that individuals took
using non-technological activities, such as face-to-face conversation, coffee break, smoke
break, and so on (Sung Doo et al., 2014). The authors conducted semi structured one-on-
one interviews. Sung Doo et al. found that individual and their current situation defined
which type of break was more effective, as did age and morale. Breaks taken were
dependent on organization policies and norms (Sung Doo et al., 2014).
Hunter & Wu (2016) studied how effort-recovery affects employees at work,
utilizing a sampling method. This was done by studying the when, where, and how of
different break activities and seeing how they affected the health and wellbeing of the
participants. Ninety-five participants were studied and results show that when breaks are
taken, participants were better recovered. However, the longer the time in between
breaks, the greater the risk to the participant of poor health. This includes increased
headaches, eye strain, and back pain (Hunter & Wu, 2016).

32
Fritz et al. (2013) conducted a study on recovering from work stress, in which
work breaks were discussed. However, they went a step further and looked at more than
just breaks during the work day. They also looked at vacations, weekends, and at home
time (Fritz et al., 2013). The results showed that when an individual can break from
work, they have increased positive moods, increased job performance, increase task
performance, decreased negative moods, decreased fatigue, and decreased disengagement
(Fritz et al., 2013). This means that employees should be encouraged to take breaks,
including vacations, understand that a psychological detachment is needed from work for
the employee to recover, and understand that everyone’s needs to recover are different
(Fritz et al., 2013).
In one study, certain breaks were shown to not boost productivity (Fritz, 2012).
Fritz (2012) investigated how individuals unwound from work. This included everything
from coffee breaks to vacations and from bathroom breaks to meal breaks (Fritz, 2012).
Using technology or conducting personal business on a so-called micro break (i.e., coffee
break, smoke break, etc.) did not increase productivity. However, when individuals
completed job-related tasks and activities on their micro break, the individual’s energy
and production was increased (Fritz, 2012).
Employee Morale
Employee morale is developed by an employee’s attitude of the organization in
which he or she works, and goes along with job satisfaction (Arunchand & Ramanathan,
2013). Employee morale can be defined as the relationship one has with their work and
their employer (Arunchand & Ramanathan, 2013). There are two types of morale: high

33
and low. High employee morale is when employees are happy and content with their job
and the organization they work for. This can lead to increased customer satisfaction,
which in turn, can increase profits for the organization (Vozar, 2013).
Low employee morale is when an employee is unhappy with his or her job or
employer (Arunchand & Ramanathan, 2013). Employees with low morale typically are
less productive and have a negative attitude, which can translate into poor customer
service or a negative demeanor (Arunchand & Ramanathan, 2013; Jones, 2012; Onyema,
2014; Vozar, 2013). Customers view poor customer service as a company issue because
employees not being happy or trained correctly is considered a symptom of poor
management and leadership (Jones 2012; Patnik & Kar, 2014). This can, and often does,
lead to customers not wanting to do business with that organization, which not only has a
negative effect on profits, but can also be damaging for the organization’s reputation
(Fox, 2013; Pane-Haden & Cooke, 2012)
Organizations need to be concerned with employee morale because studies have
shown that when employee morale is high, employee efficiency and work quality are
improved (Urosevic & Milijic, 2012). This has a direct effect on whether organizations
can meet their goals (Urosevic & Milijic, 2012) and remain competitive (Pane-Haden &
Cooke, 2012). Another reason to keep employee morale high is that failing to do so can
have a negative effect on an organization’s applicant pool (Pane-Haden & Cook, 2012).
If an organization’s applicant pool is decreased, they may not be able to hire the talent
need to complete the job. Keeping employee morale high can be done in many different
ways, as will be explained below.

34
Building trust with employees is another way to foster high employee morale,
which has been shown to have a direct effect on employee engagement (Al Mehairi &
Zakaria, 2014; McManus & Mosca, 2015). Organizational trust building has been shown
to positively affect increased performance and increase employee satisfaction and loyalty
(McMantus & Mosca, 2015), which have a direct effect on revenue and turnover (Rizwan
& Mukhtar, 2014). Organizational trust is often influenced by an organization’s culture
(Al Mehairi & Zakaria, 2014). Organizational trust and culture is important to an
organization because it directly contributes to the success or failure of the business (Al
Mehairi & Zakaria, 2014). Being able to build trust with employees does have the
potential to increase the likelihood that an organization will survive in this highly
competitive global economy (Al Mehairi & Zakaria, 2014).
Organizational culture can have a remarkable effect on employee morale besides
building trust. With regard to customers, the tone is often set by the organizational culture
(Jones, 2012), which, as previously stated, has a direct effect on a business’ success.
When a company is focused on its internal customers (their employees) it shows in the
employee’s morale and how they treat the external customers of a business (Jones, 2012).
Chiloane-Tsoka (2013) found that organizational culture has a direct effect on employee
morale: When an organization has a positive culture, the employees have high morale.
Many times ethics has an effect on organizational culture and employee morale.
A major factor that affects organizational culture is management. Having
management that is not able to motivate or inspire can spur low morale (Swartout,
Boykin, Dixon, & Ivanov, 2015). Swartout et al. (2015) discuss the five diseases that can

35
sink an organization because they contribute to low morale. The five diseases are lack of
constancy, weight of maximizing short-time profits, performance reviews, job hoping,
and management by quota (Swartout et al., 2015). In order to not be affected by these
diseases, management must understand how to properly increase morale in order to be
successful.
Ethics (if and how one does the right thing) can affect employee morale because
they have a direct effect on an individual’s morale. Everyone is faced with ethical
dilemmas some point in their career (DeGrassi, Morgan, Walker, Wang, & Sabat, 2012).
Often times how an individual view an ethical issue depends on the employee
engagement an organization uses (Carter & Baghurst, 2014). When employees feel a
connection with their employers they are likely to make better ethical decisions than
when they are disengaged (Carter & Baghurst, 2014).
In order to deal with ethical dilemmas, one typically follows four steps: ethical
awareness, judgment, intention, and action (DeGrassi et al., 2012; Scharrer, 2015;
Sommers-Flanagan & Sommers-Flanagan, 2015). Ethical awareness is being able to
know there is an ethical dilemma that needs to be addressed (Scharrer, 2015). Judgment
is when an individual evaluates the possible actions that can be taken in the ethical
dilemma (DeGrassi et al., 2012). Judgement can be affected by one’s morale in the
workplace (Scharrer, 2015). Intention is making the decision from possible actions
developed in the previous step (DeGrassi et al., 2012). Action is when an individual’s
final choice is put into action, which can be influenced by one’s ego-strength, self-

36
regulation, and self-efficacy (Scharrer, 2015), which are all affected by workplace
morale.
Previous research has found several recommended ways to improve employee
morale. Vozar (2013) suggested that ensuring employees are happy is one way to
accomplish this, and can be done by making everyone feel like they are part of the team,
ensure proper training is done and give recognition where it is due. Another way to
improve employee morale is to establish trust between management and staff (McManus
& Mosca, 2015; Patnik & Kar, 2014). McManus and Mosca (2015) also discuss that an
organization must create a perception of fairness among all employees, provide rewards
and recognition for positive and productive workplace behavior; ensure they have proper
training; and above all else, set challenging but attainable goals to help increase employee
morale.
Another method that has been found to help improve employee morale is servant
leadership (Carter & Baghurst, 2014; Jones, 2012). When management uses servant
leadership, they use “ethics, customer experience, and employee engagement” (Carter &
Baghurst, 2014, p. 453) to influence an organizational culture where managers and
subordinates work together for the betterment of the organization (Carter & Baghurst,
2014). This leadership method helps build trust, employee engagement, loyalty, and
commitment (Jones, 2012), which has a direct effect on employee morale because it
allows all employees to work towards the same goals of the organization (Carter &
Baghurst, 2014).

37
Communication can have a positive effect on employee morale if done correctly
(Rawat, Khugshal, & Chaubey, 2015). Having effective communication is being
recognized as an essential part of management’s duties (Calota, Pirvulescu, & Criotoru,
2015), especially in the service industry (Žemgulienė, 2012). One way to make a positive
effect is to ensure that the employee feels like they are truly being heard when they come
to management (Rawat et al., 2015). Another way to ensure that management is able to
relay a “feeling of engagement and appreciation” (Rawat et al., 2014) to the employees.
Poor communication can lead to break in communication and create role ambiguity
(Malangwasira, 2013).
Also affecting morale is a CSR, the leaders’ commitment to “meet the needs and
interests of their stakeholders” (Krainz, 2015, p. 138). Employees are typically
recognized as one of the most important vital internal stakeholders of a corporation
(Krainz, 2015). By engaging employees in CSR, individuals feel like they are helping the
community and world around, which increases their morale at work (Slack, Corlett,
Morris, 2015). CSR has been found to not only increase morale, but also increase
recruitment, retention, and productivity in the workforce (Slack et al., 2015). When an
employee feels fully engaged in the CSR process, he or she has a connection to the
organization, which makes employees want to work harder and stay at the company
(Slack et al., 2015).
Employee Satisfaction
Employee satisfaction refers to the extent to which employees are satisfied
(Furnham et al., 2009) and where employees are in a positive emotional state about their

38
work environment (Mahmood et al., 2014). In other words, employee satisfaction is when
an employee is content in their workplace to a point that they achieve a positive
emotional state. When this positive emotional state is reached, employees tend to be more
successful, which can lead to more production, better quality, and higher profits (Rizwan
& Mukhtar, 2014). Managers and organizations need to know how to create a satisfied
workforce and how to improve if/when there is not employee satisfaction among
workers. Understanding why employees feel dissatisfied is just as important as figuring
out how to increase their overall satisfaction.
Employees might not feel satisfied at work for various reasons. One of the most
prevalent reasons is that the pressures for high performance are so great that employees
do not feel like they truly accomplish anything (Robison, 2012). Employees need to
continuously “give up their game” to remain competitive, which is increasing their stress
levels and can have a direct effect on production, profits, and job satisfaction (Halkos &
Bousinakis, 2009). In order for employees to feel like they are positively contributing to
the organization, they must be able to see or measure what they are doing and
accomplishing in order to be satisfied (Halkos & Bousinakis, 2009). Herzberg (as cited in
Halkos & Bousinakis, 2009, p. 418) showed that satisfaction in the workplace is related
to “work content, e.g. achievement, recognition, responsibility,” which can contribute to
performance—satisfaction issues that are being seen in business today.
Organizations that do not have a good record of open communication have a
lower employee satisfaction rate (Rizwan & Mukhtar, 2014). Having open
communication, where goals are clearly outlined and the mission of the organization is

39
blatantly discussed and modeled (Robison, 2012) will increase satisfaction because
communication can be linked to trust (Raina & Roebuck, 2014). When an individual has
an open communication channel with someone, their trust in that person often increases
because they know they have each other’s interest in mind. They have confidence that if
they go to the individual they trust, action will happen (Raina & Roebuck, 2014). When
this form of communication works, it bolsters the trust between these two individuals.
Another reason that employees do not feel satisfied is that they are being asked to
do more with less (Robison, 2012), whether it is more work for less pay, increase
production with fewer workers, etc. When changes such as more work for less pay are
presented in the workplace, it is imperative that organizations find out how to motivate
employees to achieve employee satisfaction (Furnham et al., 2009). Motivation has been
found to have a direct effect on employee satisfaction (Furnham et al., 2009; van Scheers
& Botha, 2014), which can help in situations where employees are taking on more
responsibilities with the same pay. It can be something as simple as being respected or
praised, or a so-called pat on the back (Robison, 2012).
Another reason is that employees do not feel secure in their jobs so they are trying
to overcompensate by working through lunch and other breaks, working more hours and
not claiming them, and so forth (Gurcjiek, 2011; Robison, 2012), all of which can lead to
burnout. Conversely, researchers have shown that taking breaks during the workday can
increase employee satisfaction (Binnewies et al., 2009; Dababneh et al., 2001; Robinson,
2014; Trougakos et al., 2008). This is; however, dependent on how the break time is used
(Binnewies et al., 2009; 2001; Robinson, 2014; Trougakos et al., 2008), how many
40
breaks are given (Dababneh et al., 2001), and when the breaks are given and taken
(Dababneh et al., 2001; Trougakos et al., 2008).
Researchers have found a direct link between employees being unhappy or
unsatisfied at work and them leaving for another job (Halkos & Bousinakis, 2009), which
costs companies millions of dollars each year in recruitment, selection and
training/retraining (Halkos & Bousinakis, 2009; Kessler, 2014). When employees are
unhappy or dissatisfied at work, they become less interested in completing their work
(Halkos & Bousinakis, 2009), and when they do not feel valued or effective they
voluntarily leave (Kessler, 2014). Being able to find out why employees are dissatisfied
is imperative to keep valued employees and retain their knowledge, experience, and
expertise (Kessler, 2014). Some reasons why employee satisfaction is low are:
compensation (pay and benefits), the organizational culture, the job asked to perform,
lack of employee commitment/connection, and management styles (Kessler-Ladelski &
Catana, 2013).
As previously stated, employee satisfaction can be affected by organizational
culture. Organizational culture can be defined as the culture that is perpetuated by how an
organization and their employees behave, what policies and procedures they have, how
those policies and procedures are follow by all within the company, and how employees
are treated, or perceived to be treated (Parzinger, Lemons, & McDaniel, 2012). Studies
have been done that link how an organization acts and employee satisfaction (Aydin &
Ceylan, 2011; Lee, Lee, & Schniederjans, 2011; Parzinger et al., 2012). Organizations
with positive cultures have a higher employee satisfaction rating than those organizations

41
that have negative cultures (Aydin & Ceylan, 2011). The culture of an organization can
be viewed as a social network that helps to motivate employees to have higher production
rates and/or customer satisfaction (Lee et al., 2011).
When an employee feels a connection to an organization, which can be facilitated
by its culture, the employee develops a sense of loyalty to the organization (Lee et al.,
2011). This sense of loyalty inspires the employees to work together towards a common
goal of success (Aydin & Ceylan, 2011). According to Parzinger et al. (2012), when an
employee does not “fit” (p. 40) into an organization, there is no connection or loyalty,
which results in them being less productive than they are capable of being. Therefore, it
should be a priority of an organization to foster an organizational culture that promotes
unity, common goals, and high employee satisfaction (Aydin & Ceylan, 2011; Lee et al.,
2011).
An important relationship that organizations must pay attention to is the effect pay
and/or benefits have on employee satisfaction. This relationship is based on whether
employees feel that they are being paid what they are worth (Schreurs, Guenter,
Schumacher, Van Emmerik, & Notelaers, 2013), which is the basis for equity theory.
Organizations must ensure that the amount being paid to employees for the work they do
is considered a fair wage for the level of productivity they want (Ruiz-Palomino, Sáez-
Martínez, & Martínez-Cañas, 2013). Often times employees’ perception is what an
organization must worry about (Iqbal et al., 2012). It is necessary for an organization to
conduct research to have a good understanding what is considered a reasonable wage to
pay in order to ensure employee satisfaction is met.

42
Research shows that when employees consider pay acceptable they have an
increased feeling of contentment in the workplace (Tremblay, Vandenberghe, & Doucet,
2013). When employees are satisfied, they have greater commitment and a sense of
belonging to the organization, which helps production (Schreurs et al., 2013). When
employees feel like they are not making what they are worth or what their job function is
worth, there is a low employee satisfaction rate and workers are not content (Tremblay et
al., 2013). Businesses that have low employee satisfaction rates have larger turnover rates
(Rizwan & Mukhtar, 2014), which ultimately affect the profits.
The restaurant industry accounts for approximately 47% of food sales in the
United States, which makes it one of the largest industries (Hur & Adler, 2011) and
employers (Weyant, 2009) in the nation. It also has the some of the highest turnover rates
in the nation (Weyant, 2009). Weyant (2009) found that factors contributing to poor
employee satisfaction in the workplace were “low pay, high turnover, and long hours” (p.
86). These factors also had an effect on customer satisfaction because when individuals
are not happy, then tend to not do their job efficiently or effectively, which affects the
service they render (Weynat, 2009). This can translate into poor customer service, which
then makes the customers dissatisfied (Gazzoli et al., 2012). This has a ripple effect that
can portray a restaurant in a negative light, which can be detrimental to their brand image
(Hur & Adler, 2011). Therefore, it is imperative for restaurants to do what they can to
instill positive employee satisfaction in their workforce because it can have a direct effect
on their customers (Hur & Adler, 2011).
43
Motivation
One of the key elements that employee satisfaction and employee morale share is
motivation. Motivation is when goal-oriented behavior is established (Buble et al., 2014)
to accomplish desired goals (Raus, 2014). There are many different forms of motivation,
some are external and some are internal. External, or extrinsic, is when an individual is
motivated to complete a task by an outside source (Ismail & Nakkache, 2014) such as an
organization, a community, supervisors and so forth. Internal, or intrinsic, is when an
individual is motivated to complete a task by something in themselves or for gain (Raus,
2014), such as money, satisfaction, and recognition. Regardless the form, motivation is
when an individual is energized, inspired, and encouraged to complete a task (Canar et
al., 2011). Motivation is an important part of life, especially in the business world.
Three well-known and well-studied theories of motivation are Maslow’s
hierarchy of needs, McGregor’s Theory X and Theory Y, and Herzberg’s two-factor
theory. Maslow’s hierarchy of needs involves five levels of needs that motivates
individual in life: physiological, safety, social, esteem, and self-actualization (Cao et al.,
2013; Guillen, Ferrero, & Hoffman, 2015; Lester, 2013). Physiological is the most basic
set of needs and is at the bottom of the pyramid. It pertains to basic needs such as food,
water, and shelter (Guillen et al., 2015). The premise behind this theory is one cannot
advance to next level without satisfying the needs at their present level (Guillen et al.,
2015). Once they reach the self-actualization, they have realized their full potential and
are successful (Cao et al., 2013).

44
McGregor created Theory X and Theory Y in 1960 (Stankovic, 2013). Theory X
stated that managers need to motivate by sternness, fear, and/or coercion in order to
motivate individuals to work because employees do not want or like to work, are lazy and
unmotivated (Koçyiğit, 2015). Therefore, a more firm approach to managing them is
required (Stankovic, 2013). Theory Y is when employees are ambitious, able to work on
their own, and/or enjoy working; they are self-motivating; and able to get the job done
with little effort by management (Koçyiğit, 2015). This theory does not take into
consideration that individuals are different and are motivated in different ways
(Stankovic, 2013).
Herzberg’s two-factor theory is based on intrinsic and extrinsic motivators (Canar
et al., 2011), with intrinsic, or motivation factors, based off Maslow’s esteem and self-
actualization levels and extrinsic, or hygiene factors, that represent Maslow’s
physiological, safety, and social factors (Dartey-Baah et al., 2011). Intrinsic factors are
those factors that allow an individual to have a direct connection with the task they are
given (Raus, 2014). This includes “recognition, autonomy, challenge, and the nature of
the work” (Ismail & Nakkache, 2014). Extrinsic factors are those factors that are
influenced from outside sources, such as a manager, an organization, or a spouse. This
includes items like “salary, job security, and working conditions” (Ismail & Nakkache,
2014).
Different researchers have used Herzberg’s motivation to explore if motivation
had a direct relationship to job satisfaction (Hyun & Oh, 2011), which was defined as
actions that would “encourage employees to work hard” (p. 103). Smith and Shields
45
(2013) used Herzberg’s motivation to see how motivation relates to job satisfaction in
social services, while Teck-Hong and Waheed (2011) used motivation to examine its
effects on the retail sector of job satisfaction. However, all these studies (Hyun & Oh,
2011; Smith & Shields, 2013; Teck-Hong & Waheed, 2011) found that extrinsic, also
known as hygiene factors, spurred more employee satisfaction and engagement than
intrinsic factors.
Understanding how motivation is related to employee satisfaction and morale is
essential to any manager and/or organization (Buble et al., 2014) because it is the guide
that helps fulfill goals (Urosevic & Milijic, 2012). Motivation in general can be difficult,
add in trying to figure out what motivates individual employees or how to motivate
employees can add a dimension to an organization’s motivational responsibilities that
some organizations cannot answer effectively, and sometimes cannot answer at all
(Urosevic & Milijic, 2012). Research has shown that positive motivation can lead to
improved job performance, greater employee satisfaction, and higher employee morale
(Buble et al., 214; Dartey-Baah & Amoako, 2011; Urosevic & Milijic, 2012).
As previously discussed, employee satisfaction is when an employee is content in
their workplace to a point that they achieve a positive emotional state (Furnham et al.,
2009; Mahmood et al., 2014). Such satisfaction can be obtained when the individual’s
personal needs overlap with the organizational needs, also known as the area of
convergence (Padmaja, Bhar, & Gangwar, 2013). The key to being able to motivate
employees into a positive emotional state is knowing what matters to them, or what
motivates them. This can come in many different ways, such as pay, benefits, stress

46
levels, empowerment, recognition, and personal growth (Teck-Hong & Waheed, 2011).
Once this is known, organizations must do what they can to maximize the motivational
strategy in a way that it meets both the organizational needs and the individual’s needs to
ensure that it is a benefit for both parties (Padmaja et al., 2013). This can lead to greater
job satisfaction for the employee and more products and higher profits for the
organization (Padmaja et al., 2013), which is a win-win situation for all involved.
As previously stated, employee morale is an individual’s attitude of the
organization in which they work (Arunchand & Ramanathan, 2013). High employee
morale contributes to job satisfaction, higher productivity in the workplace, and more
employee engagement (McManus & Mosca, 2015). Low employee morale is a high
contributor to turnover, poor performance, and disengaged employees (Cowart, 2014;
Pane-Haden & Cooke, 2012). Poor employee morale has been found to be the leading
cause of declining productivity and higher business costs, which means lower profits for
organizations (Cowart, 2014). A way to combat this is to use motivation strategies. One
motivation strategy is to help find a family-work balance for the employee (Cowart,
2014). Another is to have the employee be more involved in the workplace to help them
feel a sense of commitment or belonging to help encourage loyalty (McManus & Mosca,
2015). Yet another motivational tactic is to design a rewards and/or recognition system,
which can include many different types of rewards, such as monetary awards, buying
lunch, paper awards, time off, and so forth (Cowart, 2014).
Having a true understanding of what motivates an employee to increase their
morale and satisfaction is vital to a business’ survival. Kontoghiorghes (2016) studied the

47
effects that satisfaction/motivation had on organizational commitment, which is needed
in order to have a positive organizational culture. Kontoghiorghes (2016) found that
when a culture is positive it has open communication, core values of respect and
integrity, and effective management, which contributes positively to motivation of
employees.
Restaurant Industry
The restaurant industry can be challenging, which is evident in the numbers in the
industry. One out of two new restaurants fail within the first year of their opening;
61.36% fail within the first 3 years (Gazzoli et al., 2012). Employee turnover rates can
reach up to 82% in a given year, one of the highest turnover rates for a profession
(Weyant, 2009).
The restaurant industry is one of the largest employers in the United States (Hur
& Adler, 2011), supporting 9% of the workforce (Weyant, 2009). This industry brings in
an estimated 47% of money spent on food in a year (Hur & Adler) and accounts for
approximately “4% of the U.S. gross national product” (National Restaurant Association,
2015; Weyant, 2009). Restaurant industry sales reached an estimated $709 billion in 2015
(National Restaurant Association, 2015). This industry also grew more than any other
field in 2015 (National Restaurant Association, 2015). Although a growing industry that
has one of the largest workforces should be able to attract and retain individuals, turnover
rates suggest otherwise.
The restaurant industry has a high turnover rate for many reasons: decreased job
satisfaction (Weyant, 2009), poor job performance (Hur & Adler, 2011), no employee

48
engagement by management (Nguyen, 2014), and no customer orientation (Gazzoli et al.,
2012). To improve turnover and increase profit, restaurants need to find out why these
reasons are persistent and find ways to correct them.
This study focused on casual and fine dining restaurant. Casual dining restaurants
can be defined as a restaurant that serves moderately priced foods, typically from $10-
$30, in a relaxed atmosphere (Ha & Jang, 2013). They are known for good quality dining
at a reasonable price. Fine dining restaurants are those dining facilities that are of
superior quality, which have dedicated meal courses served in a lavish atmosphere (Ha &
Jang, 2013). Pricing at these restaurants typically are from $30 and up (Ha & Jang, 2013).
Among the few compelling studies on the topic, Nguyen (2014) discussed how a
restaurant that focused on employee motivation was one of the best employers in an area
of Canada for 13 straight years. The owner understood, according to Nguyen, how
important employee engagement is for their employees and kept the work atmosphere
“fun” (Nguyen, 2014, p. 2) and treated everyone the same regardless of their position.
The employees felt valued, which is evident in that 84% of the employees had positive
dispositions regarding coworkers and managers (Nguyen, 2014). Moreover, “80% of
their managers are hired from within” (Nguyen, 2014, p. 2) the organization.
Hur and Adler (2011) studied the effects of employees’ perception on the brand
image of a restaurant. Employees’ performance can have a direct effect on a restaurant’s
image and it has been speculated that if you can improve an employee’s satisfaction, then
they will work more efficiently and effectively, thereby increasing the image of the
company (Hur & Adler, 2011). They studied the effects that employees’ attitudes had on

49
the brand image, how job satisfaction related to employees’ perceptions, and how
demographics played a role in employee perception (Hur & Adler, 2011). Because
employees are often associated with the branding of a business, how they interact with
customers is vital to the image of the business (Hur & Adler. 2011). The authors found
that employee satisfaction, training, and working conditions had an effect on branding.
Increasing these factors can help an organization gain a competitive advantage over their
competitors (Hur & Adler. 2011), which is especially useful in the competitive restaurant
industry.
Job satisfaction was addressed by Weyant (2009), who stated that a lack of job
satisfaction can lead to high turnover. One area examined is training and its relationship
to job satisfaction. The premise would be that if an employee is trained properly, then
they will feel more confident in their job, thereby increasing their satisfaction (Weyant,
2009). Another area Weyant examined was job security. If employees believe their job is
safe and they are doing what they were trained to do, then their satisfaction goes up
(Weyant, 2009). Weyant also examined organizational commitment and found that if
employees are trained properly and they understand what is required of them, their
satisfaction rate increases, regardless of classification or pay (Weyant, 2009).
Summary and Conclusions
Despite considerable research on work breaks, scholars have not focused on
works breaks in the restaurant industry. Researchers have studied employee morale and
employee satisfaction, albeit mostly in the manufacturing industry and very little in the
restaurant industry. Motivation has been studied for over a century and can be a powerful

50
resource in the workplace if employers understand how to use it correctly. However, no
research could be found on employee motivation in the restaurant industry. This study
was designed to address this important gap in the literature.

51
Chapter 3: Research Method
The main purpose of this phenomenological, qualitative study was to explore the
effects on employee morale and satisfaction when giving servers in casual and fine dining
restaurants work breaks during a workday. Rest breaks are defined as paid breaks from
all work activities lasting 20 minutes or less. Lunch breaks are unpaid breaks from all
work activities lasting more than 30 minutes.
Another purpose of this study was to determine the effects that employee morale
and satisfaction had on the restaurant business. According to Murphy et al. (2009),
employee morale and satisfaction significantly affect turnover. The high rate of turnover
is the most serious issue facing the restaurant business (Murphy et al., 2009). Thus, this
study was designed to determine what changes can have a positive effect on keeping
restaurant employees and reducing turnover rates. Previous research has largely shown
that an increase in job satisfaction decreases turnover rates (Hur & Adler, 2011; Murphy
et al., 2009; Weyant, 2009), thereby lowering turnover costs.
In this chapter I explain the rationale for the research design. I provide
information about the participants, the participant selection process, and the instruments.
In addition, I discuss the data analysis plan, coding, software and how discrepancies were
handled. Last, I discuss the trustworthiness of this study to ensure validity.
Research Design and Rationale
I designed this study to investigate how an employee’s morale and satisfaction, in
the casual and fine dining restaurant industry, are affected by breaks during a shift of 6

52
hours or more. I employed qualitative methods because I examined social issues
(Schwandt, 2015). Qualitative research is preferred when trying to understand “a social or
cultural phenomena” (p. 118), whereas quantitative attempts to understand data based on
objective methods (Astalin, 2013). I used the ontological philosophical assumption
because it communicates reality (Maxwell, 2013), which is what needed to be captured
from the participants. I collected data through interviews, voice recordings, member
checking, and other means of fieldwork in the restaurant industry, which are the main
data collection tools used in qualitative research (Patton, 2015). Statistics would not be
appropriate for this study and a small sample tested will not necessarily help others on a
larger level, thus excluding quantitative methods (Patton, 2015).
I decided that a phenomenological study was appropriate because the purpose was
to learn how individuals experience a phenomenon, given their experience (Vagle, 2014).
It allows individuals to give data on their version of events or situations, which will in
turn help the research world understand how things manifest and appear to individuals in
the restaurant industry. By understanding how something is experienced through the eyes
of an individual living a phenomenon, the research can study the “lifeworld” (Vagle,
2014, p. 22), not the world that is measured, correlated, and categorized.
Other qualitative methods were considered for this project but were rejected for
various reasons. Grounded theory was considered; however, the main premise behind this
theory is to set new “theory of social phenomena” (Schwandt, 2015, p. 131). Based on
past research, a theory already exists regarding breaks in the workplace. I considered
ethnography because it studies how a certain culture behaves (Schwandt, 2015), which

53
would have been waiters and waitresses in the restaurant industry. I rejected this method
for this study because I did not study the culture of the individuals but how individuals
react to breaks versus no break during a work shift lasting more than 6 hours.
I used phenomenological theory, using Herzberg’s two-factor theory (Teck-Hong
& Waheed, 2011), as the main qualitative design. In keeping with Herzberg’s two-factor
theory of motivation and hygiene factors (Buble et al., 2014; Dartey-Baah. 2011; Teck-
Hong & Waheed, 2011), intrinsic and extrinsic factors (Buble et al., 2014) were used in
this study. Intrinsic factors, such as employee satisfaction and morale, are internal factors
located within the individual that “produce satisfaction” (Cinar et al., 2011, p. 691) and
help motivate. Extrinsic factors, such as breaks given by management, are external
factors located outside an individual, typically associated with managers (Cinar et al.,
2011).
Using Herzberg’s theory led to a better understanding of how employee
satisfaction and morale are affected by breaks or the lack thereof. With turnover rates
being a serious issue in the restaurant industry (Murphy et al., 2009), this study was
intended to help employers understand how employee satisfaction and morale affect the
turnover rate, which in turn can help improve human resource practices and improve
employee satisfaction and morale. One way to combat high turnover rates was to use
Herzberg’s two-factor theory to help motivate employees both internally and externally.
Role of Researcher
My role was to collaborate with my dissertation committee, interview
participants, and collect, manage, and report the data (Kyvik, 2013). The participants

54
included individuals who had 5 or more years of experience in the casual/fine dining
restaurant industry. The data were collected through interviews with the participants,
member checks, and voice recordings. The interviews were conducted, via video
conferencing, in a neutral setting where participants were comfortable talking opening
and honestly. The data were analyzed with MAXQDA software (Oliveira, Bitencourt,
Teixeira, & Santos, 2013).
All assumptions and bias of the researcher were identified and acknowledged in
advance of my conducting research. I recruited only individuals who did not know me in
order to remain in accordance with ethical standards. Other bias and ethical
considerations are discussed below. I carefully followed all ethical requirements and the
standards of IRB, including protecting and storing all data and research information in a
secure place (Davis, 2013).
Methodology
This section describes my approach to how participants were recruited and
selected, selection criteria, what area they were chosen from, and why. Instrumentation
and the triangulation method are discussed, along with a pilot study. Lastly, the
procedures for recruitment, participation, and data collection are detailed.
Participant Selection Logic
The sample size needed to be established before selecting participants to ensure
the correct sample size was accomplished. In qualitative research, there are no set rules
about sample size (Patton, 2015) as there are with quantitative research (Miles et al.,
2014). I used purposeful sampling (Miles et al., 2014, Patton, 2015; Suri, 2011; Van

55
Manen, 2014) to locate a large enough sample to gather enough data to investigate the
research problem (Patton, 2015). According to Hill and Williams (2012), 10-15
participants are an ideal size for qualitative research. This supports Van Manen’s (2014)
idea of looking at a “subset of population” (p. 352) only until data saturation occurs,
which is when no new data is presented by participants (Van Manen, 2014).
Initially, 15 participants were sought, two of whom would take part in the pilot
study. Once the sample size had been established, participants were needed. The
population that was targeted for this study was a group of individuals who had a
minimum of 5 years of experience in the casual/fine dining restaurant industry. Requiring
at least 5 years of restaurant experience ensured that participants had adequate experience
within the field to answer the interview questions. Males and females were asked
participate, along with individuals from different cultures, races, religions, and ethnic
groups.
The participants were recruited via social media from the Clarksville, TN, area
and were selected by using convenience sampling (Berg & Lune, 2012). Convenience
samples refer to participants selected because they meet the minimum criteria and are
available (Berg & Lune, 2012). Participation was voluntary. No pay or rewards were
offered for participating, and the interviews took place while the employees were not
working. To ensure saturation, I intended to interview servers and managers from
different casual and fine dining restaurants.
In order to ensure potential participants knew what would be expected of them,
they were given a copy of the consent form they had to sign before starting the study.

56
This consent form was in accordance with Walden University’s guidelines and approved
by IRB. The participants were also advised at the beginning of the study that, if anytime
during the study they wished to discontinue, they were free to leave the study.
Instrumentation
Various instruments were used for data collection, including member checks,
interviews, and voice recordings, and to ensure that the data were triangulated (Maxwell,
2013; Miles et al., 2014; Patton, 2015; Vizzuso, 2015). Triangulation helps assure
validity and creditability (Maxwell, 2013; Patton, 2015) and will be discussed in more
detail below.
A set of interview questions was the main source used for data collection. There
are two main types of interviews, structured and unstructured (Schwandt, 2015).
Unstructured interviews are the most popular method for phenomenological research
(Vagle, 2014) because they consist of open-ended questions (Schwandt, 2015). The
researcher can learn about the phenomenon without focusing on how each interview
compares to another (Vagle, 2014). In an unstructured interview, the researcher asks
different questions based on participants’ answers to the standard questions in order to
have a better understanding of the phenomenon (Vagle, 2014).
Magnusson and Marecek (2015) guided the creation of my interview questions.
The first step in the process was to decide what topics needed to be discussed in the
interview (Magnusson & Marecek, 2015). Questions addressed participants’ experience
in the casual and fine dining industry as wait staff, under three topic areas: work breaks,
employee morale, and employee satisfaction. The questions were asked in a way that

57
fostered “full, rich, and personalized stories” (Magnusson & Marecek, 2015, p. 181) from
the participants. Each participant focused on specific events (Maxwell, 2013), and I used
phrases such as “can you tell me?” “What was your experience like?” and “Can you give
me specifics?” (Magnusson & Marecek’s, 2015; Patton, 2015).
Follow-up questions varied depending on participants’ answers and were asked to
clarify or explain answers (Magnusson & Marecek, 2015). I was cautious when asking
the follow-up questions lest I appear critical or unbelieving, which could have caused a
participant to be less forthcoming (Magnusson & Marecek, 2015).
I also used a system of member checking for respondent validation. I solicited
feedback from the participants to ensure the true meaning of their answer was recorded
properly (Brown, 2012; Maxwell, 2013; Miles et al., 2014; Thomson, 2013). Member
checking provides validity (Stipp & Kapp, 2012). Through member checking, I assured I
understood participants’ answers correctly (Brown, 2014; Miles et al., 2014) and reduced
the chance participants’ answers were misconstrued or misunderstood (Maxwell, 2013). I
also sent a copy of the conversation transcript to the participant to allow them to read
over their answers to ensure it was, in fact, what they said and meant.
Member checking is also used as a way to verify that the anonymity of the
participant is not compromised (Miles et al., 2014). Allowing the participants to review
the data and reports before releasing them can help catch any unintended identifiable
factors in the writings (Miles et al., 2014). Because privacy can affect creditability of the
study, ensuring anonymity is essential (Miles et al., 2014). Therefore, the findings were

58
reviewed with participants to ensure that there were no identifiable features of the
individuals in the data.
The other method I used as an instrument was voice recording (Patton, 2015, p.
382). I reviewed the interviews when they were done and transcribed them, word for
word. In that way I concentrated on the answers instead of trying to capture in writing
everything the participant was saying. Raw data were collected during the actual
interview (Patton, 2015). The voice recordings helped me see if I missed anything.
Before the interview started, I checked to make sure the recorder worked (Patton,
2015). During the interview, I made sure the interviewees and I spoke clearly and slowly
so the entire conversation would be audible. After the interview, I listened to the voice
recording from start to finish and transcribed the conversation, after which I completed
the participant member check and entered the data into the software (see below).
Pilot Study
Pilot studies are done in qualitative research to help hone the interview questions
and interview process (Burkard, Knox, & Hill, 2012; Magnusson & Marecek, 2015;
Maxwell, 2013) and to focus on the “concerns and theories” before initiating the
interviews (Maxwell, 2013, p. 66). Further, I tested the flow of the interview process and
the “viability of the questions” (Burkard et al., 2012, p. 88).
As discussed in Chapter 4, the pilot study was done in two parts: a pretest and a
pilot (Magnusson & Marecek, 2015). The pretest allowed for the researcher to ask the
interview questions to those around them, such as friends, family, and/or colleagues, so
the researcher could solicit advice as to the functionality of the interview questions and

59
process (Magnusson & Marecek, 2015; Maxwell, 2013). The key to ensuring this step is
used, as a pretest, was to conduct an interview with the subject as you would a participant
in the actual study (Magnusson & Marecek, 2015). Once complete, a feedback session
with the subject was arranged, to discuss if the flow was good, if the questions were
relevant, and how the process could be improved, if at all (Maxwell, 2013).
After the pretest was conducted and changes made, the next step was to recruit 2
individuals from the same pool (Magnusson & Marecek, 2015) that the actual
participants for the study came from (Burkard et al., 2012). For this study, individuals
who work in the casual and fine dining restaurant industry were needed. When they were
selected, the researcher conducted the interview as they would the actual study in order to
obtain useful feedback from the participant on how to change and/or improve the process
and/or questions (Magnusson & Marecek, 2015; Maxwell, 2013; Burkard et al., 2012).
During this pilot test, the researcher was open to making changes in the interview and
research process to ensure validity and creditability (Magnusson & Marecek, 2015) based
on the participants’ feedback. Using the pilot test process helped me gain insight into the
interview process (Magnusson & Marecek, 2015).
Procedures for Recruitment, Participation, and Data Collection
In this section I discuss the sample size, how participants were recruited, and how
they participated.
Recruitment and participation. As stated earlier, qualitative research has no set
rules about sample size (Patton, 2015) as there are with quantitative research (Miles et al.,
2014). Instead, there is purposeful sampling (Miles et al., 2014, Patton, 2015; Suri, 2011;

60
Van Manen, 2014) for when a researcher’s sample size is large enough gather enough
data to learn the importance of the issue being studied (Patton, 2015). According to Hill
and Williams (2012), an ideal size comprises 10 to 15 participants. Van Manen (2014)
stated that instead of looking at a “subset of population” (p. 352), researchers should seek
data saturation, which occurs once no new data are presented by participants. Although
15 participants were initially recruited, saturation was met after 13 people were
interviewed. Two interviewees participated in the pilot testing, and the other 11 in the
actual study.
Recruiting participants can be a difficult because individuals must give up their
time and discuss “personal feelings” (Hill & Williams, 2012, p. 75). Miles et al. (2014)
suggested that participants may be more willing volunteer if they have a sense that they
will be listened to (p. 60) and feel like they could be part of a change. In that way I
motivated individuals to participate.
I posted an advertisement on Facebook and Craigslist seeking volunteers who
were currently working within a 50-mile radius of Clarksville, TN with at least 5 years of
wait staff experience in the casual and fine dining restaurant industry. Once an individual
was identified, a personal letter (Hill & Williams, 2012) and a copy of the consent form
were sent to the participants. The form contained pertinent information, explained the
type of research, the voluntary basis of participation and the risks and benefits,
assurances of confidentiality, and contact information. Once the interested participants
were identified, those who returned the signed form within 5 days were selected to

61
participate. Each participant was offered a copy of the dissertation and results of the
study once completed.
Data collection. The interviews lasted approximately 20 minutes each and were
in a neutral location so the participants did not feel intimidated or think someone at work
would overhear them. The interviews followed a set of predetermined questions (see
Appendix A). Follow-up questions were asked to help the researcher gain a better
understanding of the experience, terminology, situation, and the participants’ answers.
Burkard et al. (2012) discussed three steps to develop a rapport with the
participant and gather consistent, distinctive, and personal information. The first step was
to build a rapport with the participants (Burkard et al., 2012) by using “small talk” to
make them comfortable and at ease. The second step was to make a transition to the
questions listed on the questionnaire (Burkard et al., 2012). The answers I wrote down
were specific to breaks, morale, and satisfaction. The last step was to help the participant
decompress from the questions (Burkard et al., 2012) by asking how they thought the
interview went and what made them decide to participate.
Member checking was employed twice during this study. First, I made sure I
interpreted the participants’ responses correctly (Maxwell, 2013; Miles et al., 2014;
Thomson, 2013), which can also help build rapport between the participant and
interviewer (Brown, 2012). The second time member checking was employed was at the
end of the study to ensure anonymity of the participants were kept (Miles et al., 2014).
This can also act as another check to ensure answers were understood and recorded
properly (Thomson, 2013; Vizzuso, 2015).

62
I tested all equipment prior to the start of the interview session (Patton, 2015).
Once the interview was over, the researcher reviewed the voice recordings from start to
finish (Patton, 2015), while taking notes and collecting data. In this important step, the
researcher recorded data that may have been missed during the initial interview.
Data Analysis Plan
Data were collected from open-ended interview questions from 13 individuals
who had 5 years wait staff experience in the casual and fine dining restaurant industry.
The purpose of this study was to see how breaks, or lack thereof, during a 6-hour
workday affect employee morale and employee satisfaction. Two main research
questions explored: What is the impact of breaks on employee morale in the casual and
fine dining restaurant industry? What is the impact of breaks on employee satisfaction in
the casual and fine dining restaurant industry?
The data were analyzed using a modified van Kaam method, which is a proven
process to identify themes and patterns in data (Dincer & Dincer, 2013). The original
method included a four-step process that involved “analysis, translation, transposition,
and phenomenological reflection” (Anderson & Eppard, 1998, p. 400). From this four-
step process, researchers have created a 12-step method, which was approved by van
Kaam in 1993 (Anderson & Eppard, 1998). The first eight steps are considered the
analysis step from van Kaam’s original process (Anderson & Eppard, 1998). Translation
is Step 9, transposition is Step 10, and phenomenological reflection is shown in Steps 11
and 12 (Anderson & Eppard, 1998). I used a modified version of the van Kaam approach
(Anderson & Eppard, 1998; Carter & Baghurst, 2013). I transcribed the interviews from

63
the notes I took during the interview and put them into a Word document, along with the
voice recordings.
To create a coding system, I uploaded all data into MAXqda (Oliveira et al.,
2013). By doing so, I could find notes more easily and “reduce and transform” them into
workable data (Maxwell, 2009, p. 54). Once this was complete, the data were analyzed
by color-coded codes (Oliveira et al., 2013) to track and gather similarities between the
data collection methods and the participants (Anderson & Eppard, 1998; Carter &
Baghurst, 2013). The transcriptions were read a minimum of two times to ensure all data
were coded correctly (Anderson & Eppard, 1998). The color codes were identified by the
researcher. The color codes helped to identify similarities and reoccurring themes. Next,
the data were reviewed for non-essential words, phrases, and so forth (Carter & Baghurst,
2013), and these were eliminated.
Once the data were coded, all interviews, member checks, and voice recordings
were compared against each other to see any emerging codes and similarities. These
codes were then connected to the two primary research questions. This information was
used to measure similarities and differences between employee satisfaction and employee
morale. Other themes will be discussed in Chapters 4 and 5.
Issues of Trustworthiness
Ensuring the trustworthiness of a study is accomplished in multiple ways,
including creditability, transferability, dependability, conformability, and ethical
procedures. These will all be discussed below.
64
Creditability
To ensure creditability, triangulation was used for data collection and analysis.
Triangulation is a method employed in qualitative research where combinations of
methods are used to collect data during an experiment (Patton, 2015). This can add
reliability to the data collected (Street & Ward, 2012) because triangulation acts as a
check and balance (Kapoulas & Mitic, 2012) of the research findings because the same
data were found in more than one data source (Kapoulas & Mitic, 2012; Street & Ward,
2012).
In addition, the revised van Kaam method was used as another form of
creditability (Welch, 2014). This method was used in the data analysis because it has a
proven process to identify themes and patterns in data (Dincer & Dincer, 2013). This
revised method contains a 12-step method, which is derived from van Kaam’s original
four step process (Anderson & Eppard, 1998).
Transferability
Transferability occurs when enough details and information are presented to the
readers about the study so they know if it can be applied to different settings and have the
same or similar results (Williams & Hill, 2012). I followed guidelines from Miles et al.
(2014). First, I provided detailed descriptions about the ages, gender, race, and years of
experience of the participants. In addition, any “limits on sample selection” (Miles et al.,
2014, p. 314) are listed. The findings are described in Chapter 4 so the reader can
measure the transferability and suitability to apply to other situations (Miles et al., 2014).

65
Others issues regarding transferability can come from whether the study supports
previous research and theories on the subject matter or if they differ greatly (Patton,
2015). When studies differ greatly, there may be some question to the validity of the
study by the audience (Patton, 2015). Lastly, in Chapter 5 I list locations and industries
that may benefit from the research (Miles et al., 2014).
Dependability
Dependability was accomplished by using three different data collection sources
(Patton, 2015): interviews, member checks, and voice recordings. First, the findings
“show meaning parallelism” (Miles et al., 2014, p. 312) in the multiple data sources being
used. Next, the data are relevant (Miles et al., 2014) to the research questions. Lastly, I
ensured my own bias was not injected into the data (Miles et al., 2014).
Confirmability
Confirmability is vital to qualitative research to establish trust between the readers
and the researcher because it shows that the data came from environments different from
the researcher’s own imagination (Sinkovics & Alfoldi, 2012). Confirmability can come
in the form of computer-assisted qualitative data analysis software (CAQDAS) for data
organization, linking of concepts, and grouping features (Sinkovics & Alfoldi, 2012).
MAXqda functioned as an external audit. I also explained how the study was conducted,
how the data were collected, and how the data were coded, to help with transparency
Ethical Procedures
Research regarding social sciences often needs to be more concerned with ethics
because it examines “the social lives of human beings” (Berg & Lune, 2012, p. 60). The

66
participants were all adults and did not fall into any of the vulnerable populations (Miles
et al., 2014). I solicited their voluntarily participation (Berg & Lune, 2012), and each
signed a consent form (Miles et al., 2014). In addition, all participants were informed,
before they sign the consent form, of any risks associated with this study (Berg & Lune,
2012; Miles et al., 2014). No ethical boundaries were crossed and the human rights of all
participants were not violated. Walden University’s Institutional Review Board (IRB)
gave its approval prior to starting any recruitment of participants, anonymity, and
confidentiality (IRB No. 05-13-16-0381015). As noted earlier, volunteers received and
signed the consent form, which provided details about the study.
To assure anonymity, participants were identified using a case number assigned to
them individually. Confidentiality was achieved by taking any identifiable elements
(Berg & Lune, 2012) out of the research that could be linked to an individual participant
or restaurant. The collected data will be used only for research purposes specified above
(Miles et al., 2014). Only one computer, a backup disk, and external hard drive contain
the password-protected files and will be kept for 5 years.
Summary
In this chapter I outlined the research plan used. The phenomenological study
explored how breaks affect employees’ morale and satisfaction in the casual and fine
dining restaurant industry. Details included participant selection process, the types of
questions and instruments, and the plan for processing the data. Lastly, issues of
trustworthiness were discussed to show how I ensured validity and reliability.
The findings are presented in Chapter 4.
67
Chapter 4: Results
The purpose of this phenomenological, qualitative study was to investigate the
effects of providing breaks to servers in the casual and fine dining restaurant industry on
employee morale and satisfaction (Hur & Adler, 2011; Iqbal et al., 2012). I designed this
study to investigate how an employee’s morale and satisfaction, in the casual and fine
dining restaurant industry, is affected by rest breaks and lunch breaks during a shift of 6
hours or more.
In this chapter, I provide details of the pilot study that I used for data collection,
the setting, and participant demographics. Next, I discuss the data collection process, data
analysis, and trustworthiness of the study to ensure creditability of this study, and I then
describe the results.
Pilot Study
I conducted pilot study to help refine the interview questions and interview
process (Burkard et al., 2012; Magnusson & Marecek, 2015; Maxwell, 2013). This is
typically done in qualitative studies to allow the research to focus more on the “concerns
and theories” (Maxwell, 2013, p. 66) before initiating the actual interviews with the
participants (Maxwell, 2013). Researchers can test the flow of the interview process and
the “viability of the questions” (Burkard et al., 2012, p. 88)
I conducted the pilot study in two parts: a pretest and a pilot test (Magnusson &
Marecek, 2015). The pretest was completed with a family member and a friend who
reviewed the interview questions and interview process to assure their functionality

68
(Magnusson & Marecek, 2015; Maxwell, 2013). Although the questions were found to be
adequate, too much time was allotted for the interview.
After I completed the pretest, I recruited participants. The first two participants
who signed their consent forms participated in the pilot test (Burkard et al., 2012;
Magnusson & Marecek, 2015). Participant recruitment will be further addressed in the
following sections. I asked the interviewees for feedback on the interview questions and
process. Based on the responses, I revised the order of the questions to improve the flow.
Instead of the predicted 45- to 60-minute time frame, I reduced it to 30 minutes. Last, I
adjusted some wording; for example, instead of asking, “Do you feel satisfied in your
work?” I changed the question to, “Are you satisfied with working in the restaurant
industry?”
Pilot studies have been recognized as a vital part of research because it can help
the researcher ensure their research road map is adequate (Hazzi & Maldaon, 2015). The
pilot study proved to be useful in ensuring the correct questions were asked, that there
was enough time allotted to complete the interview, and to ensure that flow of the
interview was adequate. This helped improve “the quality and the efficiency” (Hazzi &
Maldaon, 2015) of the interview process.
Research Setting
The original setting for interviews was a meeting room at the main public library
in Clarksville, TN. However, A few weeks before the interviews were to start, I had an
unexpected move from Tennessee to Texas. Because of this, the interviews were
conducted via video conference, using FaceTime, Skype, or Facebook Video Messenger.

69
The interviews were still voice recorded. This proved to be a positive change because it
allowed the participants to pick a comfortable place to participate in the interviews,
which was typically at their house. I used their home office to avoid any background
noise or distractions during the interviews.
The interviews started out with me thanking the participant for volunteering,
reminding them that they could stop the interview at any time, explaining what they
research was for, and noting that it was being recorded. In addition, the participants were
asked not to give names of individuals or business during the interviews to protect
unsuspecting individuals from anonymity. From there, I worked on building rapport and a
commonality (Hampshire, Iqbal, Blell, & Simpson, 2014) with the participant regarding
the subject of breaks, employee morale, and employee satisfaction in the casual and fine
dining restaurant industry. To help this rapport, the first questions asked were with regard
to how long the individual was in the restaurant industry and what types of jobs they held
during this time.
Next, the interview was focused on more pertinent questions related to breaks,
employee morale, and satisfaction. In addition, these questions gave myself a deeper
insight (Barnham, 2015) into the casual and fine dining restaurant and allowed for data to
be collected on the attitudes and behaviors (Barnham, 2015) of servers who are actively
working in this industry today. When clarification was needed, additional questions were
asked. The questions were carefully asked to ensure that they were not leading and that
they were open ended.

70
The interviews closed by letting the participants know that they were done with
their questions (Magnusson & Marecek, 2015). Next, the participants were asked if they
had anything to add, because this can generate more data (Magnusson & Marecek, 2015)
for the researcher and allows the participant to voice anything they feel was not addressed
in the interview questions. After this, the participants were thanked again for their
participation and were told what would happen over the next week, which was that a
copy of the conversation transcription would be sent back to them for them to proof. The
participants were also advised that once the data analysis was completed and the study
was complete, they would be contacted again in case they wanted to know the results of
the study.
Demographics
This study had a total of 13 participants, who were recruited via 13 different
social media web pages. Each participant had to have three similar demographic qualities
in order to participate. The first was that they had to have a minimum of 5 years serving
experience in casual or fine dining restaurant industry to participate. The second was that
they had to be actively working in the restaurant industry. The last was that they had to be
within a 50-mile radius of Clarksville, TN. This is where the required similar
demographics stopped.
During the recruitment phase of this study, all genders, races, and age groups
above 23 years were targeted. Out of the 41 participants that initially volunteered, 13
actually responded and completed the interview. From this number, there were 12
females and 1 male that responded. Of the 13 participants, 11 were Caucasian, 1 was

71
Asian, and 1 was African-American. The ages range from 23 years of age to 45 years of
age.
One demographical characteristic that presented itself during the study, that was
not accounted for originally was casual versus fine dining servers. Of the 13 participants,
4 individuals had fine dining experience and 9 had casual dining experience. This will be
relevant when the results of the study are discussed below.
Table 1.
Demographic Characteristics of Study Participants
Demographic n %
characteristics
5 years’ experience 13 100%
Actively working 13 100%
in restaurant industry
Working within 50-mile 13 100%
radius of Clarksville, TN
Gender – Female 12 92%
Gender – Male 1 8%
Race – Caucasian 11 85%
Race – Asian 1 7.5%
Race – African American 1 7.5%
Age – 23–29 years old 5 38.5%
Age – 30–39 years old 5 38.5%
Age – 40–49 Years old 3 23%
Fine dining servers 4 31%
Casual dining servers 9 69%

72
Data Collection
There were three different methods that were used to collect the data: interviews,
voice recordings, and member checking. The first was through interviews, which lasted
approximately 20 minute each and happened over a two-week timeframe. As stated
earlier, 13 participants were selected for this study, instead of the projected 15, due to
data saturation (Van Manen, 2014). The data was collected from participants via
Facebook Messenger, Face Time, or Skype, depending on what system the participant
had access to. This allowed me to observe the participants while the interview took place.
Also, this allowed for facial expressions and verbal language to be documented by the
researcher and used for data. Lastly, this allowed the participants to select a place where
they felt comfortable to speak freely with the researcher.
The interviews followed a set of predetermined questions (see Appendix A).
Participants were asked follow up questions, when needed, to clarify or help the
researcher have a better understanding of the experience, terminology, situation, and the
participant’s answers. Rapport building started, as suggested (Burkhard et al., 2012),
before the interview took place, during the recruitment phase. It was continued through
the interview, which helped the participants speak openly and honestly with the
researcher. The first few questions focused on making the participants comfortable by
asking about their experience. These types of questions allowed the interview to develop
into more in-depth questions as it moved along.
The interview was voice recorded, which was the second data collection method,
allowing the interviewer to focus on the participant and the environment around them.

73
Once the interview was complete, the voice recordings were transcribed individually. The
sooner this is done after an interview, the better because it allows for easier recollection
of what transpired during the interview (Magnusson & Marecek, 2015). This was
accomplished by playing back the interview, stopping when needed, and transcribing
everything that was said during the interview. Careful attention was given to ensure the
transcriptions were correct and accurate and to ensure the “participants’ anonymity and
confidentiality” (Magnusson & Marecek, 2015) was kept.
The last data collection method used was member checking. This was used in two
ways during the interview. The first was to ensure the participant’s answers were being
understood correctly (Maxwell, 2013; Miles et al., 2014; Thomson, 2013), which was
done by repeating answers back to the participant. The second was done via
transcriptions after the interview was complete. Once the transcriptions were complete,
the participants were sent a copy of their respective transcription and asked to look over
the copy to ensure it accurately represented what they said (Thomson, 2013; Vizzuso,
2015) and to ensure anonymity of the participant was kept (Miles et al, 2014).
One unusual encounter happened and one phenomenon came to light during the
data collection. The unusual encounter was that one of the participants described an
environment in the restaurant industry that no other participant did, which was heavy
drug and alcohol use by servers to make it through their work day. They described the
drug and alcohol use as prevalent because it helped the staff and servers work through
their shift because of the stress and high demand that was put on them. The phenomenon
that came to light is that there is a distinct difference between the perception, attitude, and

74
even work duties of a server in the casual restaurant industry versus a server in the fine
dining restaurant industry. Both of these finding will be detailed in more future down.
Data Analysis
Once the interviews were completed, the voice recordings were transcribed and
sent to the individual participant for member checking. Once this was complete, the files
were uploaded to MAXqda for data analysis. Once uploaded, the documents went
through first cycle coding, which is can range anywhere form a few words to a paragraph
(Saldana, 2016). For this project, parts of sentences were used for first cycle coding.
There were initially 14 different codes used. The 14 codes followed the 10 interview
questions asked during the interviews with participants. The following codes used were
for first cycle coding:
Years of experience
Different positions held
Typical day, in terms of actions
Typical day, in terms of emotions
Single shift
Double shift
Do you get meal breaks
Do you get rest/smoke breaks
How long are breaks
Breaks affect satisfaction

75
Satisfaction with employer
How to increase satisfaction
Breaks affect morale
Morale at work
How to increase morale
Once these codes were identified, the second cycle coding was implemented. The
second cycle coding can be the same codes as the first cycle coding, longer passages, or
reconfiguration (Saldana, 2016). Reconfiguration was used in this project, with 2 of the
codes being eliminated because they become redundant. These two codes were single
shift and double shift. These were captured in the code for do you get meal breaks. Also
during the second cycle coding, a new code emerged, which was type of restaurant and it
had two categories, fine dining restaurant and casual dining restaurant.
From the initial 12 codes that were kept from the first cycle coding, patterns (Glaser
& Laudel, 2013) started to emerge. This led to using themes within each of the initial 12
codes. The number of themes varied by first code, due to answers given by the
participants. For example, years of experience had 3 themes, where do you get breaks had
8 different sub categories.
Some of the themes that started to emerge during data analysis were that, first, there
appears to be a distinct difference between attitudes, working conditions, employee
satisfaction, and morale between fine dining servers and casual dining servers. Second,
breaks did not appear to have a negative or positive effect on employee satisfaction and

76
morale; however, management and how the individuals were treated by their employers
and co-workers did. Third, being a smoker versus not being a smoker played a part in
whether you got rest or smoke breaks versus no breaks at all. Lastly, meal breaks seemed
to be dependent on whether an individual worked a single shift, which was typically 4-8
hours, versus a double shift, which was generally 8-17 hours.
This process followed the revised van Kaam methods (Hamersly & Land, 2015;
Dincer & Dincer, 2013; Welch, 2014). The original method included a four-step process
that involved “analysis, translation, transposition, and phenomenological reflection”
(Anderson & Eppard, 1998, p. 400). From this four-step process, researchers have created
a 12-step method, which was approved by van Kaam in 1993 (Anderson & Eppard,
1998). The first eight steps are considered the analysis step from van Kaam’s original
process (Anderson & Eppard, 1998). Translation is Step 9, transposition is Step 10, and
phenomenological reflection is shown in Steps 11 and 12 (Anderson & Eppard, 1998). I
used a modified version of van Kaam approach (Anderson & Eppard, 1998; Carter &
Baghurst, 2013). For this study, the first steps were completed during the listing and the
first cycle coding of the data (Welch, 2014; Dincer & Dincer, 2013); reducing and
eliminating data that was irrelevant (Welch, 2014); and the second cycle coding (Saldana,
2016). From there steps 9, 10 and 11 were completed.
Evidence of Trustworthiness
Ensuring the trustworthiness of one’s study is essential for it to be an acceptable
study. There were multiple ways this assurance of trustworthiness was implemented into
this study, which will be discussed below.

77
Credibility
Triangulation, which is the use of more than one approach to explore one’s
research questions (Mayer, 2015; Graue, 2015), was used in this study. Triangulation can
act as a check and balance (Kapoulas & Mitic, 2012) and was used as such in this study.
It was done by comparing the findings in one data collection method with others (Graue,
2015). Interviews, voice recordings, and member checking were used for triangulation.
Using these three methods to collect data ensured that the data from the participants were
correct and showed that the same data was found with more than one method (Kapoulas
& Mitic, 2012; Street & Ward, 2012).
Transferability
Transferability occurs when enough details and information are presented to the
readers about the study so they know if it can be applied to different settings and have the
same or similar results (Williams and Hill, 2012; Quinn & Leligdon, 2014). This was
accomplished in this study by following Miles et al. (2014) guidelines. First, detailed
descriptions were provided regarding ages, gender, race, and years of experience of the
participants. Second, the research questions (see Appendix A) were provided, which are
transferable to any industry.
Dependability
Dependability is when overlapping methods are used to collect data (Morse,
2015). Dependability was accomplished by using three different data collection sources
(Patton, 2015; Morse, 2015). The findings showed parallelism (Miles et al., 2014)
between the three data collections sources. The data collected are relevant (Miles et al.,

78
2014) to the research questions being explored in this study. The researcher’s bias was
not injected into the data (Miles et al., 2014), by the researcher remaining open minded
and allowing the participants to answer the questions, without leading questions or
statements. Also, by transcribing the conversations word for word, using member
checking to ensure what the participant said was written correctly, and using these
documents as part of the data analysis.
Confirmability
Confirmability is vital to a qualitative research project because it establishes trust
between the reader and researcher (Sarma, 2015). This allows the results of experiences
of the participants to be highlighted and not the preferences of the researcher (Sarma,
2015). Conformability was practiced in this study by using MAXqda, which is a data
analysis software that assisted in data organization, linking of concepts, and grouping
features. With the usage of triangulation (Foote, 2016) between the interviews, voice
recordings, and member checking, the data provided was validated.
Study Results
The interview question (IQ) will first be detailed. Then the research questions will
be detailed and linked with the interview questions. Lastly, the findings will be discussed
briefly.
IQ1, 2, & 3: Ice breaker questions
IQ1: How many years of experience do you have in the restaurant industry?
IQ2: How many different serving positions have you held?
IQ3: How would you describe your typical day working?

79
These question were designed as ice-breaker questions. IQ1 was answered in a
variety of ways. Some participants answered in detail, recounting their entire time when
they first started in the serving industry until present. They described, in detail, every job
they had, how they started, and what it was like to work for the different companies.
While others were very exact and direct in their answers. However, in the end, the
information was consolidated into three categories, participants who had less than 10
years of experience, participants who had 10-19 years’ experience, and participants who
had 20 years or more of experience.
Table 2.
Years of Participants’ Experience
Years of experience No. of
participants
% of participants participants
Less than 10 years 4 31 P2, P3, P7, P14
10–19 years 7 54 P1, P5, P6, P8, P9, P11,
P13
>20 years 2 15 P4, P15
IQ2 showed that all participants worked in multiple facets of the restaurant
industry. All of the participants had serving experience. Sixty-nine percent of the
participants had hosting experience, 46% had management experience, 38% had cooking
experience, and 23% had bartender and/or bus person/dishwasher experience. There were
5 other positions that were held by 15% or less of the participants.

80
Table 3.
Positions Held by Participants
Positions held No. of
participants
% of
participants
Participants
Server 13 100 All
Host 9 69 P3, P4, P5, P6, P7, P8, P9,
P11, P13
Bartender 3 23 P3, P4, P9
Cook 5 38 P3, P4, P5, P9, P14
Manager 6 46 P3, P8, P9, P11, P14, P15
Teach culinary 1 8 P11
Bus
person/dishwasher
3 23 P2, P4, P14
Owner 1 8 P4
Caterer 1 8 P1
Corporate trainer 1 8 P8
Kitchen/prep 2 15 P2, P13
IQ3 gave insight into what a typical day is like as a server in the casual and fine
dining restaurant industry. The only consistency regarding duties, besides waiting on
table/parties, was set-up before shifts, which 46% of participants were required to do. The
rest of duties, less than 23% of participants were required to perform.
Table 4.
Typical Daily Duties of Participants
Typical Day -
Action
# of
Participants
% of Participants Participants
Host 1 8% P2
Do dishes 1 8% P2
Ensure everything is
right
1 8% P2
Work in kitchen 1 8% P2
1 to 1-1/2 hr set up 6 46% P1, P4, P5, P6, P9, P14
Getting silverware, 2 15% P4, P9

81
glassware ready
New everyday 2 15% P5, P8
Start work
immediately
3 23% P1, P4, P6
Bell curves, busy
and non-busy times
1 8% P1
Hard Work, Busy,
Chaotic, Non-stop
3 23% P7, P11, P13
Pretty Easy 1 8% P11
Running trays 1 8% P15
IQ4: Do you get breaks during your shift?
IQ4 presented two types of responses, one for meal breaks and one for rest/smoke
breaks. For meal breaks, not one participant answered an emphatic yes. Their answer was
either that they did not receive meal breaks (46%) or it depended on what was going on
during their shift (54%). Of the 54% that stated that it depended on what was going on,
three main themes became present. These themes were one, dependent upon
management; two, they would rather make money than take a break; and three, only got a
break when they worked a double shift, which was between 8 and 17 hours of work. A
single shift lasted 4-8 hours, depending on employer.
Table 5.
Did Participant Get Meal Breaks
Do you get meal
breaks
# of Participants % of Participants Participants
Yes 0 0%
No 6 46% P1, P4, P5, P7, P9,
P13
Depends on what is
going on
7 54% P2, P3, P6, P8, P11,
P14, P15
Depended on

82
who/what
Manager 2 15% P4, P11
Eat while working 1 8% P5
Rather make money 2 15% P5, P6
Only on a double
shift
2 15% P8, P13
For rest/smoke breaks, 31% of the participants said they did receive a short break
to allow them to go out and smoke. The majority of participants, 46%, said they did not
receive rest/smoke breaks. While 15% said they preferred to make money than break.
The last 8% did not smoke, so it did not matter breaks were given.
Table 6.
Did Participants Get Rest Breaks
Do you get
rest/smoke breaks
# of Participants % of Participants Participants
Yes 4 31% P2, P3, P7, P13
No 6 46% P1, P4, P7, P8, P9,
P11
Don’t smoke, don’t
care
1 8% P5
Rather make money 2 15% P5, P6
The length of breaks varied depending on the individual. Some lasted less than 10
minutes (55%) which the participants identified as smoke breaks. Others lasted 10 to 30
minutes (22.5%) while others lasted longer than 30 minutes (22.5%). The majority (64%)
of the participants stated that when meal breaks are given during a double shift, they last
between 15 minutes to a few hours.

83
Table 7.
Length of Breaks
How long are
breaks
# of Participants % of Participants Participants
Time frame 7
Less than 10
minutes (Smoke
break)
5 38% P6, P7, P9, P13,
P14
10-30 minutes 2 15% P7, P14
Longer than 30
minutes
2 15% P1, P13
When 11
During a slowdown 1 8% P2
No breaks 2 15% P3, P4
During a double
shift (meal break)
7 54% P1, P2, P4, P5, P7,
P8, P13,
Between pre-work
and customers
(beginning of shift)
1 8% P4
IQ5: Do you feel satisfied with your employer/work?
There were a total of 12 themes that emerged from IQ5. They were mixed with
positive and negative responses, both averaging 50% of the themes. For the negative
responses, management was the main reason for dissatisfaction, this was followed closely
by feeling dissatisfied due to stress, bad treatment, no benefits/bad pay, and not feeling
satisfied at all. The positive responses showed that most interviewees were satisfied with
work at 38%. Twenty-three percentage were satisfied because of pay, 15% were satisfied
because they were able to meet new people, 8% were satisfied with rewards, because of
good products, and good management, respectively.
Table 8.

84
Participants Satisfaction with Employer
Satisfaction with
employer
# of Participants % of Participants Participants
Negative 12
Stressed - 2 15% P2, P7
Not satisfied - 2 15% P2, P7
Short Staffed - 1 8% P2
Bad treatment - 2 15% P3, P7
Not with
management -
3 23% P7, P9, P13
No benefits, better
pay -
2 15% P8, P11
Positive 13
Meet new people + 2 15% P4, P1
Awards + 1 8% P4
Great Products + 1 8% P4
Good money + 3 23% P4, P5, P9
Good team,
management, drama
free +
1 8% P4
Satisfied + 5 38% P6, P11, P14, P15,
P1
IQ6: Do you feel your morale at work is good or bad?
There were 9 themes that developed from IQ6, 34% of which were negative and
44% of which were positive, and 22% could be negative or positive. Of the negative
responses, 67% of participants answered that they liked serving at first, but after a while,
they hated it because of the way they were treated. The other negative responses, both at
16.5%, were in reference to morale being low or bad because they were working outside
their job classification and they received no respect at work from anyone. For the positive
responses, 40% said morale was high or good because of they loved what they were
doing. Thirty percent stated their morale was high because the customers like them.
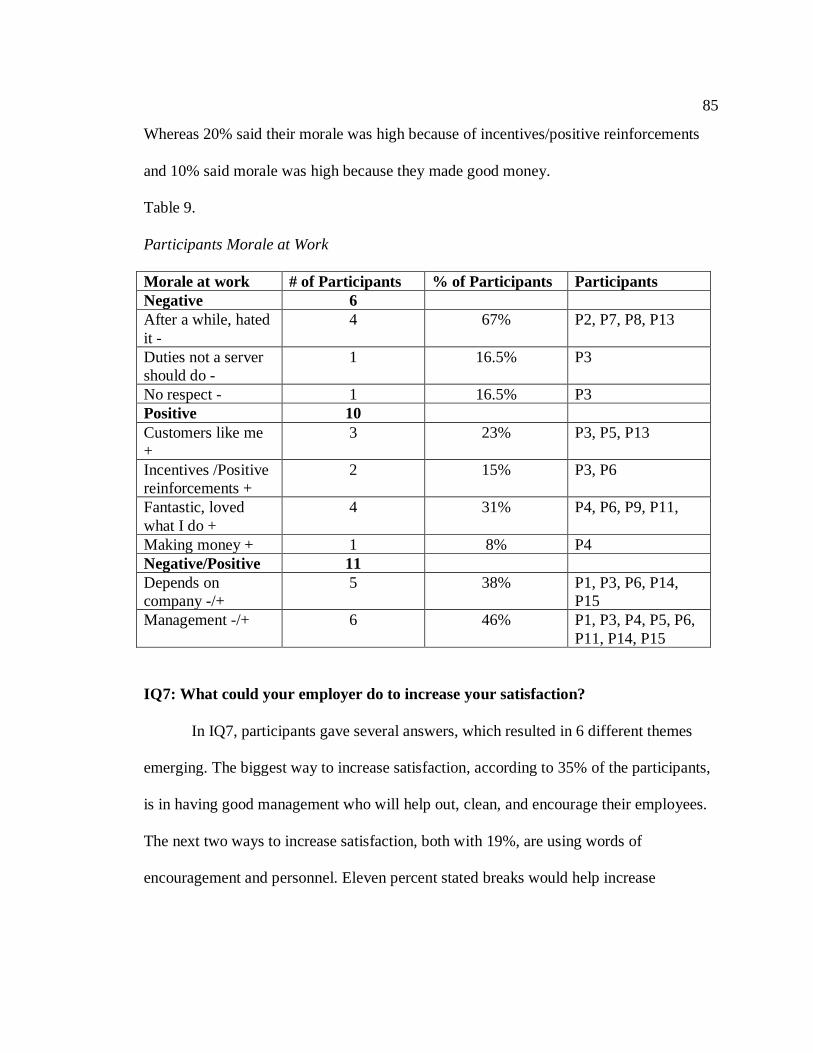
85
Whereas 20% said their morale was high because of incentives/positive reinforcements
and 10% said morale was high because they made good money.
Table 9.
Participants Morale at Work
Morale at work # of Participants % of Participants Participants
Negative 6
After a while, hated
it -
4 67% P2, P7, P8, P13
Duties not a server
should do -
1 16.5% P3
No respect - 1 16.5% P3
Positive 10
Customers like me
+
3 23% P3, P5, P13
Incentives /Positive
reinforcements +
2 15% P3, P6
Fantastic, loved
what I do +
4 31% P4, P6, P9, P11,
Making money + 1 8% P4
Negative/Positive 11
Depends on
company -/+
5 38% P1, P3, P6, P14,
P15
Management -/+ 6 46% P1, P3, P4, P5, P6,
P11, P14, P15
IQ7: What could your employer do to increase your satisfaction?
In IQ7, participants gave several answers, which resulted in 6 different themes
emerging. The biggest way to increase satisfaction, according to 35% of the participants,
is in having good management who will help out, clean, and encourage their employees.
The next two ways to increase satisfaction, both with 19%, are using words of
encouragement and personnel. Eleven percent stated breaks would help increase

86
satisfaction and 8% stated that either having the desire to help customers or giving better
pay, benefits, free food/liquor/drinks would increase satisfaction.
Table 10.
How Participant Thought to Increase Satisfaction
How to increase
satisfaction
# of Participants % of Participants Participants
Words of
encouragement
(thank, you, good
job, etc.)
5 19% P1, P2, P8, P11,
P13,
Breaks 3 11% P3, P11, P13
Management
helping, leading,
encouraging
9 35% P1, P4, P6, P7, P8,
P9, P11, P13, P14
Hire good
employees/staffing
correct/organized
5 8% P4, P8, P9, P13,
P14
Sense of urgency,
want to help
customers
2 19% P4, P9
Pay, benefits, & free
food, liquor, drinks
2 8% P5, P15
IQ8: What could your employer do to increase your morale?
The responses that participants gave to IQ8 resulted in 4 themes emerging. The
best way, according to the participants, to increase morale is to have positive
reinforcements/incentives, which came in at 40%. Next, 35% said that having good
management and showing respect to employees would increase morale. Twenty percent
stated that morale could be increased by having better pay/benefits/breaks and only 5%
said hiring better employees would increase morale.
Table 11.
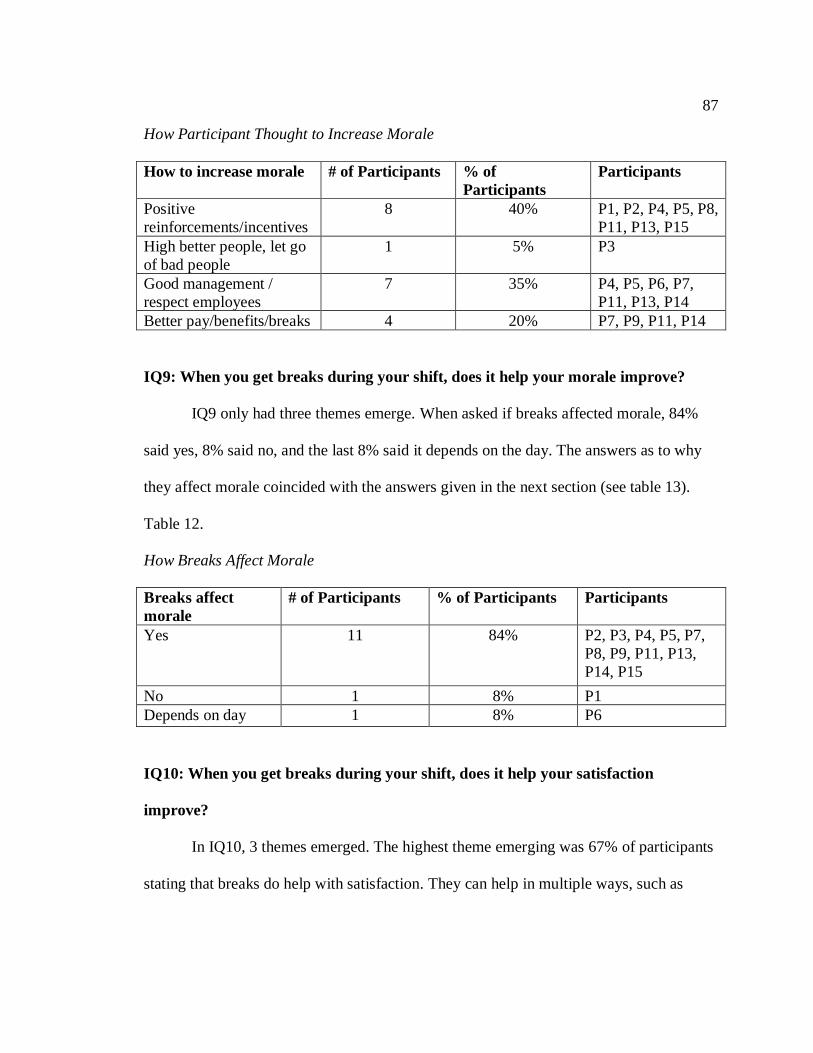
87
How Participant Thought to Increase Morale
How to increase morale # of Participants % of
Participants
Participants
Positive
reinforcements/incentives
8 40% P1, P2, P4, P5, P8,
P11, P13, P15
High better people, let go
of bad people
1 5% P3
Good management /
respect employees
7 35% P4, P5, P6, P7,
P11, P13, P14
Better pay/benefits/breaks 4 20% P7, P9, P11, P14
IQ9: When you get breaks during your shift, does it help your morale improve?
IQ9 only had three themes emerge. When asked if breaks affected morale, 84%
said yes, 8% said no, and the last 8% said it depends on the day. The answers as to why
they affect morale coincided with the answers given in the next section (see table 13).
Table 12.
How Breaks Affect Morale
Breaks affect
morale
# of Participants % of Participants Participants
Yes 11 84% P2, P3, P4, P5, P7,
P8, P9, P11, P13,
P14, P15
No 1 8% P1
Depends on day 1 8% P6
IQ10: When you get breaks during your shift, does it help your satisfaction
improve?
In IQ10, 3 themes emerged. The highest theme emerging was 67% of participants
stating that breaks do help with satisfaction. They can help in multiple ways, such as

88
allowing for downtime, being able to collect oneself, etc. Twenty percent of participants
stated that breaks would not create satisfaction and that they just wanted to make money.
The last 13% of participants said that breaks do not increase satisfaction.
Table 13.
How Breaks Affect Satisfaction
Breaks affect
Satisfaction
# of Participants % of Participants Participants
Management
doesn’t care
2 13% P4, P7
No, just want to
make money
3 20% P1, P4, P6
Yes 10 67% P1, P2, P3, P5, P8,
P9, P11, P14, P15 Listen to music 1 10% P5 Escape for a while 3 30% P2, P8, P14 Talk on phone 1 10% P2 Come back in better mood
1 10% P2
Collect yourself 3 30% P3, P9, P15 Positive reinforcement 1 10% P1
Summary
This chapter has reviewed the pilot study performed, the research setting,
demographics, data collection methods, data analysis, evidence of trustworthiness, and
the results of the study. In Chapter 5, I provide interpretations of the findings, limitations
of the study, recommendations, and implications of this study.
89
Chapter 5: Discussion, Conclusions, and Recommendations
The purpose of this phenomenological, qualitative study was to investigate how
work breaks affect employee morale and satisfaction. To accomplish this, I conducted
video interviews using open-ended questions. I interviewed total of 13 participants,
including two for the pilot study and 11 for the regular study. I interpreted the results
based on Herzberg’s two-factor theory (Wilson, 2015; Teck-Hong & Waheed, 2011,
Buble et al., 2014).
One key finding in the research was that breaks do not have a significant effect on
employee morale and satisfaction, which is different from findings in other studies in
different industries (Hunter & Wu, 2016). Another key finding was that management,
coworkers, and positive reinforcements (words of encouragement, incentives, etc.) did
more to contribute to increase employee satisfaction and morale than anything else. The
last key finding was that extrinsic factors affect intrinsic factors.
The full interpretation of findings will follow, along with limitations,
recommendations, and implication of the study.
Interpretation of Findings
To fully understand the interpretation of the findings, I will explore both research
questions (RQs) and I will analyze the answers by participants using Herzberg’s two-
factor theory, which is based on motivation and hygiene theory (Holmberg, Sobis, &
Calstrom, 2016). This theory allows a researcher to study intrinsic factors and extrinsic
factors to understand what affects satisfaction and dissatisfaction (Holmberg et al., 2016).

90
The findings in this study differed from other research conducted on different industries
(Hunter & Wu, 2016; Bechtold et al., 1984; Tucker, 2003; Trougakos et al., 2008;
Trougakos et al., 2014).
Research Question 1
RQ1: What is the impact of breaks on employee morale in the casual and fine
dining restaurant industry? I designed this research question to improve understanding
of whether work breaks, either meal or rest, contributed to employee morale of a server in
the casual and fine dining restaurant industry. Employee morale was the intrinsic factor
and breaks were the extrinsic factors. As previously stated, intrinsic factors are those
factors that are within an individual that directly affect their motivation (Janus &
Browning, 2014), whereas extrinsic factors are those factors that are outside an individual
that affect their motivation (Janus & Browning, 2014).
According to the results, when asked whether breaks affected morale, the
participants overwhelmingly answered in the affirmative. However, when asked how
morale could be improved at work, breaks were the third most important factor. The best
way to increase morale is to give positive reinforcements. The second way was how
management treated employees. Breaks could fall into either of the first two categories.
However, in their actual responses, participants named the two separately.
Figure 2. How breaks affect morale and how to increase morale

91
Research Question 2
RQ2: What is the impact of breaks on employee satisfaction in the casual and
fine dining restaurant industry? This research question was designed to obtain a better
understanding of the possible relationship between work breaks, either meal or rest, and
employee satisfaction for servers in the casual and fine dining restaurant industry.
Employee satisfaction was the intrinsic factor and breaks were the extrinsic factors.
When asked if breaks affected satisfaction, the participants overwhelmingly
answered yes. However, when asked how satisfaction could be improved at work, breaks
were the fourth most important factor. The best way to increase morale was positive
treatment from management. There was a tie for the second way, which were words of
encouragement and personnel hiring and staffing. One could argue that breaks could fall
into how management treats employees; however, based on actual answers from
participants, they did name them separately.
Figure 3. How breaks affect satisfaction and how to increase satisfaction

92
Research Data Versus Literature Review
Before analyzing how the research data compared to the literature review,
intrinsic and extrinsic factors need to be defined again. Intrinsic factors, also known as
motivation and/or intrinsic motivation, are factors that involve achievement, recognition
(Pepe, 2011), praise, advancement (Smith & Shields, 2012), & personal needs (Tech-
Hong & Waheed, 2011; Sukaini, Jing, Zghair Albazooni, 2015). Individuals need some
type of intrinsic motivation to have job satisfaction and success (Raus, 2014; Sukaini et
al., 2015). Shin and Kelly (2013) link self-determination theory with intrinsic factors, in
that individuals who use intrinsic factors find self-fulfilling pleasure and satisfaction and
use that as motivation to do well. Individuals who lack intrinsic motivation “tend to have
unstable goals” (Shin & Kelly, 2013, p. 143; Raus, 2014) and are not as optimistic as
individuals who have intrinsic motivation.
Extrinsic factors, also known as hygiene, are factors that come from external
resources (Firmin, Orient, Steiner, & Firmin, 2013; Hubbard, Jervis, & Drake, 2016),
such as culture, salary, employee discontent, policies, working conditions, and job

93
structure (Hyun & Oh, 2011; Cnar et al, 2011; Pepe, 2010; Dartet-Baah & Amoako,
2011). These factors will not motivate an individual to work hard or to have job
satisfaction (Pepe, 2010), but contribute to dissatisfaction (Furnham et al., 2009). They
can act as a starting point to motivate if dissatisfaction can be minimized (Dartey-Baah &
Amoako, 2011) and can help “prevent workers’ discontent” (Hyun & Oh, 2011). This
leads to the thought that hygiene factors do not have less effect than intrinsic factors
(Cnar et al., 2011). Both factors need to be concentrated on in order to have a more
productive, positive work force (Cnar et al., 2011).
Because both of these factors are needed to have a more productive, positive work
force (Cnar et al., 2011), the research questions and interview questions were formatted
to measure both factors. This included asking questions that gathered data on both
intrinsic factors, employee morale and satisfaction, and extrinsic factors, breaks, how to
increase, what affects morale and satisfaction, etc. This was accomplished by asking
open-ended questions that looks for both intrinsic and extrinsic factors.
From the data collected, breaks were defined as three different types, less than 10-
minutes, which were defined as smoke breaks by participants; 10 – 30 minutes; and
longer than 30 minutes (see table 7). There was no real distinction between rest breaks
and meal breaks, expect for the less than 10-minute smoke break. Based on this, the time
definitions differed from what was listed in the literature review. According to the U.S.
DOL (2016), there are two types of breaks: short breaks and meal breaks. Short breaks
typically last 5 to 20 minutes and are paid for by the company (USDOL, 2016; Segal,
2013). Meal breaks, which are any breaks from work that last at least 30 minutes, are
94
paid for by the employer (USDOL, 2016; Segal, 2013). In order for a lunch break to be
paid, an employer must ensure that the employee is relieved from all work duties (Segal
2013).
Regardless of how they are defined, either by this research or federal statues, it
was found that breaks had no bearing on employee morale and satisfaction. The results
did show that the participants did believe that breaks had an effect on their employee
morale and satisfaction, but when asked how their satisfaction and morale could be
improved, the participants listed breaks as the third most important way for morale and
the fourth most important way for satisfaction. When asked how satisfied they were with
their employers and how their morale was at work, not one participant listed breaks as a
positive or negative response. In fact, breaks were not discussed until the participants
were asked direct questions regarding breaks during their workday (see tables 8 & 9).
For this study, employee satisfaction was defined as the extent to which
employees are satisfied (Furnham et al., 2009) and the state of employment where an
employee is in a positive emotional state about their work environment (Mahmood et al.,
2014). In the literature review, many things were shown to affect satisfaction, including
pressure to perform duties, open communication, being asked to do more with less,
feeling burned out, and organizational culture. The data showed that these factors did
have an effect. Organizational culture includes many factors in the work place, including
the internal work environment, management, pay, and incentives (Karyotakis &
Moutakis, 2016; Park, Lee, &Kim, 2016). These factors correlate with the data collected,
therefore this study supports what was found in the literature review.

95
Morale was defined as the relationship one has with their work and their employer
(Arunchand & Ramanathan, 2013), which can be high (positive) or low (negative).
According to the literature review, morale affects employee efficiency and work quality
of life, has an effect on organizational goals, and helps organizations remain competitive.
These claims were not support directly with the research data because they were not
included in the research or interview questions. However, just like satisfaction, morale
can be affected by organizational culture because it affects the internal work
environment, management, pay, and incentives (Karyotakis & Moutakis, 2016; Park, Lee,
&Kim, 2016). Therefore, indirectly, the research data supported the literature review
because management, pay, and personnel are part of the organizational culture.
Communication was discussed in the literature review for employee morale
because it can have a positive effect on employee morale, if done correctly (Rawat et al.,
2015). Calota et al. (2015) discussed the importance management’s communication has
on employees, which was shown in the results of this study to have a huge effect on
employee morale and satisfaction. According to Calota et al (2015), managerial
communication is vital for employees to feel like they are part of the organization. The
more an individual feels their manager communicates with them, the more they feel truly
involved in an organization. The results of this study showed that the participants believe
that management is the key to increased morale and satisfaction in the restaurant
environment (see tables 10 & 11).
One finding that came as a surprise and was not planned for was that there were
distinct differences in employee satisfaction and morale when it came to servers in fine

96
dining versus casual dining restaurants. However, there were twice the number of casual
servers interviewed as fine dining servers. Future studies can address this phenomenon to
have a better understanding if there is, in fact, a difference between servers in the casual
and fine dining restaurant industry.
Table 14.
Fine Dining Participants vs. Casual Dining Participants
Restaurant Type # of Participants % of Participants Participants
Fine Dining 4 31% P1, P4, P5, P6
Casual Dining 9 69% P2, P3, P7, P8, P9,
P11, P13, , P14, P15
The participants who had fine dining experience also had previous experience as a server
in casual restaurant. According to the answers given, fine dining servers made more
money during a shift than casual server on any given day. The differences between a
casual and fine dining restaurant is that casual dining restaurants are moderately priced
and serves food in a relaxed atmosphere, whereas fine dining restaurants are full service
restaurants that are high in quality that consumers pay for and served in a luxurious
atmosphere (Ha & Jang, 2013) This may be a reason for the discrepancy and can be
studied in future research projects.
Limitations of Study
As discussed earlier, limitations in research pertain to the potential weaknesses
(Simon, 2011) that are out of a researcher’s control during a study, which can occur
regardless of the method used (Patton, 2015). To ensure the data collected were valid,
triangulation was utilized during the data collection and processing portion by utilizing

97
interviews, voice recordings, and member checking. Although the restaurant industry
offers many avenues for research, this study was limited to studying employee
satisfaction and morale only. All interviewees were actively working within a 50-mile
radius of Clarksville, TN, and had 5 or more years of experience as servers. As a result,
responses were limited by how breaks were given in this region, by employee
expectations, and by Tennessee laws.
Another limitation that was noted once the study was complete was that there was
a distinct difference between how servers in the fine dining restaurants answered
compared to the servers in the casual dining. This could have been addressed during the
recruitment phase by recruiting more fine dining servers. Future studies can be completed
investigating differences between the two types of servers.
Recommendations
This study examined how breaks affect employee satisfaction and morale. The
results showed that breaks can affect employee satisfaction and morale; however, there
are other factors that influence satisfaction and morale more than breaks. Based on these
results, more research is needed on employee morale and satisfaction in the casual and
fine dining restaurant industry and how they can be increased versus what makes them
decrease. This can be accomplished by using research done in other industries as a guide
for research, such as Aydin & Ceylan (2011), Furnham et al. (2009), Halkos &
Bousinakis (2010), Ismail & El Nakkache (2014), Rawat et al. (2015), Weyant (2009).
Another recommendation for further research would be to expand the area in
which participants were recruited. A state-wide search or even a nationwide search may

98
produce additional information not obtained in this study. However, in a nationwide
study, attention needs to be given to state laws because they may have an effect on the
answers regarding work breaks. Every state has different laws, with only twenty-one
states in the United States having laws regulating lunch breaks (Suchyta, 2014) and only
seven states regulate rest breaks during the workday (Suchyta, 2014). To determine the
sample size Marshall et al (2013) and Suri (2011) can be used for reference.
Another recommendation for future research would be to conduct a study that
compares how men are treated versus women in the restaurant industry to see if there is a
difference between the genders. Also, a future could study differences by race,
nationality, and education. These types of studies would be beneficial to see if there is a
difference in how a certain group is treated compared to another.
During this research, there were distinct difference between casual and fine dining
participants’ answers. For instance, participants that work in fine dining express more
satisfaction with their work and employers than the casual restaurant servers. Fine dining
servers also stated that they were not as interested in breaks or rest periods as casual
workers because they felt that when they were not working, they were not making
money.
One factor that was not mentioned by participants was the turnover effect of their
satisfaction and morale. This type of data collection would require a more in-depth
research project, which was not conducive to the time constrains that were on this project.
There has been research done in other industries that could be used as examples for this

99
type of study. Some of these projects are: Davis (2013), Murphy et al (2009), Parzinger et
al (2012), Pepe (2010), Rizwan & Mukhtar (2014), and Soltis et al (2013).
Lastly, based on the results of this study, it is recommended that a study is
completed on how management affect employee morale and satisfaction. During the data
analysis of this study, it was found that how management treats employees has the most
effect on their satisfaction and morale. There have been many studies completed on this
topic in other industries (Buble et al., 2014; Scheers & Botha, 2014; Ventura, 2006;
Raina & Roebuck, 2014). There has also been research completed on customer
satisfaction (Ma, Qu, Eliwa, 2014; Jin, Goh, Huffman, & Yuan, 2015; and Raab, Zemke,
Hertzman, & Singh, 2013). But there is very limited research done on employee
satisfaction and morale in the restaurant industry (Ellingson, Tews, & Dachner, 2016 &
Koutroumanis, Alexakis, Dastoor, 2015) and how management factors into this.
Implications
Qualitative research is used when discovery is needed to help “understand, predict
and control social phenomena” (Park & Park, 2016, p. 3). It allows the researcher to
interact with the participant, which allows for a personal voice to help develop a theory
(Park & Park, 2016). With regard to this study and social change, qualitative research can
help develop a theory (Park & Park, 2016) that can change the restaurant industry, as will
be evident as described now.
Bringing about positive social change to the US job market can take place in
terms of “goals, objectives, and values” (Bano, 2014, p. 773). Social change is an
important part of educational programs (Bano, 2014), including Walden University, and

100
the business world (Singh & Dutch, 2014; Ebrashi, 2013). The effects of social change on
the dynamic business world are abundant, and being able to influence and enact positive
change is an important part of leadership (Singh & Dutch, 2014).
This research focused on the effect work breaks have on individual servers in the
restaurant industry. The positive social change aspects include allowing breaks to allow
individuals to recoup during their shift. In addition, organizations need to look at how
management is treating their employees. If employee satisfaction and morale can be
increased by management treating them with respect and having an organizational culture
that is positive (Moldovan & Macarie, 2014), an organization would be foolish not to
want to make positive change to make this happen. Allowing managers and leaders to use
the human resources of a company to enact positive social change is imperative to
improving how businesses are run, how they grow, and how they increase their
profitability.
Besides this research project shows need for more research on what affects
servers in the casual and fine dining industry, this research could also lead to change
within employment law. As previously stated, there are no federal laws mandating work
breaks (U.S. DOL, 2016). Currently only 21 states that mandate lunch breaks (Suchyta,
2014) and 7 states that mandate rest breaks for employees.
Lastly, this research can help human resources (HR) advocate for better care for
employees. This research showed ways employees think that employers can increase their
satisfaction and morale. HR can use this to start implementing change in to management
training and new hire orientations. Incorporating HR in social change within an

101
organization is necessary for the change to take place (Bajpai Singh & Dutch, 2014)
because HR can help optimize the change that is needed with employees.
Conclusions
This chapter has discussed the interpretations of findings, limitations of study,
recommendations, and implications of this research project. The main points to take away
are as follows. First, research was needed due to lack of research on servers and breaks in
the casual and fine dining restaurant industry. Secondly, this study showed there is a lack
of breaks in this type of work environment. Lastly, there was not a clear answer as to if
giving breaks would increase employee satisfaction and morale, but there is positive
correlation between employee satisfaction and morale and how they are treated by
management.

102
References
Abawi. L. A. (2012). Introducing refractive phenomenology. International Journal
Multiple Research Approaches, 6(2), 141-149. doi:10.5172/mra.2012.6.2.141
Al Mehairi, H. A. & Zakaria, N. (2014). Understanding organizational culture for
effective knowledge sharing behaviors in the work place. Organizational
Cultures: An International Journal, 3(3), 33-52. doi:10.18848/2327-
8013/CGP/v13i03/59257
Al Sukaini, A. M., Jing, Z., & Zghair Albazooni, A. G. (2015). Mobile crowdsourcing:
Intrinsic and extrinsic motivational factors influencing online communities in
China. Journal of Marketing Development & Competitiveness, 9(1), 129-145.
Retrieved from http://www.sajm-amdisa.org/
Anderson, J., & Eppard, J. (1998). Van Kaam’s method revised. Qualitative Health
Research, 8(3), 399-403. doi:10.1177/104973239800800310
Arunchand, C. H., & Ramanathan, H. N. (2013). Organizational culture and employee
morale: A public sector enterprise experience. Journal of Strategic Human
Resource Management, 2(1), 1-8. Retrieved from www.manuscript.publishing
india.com
Astalin, P. K. (2013). Qualitative research designs: A conceptual framework.
International Journal of Social Science & Interdisciplinary Research, 2(1), 118-
124. Retrieved from www.indianresearchjournals.com
Aydin, B., & Ceylan, A. (2011). What is the joint effect of employee satisfaction and
customer orientation on the organizational culture in metalworking

103
manufacturing? International Journal of Human Resource Management, 22(5),
1203-1215. doi:10.1080/09585192.2011.556805
Bajpai Singh, L., & Dutch, M. A. (2014). Changing socio-cultural environment and
human resource practices. Amity Global Business Review, 99-104. Retrieved from
www.amity.edu/aibs/researchpublications.asp
Baltazar, A. (2014). Rescue team. Jck, 145(5), 234-240. Retrieved from
www.jck.online.com
Bano, A. (2014). Role of education in bringing social change. International Journal of
Applied Services Marketing Perspectives, 3(1), 773-777. Retrieved from
www.pezzottaitejournals.net
Barker, E. (2014). States offer a smorgasbord of meal and rest break laws. Employment
Relations Today (Wiley), 41(2), 63-67. doi:10.1002/ert.21455
Barnham, C. (2015). Quantitative and qualitative research. International Journal of
Market Research, 57(6), 837-854. doi:10.2501/IJMR-2015-070
Bechtold, S. E., Janaro, R. E., & Sumners, D. L. (1984). Maximization of labor
productivity through optimal rest-break schedules. Management Science, 30(12).
1442-1458. doi:10.1287/mnsc.30.12.1442
Bell, R. L., Sutanto, W., Baldwin, R., & Holloway, R. (2014). The gender inequity
misconception: How Texas female business school faculty are smashing the glass
ceiling. Journal of Management Policy and Practice, 15(1), 39-57. Retrieved
from http://jmppnet.com/
Berg, B. L., & Lune, H. (2012). Qualitative research methods for the social sciences (8th

104
ed.). Boston, MA: Pearson.
Binnewies, C., Sonnentag, S., & Mojza, E. J. (2009). Daily performance at work: Feeling
recovered in the morning as a predictor of day-level job performance. Journal of
Organizational Behavior, 30(1), 67-93. doi:10.1002/job.541
Brooks, D., Dougherty, B., & Price, J. (2015). The federal government as a model
employer and its effect on employment civil rights in America. Employee Rights
& Employment Policy Journal, 19(2), 151-187. Retrieved from
www.kentlaw.edu/ilw/erepj.
Brown, A. (2013). Ethnography in information systems research. Paper presented at the
58-IX: Academic Conferences International Limited. Retrieved from academic-
conferences.org
Brown, R. (2012). The effect of professional development on performance and evaluation
of substitute teachers in a public school system (Doctoral dissertation). Retrieved
from Proquest database. (Order no. 3554765)
Buble, M., Juras, A., & Matic, I. (2014). The relationship between manager’s leadership
and motivation. Management: Journal of Contemporary Management Issues,
19(1), 161-193. Retrieved from http://hrcak.srce.hr/management
Burkard, A. W., Knox, S., & Hill, C. E. (2012). Data collection. In C. E. Hill (Ed.),
Consensual qualitative research: A practical resource for investigating social
science phenomena (pp. 83-101). Washington, DC: American Psychological
Association.
Calota, G., Pirvulescu, B., & Criotoru, I. (2015). The importance of the management

105
communication process. Internal Auditing & Risk Management, 10(1), 77-83.
Retrieved from www.univath.ro/
Cao, H., Jiang, J., Oh, L., Li, H., Liao, X., & Chen, Z. (2013). A Maslow's hierarchy of
needs analysis of social networking services continuance. Journal of Service
Management, 24(2), 170-190. doi:10.1108/09564231311323953
Carter, D., & Baghurst, T. (2014). The influence of servant leadership on restaurant
employee engagement. Journal of Business Ethics, 124(3), 453-464.
doi:10.1007/s10551-013-1882-0
Chiloane-Tsoka, E. (2013). The influence of corporate culture on organisational change
of first national bank of Namibia. International Journal of Business and
Economic Development (IJBED), 1(3), 15-24. Retrieved from http://ijbed.org/
Çınar, O., Bektaş, Ç., & Aslan, I. (2011). A motivation study on the effectiveness of
intrinsic and extrinsic factors. Economics & Management, 16, 690-695. Retrieved
from hhtp://www.icem.It/en
Coombs, J. (2015). Fatigue at work. Occupational Health, 67(3), 15-17. Retrieved from
http://www.personneltoday.com/occupational-health-and-wellbeing/
Coughlan, L., Moolman, H., & Haarhoff, R. (2014). External job satisfaction factors
improving the overall job satisfaction of selected five-star hotel employees. South
African Journal of Business Management, 45(2), 97-107. Retrieved from
http://www.usb.ac.za/
Cowart, L. (2014). Why employee morale matters--especially now. Public Manager,
43(1), 44-47. Retrieved from https://www.td.org/

106
Dababneh, A. J., Swanson, N., & Shell, R. L. (2001). Effect of added rest breaks on the
productivity and well being of workers. Ergonomics, 44(2), 164–174.
doi:10.1080/001401301750048196
Dartey-Baah, K. & Amoako, G. K. (2011). Application of Frederick Herzberg’s two-
factor theory in assessing and understanding employee motivation at work
Ghanaian perspective. European Journal of Business and Management, 3(9),
1-8. Retrieved from www.iiste.org
Davis, T. L. (2013). A qualitative study of the effects of employee retention on the
organization (Doctoral dissertation). Retrieved from Proquest database. (Order
no. 3553042)
DeGrassi, S. W., Morgan, W. B., Walker, S. S., Yingchun, I., & Sabat, I. (2012). Ethical
decision-making: Group diversity holds the key. Journal of Leadership,
Accountability & Ethics, 9(6), 51-65. Retrieved from http://www.na-
businesspress.com/jlaeopen.html
Demerouti, E., Bakker, A. B., Sonnentag, S., & Fullagar, C. J. (2012). Work-related flow
and energy at work and at home: A study on the role of daily recovery. Journal of
Organizational Behavior, 33(2), 276-295. doi:10.1002/job.760
Dincer, B., & Dincer, C. (2013). Corporate social responsibility decisions: A dilemma for
SME executives? Social Responsibility Journal, 9(2), 177-187. doi:10.1108/SRJ-
07-2011-0028
Easton, F. F. (2014), Service Completion Estimates for Cross-trained Workforce
Schedules under Uncertain Attendance and Demand. Production and Operations
107
Management, 23: 660–675. doi:10.1111/poms.12174
Ebrashi, R. E. (2013). Social entrepreneurship theory and sustainable social effect. Social
Responsibility Journal, 9(2), 188-209. doi:http://dx.doi.org/10.1108/SRJ-07-2011-
0013
Ellingson, J. E., Tews, M. J., & Dachner, A. M. (2016). Constituent attachment and
voluntary turnover in low-wage/low-skill service work. Journal Of Applied
Psychology, 101(1), 129-140. doi:10.1037/apl0000028
Firmin, M. W., Orient, K. M., Steiner, H., & Firmin, R. L. (2013). Challenging Extrinsic
Factors that Affect the Employment Longevity of Staff Working with Clients
Possessing Intellectual Disabilities. International Journal Of Business
Anthropology, 4(2), 54-65. Retrieved from http://www.na-businesspress.com/
Foote, A. R. (2016). Exploring knowledge management models on information
technology (IT) projects (Order No. 10006570). Available from Dissertations &
Theses @ Walden University. (1762744417). Retrieved from
http://ezp.waldenulibrary.org/login?url=http://search.proquest.com/docview/1762
744417?accountid=14872
Fox, A. (2013). Customer-Centric HR. HR Magazine, 58(6), 58-64. Retrieved from
www.shrm.org
Freeman, M., Gergen, K. J., & Josselson, R. (2015). The promises of qualitative inquiry.
American Psychologist, 70(1), 1-9. doi:10.1037/a0038597
Fritz, C. (2012). Coffee breaks don't boost productivity after all. Harvard Business
Review, 90(5), 34-35. Retrieved from www.hbs.org

108
Fritz, C., Ellis, A. M., Demsky, C. A., Lin, B. C., & Guros, F. (2013). Embracing work
breaks: Recovering from work stress. Organizational Dynamics, 42(4), 274-280.
doi:10.1016/j.orgdyn.2013.07.005
Furnham, A., Eracleous, A., & Chamorro-Premuzic, T. (2009). Personality: motivation
and job satisfaction: Herzberg meets the big five. Journal of Managerial
Psychology, 24(8), 765-779. doi:10.1108/02683940910996789
Gazzoli, G., Hancer, M., & Park, Y. (2012). Employee Empowerment and customer
orientation: Effects on workers' attitudes in restaurant organizations. International
Journal of Hospitality & Tourism Administration, 13(1), 1-25.
doi:10.1080/15256480.2012.640180
Glaser, J. & Laudel, G. (2013). Life with and without coding: Two methods for early
stage data analysis in qualitative research aiming at casual explanations. Forum:
Qualitative Social Research Sozialforschung, 14(2). Retrieved from:
www.qualitative-research.net.
Graue, C. (2015). Qualitative data analysis. International Journal Of Sales, Retailing &
Marketing, 4(9), 5-14. Retrieved from www.ijsrm.com
Guillén, M., Ferrero, I., & Hoffman, W. (2015). The neglected ethical and spiritual
motivations in the workplace. Journal of Business Ethics, 128(4), 803-816.
doi:10.1007/s10551-013-1985-7
Gurchiek, K. (2011). Poll: Many workers opt for desktop dining. HRMagazine, 56(11),
16. Retrieved from www.shrm.org
Ha, J., & Jang, S. (2013). Attributes, consequences, and consumer values: A means-end

109
chain approach across restaurant segments. International Journal Of
Contemporary Hospitality Management, 25(3), 383-409.
doi:10.1108/09596111311311035
Halkos, G., & Bousinakis, D., (2010) The effect of stress and satisfaction on productivity.
International Journal of Productivity and Performance Management, 59(5), 415 -
431. doi:10.11108/17410401011052869
Hampshire, K., Iqbal, N., Blell, M., & Simpson, B. (2014). The interview as narrative
ethnography: seeking and shaping connections in qualitative research.
International Journal Of Social Research Methodology, 17(3), 215-231.
doi:10.1080/13645579.2012.729405
Hamersly, B., & Land, D. (2015). Building productivity in virtyal project teams. Revista
De Gestão E Projetos, 6(1), 1-13. doi:10.5585/gep.v6i1.305
Hazzi, O. A., & Maldaon, I. S. (2015). A pilot study: Vital methodological issues.
Business: Theory & Practice, 16(1), 53-62. doi:10.3846/btp.2015.437
Herzburg, F. (1987). One more time: How do you motivate employees? Harvard
Business Review, Sept-Oct, 5-16. Retrieved from hbr.org
Herzberg, F., Mausner, B., & Snyderman, B. B. (2010). The motivation to work. New
Brunswick, NJ: Transaction.
Hill, C. E., & Williams, E. N. (2012). The sample. In C. E. Hill (Ed.), Consensual
qualitative research: A practical resource for investigating social science
phenomena (pp. 71-81). Washington, DC: American Psychological Association.
Holmberg, C., Sobis, I., & Carlström, E. (2016). Job satisfaction among Swedish mental
110
health nursing staff: A cross-sectional survey. International Journal of Public
Administration, 39(6), 429-436. doi: 10.1080/01900692.2015.1018432
Hubbard, E. M., Jervis, S. M., & Drake, M. A. (2016). The effect of extrinsic attributes
on liking of cottage cheese. Journal Of Dairy Science, 99(1), 183-193.
doi:10.3168/jds.2015-9547
Hunter, E. M., & Wu, C. (2016). Give me a better break: Choosing workday break
activities to maximize resource recovery. Journal Of Applied Psychology, 101(2),
302-311. doi:10.1037/apl0000045
Hur, Y., & Adler, H. (2011). Employees' Perceptions of Restaurant Brand Image. Journal
of Foodservice Business Research, 14(4), 334-359.
doi:10.1080/15378020.2011.624053
Hurtado, D. A., ScD., Nelson, C. C., ScD., Hashimoto, D., M.D., & Sorensen, G., PhD.
(2015). Supervisors' support for nurses' meal breaks and mental health. Workplace
Health & Safety, 63(3), 107-115. doi:
http://dx.doi.org/10.1177/2165079915571354
Hyun, S., & Oh, H. (2011). Reexamination of Herzberg’s two-factor theory of motivation
in the Korean Army foodservice operations. Journal of Foodservice Business
Research, 14, 100-121. doi:10.1080/15378020.2011.574532
Iqbal, J., Yusaf, A., Munawar, R., & Naheed, S. (2012). Employee motivation in modern
organization: a review of 12 years. Interdisciplinary Journal of Contemporary
Research in Business, 4(3), 692. Retrieved from http://www.ijcrb.com/
Islam, S. u., & Ali, N. (2013). Motivation-Hygiene Theory: Applicability on Teachers.

111
Journal Of Managerial Sciences, 7(1), 87-104. Retrieved from
www.qurtuba.edu.pk/
Ismail, H., & El Nakkache, L. (2014). Extrinsic and intrinsic job factors: Motivation and
satisfaction in a developing Arab country: The case of Lebanon. Journal of
Applied Management and Entrepreneurship, 19(1), 66-82. Retrieved from
www.whitneypress.com/jame
Janus, K., & Browning, S. L., F.A.C.H.E. (2014). The effect of professional culture on
intrinsic motivation among physicians in an academic medical
Center/PRACTITIONER APPLICATION. Journal of Healthcare Management,
59(4), 287-303; discussion 303-4. Retrieved from https://www.ache.org/pubs/
Jin, N., Goh, B., Huffman, L., & Yuan, J. J. (2015). Predictors and outcomes of perceived
image of restaurant innovativeness in fine-dining restaurants. Journal Of
Hospitality Marketing & Management, 24(5), 457-485.
doi:10.1080/19368623.2014.915781
Jones, D. (2012). Does servant leadership lead to greater customer focus and employee
satisfaction? Business Studies Journal, 4(2), 21-35. Retrieved from
http://vlex.com/publisher/view/153502
Kapoulas, A., & Mitic, M. (2012). Understanding challenges of qualitative research:
Rhetorical issues and reality traps. Qualitative Market Research, 15(4), 354-368.
doi:10.1108/13522751211257051
Karyotakis, K. M., & Moustakis, V. S. (2016). Organizational factors, organizational
culture, job satisfaction and entrepreneurial orientation in public administration.

112
European Journal Of Applied Economics, 13(1), 47-59. doi:10.5937/ejae13-
10781
Kessler, L. L. (2014). The effect of job satisfaction on IT employees’ turnover intention
in Israel. Annals of the University of Oradea, Economic Science Series, 23(1),
1028-1038. Retrieved from http://anale.steconomiceuoradea.ro/en/
Kessler-Ladelski, L., & Catana, G. A. (2013). Causes affecting voluntary turnover in IT
sector. Review of some empirical studies, International conference on Marketing,
Marketing from information to decision (6th ed.). Cluj-Napoca, 08-09 Nov, 102-
113. Retrieved from http://www.ubbcluj.ro/en/
Koçyiğit, M. (2015). The Effect of Leadership Leadership on Organizational Culture
Culture. In Leadership and Organizational Outcomes (pp. 111-122). Springer
International Publishing.
Kontoghiorghes, C. (2016). Linking high performance organizational culture and talent
management: satisfaction/motivation and organizational commitment as
mediators. International Journal Of Human Resource Management, 27(16), 1833-
1853. doi:10.1080/09585192.2015.1075572
Koutroumanis, D. A., Alexakis, G., & Dastoor, B. R. (2015). The influence
organizational culture has on commitment in the restaurant industry. Small
Business Institute Journal, 11(2), 27-40. Retrieved from www.sbij.org
Krainz, K. D. (2015). Enhancing wellbeing of employees through corporate social
responsibility context. Megatrend Review, 12(2), 137-154.
doi:10.5937/megrev1502137d

113
Kyvik, S. (2013). The academic researcher role: Enhancing expectations and improved
performance. Higher Education, 65(4), 525-538. doi:10.1007/s10734-012-9561-0
Lau, S., Albright, L., & Collis, A. (2013). Rejecting candidates, paid meal breaks, global
talent. HRMagazine, 58(4), 23-24. Retrieved from www.shrm.org
Lavin, H. S., & DiMichele, E. E. (2016). When Are Meals Compensable under the Fair
Labors Standards Act?. Employee Relations Law Journal, 42(1), 101-105.
Retrieved from https://lrus.wolterskluwer.com/
Lester, D. (2013). Measuring Maslow’s hierarchy of needs. Psychological Reports,
113(1), 15-17. doi:10.2466/02.20.PR0.113x16z1
Ma, E., Qu, H., & Eliwa, R. A. (2014). Customer loyalty with fine dining: The
moderating role of gender. Journal Of Hospitality Marketing & Management,
23(5), 513-535. doi:10.1080/19368623.2013.835250
Machi, L. A. & McEvoy, B. T. (2012). The literature review: Six steps to success (2nd
ed.). Thousand Oaks, CA: Corwin.
Magnusson, E., & Marecek, J. (2015). Doing interview-based qualitative research.
United Kingdom: Cambridge University Press.
Mahmood, S., Attiq, S., & Azam, R. I. (2014). Motivational needs, core-self-evaluations
and their link with job satisfaction: evidence from telecom sector of Pakistan.
Pakistan Journal of Commerce & Social Sciences, 8(1), 149-169. Retrieved from
jespk.net
Malangwasira, T. E. (2013). Demographic differences between a leader and followers
tend to inhibit leader- follower exchange levels and job satisfaction. Journal of
114
Organizational Culture, Communications & Conflict, 17(2), 63-106. Retrieved
from http://www.alliedacademies.org/journals
Marshall, B., Cardon, P., Poddar, R., & Fontenot, R. (2013). Does sample size matter in
qualitative research? A review of qualitative interviews in IS research. The
Journal of Computer Information Systems, 54(1), 11-22. Retrieved from
http://iacis.org/jcis/jcis.php
Mayer, I. (2015). Qualitative research with a focus on qualitative data analysis.
International Journal Of Sales, Retailing & Marketing, 4(9), 53-67. Retrieved
from www.ijsrm.com.
Maxwell, J. A. (2013). Applied social research methods series: Vol. 41. Qualitative
research design: An interactive approach (3rd ed.). Thousand Oaks, CA: Sage.
McManus, J., & Mosca, J. (2015). Strategies to build trust and improve employee
engagement. International Journal of Management & Information Systems
(Online), 19(1), 37-n/a. Retrieved from
http://www.cluteinstitute.com/journals/international-journal-of-management-
information-systems-ijmis/
Miles, M. B., Huberman, A. M., Saldana, J. (2014). Qualitative data analysis: A method
sourcebook (3rd ed.). Thousand Oaks, CA: Sage.
Moldovan, O., & Macarie, F. C. (2014). How to change the informal side? A comparative
analysis of organizational culture transformation models. Managerial Challenges
Of The Contemporary Society, 7(2), 40-45. Retrieve from
http://econ.ubbcluj.ro/jmccs

115
Morse, J. M. (2015). Critical analysis of strategies for determining rigor in qualitative
inquiry. Qualitative Health Research, 25(9) 1212-1222. doi:
10.1177/1049732315588501.
Muhammad, N. (2012). Treading conventional divides: the case for an alternative
paradigmatic influence. IBA Business Review, 7(2), 72-83. Retrieved from
www.iba.edu.pk
Murphy, K. S., DiPietro, R. B., Rivera, M., & Muller, C. C. (2009). An exploratory case
study of factors that effect the turnover intentions and job satisfaction of multi-
unit managers in the casual theme segment of the U.S. restaurant industry.
Journal of Foodservice Business Research, 12(3), 200-218.
doi:10.1080/15378020903158483
National Restaurant Association. (2015). Employing America: Industry effect. Retrieved
from http://www.restaurant.org/Industry-Effect
Nguyen, M. (2014). How to make any job sizzle. Canadian Business, 87(14), 64-71.
Retrieved from http://www.canadianbusiness.com/
Oliveira, M., Bitencourt, C., Teixeira, E., & Santos, A. C. (2013). Thematic content
analysis: Is there a difference between the support provided by the MAXQDA®
and NVivo® software packages? Paper presented at the 304-XII. Retrieved from
http://academic-conferences.org/ecrm/ecrm2013/ecrm13-home.htm
Onyema, E. O. (2014). Assessing the relationship between human resource management
and employee job satisfaction: A case study of a food and beverage company.
Journal of Business Administration Research, 3(1), 71-n/a. Retrieved from

116
www.sciedu.ca/jbar
Othman, M., Gouw, G. J., & Bhuiyan, N. (2012). Workforce scheduling: A new model
incorporating human factors. Journal of Industrial Engineering and Management,
5(2), 259. doi:10.3926/jiem.451
Padmaja, K. V., Bhar, S., & Gangwar, S. (2013). Work experience, motivation and
satisfaction: Do they go together? Journal of Institute of Public Enterprise,
36(3/4), 49-83. Retrieved from http://www.ipeindia.org/main1/
Pane Haden, S., & Cooke, J. (2012). Is morale irrelevant? MIT Sloan Management
Review, 53(2), 96. Retrieved from http://sloanreview.mit.edu/
Park, J., Lee, K., & Kim, P. S. (2016). Participative Management and Perceived
Organizational Performance: The Moderating Effects of Innovative
Organizational Culture. Public Performance & Management Review, 39(2), 316-
336. doi:10.1080/15309576.2015.1108773
Park, J., & Park, M. (2016). Qualitative versus quantitative research methods: Discovery
or justification?. Journal Of Marketing Thought, 3(1), 1-7.
doi:10.15577/jmt.2016.03.01.1
Parylo, O. (2012). Qualitative, quantitative, or mixed methods: An analysis of research
design in articles on principal professional development. International Journal of
Multiple Research in Education 6(3), 297-313. doi:10.5172/mra.2012.6.3.297
Parzinger, M. J., Lemons, M. A., & McDaniel, K. (2012). The effect of organizational
context on turnover and job satisfaction: A multi-analysis study of bank
employees. International Journal of the Academic Business World, 6(1), 39-50.

117
Retrieved from www.jwpress.com
Patnaik, M., & Kar, A. K. (2014). Employee satisfaction and HR practices in the private
technical institutions of Odisha: An empirical study in Bhubaneswar.
International Journal of Organizational Behaviour & Management Perspectives,
3(2), 918-923. Retrieved from http://pezzottaitejournals.net/pezzottaite/
Patton, M. Q. (2015). Qualitative research and evaluation methods (4rd ed.). Thousand
Oaks, CA: Sage.
Pepe, M. (2010). The effect of extrinsic motivational dissatisfies on employee level of job
satisfaction and commitment resulting in the intent to turnover. Journal of
Business and Economics Research, 8(9), 99-107. Retrieved from
www.cluteinstitute.com/ojs/
Quinn, T., & Leligdon, L. (2014). Executive MBA Students’ Information Skills and
Knowledge: Discovering the Difference Between Work and Academics. Journal
Of Business & Finance Librarianship, 19(3), 234-255.
doi:10.1080/08963568.2014.916540
Raab, C., Zemke, D. V., Hertzman, J. L., & Singh, D. (2013). Restaurant customers’
perceptions of noise and their satisfaction and loyalty behaviors. International
Journal Of Hospitality & Tourism Administration, 14(4), 398-414.
doi:10.1080/15256480.2013.838090
Raina, R., & Roebuck, D. B. (2014). Exploring cultural influence on managerial
communication in relationship to job satisfaction, organizational commitment,
and the employees’ propensity to leave in the insurance sector of India.

118
International Journal of Business Communication, 53(1), 97–130, doi:
10.1177/2329488414525453
Raus, A. (2014). Rewards, punishment, intrinsic factors, and human needs within a
M.A.I. educational institution. Managerial Challenges of the Contemporary
Society, 7(2), 80-87. Retrieved from risoprint.ro
Rawat, B., Khugshal, R., & Chaubey, D. S. (2015). Employee attitude towards
motivational practices: an empirical study. Global Management Review, 9(2), 14-
28. Retrieved from www.sonamgmt.org
Rizwan, M., & Mukhtar, A. (2014). Preceding to employee satisfaction and turnover
intention. International Journal of Human Resource Studies, 4(3), 87.
doi:10.5296/ijhrs.v4i3.5876
Robison, J. (2012). Little satisfaction. Las Vegas Business Press, 29(34), 6. Retrieved
from www.businesspress.vegas
Robinson, J. (2014). The refueling principle. Entrepreneur, 42(10), 66-70. Retrieved
from www.entrepreneur.com
Rossiter, J. R. (2008). Qualitative research rules. International Journal of Advertising,
27(5), 915-919. Retrieved from www.ama.org
Ruiz-Palomino, P., Sáez-Martínez, F., & Martínez-Cañas, R. (2013). Understanding pay
satisfaction: Effects of supervisor ethical leadership on job motivating potential
influence. Journal of Business Ethics, 118(1), 31-43. doi:10.1007/s10551-012-
1549-2
Saldana, J. (2016). The coding manual for qualitative researchers (3rd ed.). Thousand

119
Oaks, CA: Sage Publications
Sarma, S. K. (2015). Qualitative research: Examining the misconceptions. South Asian
Journal of Management, 22(3), 176-191. Retrieved from www.sajm-amdisa.org
Scharrer, B. (2015). Employees` Acceptance and Involvement in accordance with Codes
of Conduct – Chinese Business Behaviour vs. Western Compliance
Management Systems. ScienceDirect, 213, 855-859.
doi:10.1016/j.sbspro.2015.11.495
Scheers, L. V., & Botha, J. (2014). Analysing relationship between employee job
satisfaction and motivation. Journal of Business & Retail Management Research,
9(1), 98-109. Retrieved from www.jbrmr.com
Schreurs, B., Guenter, H., Schumacher, D., Van Emmerik, I. H., & Notelaers, G. (2013).
Pay-level satisfaction and employee outcomes: The moderating effect of
employee-involvement climate. Human Resource Management, 52(3), 399-421.
doi:10.1002/hrm.21533
Schwandt, T. A. (2015). The sage dictionary of qualitative inquiry (4rd ed.). Thousand
Oaks, CA: Sage.
Segal, J. A. (2013). Give me a break. HRMagazine, 58(12), 58-60. Retrieved from
www.shrm.org
Shin, Y. J. & Kelly, K. R. (2013), Cross-cultural comparison of the effects of optimism,
intrinsic motivation, and family relations on vocational identity. The Career
Development Quarterly, 61(2) 141-160. doi:10.1002/j.2161-0045.2013.00043.x
Singh, L. B., & Dutch, M. A. (2014). Changing socio-cultural environment and human

120
resource practices. Amity Global Business Review, 99-14. Retrieved from
www.amity.edu
Simon, M. K. (2011). Dissertation and scholarly research: Recipes for success. Seattle,
WA: Dissertation Success.
Sinha, K., & Trivedi, S. (2014) Employee engagement with special reference to Herzberg
two factor and LMX theories: A study of I.T. sector. SIES Journal of
Management, 10(1), 22-35. Retrieved from
siesoms.edu/journals/siescoms_journal.html
Sinkovics, R. R., & Alfoldi, E. A. (2012). Progressive focusing and trustworthiness in
qualitative research. Management International Review, 52(6), 817-845.
doi:10.1007/s11575-012-0140-5
Slack, R., Corlett, S., & Morris, R. (2015). Exploring employee engagement with
(corporate) social responsibility: A social exchange perspective on organisational
participation. Journal of Business Ethics, 127(3), 537-548. doi:10.1007/s10551-
014-2057-3
Smith, J. (2013). 16 things you should do on your lunch break every day. Retrieved from
www.forbes.com
Smith, D. B., & Shields, J. (2013). Factors related to social service workers' job
satisfaction: Revisiting Herzberg's motivation to work. Administration in Social
Work, 37(2), 189-198. doi:10.1080/03643107.2012.673217
Soltis, S. M., Agneessens, F., Sasovova, Z., & Labianca, G. (2013). A social network
perspective on turnover intentions: The role of distributive justice and social

121
support. Human Resource Management, 52(4), 561-584. doi:10.1002/hrm.21542
Sommers-Flanagan, R., & Sommers-Flanagan, J. (2015). Becoming an Ethical Helping
Professional, with Video Resource Center: Cultural and Philosophical
Foundations. John Wiley & Sons.
Stankovic, I. (2013). Organizational behavior of employees in the manufacturing
environment: an engineering perspective. International Journal of Organizational
Innovation (Online), 6(2), 49-53. Retrieved from http://www.ijoi-online.org
Stipp, K. F., & Kapp, S. A. (2012). Building organizational knowledge and value:
Informed decision making in Kansas children's community-based mental health
services. Community Mental Health Journal, 48(1), 1-11.
doi:http://dx.doi.org/10.1007/s10597-010-9334-0
Street, C. T., & Ward, K. W. (2012). Improving validity and reliability in longitudinal
case study timelines. European Journal of Information Systems, 21(2), 160-175.
doi:10.1057/ejis.2011.53
Subramanyam, M., Muralidhara, P., & Pooja, M. (2013). Mental workload and cognitive
fatigue: A study. IUP Journal of Management Research, 12(2), 29-39. Retrieved
from www.iupindia.in
Suchyta, L. A. (2014). Employer liability for untimely meal and rest breaks. HR Focus,
91(1), S-1-S-4. Retrieved from www.bna.com
Sung Doo, K., Bologna, D., Furst-Holloway, S. Hollensbe, E., Masterson, S., & Sprinkle,
T. (2014). Taking a break via technology? Triggers, nature, and effects of
“online” work breaks. Academy of Management Annual Meeting Proceedings,

122
459-464. doi:10.5465/AMBPP.2014.9
Suri, H. (2011). Purposeful sampling in qualitative research synthesis. Qualitative
Research Journal, 11(2). 63-75. doi:10.3316/QRJ1102063.
Swartout, S., Boykin, S., Dixon, M., & Ivanov, S., PhD. (2015). LOW MORALE IN
ORGANIZATIONS: A SYMPTOM OF DEADLY MANAGEMENT
DISEASES? International Journal of Organizational Innovation (Online), 8(1),
17-23. Retrieved from http://ijoi-online.org
Teck-Hong, T., & Waheed, A. (2011). Herzberg’s motivational-hygiene theory and job
satisfaction in the Malaysian retail sector: zyhe mediating effect of love of money.
Asian Academy of Management Journal, 16(1), 73-94. Retrieved from
http://aom.org/amj/
Thomson, W. D. (2013). Employee engagement in corporate social responsibility
strategies and organization vision alignment: A phenomenological case study
(Doctoral dissertation). Retrieved from Proquest database. (Order no. 3594723)
Tomkins, L., & Eatough, V. (2013). The feel of experience: phenomenological ideas for
organizational research. Qualitative Research in Organizations and Management:
An International Journal, 8(3) 258-275. doi:10.1108/QROM-04-2012-1060
Tremblay, M., Vandenberghe, C., & Doucet, O. (2013). Relationships between leader-
contingent and non-contingent reward and punishment behaviors and
subordinates' perceptions of justice and satisfaction, and evaluation of the
moderating influence of trust propensity, pay level, and role ambiguity. Journal of
Business & Psychology, 28(2), 233-249. doi:10.1007/s10869-012-9275-4

123
Trougakos, J. P., Beal, D. J., Green, S. G., & Weiss, H. M. (2008). Making the break
count: an episodic examination of recovery activities, emotional experiences, and
positive affective displays. Academy of Management Journal, 51(1), 131-146.
doi:10.5465/AMJ.2008.30764063
Trougakos, J. P., Hideg, I., Cheng, B. H., & Beal, D. J. (2014). Lunch breaks unpacked:
the role of autonomy as a moderator of recovery during lunch. Academy of
Management Journal, 57(2), 405-421. doi:10.5465/amj.2011.1072
Tucker, P. (2003). The effect of rest breaks upon accident risks, fatigue, and
performance: A review. Work & Stress 17(2), 123-137.
Tucker, P., Folkard, S, & Macdonald, I. (2003). Rest breaks and accident risks. The
Lancet, 361, 680. Retrieved from www.thelancet.com
United States Department of Labor. (2016) Work hours; break and meal periods.
Retrieved from www.dol.gov
Urosevic, S., & Milijic, N. (2012). Influence of demographic factors on employee
satisfaction and motivation. Organizacija, 45(4), 174. doi:10.2478/v10051-012-
0019-z
U.S. Equal Employment Opportunity Commission. (2016). Laws enforced by EEOC.
Retrieved from www.eeoc.gov
Vagle, M. D. (2014). Crafting phenomenological research. Walnut Creek, CA: Left
Coast Press.
Van Manen, M. (2014). Phenomenology of practice. Walnut Creek, CA: Left Coast
Press.

124
Ventura,W. J., II. (2006). The personal values communicated by Truett Cathy and their
effect on the culture of Chick-fil-A: A qualitative case study (Doctoral
dissertation). Retrieved from Proquest database. (Order no. 3209219).
Vizzuso, J. (2015). Leadership strategies to influence employee engagement in health
care (Doctoral dissertation). Retrieved from Proquest database. (Order no.
3689281)
Vozar, R. (2013). Employee morale. Smart Business Cleveland, 25(1), 66. Retrieved
from http://www.sbnonline.com/market/cleveland-editions/
Wang, T., & Lien, Y. B. (2013). The power of using video data. Quality and Quantity,
47(5), 2933-2941. doi:10.1007/s11135-012-9717-0
Weidenfeld, M. C. (2011). Comportment, not cognition: Contributions to a
phenomenology of judgment. Contemporary Political Theory, 10(2), 232-254.
doi:10.1057/cpt.2010.20
Welch, M. (2014). Exploring the effect of communication technologies on business air
travel. Journal of Organizational Culture, Communication and Conflict, 18(1),
187-213. Retrieved from http://www.alliedacademies.org
Weyant, L. E. (2009). The role of job satisfaction within the full-service casual restaurant
industry. Journal of Business, Society & Government, 1(2), 79-89. Retrieved from
bsgconsortium.org
Wilkinson, J., & Bell, J. (2015). The contribution of fatigue and shift-work to the
Buncefield explosion. Loss Prevention Bulletin, (243), 4-8. Retrieved from
www.icheme.org/lpb

125
Williams, E. N. & Hill, C. E. (2012). Establishing trustworthiness in consensual
qualitative research studies. In C. E. Hill (Ed.), Consensual qualitative research:
A practical resource for investigating social science phenomena (pp. 175-185).
Washington, DC: American Psychological Association.
Wilson, N. A. (2015). Factors that affect job satisfaction and intention to leave of allied
health professionals in a metropolitan hospital. Australian Health Review, 39(3),
290-294. doi: 10.1071/AH14198.
Žemgulienė, J. (2012). Relationship between job satisfaction and employee behavioral
intention toward work performance: mediation effect of communication content.
Management of Organizations: Systematic Research, (63), 139-157.
doi:10.7720/MOSR.1392-1142.2012.63.10

126
Appendix A: Interview Questions
1.) How many years of experience do you have in the restaurant industry?
2.) How many different serving positions have you held? Please describe them to
me.
3.) How would you describe your typical day working?
4.) What kind of breaks do you get during your shift? When? How long are they?
5.) Do you feel satisfied with your employer/work?
6.) Do you feel your morale at work is good or bad?
7.) What could your employer do to increase your satisfaction?
8.) What could your employer do to increase your morale?
9.) When you get breaks during your shift, does it help your morale?
10.) When you get breaks during your shift, does it help your satisfaction
improve?