woody biomass on wisconsin forestland · all live tree biomass by forest type group and tree class,...
TRANSCRIPT

Woody Biomass onWoody Biomass onWisconsin ForestlandWisconsin Forestland
Vern EversonWisconsin DNR- Div. of Forestry

Forest Inventories
• First - 1936
• Second - 1956• Third - 1968
•• Fourth Fourth -- 19831983•• Fifth Fifth -- 19961996•• Sixth Sixth -- 20002000--0404

Timberland Acres, 1936Timberland Acres, 1936--19961996
-
2,000,000
4,000,000
6,000,000
8,000,000
10,000,000
12,000,000
14,000,000
16,000,000
18,000,000
1936 1956 1968 1983 1996
Year
Tim
berla
nd A
cres

All timberland ownership, 1996All timberland ownership, 1996National Forest
9%
Other Federal1%
State5%
County and Municipal15%
Tribal2%
Forest Industry7%
Private landowner61%

-
1,000,000
2,000,000
3,000,000
4,000,000
5,000,000
6,000,000
PineSpru
ce-Fir
Swamp co
nifers
Maple-
Bassw
oodAsp
en-B
irch
Oak-H
ickory
Soft map
le-Ash
Nonstock
ed
Acr
es
1936 1956 1968 1983 1996
Timberland by forest type group, 1936Timberland by forest type group, 1936--9696
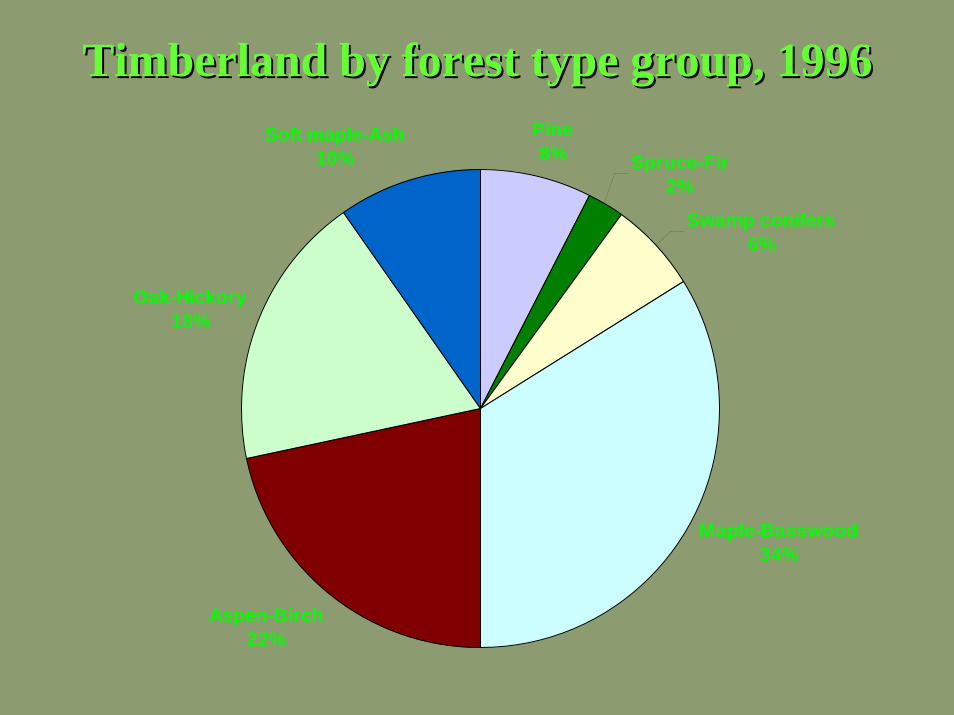
Timberland by forest type group, 1996Timberland by forest type group, 1996Pine8% Spruce-Fir
2%
Swamp conifers6%
Maple-Basswood34%
Aspen-Birch22%
Oak-Hickory18%
Soft maple-Ash10%
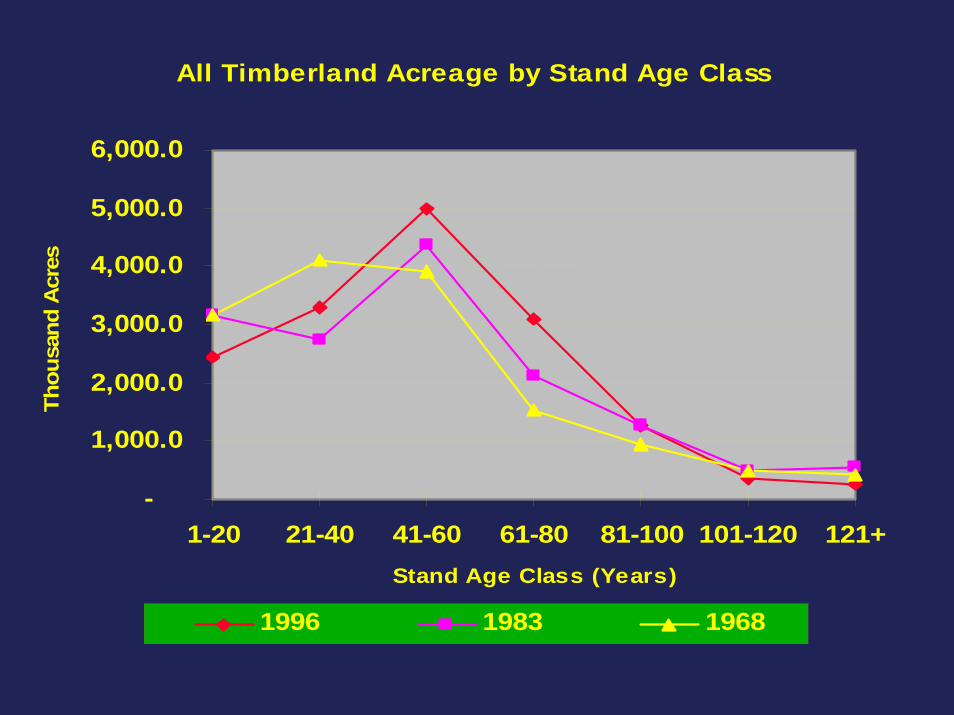
All Timberland Acreage by Stand Age Class
-
1,000.0
2,000.0
3,000.0
4,000.0
5,000.0
6,000.0
1-20 21-40 41-60 61-80 81-100 101-120 121+Stand Age Class (Years)
Thou
sand
Acr
es
1996 1983 1968

USDA Forest Service Survey Units
Southwest Unit
Northwest Unit Northeast Unit
Southeast Unit
Central Unit

Timberland by Forest Survey Unit, 1983-96
- 1,000,000 2,000,000 3,000,000 4,000,000 5,000,000 6,000,000
Northeast
Northwest
Central
Southwest
Southeast
ACRES
1983 1996

Total growing stock volume, 1936-1996
-
2,000
4,000
6,000
8,000
10,000
12,000
14,000
16,000
18,000
20,000
1936 1956 1968 1983 1996
Mill
ion
cubi
c fe
et
Hardwoods Conifers
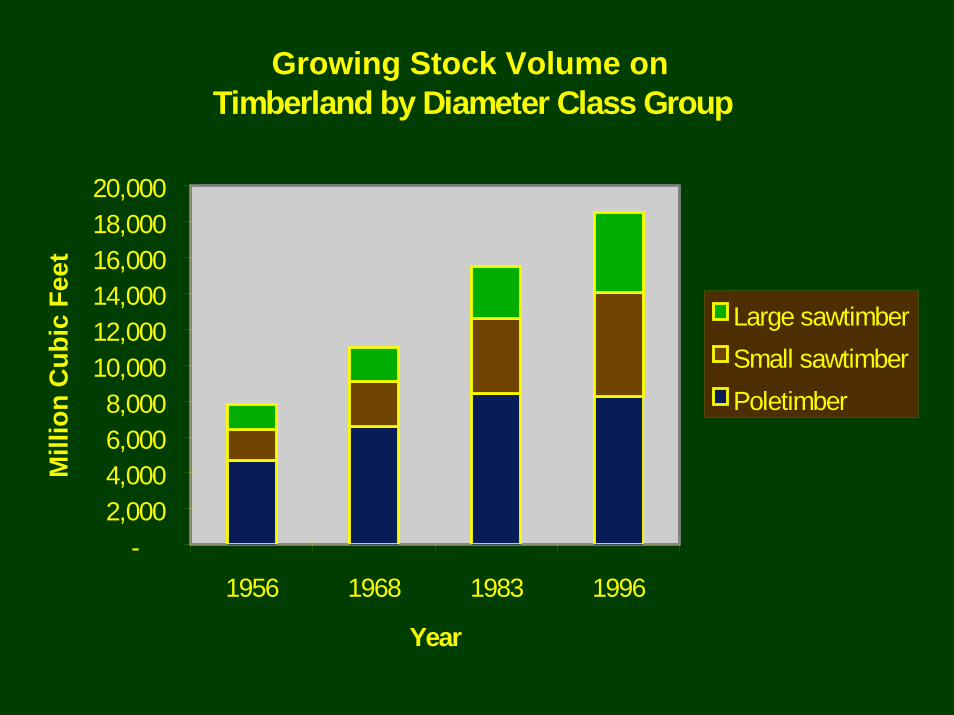
Net Volume of Growing Stock Volume on Timberland by Diameter Class Group
-2,0004,0006,0008,000
10,00012,00014,00016,00018,00020,000
1956 1968 1983 1996
Year
Mill
ion
Cub
ic F
eet
Large sawtimberSmall sawtimberPoletimber
Growing Stock Volume on
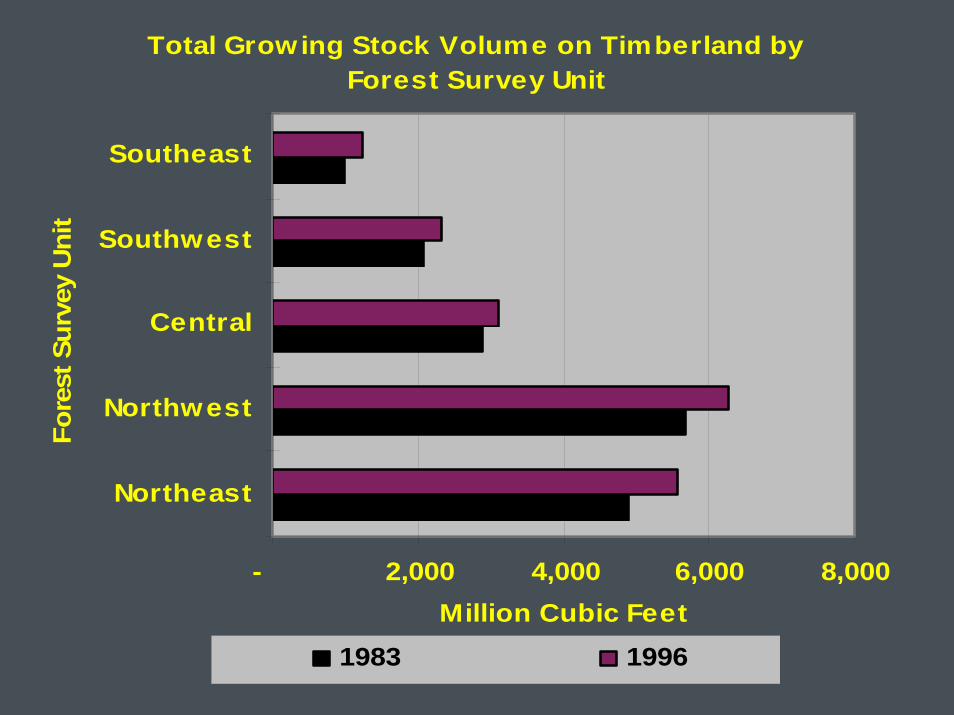
Total Growing Stock Volume on Timberland by Forest Survey Unit
- 2,000 4,000 6,000 8,000
Northeast
Northwest
Central
Southwest
Southeast
Fore
st S
urve
y U
nit
Million Cubic Feet1983 1996

Current Annual Growth and Removals of Growing Stock on Timberland
-100200300400500600
1956 1968 1983 1996
Year
Mill
ion
Cub
ic F
eet
GrowthRemovals

All Live Tree Biomass by Component, 1996All Live Tree Biomass by Component, 1996
- 100 200 300 400 500 600
1 to 5-inch trees
Stumps
Boles
Tops & Limbs
Stumps
Boles
Tops & Limbs
Gro
win
g St
ock
Cul
l
Million Green Tons

All Live Tree Biomass by Ownership, 1996All Live Tree Biomass by Ownership, 1996National Forest
10%
Other Federal1%
State5%
County and Municipal13%
Indian lands3%
Forest Industry7%
Private landowner61%

All Live Tree Biomass by Major Species GroupAll Live Tree Biomass by Major Species Group
-
200
400
600
800
1,000
1,200
Mill
ion
Gre
en T
ons
Noncommercial 12 9 Hardwoods 779 866 Conifers 170 183
1983 1996
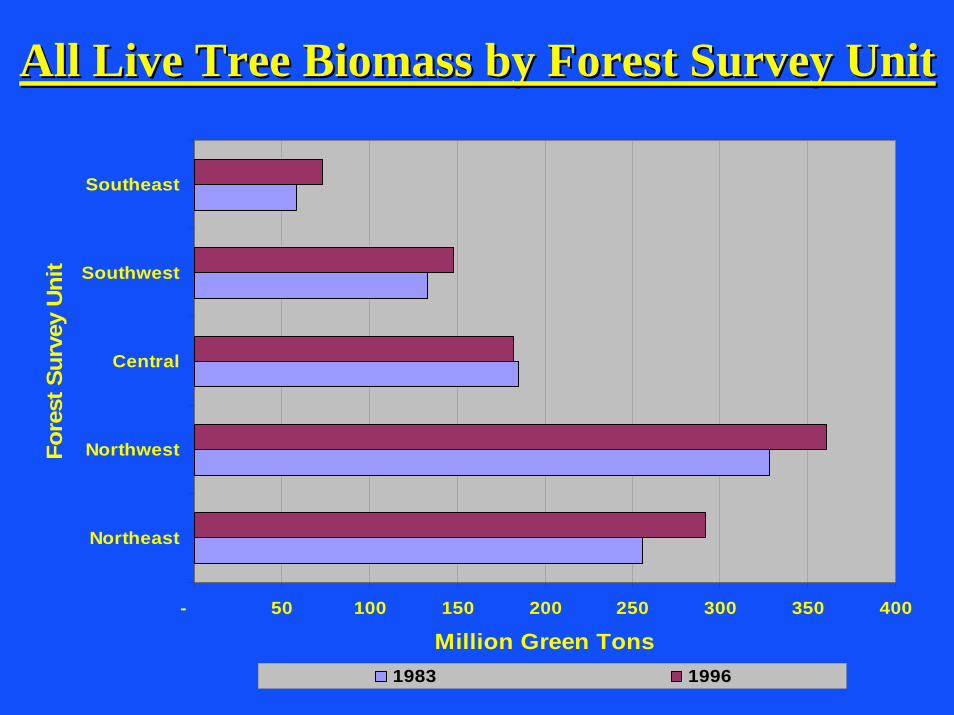
All Live Tree Biomass by Forest Survey UnitAll Live Tree Biomass by Forest Survey Unit
- 50 100 150 200 250 300 350 400
Northeast
Northwest
Central
Southwest
Southeast
Fore
st S
urve
y U
nit
Million Green Tons1983 1996

All Live Tree Biomass by Forest Type Group All Live Tree Biomass by Forest Type Group and Tree Class, 1996and Tree Class, 1996
-
50
100
150
200
250
300
350
400
450
500
Pine Spruce-fir Oak-hickory Soft Maple-Ash
Maple-basswood
Aspen-birch
Forest Type Group
Mill
ion
Gre
en T
ons
Growing stock Rough cull Rotten cull

Merchantable and All Live Tree Biomass by Forest Merchantable and All Live Tree Biomass by Forest Type Group, 1996Type Group, 1996
-
50
100
150
200
250
300
350
400
450
500
Pine Spruce-fir Oak-hickory Soft Maple-Ash
Maple-basswood
Aspen-birch
Forest Type Group
Mill
ion
Gre
en T
ons
Merchantible All Live

All Live Tree Biomass per Acre by Forest All Live Tree Biomass per Acre by Forest Type Group, 1996Type Group, 1996
58
49
43
64
44
73
46
-
10
20
30
40
50
60
70
80
All ForestTypes
Pine Spruce-Fir Oak-Hickory
Soft maple-Ash
Maple-Basswood
Aspen-Birch
Forest Type Group
Gre
en T
ons/
Acr
e
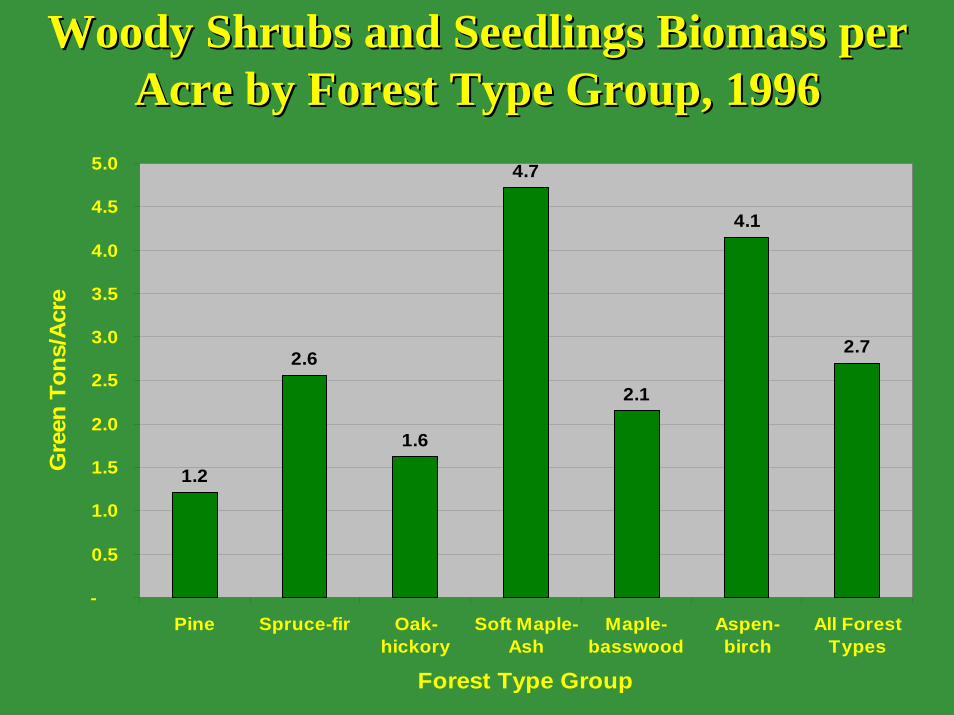
Woody Shrubs and Seedlings Biomass per Woody Shrubs and Seedlings Biomass per Acre by Forest Type Group, 1996Acre by Forest Type Group, 1996
1.2
2.6
1.6
4.7
2.1
4.1
2.7
-
0.5
1.0
1.5
2.0
2.5
3.0
3.5
4.0
4.5
5.0
Pine Spruce-fir Oak-hickory
Soft Maple-Ash
Maple-basswood
Aspen-birch
All ForestTypes
Forest Type Group
Gre
en T
ons/
Acr
e

Annual Wood Residue Production, 1990Annual Wood Residue Production, 1990
-
200
400
600
800
1,000
1,200
Northeast Northwest Central Southwest Southeast
Forest Survey Unit
Thou
sand
Ton
s
Wood-using mills Non-wood using mills

Summary• Private landowners own majority (61%)
of woody biomass.
• Over one billion tons of tree biomass.
• Live tree biomass greatest on Oak-hickory and Maple-basswood forest types
• Shrubs and Seedlings constitute less than 5% of total woody biomass.