woodiv, a database of occurrences, functional traits, and
TRANSCRIPT
HAL Id: hal-03180026https://hal-amu.archives-ouvertes.fr/hal-03180026
Submitted on 24 Mar 2021
HAL is a multi-disciplinary open accessarchive for the deposit and dissemination of sci-entific research documents, whether they are pub-lished or not. The documents may come fromteaching and research institutions in France orabroad, or from public or private research centers.
L’archive ouverte pluridisciplinaire HAL, estdestinée au dépôt et à la diffusion de documentsscientifiques de niveau recherche, publiés ou non,émanant des établissements d’enseignement et derecherche français ou étrangers, des laboratoirespublics ou privés.
Distributed under a Creative Commons Attribution| 4.0 International License
WOODIV, a database of occurrences, functional traits,and phylogenetic data for all Euro-Mediterranean trees
Anne-Christine Monnet, Kévin Cilleros, Frédéric Médail, Marwan CheikhAlbassatneh, Juan Arroyo, Gianluigi Bacchetta, Francesca Bagnoli, Zoltán
Barina, Manuel Cartereau, Nicolas Casajus, et al.
To cite this version:Anne-Christine Monnet, Kévin Cilleros, Frédéric Médail, Marwan Cheikh Albassatneh, Juan Ar-royo, et al.. WOODIV, a database of occurrences, functional traits, and phylogenetic data forall Euro-Mediterranean trees. Scientific Data , Nature Publishing Group, 2021, 8 (89), pp.1-11.�10.1038/s41597-021-00873-3�. �hal-03180026�
1Scientific Data | (2021) 8:89 | https://doi.org/10.1038/s41597-021-00873-3
www.nature.com/scientificdata
WOODIV, a database of occurrences, functional traits, and phylogenetic data for all Euro-Mediterranean treesanne-Christine Monnet 1,17 ✉, Kévin Cilleros 1,17, Frédéric Médail 1, Marwan Cheikh albassatneh2, Juan arroyo3, Gianluigi Bacchetta4, Francesca Bagnoli5, Zoltán Barina6, Manuel Cartereau1, Nicolas Casajus 7, Panayotis Dimopoulos8, Gianniantonio Domina9, aggeliki Doxa1,10, Marcial Escudero 3, Bruno Fady11, arndt Hampe12, Vlado Matevski13, Stephen Misfud14, toni Nikolic15, Daniel Pavon1, anne Roig11, Estefania Santos Barea3, Ilaria Spanu5, arne Strid16, Giovanni Giuseppe Vendramin5 & agathe Leriche 1,17 ✉
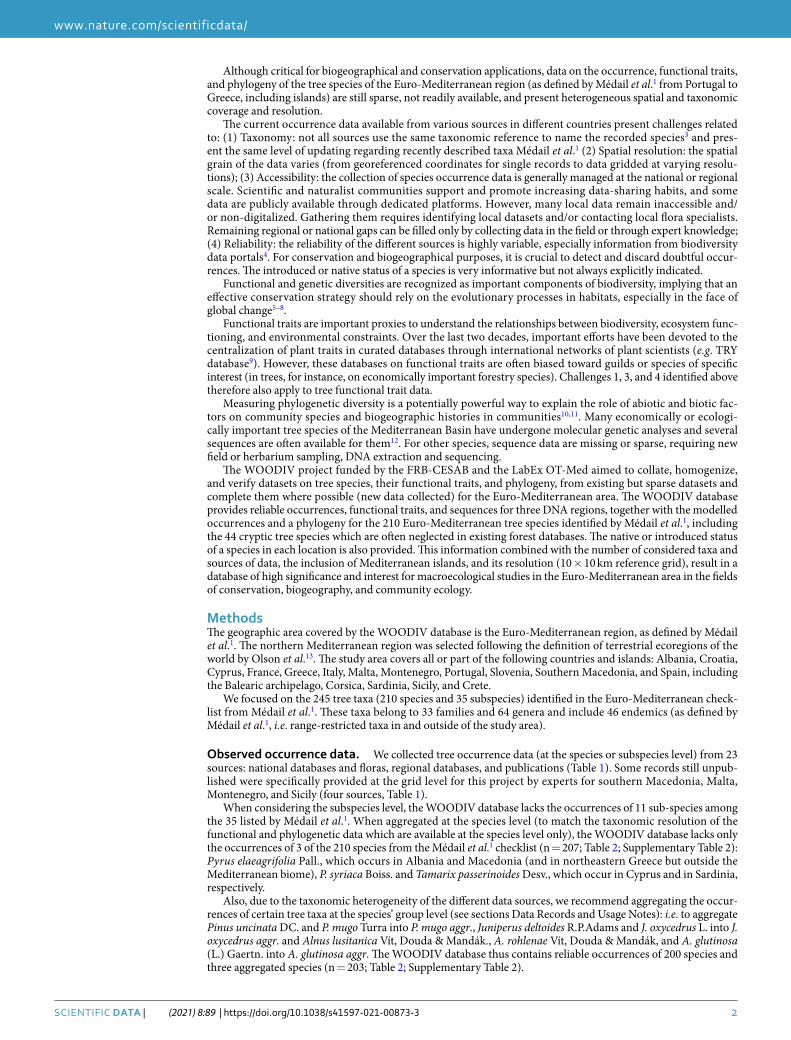
trees play a key role in the structure and function of many ecosystems worldwide. In the Mediterranean Basin, forests cover approximately 22% of the total land area hosting a large number of endemics (46 species). Despite its particularities and vulnerability, the biodiversity of Mediterranean trees is not well known at the taxonomic, spatial, functional, and genetic levels required for conservation applications. The WOODIV database fills this gap by providing reliable occurrences, four functional traits (plant height, seed mass, wood density, and specific leaf area), and sequences from three DNA-regions (rbcL, matK, and trnH-psbA), together with modelled occurrences and a phylogeny for all 210 Euro-Mediterranean tree species. We compiled, homogenized, and verified occurrence data from sparse datasets and collated them on an INSPIRE-compliant 10 × 10 km grid. We also gathered functional trait and genetic data, filling existing gaps where possible. The WOODIV database can benefit macroecological studies in the fields of conservation, biogeography, and community ecology.
Background & SummaryThe forests of the Euro-Mediterranean Basin are home to 245 indigenous tree taxa (species and subspecies), 44 of which are cryptic (as defined by Médail et al.1 i.e. trees commonly considered as bushes with poorly defined multi-colous stems but which can form true trees under certain environmental conditions), and a high number of endem-ics. The production of woody forest products represents 35% of the total economic value of Mediterranean forests2.
1Aix Marseille Univ, Avignon Univ, CNRS, IRD, IMBE. Technopôle de l’Arbois-Méditerranée, cedex 4, BP 80, 13 545, Aix-en-Provence, France. 2Institute of Ecology and Environmental Sciences, Sorbonne University, Paris, France. 3Department of Plant Biology and Ecology, University of Seville, Seville, Spain. 4Department of Life and environmental Sciences, University of Cagliari, Viale Sant’Ignazio da Laconi 13, Cagliari, Italy. 5national Research council, institute of Biosciences and Bioresources, 50019, Sesto Fiorentino, (FI), Italy. 6Department of Botany, Hungarian Natural History Museum, Pf. 137, Budapest, 1431, Hungary. 7FRB-CESAB, 5 rue de l’Ecole de Médecine, 34000, Montpellier, France. 8Department of Biology, Laboratory of Botany, University of Patras, 26504, Patras, Greece. 9Department of Agriculture, food and forest Sciences, University of Palermo, Viale delle Scienze bldg. 4, 90128, Palermo, Italy. 10Statistical Learning Lab, institute of Applied and Computational Mathematics, Foundation for Research and Technology-Hellas (FORTH), Ν. Plastira 100, Vassilika Vouton, GR - 700 13, Heraklion, Crete, Greece. 11INRAE, UR629, Ecologie des forêts méditerranéennes, Avignon, france. 12INRAE, Univ. Bordeaux, BIOGECO, F-33610, Cestas, France. 13Macedonian Academy of Sciences and Arts, Krste Misirkov 2, 1000, Skopje, Republic of Macedonia. 14EcoGozo, Regional Development Directorate - Ministry for Gozo, Flat 6, Sunset Court B, Triq Marsalforn, Xaghra, Gozo, Malta. 15Department of Botany, faculty of Science, University of Zagreb, Zagreb, croatia. 16Bakkevej 6, 5853, Ørbæk, Denmark. 17These authors contributed equally: Anne-Christine Monnet, Kévin Cilleros, Agathe Leriche. ✉e-mail: [email protected]; [email protected]
Data DESCRIPtOR
OPEN
2Scientific Data | (2021) 8:89 | https://doi.org/10.1038/s41597-021-00873-3
www.nature.com/scientificdatawww.nature.com/scientificdata/
Although critical for biogeographical and conservation applications, data on the occurrence, functional traits, and phylogeny of the tree species of the Euro-Mediterranean region (as defined by Médail et al.1 from Portugal to Greece, including islands) are still sparse, not readily available, and present heterogeneous spatial and taxonomic coverage and resolution.
The current occurrence data available from various sources in different countries present challenges related to: (1) Taxonomy: not all sources use the same taxonomic reference to name the recorded species3 and pres-ent the same level of updating regarding recently described taxa Médail et al.1 (2) Spatial resolution: the spatial grain of the data varies (from georeferenced coordinates for single records to data gridded at varying resolu-tions); (3) Accessibility: the collection of species occurrence data is generally managed at the national or regional scale. Scientific and naturalist communities support and promote increasing data-sharing habits, and some data are publicly available through dedicated platforms. However, many local data remain inaccessible and/or non-digitalized. Gathering them requires identifying local datasets and/or contacting local flora specialists. Remaining regional or national gaps can be filled only by collecting data in the field or through expert knowledge; (4) Reliability: the reliability of the different sources is highly variable, especially information from biodiversity data portals4. For conservation and biogeographical purposes, it is crucial to detect and discard doubtful occur-rences. The introduced or native status of a species is very informative but not always explicitly indicated.
Functional and genetic diversities are recognized as important components of biodiversity, implying that an effective conservation strategy should rely on the evolutionary processes in habitats, especially in the face of global change5–8.
Functional traits are important proxies to understand the relationships between biodiversity, ecosystem func-tioning, and environmental constraints. Over the last two decades, important efforts have been devoted to the centralization of plant traits in curated databases through international networks of plant scientists (e.g. TRY database9). However, these databases on functional traits are often biased toward guilds or species of specific interest (in trees, for instance, on economically important forestry species). Challenges 1, 3, and 4 identified above therefore also apply to tree functional trait data.
Measuring phylogenetic diversity is a potentially powerful way to explain the role of abiotic and biotic fac-tors on community species and biogeographic histories in communities10,11. Many economically or ecologi-cally important tree species of the Mediterranean Basin have undergone molecular genetic analyses and several sequences are often available for them12. For other species, sequence data are missing or sparse, requiring new field or herbarium sampling, DNA extraction and sequencing.
The WOODIV project funded by the FRB-CESAB and the LabEx OT-Med aimed to collate, homogenize, and verify datasets on tree species, their functional traits, and phylogeny, from existing but sparse datasets and complete them where possible (new data collected) for the Euro-Mediterranean area. The WOODIV database provides reliable occurrences, functional traits, and sequences for three DNA regions, together with the modelled occurrences and a phylogeny for the 210 Euro-Mediterranean tree species identified by Médail et al.1, including the 44 cryptic tree species which are often neglected in existing forest databases. The native or introduced status of a species in each location is also provided. This information combined with the number of considered taxa and sources of data, the inclusion of Mediterranean islands, and its resolution (10 × 10 km reference grid), result in a database of high significance and interest for macroecological studies in the Euro-Mediterranean area in the fields of conservation, biogeography, and community ecology.
MethodsThe geographic area covered by the WOODIV database is the Euro-Mediterranean region, as defined by Médail et al.1. The northern Mediterranean region was selected following the definition of terrestrial ecoregions of the world by Olson et al.13. The study area covers all or part of the following countries and islands: Albania, Croatia, Cyprus, France, Greece, Italy, Malta, Montenegro, Portugal, Slovenia, Southern Macedonia, and Spain, including the Balearic archipelago, Corsica, Sardinia, Sicily, and Crete.
We focused on the 245 tree taxa (210 species and 35 subspecies) identified in the Euro-Mediterranean check-list from Médail et al.1. These taxa belong to 33 families and 64 genera and include 46 endemics (as defined by Médail et al.1, i.e. range-restricted taxa in and outside of the study area).
Observed occurrence data. We collected tree occurrence data (at the species or subspecies level) from 23 sources: national databases and floras, regional databases, and publications (Table 1). Some records still unpub-lished were specifically provided at the grid level for this project by experts for southern Macedonia, Malta, Montenegro, and Sicily (four sources, Table 1).
When considering the subspecies level, the WOODIV database lacks the occurrences of 11 sub-species among the 35 listed by Médail et al.1. When aggregated at the species level (to match the taxonomic resolution of the functional and phylogenetic data which are available at the species level only), the WOODIV database lacks only the occurrences of 3 of the 210 species from the Médail et al.1 checklist (n = 207; Table 2; Supplementary Table 2): Pyrus elaeagrifolia Pall., which occurs in Albania and Macedonia (and in northeastern Greece but outside the Mediterranean biome), P. syriaca Boiss. and Tamarix passerinoides Desv., which occur in Cyprus and in Sardinia, respectively.
Also, due to the taxonomic heterogeneity of the different data sources, we recommend aggregating the occur-rences of certain tree taxa at the species’ group level (see sections Data Records and Usage Notes): i.e. to aggregate Pinus uncinata DC. and P. mugo Turra into P. mugo aggr., Juniperus deltoides R.P.Adams and J. oxycedrus L. into J. oxycedrus aggr. and Alnus lusitanica Vít, Douda & Mandák., A. rohlenae Vít, Douda & Mandák, and A. glutinosa (L.) Gaertn. into A. glutinosa aggr. The WOODIV database thus contains reliable occurrences of 200 species and three aggregated species (n = 203; Table 2; Supplementary Table 2).
3Scientific Data | (2021) 8:89 | https://doi.org/10.1038/s41597-021-00873-3
www.nature.com/scientificdatawww.nature.com/scientificdata/
The raw dataset obtained from gathering occurrences from all sources included a total of 1,248,701 occurrence records distributed across the participating countries.
The raw occurrence data were aggregated at a resolution of 10 × 10 km in line with an INSPIRE14 compliant 10 × 10 km grid (SCR 4258). This gridding procedure provided a way to standardize data from different sources. We selected this spatial grain because it was the finest resolution available for some countries of the study area (e.g. Slovenia, Croatia, Greece). Sources of occurrence data with a resolution coarser than 10 × 10 km (e.g. Atlas Florae Europaeae15) were not considered. The considered area includes 10,042 grid cells with at least one occur-rence record (Fig. 1a). The occurrence dataset provided by the WOODIV database, i.e. aggregated records for
Ref Source name Type of data Countries Nb taxa Nb rec Nb cells % taxa % rec % cells
1 Distribution atlas of vascular plants in Albania atlas Albania 103 5032 291 50.74 0.4 2.9
2 Flora Croatica Database records Croatia 117 41154 294 57.64 3.3 2.93
3 ined. records Cyprus 6 677 27 2.96 0.05 0.27
4 EUFGIS Genetic Conservation Units records Europe 23 195 148 11.33 0.02 1.47
5 GBIF records Cyprus 22 95 33 10.84 0.01 0.33
6 Conservatoire botanique national alpin (CBNA) records France 94 57369 163 46.31 4.59 1.62
7 Conservatoire botanique national de Corse (CBNC) records France, Corsica 80 24462 120 39.41 1.96 1.19
8 Conservatoire botanique national du Massif Central (CBNMC) records France 87 39612 53 42.86 3.17 0.53
9 IGN Inventaire Forestier records France, Corsica 102 68327 749 50.25 5.47 7.46
10 Conservatoire botanique national méditerranéen de Porquerolles (CBNMed) records France 111 345623 638 54.68 27.68 6.35
11 Flora Hellenica Database atlas Greece, Crete 139 34900 1618 68.47 2.79 16.11
12 GBIF records Portugal, Spain, Balearic Islands 106 554515 4993 52.22 44.41 49.72
13 Tentamen Florae Aeolicae records Eolian islands 46 246 21 22.66 0.02 0.21
14 CNR data records Italy 5 203 182 2.46 0.02 1.81
15 EU-Forest atlas Italy 79 12333 1362 38.92 0.99 13.56
16 INFC 2015 records Italy 71 12332 1369 34.98 0.99 13.63
17 VegItaly records Italy 93 27421 681 45.81 2.2 6.78
18 WikiPlantBase # Liguria, # Toscana, # Sardegna, # Sicily records Italy 120 13303 506 59.11 1.07 5.04
19 ined. gridded records Macedonia 99 3461 88 48.77 0.28 0.88
20 ined. gridded records Malta 39 156 7 19.21 0.01 0.07
21 ined. gridded records Montenegro 69 731 25 33.99 0.06 0.25
22 ined. gridded records Sicily 95 4203 345 46.8 0.34 3.44
23 Atlas of Flora of Slovenia atlas Slovenia 87 2351 33 42.86 0.19 0.33
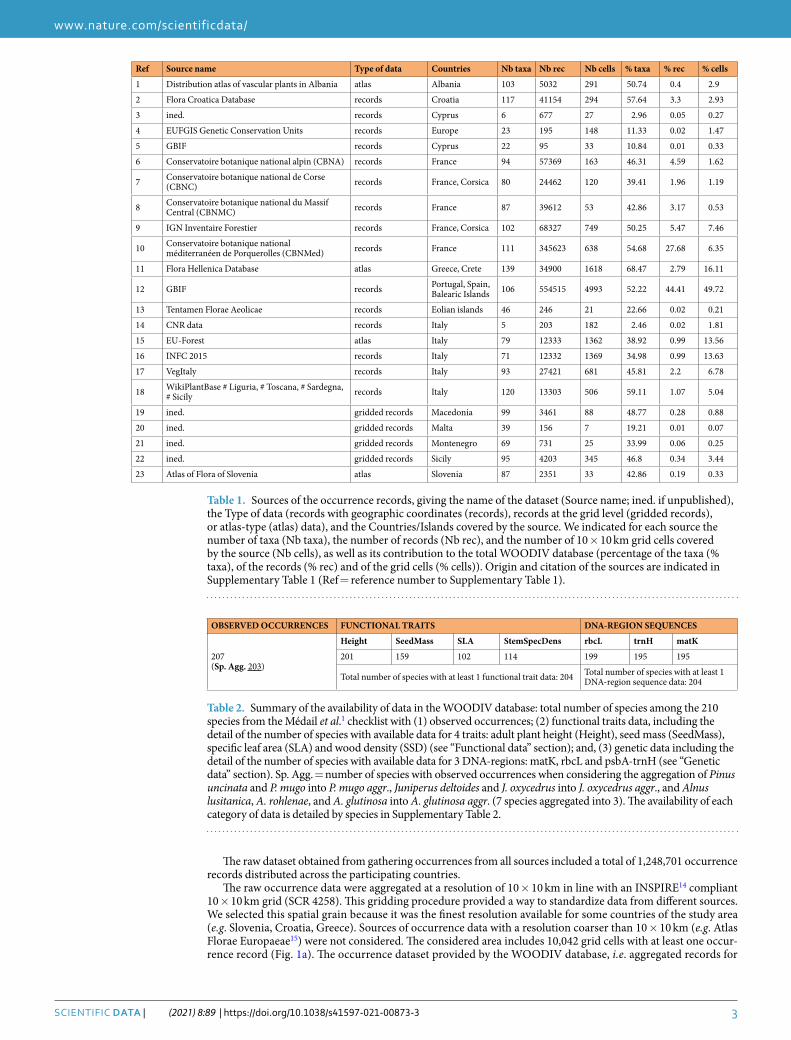
Table 1. Sources of the occurrence records, giving the name of the dataset (Source name; ined. if unpublished), the Type of data (records with geographic coordinates (records), records at the grid level (gridded records), or atlas-type (atlas) data), and the Countries/Islands covered by the source. We indicated for each source the number of taxa (Nb taxa), the number of records (Nb rec), and the number of 10 × 10 km grid cells covered by the source (Nb cells), as well as its contribution to the total WOODIV database (percentage of the taxa (% taxa), of the records (% rec) and of the grid cells (% cells)). Origin and citation of the sources are indicated in Supplementary Table 1 (Ref = reference number to Supplementary Table 1).
OBSERVED OCCURRENCES FUNCTIONAL TRAITS DNA-REGION SEQUENCES
207(Sp. Agg. 203)
Height SeedMass SLA StemSpecDens rbcL trnH matK
201 159 102 114 199 195 195
Total number of species with at least 1 functional trait data: 204 Total number of species with at least 1 DNA-region sequence data: 204
Table 2. Summary of the availability of data in the WOODIV database: total number of species among the 210 species from the Médail et al.1 checklist with (1) observed occurrences; (2) functional traits data, including the detail of the number of species with available data for 4 traits: adult plant height (Height), seed mass (SeedMass), specific leaf area (SLA) and wood density (SSD) (see “Functional data” section); and, (3) genetic data including the detail of the number of species with available data for 3 DNA-regions: matK, rbcL and psbA-trnH (see “Genetic data” section). Sp. Agg. = number of species with observed occurrences when considering the aggregation of Pinus uncinata and P. mugo into P. mugo aggr., Juniperus deltoides and J. oxycedrus into J. oxycedrus aggr., and Alnus lusitanica, A. rohlenae, and A. glutinosa into A. glutinosa aggr. (7 species aggregated into 3). The availability of each category of data is detailed by species in Supplementary Table 2.
4Scientific Data | (2021) 8:89 | https://doi.org/10.1038/s41597-021-00873-3
www.nature.com/scientificdatawww.nature.com/scientificdata/
species considered as native in the given grid cell using the 10 × 10 km grid (removal of duplicate species within a grid cell) includes 140,279 occurrences.
Modelled occurrence data. The WOODIV database provides modelled occurrences of the species from the Médail et al.1 checklist. From the 10 × 10 km gridded observed occurrence data, we modelled the distribution of each species across the Euro-Mediterranean area using Species Distribution Models (SDM). SDM statistically relate species occurrence records to environmental variables to predict the potential distribution of species16.
Due to the extent of the study area, we only related species occurrence to climate gradients17. Bioclimatic variables were extracted from the CHELSA database V1.218 available at a resolution of 30 arc‐sec (http://chelsa‐climate.org/) and then averaged to a 10 × 10 km resolution. The selection of the environmental predictors for niche modeling is a source of uncertainty in model predictions that can be reduced with sound statistical methods and ecological knowledge of the target species19. We also focused on proximal predictors that directly influence species distribution and selected a low number of predictive variables to reduce the issues of model overfitting and multicollinearity20. We selected four bioclimatic variables that previous studies had reported to be relevant predictors of the distribution of plant species, especially in environments such as those that characterize the Mediterranean Basin21–24: “Minimum temperature of the coldest month” (Bio06, in °C) quantifies potentially lethal frost events and more generally, stress due to low temperatures; “Total annual precipitation” (Bio12, in mm) approximates average water availability; “Precipitation of the driest month” (Bio14, in mm) describes the extremes associated with drought events and stress due to low water availability, and “Temperature seasonality” (Bio04, no dimension) describes the variability of temperature during the year. All selected predictors showed VIF (variance inflation factor25) values below 5, indicating that a given predictor was not correlated with any linear combinations of the other predictors (VIF Bio04 = 1.68, VIF Bio06 = 2.06, VIF Bio12 = 1.53, and VIF Bio14 = 2.07).
We related species occurrence to these four bioclimatic variables using the Random Forest algorithm26. As only presence data are archived in the WOODIV database, we randomly sampled a number of pseudo-absences equal to the number of observed occurrences27. This random selection of pseudo-absences was repeated 10 times for each species. When comparing the floras, occurrence data in the Italian Peninsula, Sardinia and/or Sicily were highly unrepresentative of the distribution of some species (n = 84; see Supplementary Table 3). To overcome
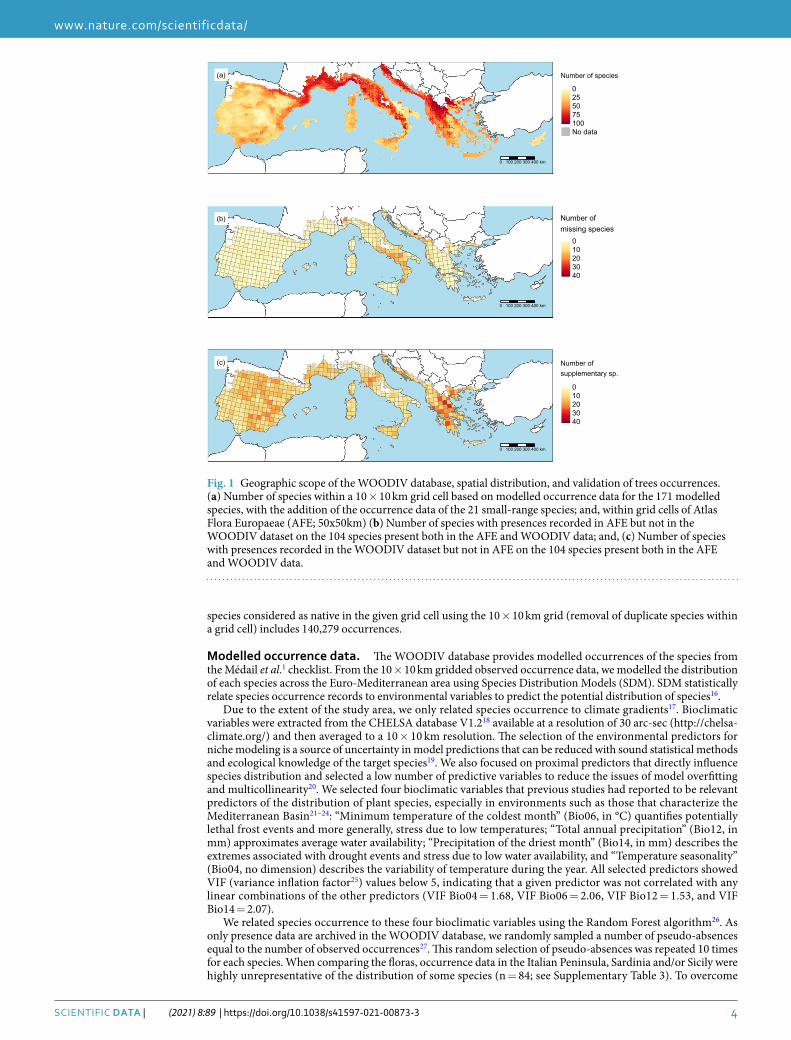
Fig. 1 Geographic scope of the WOODIV database, spatial distribution, and validation of trees occurrences. (a) Number of species within a 10 × 10 km grid cell based on modelled occurrence data for the 171 modelled species, with the addition of the occurrence data of the 21 small-range species; and, within grid cells of Atlas Flora Europaeae (AFE; 50x50km) (b) Number of species with presences recorded in AFE but not in the WOODIV dataset on the 104 species present both in the AFE and WOODIV data; and, (c) Number of species with presences recorded in the WOODIV dataset but not in AFE on the 104 species present both in the AFE and WOODIV data.

5Scientific Data | (2021) 8:89 | https://doi.org/10.1038/s41597-021-00873-3
www.nature.com/scientificdatawww.nature.com/scientificdata/
this potential bias in the models, we did not include these regions in the model calibration step (Supplementary Table 3). The model was projected in these areas after having tested the similarity in the variables between the pro-jection dataset (Italy, Sicily, and Sardinia) and the fitting dataset (the rest of the study area). Indeed, when model predictions are projected into regions not analyzed in the fitting data, it is necessary to measure the similarity between the new environments and those in the training sample28, as models are not so reliable when predicting outside their domain29. Similarity analyses computed using ExDet30 indicated that all covariables in the projected area are within the univariate range of the fitting area and that there is no change in correlation between covari-ables (NT1 and NT2 = 0).
Each of these 10 datasets (per species) was then randomly split into two datasets to evaluate model perfor-mance on pseudo-independent data31: 70% of the data was used to calibrate models and the 30% remaining data was used to evaluate model performance using the True Skill Statistic (TSS32) and the Area Under the Curve (AUC) of the receiver-operating characteristic (ROC) plot33 metrics. This split-sample step was repeated 10 times resulting in 100 models per species.
For each of the 171 modelled species, a mean model (from the 100 replicates) was then used to predict poten-tial species distribution. Predicted probabilities of occurrence were finally converted into presence/absence using the threshold maximizing the TSS. We fitted all models under the R environment R Core team34 and the package biomod235,36.
The WOODIV database provides modelled occurrences of each of the 171 species for each 10 × 10 km grid cell (Fig. 1a). Thirty-two species with less than 10 occurrence records were not modelled (Supplementary Table 3). Among these 32 species, 21 are small-ranged species whose distribution is limited to a few grid cells (Supplementary Table 3). The observed occurrence records for these 21 species can be considered as represent-ative of their distribution and we therefore recommend using the non-modelled records for these species for analyses. The occurrences of the remaining 11 species should be considered unrepresentative of their distribution.
Functional data. Four functional traits were considered in this project: adult plant height (Height), seed mass (SeedMass), specific leaf area (SLA), and wood density (StemSpecDens). These traits have been proposed to reflect a global spectrum of plant strategies37,38: height is a commonly measured proxy for individual size and reflects several aspects including resource acquisition, competitive ability, or dispersal capacity. SeedMass repre-sents the trade-off between fecundity, seed survival, and dispersal. SLA (the ratio between leaf area and dry mass) is correlated to photosynthetic capacity and leaf life span and is an indirect measure of the return on investments in carbon gain compared to water loss. StemSpecDens is a key component of woody plant growth linked to the mechanical support of the stem and its growth rate.
We compiled the values for these traits at the species level for the trees from the Médail et al.1 checklist, referring mostly to 2 databases: TRY9 and BROT 2.039. Supplementary values were obtained from more specific databases (Global Wood Density Database40, Kew Seed Information Database41) or from the scientific literature and atlas42–61. In total, 92% of the entries were extracted from TRY, 7% from BROT 2.0 and the remaining were retrieved from the other sources. The original ID of records from the TRY and BROT databases is provided in order to make it possible to refer to the complete observation if a user needs to have some contextual information.
The WOODIV database lacks all traits data for only 6 of the 210 species from the checklist (Table 2, Supplementary Table 2): Alnus lusitanica Vít, Douda & Mandák, Alnus rohlenae Vít, Douda & Mandák, Malus dasyphylla Borkh., Quercus infectoria Olivier, Tamarix arborea Ehrenb. ex Bunge and, Tamarix passerinoides Del. ex Desf.
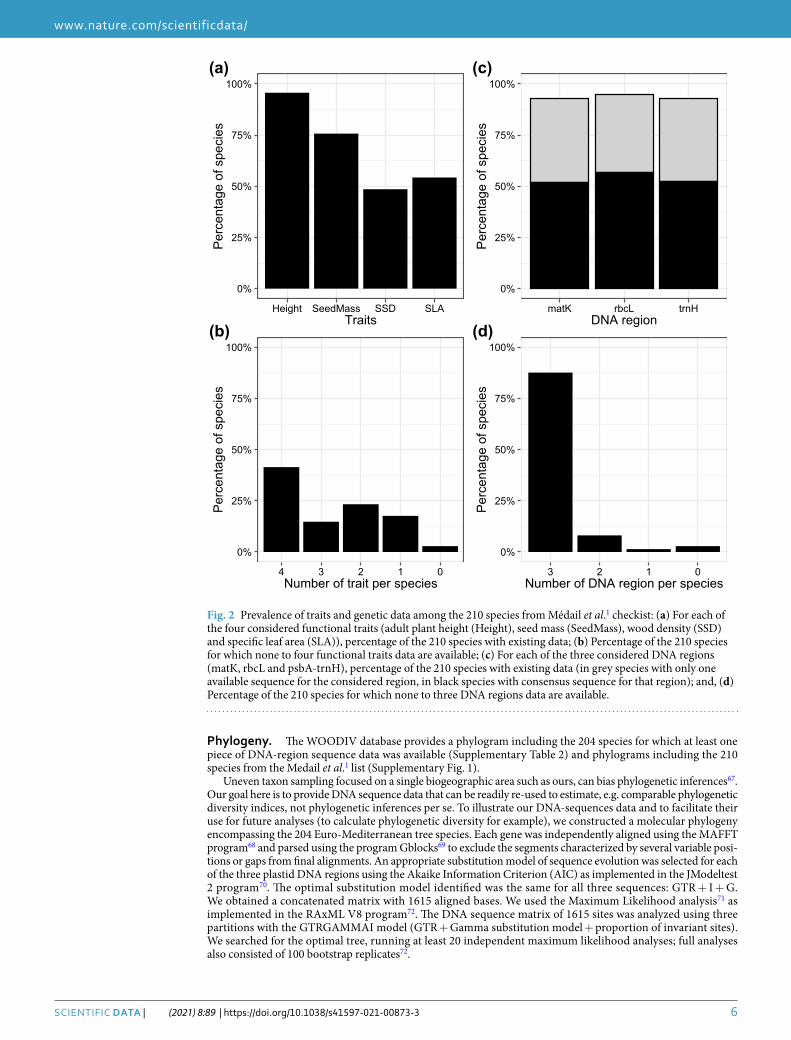
Adult plant height and seed mass data were available for more than 75% of the 210 species (Table 2; Fig. 2a), whereas wood density and specific leaf area were available for only around 50%. The WOODIV database includes all four trait values for 41% of the 210 species (Fig. 2b; Supplementary Table 2), three trait values for 56% more species.
The database provides an R script that can be used to estimate missing trait values using the taxonomic clas-sification if needed.
Genetic data. Three different DNA regions from the plastid genome corresponding to the most com-monly used DNA barcode regions62–64 were considered in this project: the ribulose-bisphosphate/carboxylase Large-subunit gene (rbcL), the maturase-K gene (matK), and the psbA-trnH intergenic spacer (trnH).
In a first step, we collected all sequences from GenBank (https://www.ncbi.nlm.nih.gov/genbank/) for the three DNA regions available for the species from the Médail et al.1 checklist at the species level: rbcL: n = 650 sequences for 146 species, matK: n = 644 sequences for 127 species, trnH: n = 493 sequences for 129 species). To fill the gaps, we obtained DNA from fresh samples collected in the field or gathered from herbarium specimens (Supplementary Table 4). DNA extraction and sequencing were performed at INRA-URFM, Avignon (France) and the National Research Council (IBBR-CNR), Florence (Italy) (rbcL: n = 233 for 125 species, matK: n = 162 for 91 species, trnH: n = 200 for 120 species). Methods used for DNA isolation and Sanger sequencing are described by Albassatneh et al.65. When more than one sequence was available for a given DNA region/species, a sequence alignment was performed to check data quality and a taxon-consensus sequence was generated. Consensus sequences were built using the IUPAC-IUB ambiguity66 code for a total of 119 (rbcL), 109 (matK), and 110 species (trnH), respectively (Fig. 2c). All newly created sequences were uploaded to GenBank.
The WOODIV database lacks the DNA-region sequences data of only 6 of the 210 species from the Médail et al.1 checklist (Table 2, Fig. 2d): Alnus lusitanica Vít, Douda & Mandák, Cytisus aeolicus Guss., Celtis planchoniana K.I. Chr., Salix appendiculata Vill., Tamarix hampeana Boiss. & Heldr. and, Tamarix minoa J.L. Villar, Turland, Juan, Gaskin, M.A. Alonso & M.B. Crespo.
6Scientific Data | (2021) 8:89 | https://doi.org/10.1038/s41597-021-00873-3
www.nature.com/scientificdatawww.nature.com/scientificdata/
Phylogeny. The WOODIV database provides a phylogram including the 204 species for which at least one piece of DNA-region sequence data was available (Supplementary Table 2) and phylograms including the 210 species from the Medail et al.1 list (Supplementary Fig. 1).
Uneven taxon sampling focused on a single biogeographic area such as ours, can bias phylogenetic inferences67. Our goal here is to provide DNA sequence data that can be readily re-used to estimate, e.g. comparable phylogenetic diversity indices, not phylogenetic inferences per se. To illustrate our DNA-sequences data and to facilitate their use for future analyses (to calculate phylogenetic diversity for example), we constructed a molecular phylogeny encompassing the 204 Euro-Mediterranean tree species. Each gene was independently aligned using the MAFFT program68 and parsed using the program Gblocks69 to exclude the segments characterized by several variable posi-tions or gaps from final alignments. An appropriate substitution model of sequence evolution was selected for each of the three plastid DNA regions using the Akaike Information Criterion (AIC) as implemented in the JModeltest 2 program70. The optimal substitution model identified was the same for all three sequences: GTR + I + G. We obtained a concatenated matrix with 1615 aligned bases. We used the Maximum Likelihood analysis71 as implemented in the RAxML V8 program72. The DNA sequence matrix of 1615 sites was analyzed using three partitions with the GTRGAMMAI model (GTR + Gamma substitution model + proportion of invariant sites). We searched for the optimal tree, running at least 20 independent maximum likelihood analyses; full analyses also consisted of 100 bootstrap replicates72.
Fig. 2 Prevalence of traits and genetic data among the 210 species from Médail et al.1 checkist: (a) For each of the four considered functional traits (adult plant height (Height), seed mass (SeedMass), wood density (SSD) and specific leaf area (SLA)), percentage of the 210 species with existing data; (b) Percentage of the 210 species for which none to four functional traits data are available; (c) For each of the three considered DNA regions (matK, rbcL and psbA-trnH), percentage of the 210 species with existing data (in grey species with only one available sequence for the considered region, in black species with consensus sequence for that region); and, (d) Percentage of the 210 species for which none to three DNA regions data are available.

7Scientific Data | (2021) 8:89 | https://doi.org/10.1038/s41597-021-00873-3
www.nature.com/scientificdatawww.nature.com/scientificdata/
For users who would like to work on the complete pool of 210 tree species, we also built a 210 species phy-logram including all Euro-Mediterranean trees. The six missing species for which no DNA-region sequence was available were added to the phylogenetic tree using the Simulation with Uncertainty for Phylogenetic Investigating (SUNPLIN) method73, with 100 replicates. The geometric median tree was computed from the set of 100 replicates with the medTree function from the R package treespace74. Both the median tree and the set of 100 replicates are provided in the WOODIV database, together with the molecular tree with 204 species.
Data RecordsThe data are available on the figshare data repository https://doi.org/10.6084/m9.figshare.13952897.v275 and are comprised of twenty files and two R scripts divided into six folders (Fig. 3), all named following the pattern “WOODIV_filename.ext”.
The “SPECIES” folder includes three datasets in comma-separated values (csv) format (Online-only Tables 1, 2): the “Species_code” file matches the species code used in the WOODIV database and the scientific name as defined by Médail et al.1; the “Nomenclature” file includes the nomenclature data of all taxa, from the order to the species or subspecies level, and synonymous names if any; the “Status” file indicates which taxon is endemic or cultivated following the Médail et al.1 definition (see Methods section).
The “OCCURRENCE” folder includes five datasets in csv format and one R script (Online-only Tables 1, 2). The “Occurrence_data” file includes all observed occurrences of species at the grain size of 10 × 10 km aligned with the INSPIRE LAEA grid, the associated country, and the code of the source from where the data was extracted; the “SDM” file includes the modelled occurrences of the (171) species at the 10 × 10 km grid cell-size aligned with the INSPIRE LAEA reference grid; the “Occurrence_source” file matches the source code to the full description of the source; the “Aggregation” file indicates if taxa can be merged (e.g. collapsing all subspecies level data to the species or species’ group level); the “Country” file shows whether the taxon is present (native or introduced) or absent in each country; the “working_file_generation” R script combines all these datasets into a global dataset.
The “TRAITS” folder includes two datasets in csv format and one R script (Online-only Tables 1, 2): the “Trait_data” table includes the functional trait values, the code of the source from where they were extracted, and, when relevant, the source database from which the data is extracted, as well as the ID within this database; the “Trait_source” table matches the source code to the full description of the source; the “trait_table_generation” R script provides the method to average the trait values at the species level and to replace the missing values with
Fig. 3 Structure of the WOODIV database. Content of the six folders provided within the database and their links (indicated with arrows), together with the description of the steps included in the two scripts provided (WOODIV_working_file_generation.R and WOODIV_trait_table_generation.R). Occurrence data and the associated information and script are in the yellow box, nomenclature information in the grey box, DNA-region sequences data in the blue box, phylogenetic data in the purple box, the functional data and associated script in the dark orange box, and spatial data files in the dark green box. Contents of provided files are described in Online-only Tables 1 and 2.
8Scientific Data | (2021) 8:89 | https://doi.org/10.1038/s41597-021-00873-3
www.nature.com/scientificdatawww.nature.com/scientificdata/
the mean trait values of the higher taxonomic level while recording this level used in a table. The Supplementary Table 5 indicates for each species/trait pair, at which level the value of the trait has been assessed with the current data and code implemented.
The “SEQUENCES” folder includes one dataset in csv format and three text-based files for representing nucle-otide sequences (FASTA). The “Sequence_source” file shows the GenBank reference number of each DNA-region sequence together with the data source (either GenBank or WOODIV); the sources of the samples sequenced by the WOODIV consortium are listed in Supplementary Table 4; the fasta files refer to the sequences (unique or consensus) for each species and DNA-region used to build the phylogenetic tree of the 204 species and named according to the DNA-region.
The “PHYLOGENY” folder includes four phylogenetic trees. The “Phylogeny_204spp_BS” file includes the phylogram of the 204 species for which at least one of the three DNA-region sequences was available with boot-strap values, in nexus format. The “Phylogeny_204spp” file includes the same phylogram without bootstrap in Newick format. The “Phylogenies_210spp_100rep” file includes the 100 replicates of the phylogeny of the 210 species from the checklist, in Newick format. The “Phylogeny_210spp_median” file includes the median tree from the 100 replicates for the 210 species, in Newick format.
The “SPATIAL” folder has two subfolders: the “Study_area_shape” subfolder includes a polygon shapefile (EPSG: 3035) delimitating the study area while the “10 × 10 km_grid” subfolder includes a polygon shapefile (EPSG: 3035) displaying the part of the INSPIRE LAEA grid that covers the study area.
technical ValidationObserved and modelled occurrence data. The first step of data validation when gathering occurrence data is to agree on a taxonomic backbone. We followed the list of accepted names and their synonyms compiled by Médail et al.1 for all Euro-Mediterranean tree species. The WOODIV database includes a taxonomy table which provides the nomenclature from different taxonomic references: EURO + MED Plant Base (http://www.emplantbase.org/home.html), the Browicz76, and the World Checklist Kew (http://wcsp.science.kew.org).
Errors in georeferenced data are common, but many of them can be easily detected77. We systematically fil-tered the data to discard records (i) with missing latitude or longitude or (ii) falling outside the study area covered by the data source (e.g. outside the borders of a country for a national atlas), and standardized the projection system if needed. In other cases, coordinates for species records appear correct but could fall outside the known and validated range of a species, mostly due to uncertain or erroneous taxonomic identification. These cases are more complicated to detect, requiring validation by an expert and/or comparison with an independent dataset to distinguish a false identification from a validated location. This step is often neglected due to lack of time or because the expertise is not available. In the WOODIV project, we implemented these two time-consuming vali-dation steps: (i) using independent data provided at the country level to discard records falling outside the known species range. This step was led by the botanists using the country checklist of trees in Mediterranean Europe published by the same authors1. For Spain only, botanists also compared the spatial distribution of occurrences available from the GBIF platform with the occurrences maps provided by Flora Iberica61 and Flora-On (https://flora-on.pt/); (ii) checking the resulting maps of occurrences to discard dubious records by botanists from each of the 13 countries and islands. This validation step, for example, resulted in the deletion of records of planted trees such as those of Abies pinsapo Boiss. planted outside the native range in southern Spain.
To assess gaps in the occurrence data within the WOODIV dataset, we compared our occurrence data with the data of the Atlas Flora Europaeae (AFE)15. The AFE provides the distribution data for vascular plants in Europe at a 50 × 50 km resolution. We compared the occurrence distribution only for species in both the AFE and the WOODIV data (n = 104). For each of these species, we checked whether our dataset provides occurrence in the grid cells where the AFE reported presence. AFE grid cells where occurrences are missing in our dataset (Fig. 1b) and where our dataset reports occurrence data when the AFE does not (Fig. 1c) were mapped. Overall, the com-parison with AFE (on 10,585 occurrences in the 50 × 50 km grid cells in AFE, for the 104 species) showed that we brought more occurrence information (n = 5405, i.e. + 51.1%) than we missed (n = 2186, i.e. 20.7%), suggesting the strong input of our database for Euro-Mediterranean trees. The most important gaps in the data occurred in Italy and in Montenegro (inland as we collected additional data on the field in the coastal area).
All species distribution models were tested for their predictive ability on the evaluation dataset using both the AUC and the TSS metric (Supplementary Table 3). A filter was applied to modelled occurrences based on the presence or not of species in each country as indicated by Médail et al.1 Thus, modelled but unconfirmed occur-rences of species, namely “false occurrences” were converted to absences.
trait data. Datasets from juvenile stages were systematically discarded. Trait measures were checked for consistency in the unit (m for Height, mg for SeedMass, g.cm−3 for StemSpecDens, and mm2.mg−1 for SLA). Categorical coded values (e.g. high, medium, heavy) and extreme outliers were removed. For species with shrub and tree forms, maximum or range values of Height were taken only for tree forms. When coordinates were provided in the databases, we filtered out those from outside of the Euro-Mediterranean Basin in order to keep trait variation observed within the region. Finally, redundancies between the different sources were checked and duplicated entries were removed to keep only one entry.
Genetic data and phylogeny. For each taxon, sequences were quality checked and edited using CodonCode Aligner (CondonCode Co., MA, USA) to trim and remove low-quality regions. For sequences from GenBank, long sequences were preferred. For INRA-URFM and IBBR-CNR sequences, the quality of the chroma-tograms was visually checked, and ambiguous nucleotides were called using the uncertainty code. All sequences were blasted and matched with the closest relatives. Sequences falling outside genus sections were removed from the data set. Multiple sequence alignments were built using the program MAFFT42 and parsed using the program

9Scientific Data | (2021) 8:89 | https://doi.org/10.1038/s41597-021-00873-3
www.nature.com/scientificdatawww.nature.com/scientificdata/
Gblocks43 to exclude the segments characterized by several variable positions or gaps from final alignments. The monophyly of families and genera was checked in the inferred phylogeny. In case of non-monophyly, the sequences were blasted again to validate them. We compared the topology of orders and above in our tree with the tree published in APGIV to make sure that the topologies were mainly congruent. The slight discrepancies we observe with reference phylogenies are mostly in families that are notoriously phylogenetically complicated, with incomplete lineage sorting and frequent speciation events, as in the Rosaceae and the Fagaceae.
Usage NotesTwo summary tables can be generated from the different tables of the WOODIV database following the workflow presented in Fig. 3, using the scripts included in the database. The first table, named “working file”, is generated by the “WOODIV_working_file_generation.R” script, which relates all information regarding the species and occur-rences. As a first step, the observed recorded (“Occurrence_data”) and the modelled (“SDM”) occurrences are merged into one, with a variable indicating the type of data for each occurrence (observed or modelled). Then the classification of each species (“Nomenclature” data) is added to the table, using the species code as an index. The next step inserts the information about taxa aggregation (“Aggregation” data) at the species or species’ group level as described in the “Methods” section. The status of the species in each country (native or introduced) is added for each occurrence using the “Country” data. The last information added to the table is the cultivated or endemic status of the species (“Status” data). Other variables (e.g. the scientific name of each species for each occurrence) or filters (e.g. to select only the SDM outputs) can be easily generated from this resulting table (“working file”).
The second table includes a summary of the functional traits for each species. The “WOODIV_trait_table_gen-eration.R” script can be used to compute the mean value for each trait and each species (“Mean trait by species” table) from all trait measures included in the “Trait_data”. In addition, the “Nomenclature” data can be used to impute values for species with no value for a given trait based on the taxonomic classification by taking the mean values of higher rank. Genus, family, or order levels are currently implemented in the script.
The “working file” table, the “mean trait by species” table, the 210-species phylogenetic tree, and the spatial layers are organized to easily perform several analyses, as diversity maps: the “working file” table can be filtered to keep either the observed or the modelled occurrences and converted into a community matrix giving the number of occurrences of each taxa in each cell, using the cell ID as row and the aggregation level as column. Diversity metrics can be derived from this matrix (e.g. the number of occurrences or of taxa by cell), as well as phylogenetic and functional metrics using appropriate tools and functions. To derive the latter, the match and ranking between the taxa labels of the occurrences, traits, and phylogenetic data must be carefully checked (e.g. using the organize.syncsa function in the SYNCSA R package or the match.function groups in the PICANTE R package). Maps can then be generated using the cell grid layer to spatialize the metrics.
As biodiversity data are rapidly accumulating, new information will become available. The same standardized cleaning and filtering processes can be applied to upcoming occurrences and traits data, and the future updates of the database will be uploaded as new versions of the database on the same figshare data repository75 once a year. If a user has an error to report or a suggestion to improve the database, the corresponding author can be contacted.
Code availabilityTwo R scripts are available with the data files in the database. The “WOODIV_working_file_generation.R” script in the “SPECIES” folder combines all the information about species occurrences and nomenclature into one table to run the analyses. The “WOODIV_trait_table_generation.R” in the “TRAITS” folder uses the species nomenclature to compute species mean traits and impute values when no data is available using nomenclature. They run under R software version 3.6 (last tests under version 3.6.234).
Received: 7 July 2020; Accepted: 17 February 2021;Published: xx xx xxxx
References 1. Médail, F. et al. What is a tree in the Mediterranean Basin hotspot? A critical analysis. For. Ecosyst. 6, 17 (2019). 2. FAO. State of Mediterranean forests. Concept Pap. Arid Zo. For. For. Work. Pap. No. 2. Rome. 25 (2011). 3. Zermoglio, P. F., Guralnick, R. P. & Wieczorek, J. R. A standardized reference data set for vertebrate taxon name resolution. PLoS One
11, 1–20 (2016). 4. Serra-Diaz, J. M., Enquist, B. J., Maitner, B., Merow, C. & Svenning, J. Big data of tree species distributions: how big and how good?
For. Ecosyst. 4, 30 (2017). 5. Rolland, J. et al. Using phylogenies in conservation: new perspectives. Biol. Lett. 8, 692–694 (2012). 6. Díaz, S. et al. Incorporating plant functional diversity effects in ecosystem service assessments. Proc. Natl. Acad. Sci. 104, 20684–9
(2007). 7. Devictor, V. et al. Spatial mismatch and congruence between taxonomic, phylogenetic and functional diversity: The need for
integrative conservation strategies in a changing world. Ecol. Lett. 13, 1030–1040 (2010). 8. Brooks, T. M. et al. Global Biodiversity Conservation Priorities. Science 313, 58–61 (2006). 9. Kattge, J. et al. TRY - a global database of plant traits. Glob. Chang. Biol. 17, 2905–2935 (2011). 10. Cadotte, M. W., Cavender-Bares, J., Tilman, D. & Oakley, T. H. Using phylogenetic, functional and trait diversity to understand
patterns of plant community productivity. PLoS One 4, e5695 (2009). 11. Webb, C. O., Ackerly, D. D. & Mcpeek, M. a. & Donoghue, M. J. Phylogenies and Community Ecology. Annu. Rev. Ecol. Syst. 33,
475–505 (2002). 12. Benson, D. A. et al. GenBank. Nucleid Acids Res. 40, D48–D53 (2012). 13. Olson, D. M. et al. Terrestrial ecoregions of the worlds: A new map of life on Earth. Bioscience 51, 933–938 (2001). 14. INSPIRE thematic working group coordinate reference systems and geographical grid systems. D2.8.I.2 INSPIRE specification on
geographical grid Systems – Guidelines. (2009). 15. Kurtto, A., Sennikov, A. N. & Lampinen, R. Atlas Florae Europaeae, 16. (2013). 16. Guisan, A. & Thuiller, W. Predicting species distribution: Offering more than simple habitat models. Ecol. Lett. 8, 993–1009 (2005).

1 0Scientific Data | (2021) 8:89 | https://doi.org/10.1038/s41597-021-00873-3
www.nature.com/scientificdatawww.nature.com/scientificdata/
17. Pearson, R. G. & Dawson, T. P. Predicting the impacts of climate change on the distribution of species: are bioclimate envelope models useful? Glob. Ecol. Biogeogr. 12, 361–371 (2003).
18. Karger, D. N. et al. Climatologies at high resolution for the earth’s land surface areas. Sci. Data 4, 170122 (2017). 19. Araújo, M. B. et al. Standards for distribution models in biodiversity assessments. Sci. Adv. 5, eaat4858 (2019). 20. Heikkinen, R. K. et al. Methods and uncertainties in bioclimatic envelope modelling under climate change. Prog. Phys. Geogr. 30,
751–777 (2006). 21. Migliore, J., Baumel, A., Leriche, A., Juin, M. & Médail, F. Surviving glaciations in the Mediterranean region: an alternative to the
long-term refugia hypothesis. Bot. J. Linn. Soc. 187, 537–549 (2018). 22. Miller, J. & Franklin, J. Modeling the distribution of four vegetation alliances using generalized linear models and classification trees
with spatial dependence. Ecol. Modell. 157, 227–247 (2002). 23. Scarnati, L. et al. A multiple approach for the evaluation of the spatial distribution and dynamics of a forest habitat: the case of
Apennine beech forests with Taxus baccata and Ilex aquifolium. Biodivers. Conserv. 18, 3099–3113 (2009). 24. Lopez-Tirado, J. & Hidalgo, P. J. Ecological niche modelling of three Mediterranean pine species in the south of Spain: a tool for
afforestation/reforestation programs in the twenty-first century. New For. 47, 411–429 (2016). 25. O’Brien, R. M. A Caution Regarding Rules of Thumb for Variance Inflation Factors. Qual. Quant. 41, 673–690 (2007). 26. Breiman, L. Random forests. Mach. Learn. 45, 5–32 (2001). 27. Barbet-Massin, M., Jiguet, F., Albert, C. H. & Thuiller, W. Selecting pseudo-absences for species distribution models: how, where and
how many? Methods Ecol. Evol. 3, 327–338 (2012). 28. Elith, J., Kearney, M. & Phillips, S. The art of modelling range-shifting species. 1, 330–342 (2010). 29. Barbosa, a., Real, R. & Mariovargas, J. Transferability of environmental favourability models in geographic space: The case of the
Iberian desman (Galemys pyrenaicus) in Portugal and Spain. Ecol. Modell. 220, 747–754 (2009). 30. Mesgaran, M. B., Cousens, R. D. & Webber, B. L. Here be dragons: a tool for quantifying novelty due to covariate range and
correlation change when projecting species distribution models. Divers. Distrib. 20, 1147–1159 (2014). 31. Araujo, M. B., Pearson, R. G., Thuiller, W. & Erhard, M. Validation of species-climate impact models under climate change. Glob.
Chang. Biol. 11, 1504–1513 (2005). 32. Allouche, O., Tsoar, A. & Kadmon, R. Assessing the accuracy of species distribution models: prevalence, kappa and the true skill
statistic (TSS). J. Appl. Ecol. 43, 1223–1232 (2006). 33. Fawcett, T. An introduction to ROC analysis. Pattern Recognit. Lett. 27, 861–874 (2006). 34. R Core Team. R: A language and environment for statistical computing (2019). 35. Thuiller, W., Georges, D. & Engler, R. biomod2: Ensemble platform for species distribution modeling. (2013). 36. Thuiller, W. BIOMOD - optimizing predictions of species distributions and projecting potential future shifts under global change.
Glob. Chang. Biol. 9, 1353–1362 (2003). 37. Westoby, M. A leaf-height-seed (LHS) plant ecology strategy scheme. Pant Soil 199, 213–227 (1998). 38. Díaz, S. et al. The global spectrum of plant form and function. Nature 529, 167–171 (2016). 39. Tavşanoğlu, Ç. & Pausas, J. G. A functional trait database for Mediterranean Basin plants. Sci. Data 5, 180135 (2018). 40. Zanne, A. E. et al. Data from: Towards a worldwide wood economics spectrum. Dryad https://doi.org/10.5061/dryad.234 (2009). 41. Royal Botanic Gardens Kew. Seed Information Database (SID). Version 7.1. http://data.kew.org/sid/ (2020). 42. Adams, R. P. Juniperus deltoides, a new species, and nomenclatural notes on Juniperus polycarpos and J. turcomanica
(Cupressaceae). Phytologia 86, 47–51 (2004). 43. Garfì, G., Carimi, F., Pasta, S., Rühl, J. & Trigila, S. Additional insights on the ecology of the relic tree Zelkova sicula di Pasquale,
Garfì et Quézel (Ulmaceae) after the finding of a new population. Flora - Morphol. Distrib. Funct. Ecol. Plants 206, 407–417 (2011). 44. Christensen, K. I. Revision of Crataegus Sect. Crataegus and Nothosect. Crataeguineae (Rosaceae-Maloideae) in the Old World. Syst.
Bot. Monogr. 35, 1–199 (1992). 45. Lázaro, A. & Traveset, A. Does the spatial variation in selective pressures explain among-site differences in seed mass? A test with
Buxus balearica. Evol. Ecol. 23, 847–865 (2009). 46. Mossa, L., Bacchetta, G. & Brullo, S. Quercus Ichnusae (Fagacea), a new species from Sardinia. Isr. J. Plant Sci. 47, 199–207 (1999). 47. Yilmaz, K. U., Uzun, A., Cam, M. & Ercisli, S. Some morphological and fruit characteristics of naturally grown Pyrus elaeagrifolia
Pall. of Kayseri Province (Central Anatolia, Turkey). Genet. Resour. Crop Evol. 62, 711–720 (2015). 48. Bacchetta, G. Morphological and micro-morphological comparative study of Genista etnensis populations. Not. Della Soc. Bot. Ital.
3–4 (2016). 49. Güner, A., Gorener, V. & Jerome, D. Quercus aucheri. The IUCN Red List of Threatened Species 2019: e.T33220A2835356. https://
doi.org/10.2305/IUCN.UK.2019-2.RLTS.T33220A2835356.en (2019). 50. Gorener, V. Quercus cerris. The IUCN Red List of Threatened Species 2018: e.T194074A2296302. https://doi.org/10.2305/IUCN.
UK.2018-1.RLTS.T194074A2296302.en (2018). 51. Allen, D. Tamarix minoa. The IUCN Red List of Threatened Species 2017: e.T103493402A103493491. https://doi.org/10.2305/
IUCN.UK.2017-3.RLTS.T103493402A103493491.en (2017). 52. Rivers, M. C. & Stritch, L. Alnus alnobetula. The IUCN Red List of Threatened Species 2016: e.T51203944A2347475. https://doi.
org/10.2305/IUCN.UK.2016-1.RLTS.T51203944A2347475.en (2016). 53. Orsenigo, S. & Troìa, A. Genista thyrrena. The IUCN Red List of Threatened Species 2017: e.T103496142A10349614. https://doi.
org/10.2305/IUCN.UK.2017-3.RLTS.T103496142A103496145.en (2017). 54. Coste, H. & Flahault, C. Flore descriptive et illustrée de la France: de la Corse et des contrées limitrophes. (1990). 55. Jeanmonod, D. & Gamisans, J. Flora Corsica. 2e édition (2013). 56. Muñoz Garmendia, F., Navarro, C., Castroviejo, S. & Real jardín botánico. Flora Iberica: plantas vasculares de la Península Ibérica e
Islas Baleares. Vol. VI, Rosaceae. (1998). 57. Pignatti, S. Flora d’Italia. Vol. primo. (1997). 58. Strid, A. & Tan, K. Flora Hellenica. Volume 1: Gymnospermae to Caryphyllaceae (1997). 59. Tsintides, T., Christodoulou, C., Delipetrou, P. & Georghiou., K. The Red Data Book of the Flora of Cyprus (Lefkosia, CY, 2007). 60. Tutin, T. G. et al. Flora Europaea Vol. 1 (Cambridge University Press, 1964). 61. Castroviejo S. Flora Iberica: plantas vasculares de la Península Ibérica e Islas Baleares Vol. 3 (CSIC - Real Jardín Botánico, 1993). 62. Simón-Porcar, V. I. et al. Using floristics, modern systematics and phylogenetics for disentangling biodiversity hotspots across scales:
a Mediterranean case study. Plant Biosyst. 3504, 1–18 (2018). 63. Kress, W. J. & Erickson, D. L. A two-locus global DNA barcode for land plants: the coding rbcL gene complements the non-coding
trnH-psbA spacer region. PLoS One 2 (2007). 64. Erickson, D. L. et al. Comparative evolutionary diversity and phylogenetic structure across multiple forest dynamics plots: a mega-
phylogeny approach. Front. Genet. 5 (2014). 65. Albassatneh, M. C. et al. A comprehensive, genus-level time-calibrated phylogeny of the tree flora of Mediterranean Europe and an
assessment of its vulnerability. Bot. Lett. 167, 276–289 (2020). 66. Tipton, K. F. Nomenclature Committee of the International Union of Biochemistry and Molecular Biology (NC-IUBMB). Enzyme
nomenclature. Recommendations 1992. Supplement: corrections and additions. Eur. J. Biochem. 1–223 (1994). 67. Davies, T. J., Kraft, N. J. B., Salamin, N. & Wolkovich, E. M. Incompletely resolved phylogenetic trees inflate estimates of phylogenetic
conservatism. Ecology 93, 242–247 (2012).

1 1Scientific Data | (2021) 8:89 | https://doi.org/10.1038/s41597-021-00873-3
www.nature.com/scientificdatawww.nature.com/scientificdata/
68. Katoh, K., Misawa, K., Kuma, K. & Miyata, T. MAFFT: a novel method for rapid multiple sequence alignment based on fast Fourier transform. Nucleid Acids Res. 30, 3059–3066 (2002).
69. Castresana, J. Selection of conserved blocks from multiple alignments for their use in phylogenetic analysis. Modlecular Biol. Evol. 17, 540–552 (2000).
70. Darriba, D., Taboada, G. L., Doallo, R. & Posada, D. jModelTest 2: more models, new heuristics and parallel computing. Nat. Methods 9, 772 (2012).
71. Felsenstein, J. Maximum likelihood and Mminimum-steps methods for estimating evolutionary trees from data on discrete characters. Syst. Zool. 22, 240–249 (1973).
72. Stamatakis, A. RAxML version 8: a tool for phylogenetic analysis and post-analysis of large phylogenies. Bioinformatics 30, 1312–1313 (2014).
73. Martins, W. S., Carmo, W. C., Longo, H. J., Rosa, T. C. & Rangel, T. F. SUNPLIN: Simulation with Uncertainty for Phylogenetic Investigations. Bioinformatics 14 (2013).
74. Jombart, T., Kendall, M., Almagro-Garcia, J. & Colijn, C. treespace: Statistical exploration of landscapes of phylogenetic trees. Mol. Ecol. Resour. 17, 1385–1392 (2017).
75. Monnet, A.-C. et al. WOODIV, a database of occurrences, functional traits, and phylogenetic data for all Euro-Mediterranean trees. figshare https://doi.org/10.6084/m9.figshare.13952897.v2 (2021).
76. Browicz, K. Chorology of trees and shrubs in south-West Asia and adjacent regions Vol. 1–10 (Państwowe Wydawnictwo Naukowe, 1982–1996).
77. Zizka, A. et al. CoordinateCleaner: Standardized cleaning of occurrence records from biological collection databases. Methods Ecol. Evol. 10, 744–751 (2019).
acknowledgementsThis work was funded by the French Foundation for Research on Biodiversity (FRB) through its Centre for Synthesis and Analysis of Biodiversity data (CESAB) program, as part of the WOODIV research project. A.-C.M. and K.C. were funded by Labex OT-Med (n ANR-11-LABX-0061). DNA extraction and sequencing have been supported by the CNR project “Ottimizzazione dell’uso delle risorse naturali negli ecosistemi agricoli e forestali”. The authors thank Alex Baumel (IMBE) for his comments about the phylogeny. We thank the Secretariat of Atlas Flora Europaeae and especially Alexander Sennikov, the Secretary of the Committee for Mapping the Flora of Europe, for providing the AFE data. The authors thank two anonymous referees for their constructive comments which helped to improve this present manuscript. The funders have no role in study design, data collection and analysis, decision to publish, or preparation of the manuscript.
author contributionsA.L. and F.M. conceived the idea of the WOODIV database. A.-C.M., K.C., A.D. and A.L. designed the study. J.A., G.B., Z.B., P.D., G.D., M.E., V.M., F.M., S.M., A.-C.M., T.N., D.P., E.S.B., A.S. provided raw occurrences data and performed distribution data validation. A.-C.M., K.C., A.D. and A.L. gathered the occurrence data and built occurrence databases and scripts. G.V., F.B., I.S. and A.R. extracted DNA region sequences. M.C.A., I.S., A.R., F.B. and B.F. gathered genetic sequences and performed genetic data validation. M.C.A., M.E. and M.C. built phylogeny and associated script and performed validation. K.C. gathered traits data and performed traits data validation and script. N.C., A.-C.M. and A.L. performed the S.D.M., A.L., A.-C.M. and K.C. drafted a first version of the manuscript and G.D., G.B., Z.B., S.M., P.D., A.H., J.A., M.E., F.M., A.D., N.C., F.B., G.V. and B.F. added suggestions and comments.
Competing interestsThe authors declare no competing financial interests.
additional informationSupplementary information The online version contains supplementary material available at https://doi.org/10.1038/s41597-021-00873-3.Correspondence and requests for materials should be addressed to A.-C.M. or A.L.Reprints and permissions information is available at www.nature.com/reprints.Publisher’s note Springer Nature remains neutral with regard to jurisdictional claims in published maps and institutional affiliations.
Open Access This article is licensed under a Creative Commons Attribution 4.0 International License, which permits use, sharing, adaptation, distribution and reproduction in any medium or
format, as long as you give appropriate credit to the original author(s) and the source, provide a link to the Cre-ative Commons license, and indicate if changes were made. The images or other third party material in this article are included in the article’s Creative Commons license, unless indicated otherwise in a credit line to the material. If material is not included in the article’s Creative Commons license and your intended use is not per-mitted by statutory regulation or exceeds the permitted use, you will need to obtain permission directly from the copyright holder. To view a copy of this license, visit http://creativecommons.org/licenses/by/4.0/.
The Creative Commons Public Domain Dedication waiver http://creativecommons.org/publicdomain/zero/1.0/ applies to the metadata files associated with this article. © The Author(s) 2021