woodbine thoroughbred main track - dirt versus synthetic surface decision analysis
TRANSCRIPT
Thoroughbred Main Track Synthetic/Dirt Decision Criteria and
Conversion Options
January, 2015

2
Background
• Woodbine Polytrack installed in 2006, replacing poorly performing dirt cushion. State of the art installation (including new base, drainage layers and railings) promised to reduce equine injury rates, reduce maintenance costs, and supply consistent surface in all weather conditions. Total project cost $12m.
• Since 2006:– catastrophic injury rates remain low but there is insufficient evidence indicating true
frequency of non-catastrophic injuries.– Racing and training dates lost to poor track conditions are rare.– Annual OpEx savings to Woodbine about $800k.– All Sources wagering increases from 2008 through 2013– Main track field size supported by minimized off-the-turf scratches– Surface evolutions have included fibre and wax to maintain shear, binding, and drainage
properties of the surface. Annual installations of oil enable wintertime racing improvements.
• Through course of year 2014 industry indicated requirement for new main track surface. HBPA’s official position calls for a new surface.
• Adding wax and fibre to the cushion material and repeated deep power harrowing in the late fall of 2014 did not sufficiently improve the wintertime racing condition (i.e. clumping).
• Conclusion: the current track surface has reached the end of its useful life

3
Synthetic vs Dirt – Business Case Preview
• Synthetic prevents loss of racing and training dates due to track condition• Woodbine wagering growth since 2008• Keeneland October losses with new dirt main track• Annual operating costs for the respective surface options• HBPA of Ontario position• Synthetic complements Woodbine’s industry competitive turf advantage• Off-the-turf scratches reduced with synthetic main track• Evidence that synthetic surfaces are safer surface with reduced injury
rates• Racing Surface Testing Laboratory promotes synthetic surfaces due to
consistency of respective surface properties• The future of a synthetic racing circuit in North America implies
competitive niche opportunity for Woodbine and its horsemen. • Woodbine turn gradients sufficient given current science.• Purchase and installation timeframes plus costing for various surface
options
4
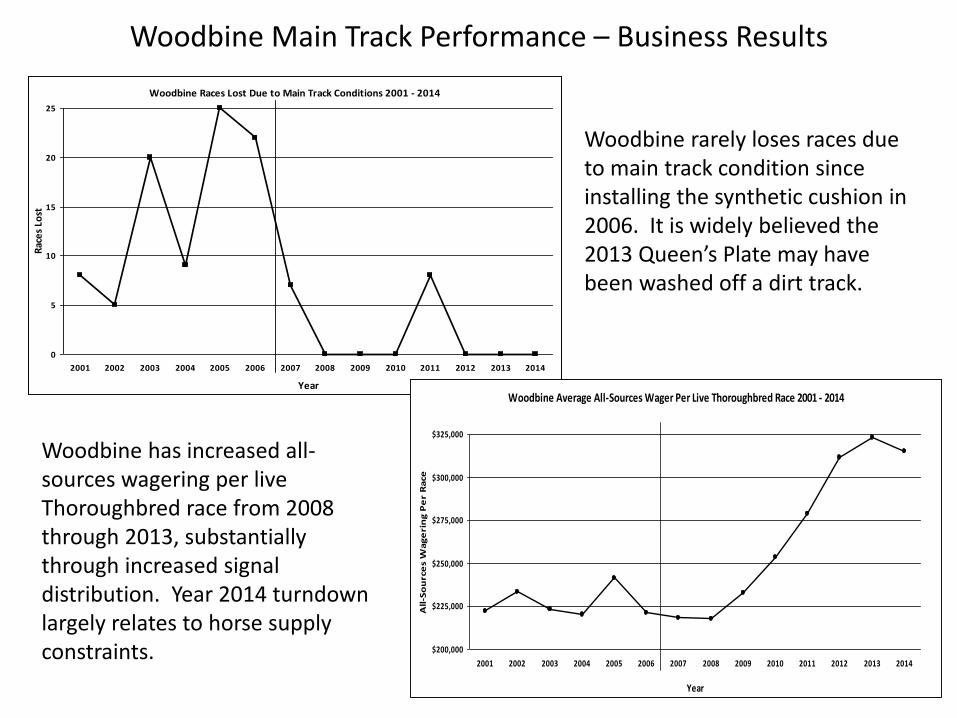
Woodbine Main Track Performance – Business Results
Woodbine Races Lost Due to Main Track Conditions 2001 - 2014
0
5
10
15
20
25
2001 2002 2003 2004 2005 2006 2007 2008 2009 2010 2011 2012 2013 2014
Year
Rac
es
Lost
Woodbine Average All-Sources Wager Per Live Thoroughbred Race 2001 - 2014
$200,000
$225,000
$250,000
$275,000
$300,000
$325,000
2001 2002 2003 2004 2005 2006 2007 2008 2009 2010 2011 2012 2013 2014
Year
All
-So
urc
es
Wa
ge
rin
g P
er
Ra
ce
Woodbine rarely loses races due to main track condition since installing the synthetic cushion in 2006. It is widely believed the 2013 Queen’s Plate may have been washed off a dirt track.
Woodbine has increased all-sources wagering per live Thoroughbred race from 2008 through 2013, substantially through increased signal distribution. Year 2014 turndown largely relates to horse supply constraints.

5
Keeneland October, 2014
• Poor weather and off-the-turf scratches contributed to business declines:
• DRF identified reduction of poly-shippers to affect fields• Generally positive horsemen reaction to new dirt surface
-12% of Woodbine Live Thoroughbred, All Sources = -$47.3m
2013 2012On-track Attendance 251,574 266,466 259,710Average Daily Purses $651,558 ~$600,000
On-track Wager $17,625,834 $18,173,355 $18,160,018WEG wager on Keeneland $4,976,474 -19% $6,103,844 $4,727,929
All Source Wager $122,844,887 -12% $139,660,179 $137,981,281Average Field Size 8.42 -15% 9.85 9.9Fields less than 7 33 10 9Fields less than 6 7 0 3
2014

6
Woodbine Main Track Performance – Operating Costs
• Annual OpEx advantage to synthetic = $786,000– Driver wages and benefits $192,000– Grader operator wages and benefits $50,000– Fuel $300,000– Tractor hours $50,000– Water (7 million gallons, pumps, etc.) $50,000– Ditch clearing, equipment repairs, etc $10,000– Water truck usage and depreciation $60,000– Garage mechanic $64,000– Dirt cushion replacement $60,000– Synthetic materials (oil, wax, fibre, etc.) -$50,000
• Useful Life Expectancy
Synthetic: Minimum expectation of 8 years based on current surface (2006-2014). Actual expectation >10 years.
Dirt: permanent w/ annual maintenance factor• $800k annual added operating expense x 8 years = $6.4 million

7
HBPA of Ontario Position
November, 2014:
HBPA takes “no official position” on question of dirt vs synthetic main track surface.
Current surface is “not currently safe” and “we need a new track”.

8
Woodbine Main Track Performance – Workouts Per Surface
•In 2004 and 2005 there were 18 and 19 dates, respectively, where the main track was closed for training (based on recorded workouts data). From 2007 to current this figure is near zero.
•Timed workouts on the training track decreased sharply after the installation of the synthetic main track in 2006.
•Distribution of timed works between the main track and training track remained steady from 2008 through 2013.
•Year 2014 timed works on the training track increased, partially indicating shifting horsemen preferences.
Distribution of Woodbine Timed Workouts on Main and Training Track 2005 - 2014
52%55%
77% 77%73%
78%
71%74%
64%
43%41%
19% 19%17%
23%19%
26%22%
31%
79%
10%
35%
60%
85%
2005 2006 2007 2008 2009 2010 2011 2012 2013 2014
Year
Pe
rce
nt
of
Tota
l Tim
ed
Wo
rko
uts
Main Track Training Track

9
Woodbine Track Performance – Starts per Starter
Starts per starter have been declining industry-wide for decades. Woodbine starts/starter have been relatively steady, declining at 1/6th the industry rate despite a 20% racedates reduction since 2013.
Woodbine vs Industry Starts per Starter, All Surfaces 2001 - 2014
4.5 4.44.3
4.64.4
4.3
4.54.3 4.3
4.14.3
4.4 4.4 4.4
Woodbine
(Slope = -0.01x)
Industry
(Slope = -0.06x)
3.5
4.5
5.5
6.5
2001 2002 2003 2004 2005 2006 2007 2008 2009 2010 2011 2012 2013 2014
Year
Star
ts p
er
Star
ter

10
Woodbine Main Track Performance – Off the Turf
Woodbine Average Field Size on Main Track and in Off-the-Turf Races
Avg Field
Off-the-Turf
Avg Field Main Track
6.75
7.00
7.25
7.50
7.75
8.00
8.25
8.50
8.75
9.00
9.25
9.50
2004 2005 2006 2007 2008 2009 2010 2011 2012 2013 2014
Year
Avg
Pe
r R
ace
Woodbine Average Field Size on Main Track MINUS Average Field Size
in Off-the-Turf Races
-0.3
0.0
0.3
0.5
0.8
1.0
1.3
1.5
2004 2005 2006 2007 2008 2009 2010 2011 2012 2013 2014
Year
Ave
rage
An
nu
al F
ield
Siz
e D
iffe
ren
ce
Woodbine’s emphasis on turf racing benefits substantially from retention of runners in off-the-turf events (as trendlines converge). The benefit peaked in years 2009 and 2013 where off-the-turf races had larger average fields than main track carded events.
This alternate view illustrates the increasing off-the-turf field size benefits (trendline approaches zero) as horsemen gained confidence in their turfers on the synthetic main track. But, the incidence of off-the-turf scratches did increase in 2014.
Average fields in off-the-turf races cumulatively increased 17% since years 2004/2005.

11
Woodbine Main Track Performance – Ship-In Runners
Woodbine Ship-Ins per Race - Turf vs Main - 2010 - 2014
Main Track
Turf
0.0
0.2
0.4
0.6
2010 2011 2012 2013 2014
Year
Ship
-In
s P
er
Rac
e
Woodbine Ship-Ins per Race Condition 2010 - 2014
ShipIn/Stake
ShipIn/Allowance
ShipIn/Claiming0.0
0.2
0.4
0.6
0.8
1.0
1.2
1.4
2010 2011 2012 2013 2014
Year
Ship
-In
s P
er
Rac
e
Woodbine horse supply generally is an insulated population. The race office substantially relies on Ontario runners to fill main track events. Ship-ins recruitment for turf more than triples the rate of main track ship-ins.
Ship-in runners overwhelmingly target higher end events such as the stakes program relative to overnights races. This correlates to purse opportunities but also affirms Woodbine’s industry competitive advantage as a turf destination.
12
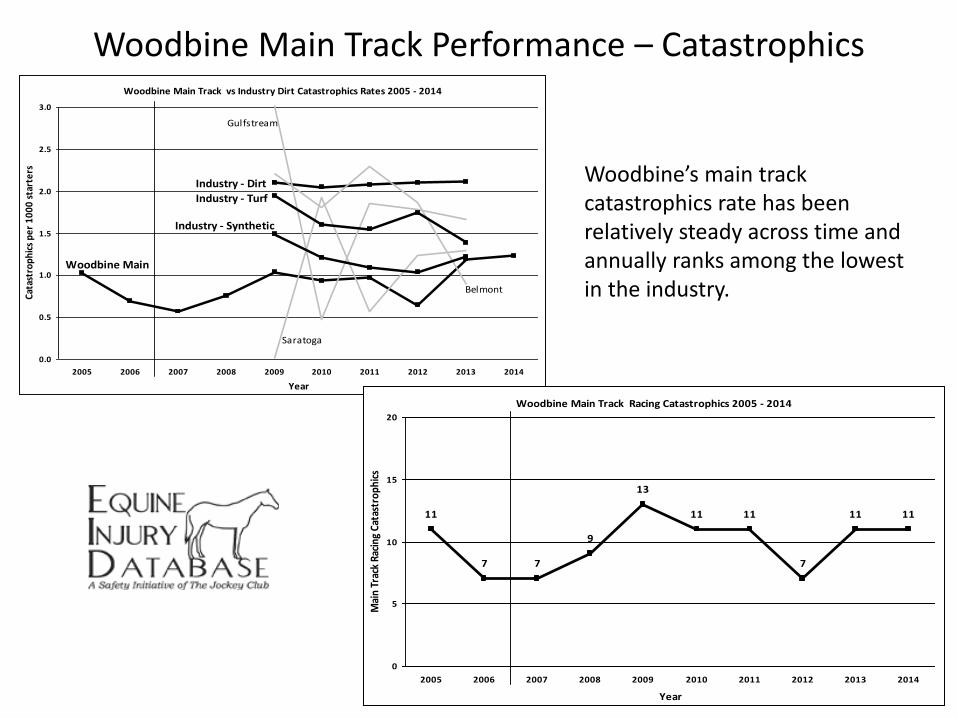
Woodbine Main Track Performance – Catastrophics
Woodbine’s main track catastrophics rate has been relatively steady across time and annually ranks among the lowest in the industry.
Woodbine Main Track vs Industry Dirt Catastrophics Rates 2005 - 2014
Woodbine Main
Industry - Dirt
Belmont
Saratoga
Gulfstream
Industry - Synthetic
Industry - Turf
0.0
0.5
1.0
1.5
2.0
2.5
3.0
2005 2006 2007 2008 2009 2010 2011 2012 2013 2014
Year
Cat
astr
op
hic
s p
er
10
00
sta
rte
rs
Woodbine Main Track Racing Catastrophics 2005 - 2014
11
7 7
9
13
11 11
7
11 11
0
5
10
15
20
2005 2006 2007 2008 2009 2010 2011 2012 2013 2014
Year
Mai
n Tr
ack
Raci
ng C
atas
trop
hics
13
Woodbine Main Track Performance – CEDNF’sCareer Ending Did Not Finish (CEDNF's) as % of Starts, Per Surface 2000 - 2013
Woodbine Dirt
Industry Total
Woodbine Synth
0.00%
0.10%
0.20%
0.30%
0.40%
0.50%
2000 2001 2002 2003 2004 2005 2006 2007 2008 2009 2010 2011 2012 2013
Year
CED
NF'
s as
% o
f St
arts
Woodbine Cumulative Career Ending Did Not Finish (CEDNF's) as % of Starts 2000 - 2013
Woodbine Dirt
(2000-2006), 0.92%
Woodbine Synthetic
(2006-2013), 0.80%
0.75% 0.80% 0.85% 0.90%
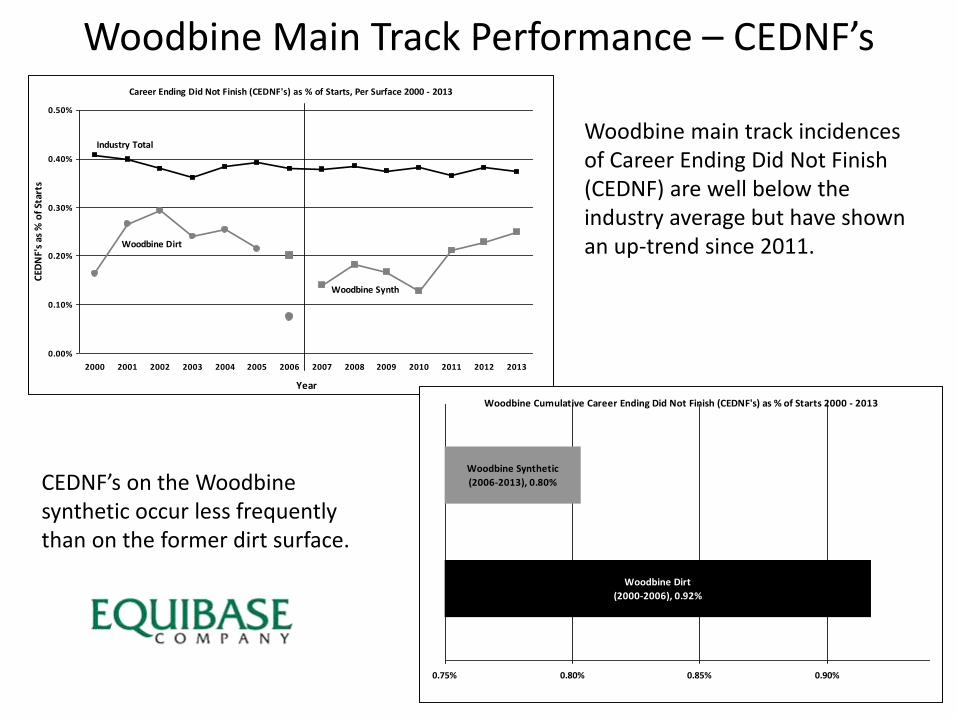
Woodbine main track incidences of Career Ending Did Not Finish (CEDNF) are well below the industry average but have shown an up-trend since 2011.
CEDNF’s on the Woodbine synthetic occur less frequently than on the former dirt surface.
14
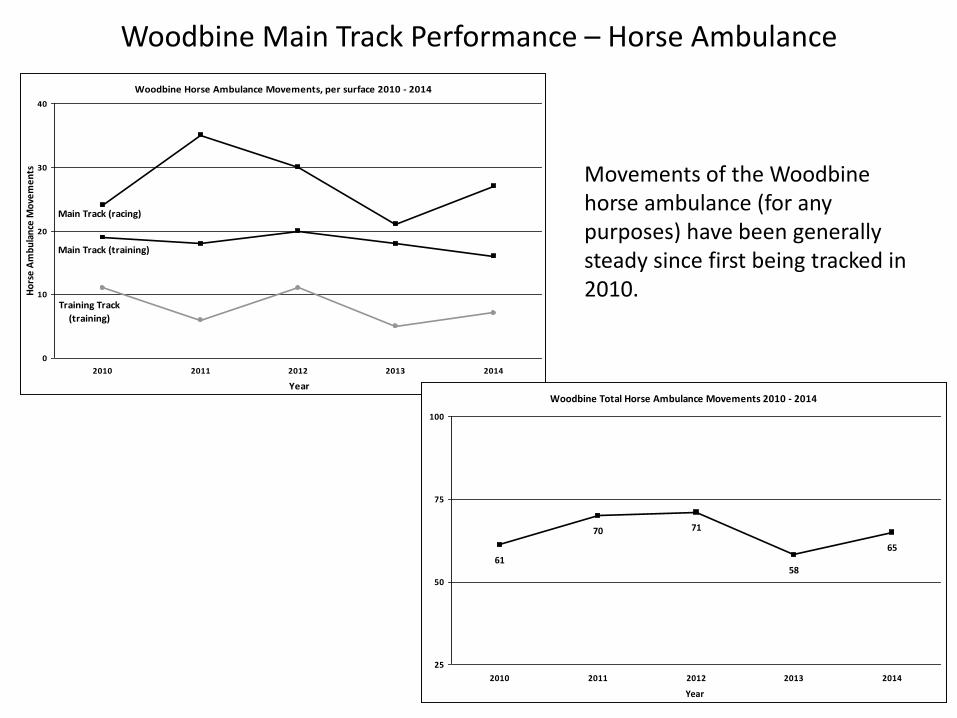
Woodbine Main Track Performance – Horse Ambulance
Movements of the Woodbine horse ambulance (for any purposes) have been generally steady since first being tracked in 2010.
Woodbine Horse Ambulance Movements, per surface 2010 - 2014
Main Track (training)
Training Track
(training)
Main Track (racing)
0
10
20
30
40
2010 2011 2012 2013 2014
Year
Ho
rse
Am
bu
lan
ce M
ove
me
nts
Woodbine Total Horse Ambulance Movements 2010 - 2014
61
70 71
58
65
25
50
75
100
2010 2011 2012 2013 2014
Year

15
Ontario Veterinary Surgeons
• WEG engaged a respected veterinary surgeon to confidentially interview selected Ontario Surgeons.
• Client confidentiality prevents private surgeons from participating with any detail whatsoever
• On a very general basis, unscientifically surmised that polytrack injuries are indeed different than traditional dirt injuries. Dirt trends to lower limb, easier to diagnose, and easier to manage injuries. Synthetic trends to higher limb, harder to diagnose and longer to convalesce injuries. Synthetic injuries seem to be a 1:1 tradeoff where without ongoing study it is impossible to conclude if horse population is worse or better off between the surfaces.
• Opinion: based on what we don’t know at this time it seems counter-productive to abandon synthetic racing. A return to dirt is an indication that industry accepts dirt injury rates as a permanent reality. Continued evolution of synthetics holds potential benefits at seemingly not a cost to welfare.
16
Greg Taylor, Woodbine Official Veterinarian
“Our fractures are down from when we were on dirt. Soft tissue injuries? I wouldn’t say they were up –they’re probably about the same. I do hear that horses are more muscle sore after racing on poly, and that there are more hind end injuries – pelvises and tibias. But honestly there are so few, that I’m not sure of the significance of them.”
17
Mick Peterson, Ph.D.Racing Surfaces Testing Laboratory
“What we really want is for the entire surface to be the same. From stride to stride. From day to day… Consistency is perfection.”
“When we think about uniformity and we think about risk to the horse, we may care so much more about uniformity than we care about the absolute values [of firmness, cushioning, responsiveness, and grip]. The horse has some ability to adapt to asurface… but if we start talking about variability on a trip around the track or variability between tracks there is a lot lowerability to adapt.”
“The important conclusion: dirt is much more variable than synthetic.”(Grayson-Jockey Club Welfare and Safety of the Racehorse Summit 2014)
Current evidence suggests that consistency of each surface and limited variability among surfaces seen by each horse are moreimportant than the exact values of each [surface] property.(Peterson, M., L. Roepstorff, J. Thomason, C. Mahaffey, and C. McIlwraith. “Racing Surfaces: Current Progress and future challenges to optimize consistency and performance of track surfaces for fewer horse injuries”. Racing Surfaces Testing Laboratory. 27, April, 2012)
“My hypothesis is that most horses can adapt between tracks especially when they’re given time, but what they can’t do is adjust between strides 37 and 38. Those drastic, mid-race changes lead to improper loading which can contribute to catastrophic breakdowns. And that’s the strength of synthetic surfaces. They’re much easier to maintain and keep consistent.”(Marquardt, L. “Is this the death of synthetic racing? And, if so, why?”. TDN Magazine. August 2014.)
18
The Future of Synthetic Racing
• Foreseeable synthetic circuit – Arlington, Turfway, Presque Isle, Woodbine, plus Golden Gate – already benefitting from “poly-shippers” facing reduced options.
• Into the future - high potential racing prospects not responding sufficiently to dirt training will ship to Woodbine as a dirt alternative.
• NYRA has publicly indicated serious consideration of a synthetic surface at Belmont. Installation would be 1 mile inner track to accommodate winter training/racing and off-the-turf racing.(Marquardt, L. “Is this the death of synthetic racing? And, if so, why?”. TDN Magazine. August 2014.)

19
Woodbine’s Competitive Position - Synthetics
2012 2013 2014
Ship-Ins 16 15 46
Daily Purses ($US) MSW ($US) # Racedates Season
Woodbine $437,000 $45,000 133 April - December
Arlington $265,000 $38,000 89 May - September
Presque Isle Downs $185,000 $35,000 105 May - September
Golden Gate $148,000 $27,000 152 Oct-Jun, Aug-Sep,
• Arlington and Presque Isle ship-in runners at Woodbine tripled in 2014
• Woodbine purses lead the synthetic circuit
* ($1CAD=$0.80USD)

20
Woodbine’s Competitive Position - Dirt
MSW ($US) Rank Daily Purses ($US) Rank
Saratoga $79,000 1 $1,036,000 1
Del Mar $75,000 2 $608,000 5
Belmont $72,000 3 $788,000 2
Aqueduct $61,000 4 $468,000 6
Keeneland $56,200 5 $631,000 4
Santa Anita $54,000 6 $659,000 3
Churchill $45,300 7 $447,000 7
Woodbine $45,200 8 $437,000 8
Gulfstream $45,000 9 $316,000 10
Parx $44,000 10 $281,000 12
Pimlico $40,000 11 $413,000 9
Laurel $40,000 12 $299,000 11
* ($1CAD=$0.80USD)
21
Tapeta10 in Woodbine Horse Tunnel
• 250 tons of Tapeta10 installed in main horse tunnel, fall 2014
• Material performed very well through winter conditions, notable difference from main track characteristics. No separation, cling, or binding to equipment and hooves.

22
Wolverhampton
• New Tapeta10 surface opened August, 2014, replaced original Polytrack.
• John Gosden,“It’s lovely… It’s nice and springy and you can either ride a race from the front or come from behind. I’ll certainly be bringing more horses here.” (Racing Post, November 15, 2014)
• Woodbine management visited Wolverhampton February 6, 2015.– Track is performing well in wintertime conditions
– Surface unanimously endorsed by Jockeys, Official Veterinarians, Executives and Clerk of the Course

23
Turn Gradients
• Current turns on Woodbine Main Track banked about 4%, Apex geometry.
• Generally held stakeholder views seem to underestimate the 4% reality. Perception is flat turns.
• Some stakeholders recommend increased banking of turns to accommodate lateral forces on runners at speed.
• Former Woodbine dirt surface banked near 6%.

24
Turn Gradients
Turn banking and radius of selected North American tracks:Aqueduct Main 4% 470ft
Arlington 4%
Belmont 4% 640ft
Churchill Downs 4% 420ft
Keeneland Poly 4% 410 and 420ft
Monmouth 4% 417ft
Presque Isle 5%
Saratoga 4% 462ft
Turfway 2.5% 421ft
Woodbine 4% 407ft

25
Turn Gradients – Effects on the Equine
“The fundamental change that a horse makes that a vehicle can not make is to lean into the turn by adapting the gait in an asymmetric fashion.”
“…the dynamics of the horse and the resulting effect on turning including the change in lead coming into the turn are a primary factor with track design playing a secondary role.”
“When the horse leans, the forces from each portion of the body are redirected along a new line of action…closer to the middle of the horse. This rotation of the body (and movement of the head and neck) reduced the tipping moment of the animal and thus the need for banking. Similarly the rider typically moves the center of mass to the inside of the turn (riding acey-deucy) and thus balancing the horse in the turn… While there would be expected to be some effect of turning that is not the same for the inside and outside legs, it is not immediately obvious which leg would experience higher loads and if that would negatively impact the health and safety of the horse.”
“What has become evident from the Grayson study is that the effects of turning are relatively modest compared to some other factors that influence the health and welfare of the horse.”
(Peterson, M., C. Mahaffey, and J. Thomason. “A DRAFT report to Del Mar Thoroughbred Club - Banking of Tracks for the Thoroughbred Horse”. 29, April, 2013.)

26
Turn Gradients – Effects on the Equine
• Jeff Thomason Ph.D., Professor of Biomedical Sciences, University of Guelph
– Study funded by Grayson-Jockey Club, performed on Woodbine main track in 2012
– Analyzed effect on hoof loading as horses run through turn and straight.
– “The main conclusion is that the effect of the turns in redistributing loads on the hoof (and thence to the leg) are insignificant on this track.”

27
Turn Gradients – Effects on the Equine“The Racing Surfaces Testing Laboratory (RSTL) has an ongoing program with The Jockey Club to make use of the data in the Equine Injury Database (EID). The goal of the work with the EID is to understand track design factors associated with risk to the horse and rider. It is well accepted that there is significant lateral risk of musculoskeletal injury. Typically injuries occur to the right rear and the left front legs, which may be a result of turning to the left on North American racetracks. This effect is significant for the tracks and suggests that the banking is insufficient on racetracks to ensure even, bilateral loading. However, data which is now being compiled for a scientific publication indicates that if only turf and synthetic surfaces are considered the lateral effect disappears. This suggests that the higher shear strength in turf and synthetic surfaces reduces asymmetry of loading and that the banking as currently implemented on these surfaces is sufficient to allow the horse to lean into the turn and load both legs in a similar manner. While the results are preliminary and have not yet been published in the refereed literature, this result has important implications for track design and material selection.”
Mick Peterson, Ph.D.Racing Surfaces Testing LaboratoryJanuary, 2015

28
Turn Geometry – ApexWoodbine Main Track current configuration, generally accepted standard geometry of East coast racetracks
“Apex banking is used on a large number of Thoroughbred racetracks. While the radius of the turn on these tracks is constant, the banking changes throughout the length of the curve… The banking then increases at a constant rate (degrees of banking per degree of turn) until it reaches a maximum at the middle of the turn where the rate then reverts and the turn flattens until the exit of the turn or a small distance into the straightaway. The underlying assumption on this type of banking design is that the horse does not approach the inner rail until the center of the turn. If a horse is observed to move from the fourth or fifth racing lane of the track at the entrance to the turn, and then is on the rail at the middle of the turn and then proceeds to move to the middle of the track on the exit, the apex banking results in a close approximation to a spiral turn if ridden in this manner.”
(Peterson, M., C. Mahaffey, and J. Thomason. “A DRAFT report
to Del Mar Thoroughbred Club - Banking of Tracks for the Thoroughbred Horse”. 29, April, 2013)

29
Turn Geometry – TransitionPredominantly found at West coast and tighter radius venues.
“Transition banking is a response and modification to apex banking that appears to have developed as a response to observation of the typical movement of the horse around the corner… The compromise is thus to begin the banking of the turn well before the entrance to the turn, 150 or 200 feet, with the maximum banking typically achieved one quarter of the way through the turn. The banking is then constant for the middle half of the turn at the maximum banking and then the turn transitions gradually to end at the super elevation of the straight section of the track which is typically between zero and 2 percent. The assumption for the perfect use of this type of banking is that the horse would start in to the turn 150 or so feet before the entrance to the turn, and would begin by moving gradually from perhaps three or four racing lanes outside of the turning lane toward the inside rail. The horse would be approximately one quarter of the way into the turn before reaching the closest position to the rail where the horse would continue to travel until reaching a point three quarters of the way through the turn. At that point in the turn the horse would gradually move to the outside for either the front or back stretch run.”
(Peterson, M., C. Mahaffey, and J. Thomason. “A DRAFT report
to Del Mar Thoroughbred Club - Banking of Tracks for the Thoroughbred Horse”. 29, April, 2013)

30
Turn Geometry – Apex vs Transition
(Peterson, M., C. Mahaffey, and J. Thomason. “A DRAFT report to Del Mar Thoroughbred Club - Banking of Tracks for the Thoroughbred Horse”. 29, April, 2013)

31
Turn Geometry – Apex vs Transition
“Current decisions on track banking and transitions thus while relevant from the perspective of the racing course design, is most likely a second order effect for the health of the horse. Given the data from the limited prior research and knowledge of the use of the track by the horse, the decisions should be based on the local design of racing surfaces with a particular focus on the use of a turn design which matches other racetracks with similar turn radii.”
(Peterson, M., C. Mahaffey, and J. Thomason. “A DRAFT report to Del Mar Thoroughbred Club - Banking of Tracks for the Thoroughbred Horse”. 29, April, 2013)

32
• Engineering field reviews confirm existing macadam base and drainage have ample useful life left to accommodate new cushion.
• Keep existing 2” base of virgin Polytrack, remove top 5” for disposal and replace with 5” Tapeta; replace adjacent racing areas with new material.
• Construction Schedule: December 1, 2015 – April 3, 2016
– Conclude 2015 Thoroughbred racing on November 29. Final four days of 2015 racemeet moved to dates earlier in calendar.
– Schedule duration: 25 weeks for inputs procurement and materials batching at locally secured facility, 8-18 weeks to install (winter weather dependent), new surface open for training/racing for April 3, 2016.
• Capex : $7.6 million
TapetaExisting straights (0%) with existing turns (4%)

33
DirtRenovated straights (1.5-2%) with (6%) turns
• Engineering field reviews confirm that existing macadam base and drainage have ample useful life left and may be retained in place (similar to Keeneland).
• Preserve existing base:
– Retains option to revert to vertical draining surface, if desired in the future
– Expedites construction schedule
– Reduces project cost
– Alleviates frost boils.
• Construction tasks:
– Remove 7” of Polytrack exposing macadam base layer
– add filter cloth, 6” compacted granular, and 6” of dirt cushion
– reestablish north precast concrete drainage ditch
– add siltation chambers
– replace and raise inner rail, and increase height of outer rail
– replace adjacent racing areas with new material
• Construction Schedule: December 1, 2015 – April 28, 2016
– Four December 2015 racedates moved to earlier in calendar. Seven or more April 2016 racedates lost.
– Schedule duration: 13 weeks to batch materials, 20 weeks to install (winter weather dependent)
• Capex: $7.1M
• Additional annual operating expenses - $800k
Existing Macadam
6” Dirt Cushion
6” Limestone Base @ 2% and 6% gradient
Filter Cloth

34
Racing Surfaces Working CommitteeMain Track Conversion Recommendation
Due to the end of the useful racing life of the current Polytrack surface and to offer safe and fair racing opportunities to our stakeholders, Woodbine should replace the main thoroughbred racing surface with a Tapeta10 cushion at existing depths and turn gradients, based on a project start date of Dec 1, 2015. The new track surface to be ready for racing as of April 3, 2016.