women on corporate boards and firm performance: … · decision-making because more diverse...
TRANSCRIPT

WOMEN ON CORPORATE BOARDS AND FIRM
PERFORMANCE: EVIDENCE FROM SPAIN
Author: Mireia Segura Sánchez
Bachelor’s Degree in Business Administration and Management-English track
Tutor: Florina Raluca Silaghi
01/06/2017

2
Acknowledgements:
To my supervisor, Florina Silaghi, for her great commitment, guidance and useful
comments to complete this thesis. To my mum, for her continuous encouragement and
support throughout my studies.

3
ABSTRACT
The aim of this study is to examine the impact of female board members on firm
performance by focusing on Spanish companies. We are interested in Spain because
despite being the second country to implement legislative actions on this topic, its
proportion of women in the boardroom remains below the European average.
Previous empirical evidence is mixed, finding a positive, negative or no relationship
between the number of women directors and economic gains. We perform OLS and
panel data regression models by using a sample of 36 firms listed on the Mercado
Continuo Español’s stock market, over the period 2011-2015. We find that there is a
positive and statistically significant relationship between ROA or Tobin’s Q and the
female on board variable, which indicates that women directors can positively influence
business results.
Keywords: Financial Performance, Gender-Diverse Boards, Women Directors, Firm
Value, Female on Board.

4
TABLE OF CONTENTS
ABSTRACT ..................................................................................................................... 3
1. INTRODUCTION ........................................................................................................ 5
2. REVIEW OF EXISTING THEORIES AND EVIDENCE ....................................... 7
2.1 Theoretical background .......................................................................................... 7
2.1.1 Hypothesis development ................................................................................... 7
2.1.2 Theoretical perspectives of women on boards ............................................... 10
2.2 Review of empirical literature ......................................................................... 12
2.2.1 US ................................................................................................................... 12
2.2.2 Europe ............................................................................................................ 13
2.2.3 Spain ............................................................................................................... 15
2.3 Institutional framework .................................................................................... 17
3. EMPIRICAL ANALYSIS .......................................................................................... 22
3.1 Data analysis ......................................................................................................... 22
3.1.1 Data collection ............................................................................................... 22
3.1.2 Variable definition.......................................................................................... 22
3.1.3 Descriptive statistics ...................................................................................... 24
3.1.4 Trends ............................................................................................................. 25
3.2 Methodology ......................................................................................................... 33
3.3 Results and discussion .......................................................................................... 34
4. CONCLUSIONS ........................................................................................................ 40
5. BIBLIOGRAPHY ...................................................................................................... 42
APPENDIX .................................................................................................................... 49
Appendix 1: EU countries regulation of gender balance on corporate boards ........... 49
Appendix 2: Variable definition ................................................................................. 51
Appendix 3: Firms in the sample sorted by sector ...................................................... 52
5
1. INTRODUCTION
Board gender diversity has become a widely discussed topic within corporate
governance. Despite there has been a decisive trend to promote women at top
management positions and some advances have been achieved, a vast majority of
boardrooms are still composed of male directors (Jourová, 2016).
Spain was the second country to set out legislative actions that fostered the
incorporation of more female members at executive levels, but the fraction is currently
still low if compared to other European countries. On the contrary, Norway and other
early adopters have recorded outstanding figures since the enactment of their respective
policies (Berger, Kick and Schaeck, 2014). In this context, the need to investigate the
effects of this legal implementation has become crucial; more concretely, the financial
impact of having Women On Corporate Boards (WOCB hereafter) is one of the issues
that have attracted growing research interest in recent years, but no homogenous results
have been concluded yet.
According to previous literature, there are several channels predicting a positive effect
against a few stating the opposite. For instance, it is said that women can contribute to
decision-making because more diverse insights can be considered, though that might
sometimes lead to higher coordination costs. Similarly, some theories address the
existence of a positive relationship between gender-diverse boards and financial
performance (Lückerath-Rovers, 2013; Terjesen, Sealy and Singh, 2009). Furthermore,
some authors such as Smith, Smith and Verner (2005) and Campbell and Mínguez-Vera
(2008) show empirical evidence supporting these arguments. Nonetheless, other
researchers claim that there exists a negative relationship (Ahern and Dittmar, 2012);
whereas Adams and Ferreira (2009) and Carter, D’Souza, Simkins and Simpson (2010)
find no connection. Recently, Laffarga, Pilar and Reguera-Alvarado (2015) have found
a positive relationship based on a Spanish sample too, and they attribute it to the fact
that women are more risk-averse than men, as they tend to propose less aggressive and
more sustainable investment strategies. However, it is worth noticing that their sample
relates to a period prior to the introduction of legal measures that foster gender diversity
in boards by the Spanish government, so we take a more recent one.

6
Under this framework, this study provides new evidence on the relationship between an
increased fraction of women in the boardroom and firm performance. Our objective is to
analyze whether the presence of female board members positively affects financial
outcomes. Hence, we minimize endogeneity by employing panel data methodology
when running the regression models. As we are especially interested in the Spanish
case, we use a dataset of companies listed on the Mercado Continuo Español’s stock
market during the period 2011-2015. Overall, our results suggest that having WOCB in
Spain is positively associated with financial performance measured by ROA, and in
general also by Tobin’s Q. An outstanding finding though is that this only holds when
we account for omitted variables in the previous literature, such as board specific skills.
The structure of this thesis is as follows. The theoretical part is split into two main
sections. The first one consists of the theoretical background, including the main
assumptions and theories advocating the existence of the gender diversity-performance
and of the gender diversity- risk taking relationship. The second one is the review of the
empirical evidence, synthetized by three main geographical areas. Next, an overview of
the enacted legislation concerning WOCB across countries is provided, as well as the
evolution of results in Europe. In the empirical analysis we focus on the gender
diversity-performance relationship. This practical part is divided into three main
sections: in the first one we analyze the dataset and identify some trends, while in the
second we explain the followed methodology to obtain the results, which are exhibited
in the last section. Finally, we provide a conclusion for the thesis, as well as the
consulted bibliography and further information in the appendix.

7
2. REVIEW OF EXISTING THEORIES AND
EVIDENCE
2.1 Theoretical background
The board of directors is one of the most influential governance mechanisms in an
organization as regards strategic decision-making. Among their large range of functions,
the most relevant ones comprise: “monitoring and controlling managers, providing
information and counsel to managers, monitoring compliance with applicable laws and
regulations, and linking the corporation to the external environment” (Carter et al., pp.
398, 2010). Therefore, the composition of the board is expected to affect the overall
performance of a firm, which might be influenced by corporate risk-taking.
The role of gender-diverse boards has recently been given a special focus when it comes
to research on this relationship, which suggests the willingness and importance to figure
out whether this assumption holds. Due to this reason, our theoretical section
concentrates on investigating the effect of female board members on both corporate
risk-taking and economic results.
2.1.1 Hypothesis development
After careful review of previous literature, we identified several channels predicting a
positive and negative effect. More concretely, six factors correspond to potential
benefits for having WOCB, whereas just three relate to potential costs.
Advantages
1. Attract external talents “Women directors are role models who inspire others”
(Terjesen et al., pp 328, 2009). As stated in Marinova, Plantenga and Remery
(2010), research based on institutional legitimacy theory1 claims that the number of
female top managers may influence positively the career development of women in
lower positions, as it involves attracting well qualified candidates from sources
different than the usual ones and reduces the influence of old boys’ network (Rose,
2007).
1 A theory at the firm’s level which claims that there is a positive relationship between female corporate board
members and overall female workers in a company (Terjesen et al., 2009).

8
2. Eliminate tokenism2 Tokenism is likely to take place whenever there is just one
woman or one member of a minority group, as the token members may feel isolation
and pressure to adopt stereotyped roles (Terjesen et al., 2009). According to some
studies, “a critical mass is necessary to realize fully the benefits of diversity on
corporate boards” (Packel and Rhode, pp. 409, 2015). Hence, gender diversity in the
boardroom contributes to increase transparency of selection, by demonstrating to
lower-level employees that the chance to fulfill highest positions in the firm depends
only on their respective skills and qualifications rather than on other variables
(Rose, 2007).
3. Improve company image and stock value Given the current trend of socially
responsible investments, investors are encouraged to consider gender equality in the
boardroom as a positive variable. As Laffarga et al. advocate, the consequences are
that “the economic results, the media visibility, and the demonstration of
commitments with respect to social and ethical concerns, will boost and result in a
higher demand of stocks and an increase in their price” (pp.2, 2015; Adams, Grey
and Nowland, 2011). Moreover, Adams and Ferreira (2009) claim that the more
gender-diverse the board is the more equity-based compensation in the company.
Hence, appointing women in the boardrooms may result in an enhancement of the
company’s reputation because it sends positive signals to stakeholders such as
consumers, suppliers and the community (Rose, 2007).
4. New insights and creativity A balanced proportion of women and men in
leadership positions can positively contribute to problem-solving because more
diverse alternatives and perspectives are evaluated: “By taking a broader view, the
board will have a better understanding of the complexities of the business
environment and thus improve decision-making” (Campbell and Mínguez-Vera,
pp.440, 2008). Furthermore, creative ideas and innovation may arise as a result of
having access to a wider range of information sources (Ferreira, 2010).
5. Positive influence on men’s behavior Research from Adams and Ferreira
(2009) not only argues that female directors have better attendance records than
males, but that males’ attendance is likely to improve the more gender-diverse the
board is. Moreover, they also claim that female directors are mainly associated with
monitoring committees rather than with other types, such as nomination and 2 Applied to the business context, tokenism is the practice of hiring a person who belongs to a minority group in order
to prevent criticism against the company image and prove employees are treated fairly (Lückerath-Rovers, 2013).
9
compensation committees. Overall, their conclusions suggest women positively
influence men’s behavior and higher efforts to monitoring tend to be observed in
gender-diverse boards.
6. Orientation towards Corporate Social Responsibility (CSR) Women possess
some traits which may enhance board oversight of firm strategy, such as sensitivity
towards others and the ability to handle with interests of multiple parties (Huse and
Nielsen, 2010). It is not surprising then that gender-diverse boards achieve more
effective communication levels among the board and its stakeholders. For instance,
they emphasize both customer and employee satisfaction, innovation and gender
equality measures (Terjesen et al., 2009). In this context, it is worth highlighting that
female directors are often associated with sectors in close proximity to final
customers and soft managerial areas, such as CSR, Marketing and Human
Resources (Gimeno, Mangas and Mateos de Cabo, 2007; Huddleston, Runyan and
Swinney, 2006; Rao and Tilt, 2016).
Disadvantages
1. Coordination costs Despite heterogeneous opinions may turn out in better
quality decisions, coordinating and reaching consensus can be more time-
consuming. Therefore, if the company operates in a quick-response market these
costs may not offset the advantages of a diverse board, and they would rather lead to
a less efficient decision-making body and competitive behaviour (Marinova et al.,
2010; Smith et al., 2005).
2. Conflict and lack of communication “A more diverse board may be in greater
risk of being influenced by directors with distinct personal and professional
agendas” (Ferreira, pp.229, 2010). Indeed, dissimilarities in interests often involve
conflict and a reduction in group cohesiveness. Similarly, information flows may be
harmed when members do not share the same values (Packel and Rhode, 2015).
3. Choosing inadequate directors It is often argued that not only demographic
characteristics such as age, gender or ethnicity should be taken into account when it
comes to equality in the board. In the context of gender quotas, relying just on
demographical factors is sometimes seen as a drawback because other relevant
backgrounds such as education, qualifications and training are not considered. For
example, it is said there is a short supply of qualified females who could join top

10
executive positions because they are likely to be younger and less experienced in the
business field than their male counterparts3 (Ferreira, 2010; Terjesen et al., 2009).
2.1.2 Theoretical perspectives of women on boards
Terjesen et al. (2009) summarized several theoretical contributions on this topic and
provided a better grasp in WOCB’s relationship with financial performance by
describing two main theories at the firm’s level:
Agency theory It explains the relationship between a principal (e.g. shareholder)
and its agent (e.g. directors or managers) by assuming outside directors are good
monitors for shareholders’ interests because they work separately from inside
directors (Terjesen et al., 2009). In this sense, costs such as asymmetric information,
opportunistic behavior and incomplete contracts can be significantly reduced with
an adequate board of directors, which aligns the interests of both managers and
shareholders (Laffarga et al., 2015). Therefore, it suggests diverse directors, who
may be better monitors of management as they are able to consider a larger range of
perspectives, influence firm value. Adams and Ferreira (2009) advocate this theory
by arguing that female directors are austere monitors and more active, which in turn
impacts corporate governance. However, whether a tighter monitoring leads to
positive or negative outcomes is still questionable, so this theory is not a good
indicator for WOCB’s relationship with financial performance (Carter et al., 2010).
Resource dependency Highly supported by Carter et al. (2010), this theory
states diversity in the board improves information due to the uniqueness of its
source. It assumes better financial performance is achieved thanks to the
appointment of different corporate directors, who are selected in order to maximize
access to critical resources and connections (Ferreira, 2010). In fact, they are used
as a linkage mechanism to expand not only relations with stakeholders, such as
competitors and customers (Funch, Munch-Madsen and Rose, 2013), but also
knowledge about the industry and finance prospects (Laffarga et al., 2015). Overall,
this linkage involves four main advantages: firstly, it may provide the company with
useful information; secondly, it is an adequate channel for communication purposes;
thirdly, it obtains commitments of support from important elements of the
environment; and fourthly, it legitimizes companies (Lückerath-Rovers, 2013).
3 Evidence on women human capital theory indicates they are just as well qualified as men in terms of education level
and other important qualities, but less likely to have significant experience as business experts (Terjesen et al., 2009).
11
Finally, this theory justifies why female directors are usually found in customer-
oriented business, as gender diversity not only enhances stakeholders’ relations but
also firm’s reputation and performance (Dang and Nguyen, 2016).
Additionally, some authors such as Carter et al. (2010) and Lückerath-Rovers (2013)
aim at demonstrating a more solid and realistic possibility of this link. For this reason,
they develop an interdisciplinary approach by focusing as well on theories at the
individual level, such as human capital, and at the board level, such as social
psychology.
Human capital Related to resource dependency, this theory explores how education,
skills, and experience of employees can affect organizations (Carter et al., 2010).
Because gender diversity involves unique access to resources, firm value may increase.
Social psychology It predicts board diversity can positively influence decision-
making dynamics, and consequently business performance, by encouraging
miscellaneous thinking, in spite of the boundless power of majority status individuals
(Carter et al., 2010). Nevertheless, Campbell and Mínguez-Vera (2008) claim that
divergent opinions might turn out to be slower and less effective.
On the other hand, no theories are related with female board members and corporate
risk-taking. Rather, Faccio, Marchica and Murac (2016) advocate the existence of three
main channels, which will be further discussed in the review of empirical literature:
1. Firm risk This hypothesis derives from the fact that a considerable number of
female CEOs tend to be hired by companies with low leverage trends or those
willing to undertake less risk. Therefore, women in top executive positions such as
corporate boards are often associated with risk-averse decisions and firms.
2. Self-selection As causality can run in either one direction or the other, it could
also be that women are prone to work in low risk or more stable firms.
3. Biological and/or environment-driven factors Different risk attitudes can arise
depending on more complex elements, such as preferences or overconfidence.
Hence, corporate risk-taking can be explained by external forces affecting gender,
which build and model the framework for a given behavior.

12
To conclude, whereas both resource dependence and human capital theory indicate there
may exist the possibility of a positive relationship between gender diversity on
corporate boards and financial performance depending on the situation, agency and
social psychological theory do not provide a clear support for it. In fact, there are
limited empirical analysis attempting to clarify whether the sign could be negative or
positive (Carter et al., 2010; Lückerath-Rovers, 2013). Moreover, the three channels
regarding women risk-taking point out the difficulty in predicting the direction of
causality, due to factors beyond the reach of the internal business scenario.
2.2 Review of empirical literature
Evidence on whether WOCB positively or negatively affect company performance
varies across countries, and the same trend is found for studies related to risk-taking.
To provide a better grasp of the wide empirical background, this section organizes the
literature in three main geographical areas: US, Europe and Spain.
To begin with, it is worth examining previous empirical studies from the US, as most
research on this topic has been based on data extracted from this country and its biggest
firms. Secondly, the case of Europe has gained more interest during the recent years, so
a large extent of contributions mainly based on Nordic countries help to understand
different dynamics. Finally, as this project aims at examining the Spanish case, a special
focus is given to the existing literature in this country.
2.2.1 US
Performance
Non-peer-reviewed publications such as Catalyst and The McKinsey report are among
the first to address the existence, although not statistically significant, of a positive
relationship between female top managers and company performance (Lückerath-
Rovers, 2013). Subsequently, Huddleston et al. (2006) collect the results from small
business entrepreneurs in one Mid-western state and find that female business owners,
both at male-dominated and female-dominated business types4, register superior
business performance when their education is beyond the high school level.
4 “Retail and service industries account for more than 80 percent of female entrepreneurs’ fields of operation”
(Huddleston et al., 2006).

13
On the other hand, Adams and Ferreira (2009) argue too much monitoring5 can reduce
shareholder value when companies have few takeover defenses. Therefore, there is not
enough evidence that regulations enforcing quotas for women on boards lead to a higher
firm performance. Finally, according to Carter et al. (2010) appointing women and
ethnic minorities to corporate boards does not imply any significant effect on
performance, so again they underpin gender quotas do not seem to be the convenient
way of improving business results.
Risk-taking
Huang and Kisgen (2013) predict male executives are more overconfident than females
because the last ones are, among other findings, less likely to make early acquisitions or
issue debt. In addition, Gonzalez and Sila (2014) assert that firm-level equity risk can be
substantially reduced the more male directors interact with female directors. Thus, they
suggest WOCB can positively impact firm decisions and stability in spite of their
minority status. Similarly, greater gender diversity on the board together with other
factors such as a smaller board size, greater board independence and lower
concentration of institutional ownership, involves a lower default risk according to Cao,
Davalos, Feroz and Leng (2015).
Nonetheless, Adams and Ragunathan (2013) not only state that banks with a larger
number of women on boards are more likely to be risk-lovers, but also that they show
better performance records. In line with Adams and Funk’s (2012) argument, they
reflect risk-aversion research is misleading because it is usually based on general
population samples, while they find that the pool of female corporate leaders in finance
appears to be very different from other women.
2.2.2 Europe6
Performance
Smith et al. (2005) perform a panel data study of 2,500 of the largest Danish companies
and find that a higher fraction of women among top executives and on boards of
5 Adams, Hermalin, and Weisbach (2010) also support women are more oriented towards monitoring by confirming
the tendency to find them in diversified companies, which devote more time to this activity, rather than to strategic
issues as in growing companies.
6 Spain is excluded from this section but it is explained in detail afterwards, as it allows to highlight previous
evidence on the country of interest.

14
directors is likely to boost financial outcomes. Some remarkable traits are that this
positive relationship mainly takes place when female managers have university
education or they are elected by the staff. Furthermore, businesses with a clear
customer-orientation (e.g. service and retail industry) and with at least one top executive
female possess a larger share of women among the overall staff than do others. More
recently, Lückerath-Rovers (2013) shows that companies with women directors on their
boards perform better than those without from a Dutch perspective, and associates it to
resource dependency theory. Similarly, a longitudinal analysis of 91 Danish
municipalities carried out by Opstrup and Villadsen (2014) indicates gender diversity in
the top management team leads to better economic performance as long as integration
and discretion measures at the group’s level, such as teamwork, freedom of judgment
and shared responsibilities, are encouraged by the organizational structure.
Notwithstanding the foregoing, Ahern and Dittmar (2012) provide evidence of a
negative association from a Norwegian point of view, given the lower job experience of
women. Hence, they claim mandatory board member gender quotas in this country
resulted in a performance deterioration because corporate leaders were not freely chosen
as requested by resource dependency theory.
Unlike the previous studies, Oxelheim, Randøy and Thomsen (2006) suggest gender-
diverse boards have no impact on stock market valuation and profitability when
investigating a sample of the largest companies in Scandinavia (Denmark, Norway and
Sweden). Despite no negative financial outcomes are found, value destruction may arise
if gender diversity is aimed at expanding the board’s size. In this paper, they also reveal
Denmark is the country with the lowest share of WOCB and older members. Consistent
with this, Rose (2007) shows no substantial linkage between educational, ethnical and
gender-diverse boards and firm performance when examining only listed Danish firms.
Later on, Marinova et al. (2010) explore the Dutch and Danish business scenario and
come up with no clear evidence for the concerned relationship, while Huse and Nielsen
(2010) report the same results when using a Norwegian sample, though they do find
another linkage between WOCB and board control. Reinforcing these findings, Funch et
al. (2013) use a sample of the major listed firms in the Nordic countries and Germany to
suggest again gender diversity has no effect on corporate performance and it can
negatively influence it only if board’s size is expanded, whilst homogeneous ethnicity

15
on boards appears to improve it. Latterly, Dang and Nguyen (2016) confirm the impact
varies from positive to negative depending on the chosen performance measure, based
on data from French listed companies. As in Adams and Ferreira (2009), they also find
that female directors may damage company value when there are strong governance
mechanisms and high profitability.
Risk-taking
Parrota and Smith (2013) advocate, although not providing any causal effect, that
female-led firms in Denmark tend to show less volatile investments, return on equity,
profits and sales compared to those run by males. This is consistent with Faccio et al.
(2016) results, who demonstrate female CEOs are usually associated with less risky
firms in their large sample of European companies. Some of their findings include
financing and investment choices are not as risky as the ones taken by their male
counterparts, as well as transitions from male to female CEOs in a specific firm are
likely to diminish risk-taking. Additionally, highly profitable and older firms tend to
hire more women according to their research.
On the other hand, Adams and Funk (2012) document women directors in Sweden are
slightly more risk-loving than both other women in the general population and male
directors. One of the most distinguishable traits of this sample is that female managers
seem to be more open to change and environmentally and socially concerned than the
other groups tested. This is mainly due to self-selection, as women who choose to be
managers are considerably different from all the rest. Moreover, evidence from Berger
et al. (2014) reveals risk-taking increases when there is a higher proportion of young
and female executives, but declines when appointing people possessing PhD degrees. In
their empirical analysis, women directors in Germany self-select into banks which
already have a female CEO due to the glass ceiling effect: career growth is difficult for
women and therefore means they suffer from a higher risk exposure.
2.2.3 Spain
Performance
Focusing on a Spanish context, Campbell and Mínguez-Vera (2008) demonstrate that
firm value may be positively influenced by a right balance on board gender diversity
rather than by the presence of WOCB itself. Furthermore, they prove that reverse
causality does not hold and Spanish investors are willing to invest more in companies
16
with female directors. Later on, they analyze the short-term and long-term stock market
reaction to the appointment of female directors by using an event study and the system
GMM estimation procedure respectively. Because the market value of firms is
positively affected, they suggest that female directors add value (Campbell and
Mínguez-Vera, 2010). In line with these findings, García (2010) shows business
technical efficiency increases the more heterogeneous the board is, whereas a study
carried out by Apesteguia, Azmat and Iriberri (2012) advocates mixed teams in terms of
gender show the highest performance and the best group dynamics. More recently,
Martín-Ugedo and Mínguez-Vera (2014) examine SMEs in Spain and state that the
presence of females on boards leads to higher economic gains. In addition, in their full
sample women directors tend to be found in firms with substantial value and when a
family member is a shareholder. Lastly, Laffarga et al. (2015) support gender quotas by
also documenting a positive relationship between WOCB and financial results based on
a sample of 125 non-financial companies listed on the Madrid Stock Exchange during
2005-2009.
Nevertheless, Martín and Mínguez-Vera (2011) report a negative impact on economic
gains when analyzing non-financial SMEs. They also show that women on boards are
usually found in family firms and those which have a financial institution as the main
shareholder, as well as in firms with less debt, more assets and larger boards.
Opposite to the previous findings, Gallego, García and Rodríguez (2010) claim that
board gender diversity does not necessarily influence company performance. By using
several market and accounting measures for a sample of the largest 117 firms, no
significant relationship is observed.
Risk-taking
There exists little research on this topic based on the Spanish market, but the results
point out that women are considerable more risk-averse than men.
Some interesting findings can be attributed to Karande and Zinkhan (2002). In their
paper, they do not explicitly test directors, rather they compare a Spanish and American
sample of MBA students. Despite the first one turns out to be less risk-averse than the
second, women in both nationalities tend to be more conservative in risky scenarios.
Hernández, Martín-Ugedo and Mínguez-Vera (2015) provide similar evidence when
examining both CEOs and board members of small start-up firms, finding that debt
17
financing is likely to diminish as the presence of females increases. Therefore, they
conclude gender-diverse boards are more stable because they allow the company to
reduce its cost of the debt and increase its debt maturity.
In conclusion, most of previous research in the geographical areas of interest suggest
WOCB have a positive impact on firm performance, with some exceptions drawing
negative or neutral conclusions. As regards female risk attitudes, there are mixed results
according to North-American and overall European studies, whereas Spanish evidence
underpins women exhibit risk-averse behaviour. This ambiguity may be due to the
differing time periods and institutional contexts. Besides, estimation methods for
financial performance and risk-taking seem to vary and there may exist other
unobserved factors.
2.3 Institutional framework
Country characteristics and institutional environment play an important role for shaping
both corporate governance regulation and women directors’ features. As observed in
Terjesen et al. (2009), countries with a larger proportion of women in the boardroom
tend to have females in senior management and legislature levels, as well as smaller
gender pay gaps. Then, if a given country exhibits difficulties for women in pushing
forward to executive positions, there is room for its female directors being much more
risk-lovers than in others (Adams and Funk, 2012).
To promote the representation of WOCB, enacted legislation across countries generally
consists of a set gender quota (33–50 %), time frame (3–5 years), and sanctions for non-
compliance (Aguilera, Lorenz and Terjesen, 2015).
In 2012, the European Parliament proclaimed a legislative initiative aimed at the
underrepresented sex filling 40% of supervisory and executive positions of European
firms listed on stock exchanges by 2020 (Berger et al., 2014; Jourová, 2016).
In 2006, Norway became the first country in the world to set such a law, demanding this
quantitative target to all its public-limited firms by 2008 and forcing them to dissolve

18
otherwise7. As of today, this strong penalty has been already removed because the effect
of the gender balance regulations has been full (Izquierdo, Möltner and Morten, 2016).
In Denmark, a new rule concerning approximately 1100 of its biggest private and public
companies8 came into force in April 2013. The covered companies are obliged to self-
regulate and set their own targets and time frame as in Sweden, by providing
information on the reported gender inequality in both the board of directors and other
management levels. It is worth taking into account that no punishment arises in case of
non-compliance with the committed target figure, whilst SMEs, which account for a
large proportion of the businesses as in Spain, are exempt of applying this policy
(Hastings, 2013).
Similarly, the Netherlands enforced another self-regulated and “soft9” law but
requesting a 30% target. More recently, Austria, Belgium, France, Germany, Greece
and Italy have adopted this regulation in their respective corporate governance codes,
though the measures and conditions vary because the European Commission, to some
extent, allows the member countries to “flexibly” implement it (See Appendix 1).
Other countries such as Australia, China and India have also started disclosing gender
diversity policies to foster the participation of females in executive levels (Rao and Tilt,
2016).
Focusing on Spain, it was the second country in the world to set out gender balance
legislation on corporate boards by introducing the so-called ‘‘Law of Equality’’
(Organic Law 3/2007) (Izquierdo et al., 2016). It consisted of a comply-or-explain type
law calling for public limited companies with 250 or more employees to reach the 40%
target by 2015, including both executives and non-executive boards (Rao and Tilt,
2016). However, the figure was not achieved due to the fact it did not apply to SMEs
firms, which represent 99% of all Spanish businesses and account for 80% of
employment (Baixauli-Soler, Lucas-Pérez, Martín-Ugedo, Mínguez-Vera and Sánchez-
7 This implied many companies decided to either leave the country or shift to private. In 2009, the number of public
limited firms in Norway was less than 70 percent of the number in 2001. In contrast, the number of private limited
firms, hence not affected by the quota, rose by over 30 percent (Ahern and Dittmar, 2012).
8 “If exceeding two of these criteria in two consecutive financial years: Balance sheet total of DKK 143 million;
Revenue of DKK 286 million; or Average number of employees of 250” (Hastings, P., pp 71, 2013).
9 Soft mechanism which does not entail any statutory penalty for firms in the event of non-compliance. It can also be
referred to as a “comply-or-explain” type law.

19
Marín, 2015), and it was attempted at stimulating companies to develop their own
gender parity policies rather than at imposing sanctions10
. Consequently, in 2014 the
Spanish government decided to shift towards a “flexi-quota” in an attempt of emulating
the Nordic behavior, characterized by a successful voluntary style. In this new
framework, the 40% compulsory figure has been substituted by a 30% recommended
quota which does not apply anymore to all large companies, but just to listed ones.
In other words, firms are now obliged to give convenient explanations in case the
recommended quota is not achieved, as in Denmark, but without setting a number or
any objective within a specific time reference (Izquierdo et al., 2016).
Consequences in Europe
Figure 1 exhibits that, as of April 2016, WOCB belonging to the largest publicly-listed
companies in the EU-28 Member States account for an average 23%. Currently, just ten
countries (Belgium, Denmark, Finland, France, Germany, Italy, Latvia, the Netherlands,
Sweden and the United Kingdom) record females for at least a quarter of their board
members.
Figure 1. Percentage of female board members of the largest listed firms in the EU-
28. April 2016.
Source: made by the author, based on data from the European Commission 10 “In May 2012, an award was given to 30 companies including Acciona Ingeniería, S.A., Banco Bilbao Vizcaya
Argentaria, S.A., CaixaBank, S.A. and Ernst & Young, S.L. Moreover, certain Autonomous Regions also established
awards for companies that comply with local equality regulations” (Hastings, P., pp 98, 2013).
37
36
30 30 28 28 27 27 27 27
24 22
20 20 20 18
16 14 14 13 13
11 11 10 9 9 8 5 0
5
10
15
20
25
30
35
40
Fra
nce
Sw
eden
Ital
y
Fin
lan
d
Lat
via
Net
her
lan
ds
Bel
giu
m
Den
mar
k
Ger
man
y
Un
ited
Kin
gdo
m
Slo
ven
ia
Cro
atia
Spai
n
Au
stri
a
Pola
nd
Bu
lgar
ia
Irel
and
Port
ugal
Slo
vak
ia
Lit
hu
ania
Lux
emb
ou
rg
Cy
pru
s
Hu
ng
ary
Ro
man
ia
Cze
ch R
epu
bli
c
Gre
ece
Est
on
ia
Mal
ta
Country EU-28

20
As observed in Figure 2, the 2010-2016 raise in the share of women on boards is
significantly bigger than the one in the years before the application of the policy by the
member states11
. Despite the most successful change figures seem to be achieved in
countries which have already adopted the EU regulation in their National Corporate
Governance Codes (e.g. Italy +25.5 pp) (Jourová, 2016), Spain is surprisingly growing
at a very slow pace, roughly reaching 17% female directors in 201412
. Thus, Spain is
characterized by a slight evolution on incorporating female members in the boardrooms,
with yearly outcomes far below the respective EU average.
Figure 2. Percentage of female board members in Spain and the EU-28.
Years 2010-2016.
Source: made by the author, based on data from the European Commission
Turning to the Nordic countries (See Figure 3), the results are overall remarkedly
successful and surpass by far the EU average in all cases. In Finland and Norway, the
fraction of female board members has been kept at figures close to 29% and 42% during
the last six years. By contrast, in Sweden and Denmark it has steadily risen, reporting
26% and 18% in 2010 while 33% and 27% respectively in 2016. These are just modest
growths if compared to Iceland though, which shows a variation from 16% to 44%
during the concerned period.
11 From 2003 to 2010 an average increase of 0.5 pp/year, against 2.1 pp year from 2010 to 2016 (Jourová, V., 2016).
12 The deadline to reach the 40% gender quota was 2015, but in 2014 the figures were undoubtedly low.
10 11
12
15
17
19 20
12
14
16
18
20
23 23
0
5
10
15
20
25
2010 2011 2012 2013 2014 2015 2016
Spain EU-28
21
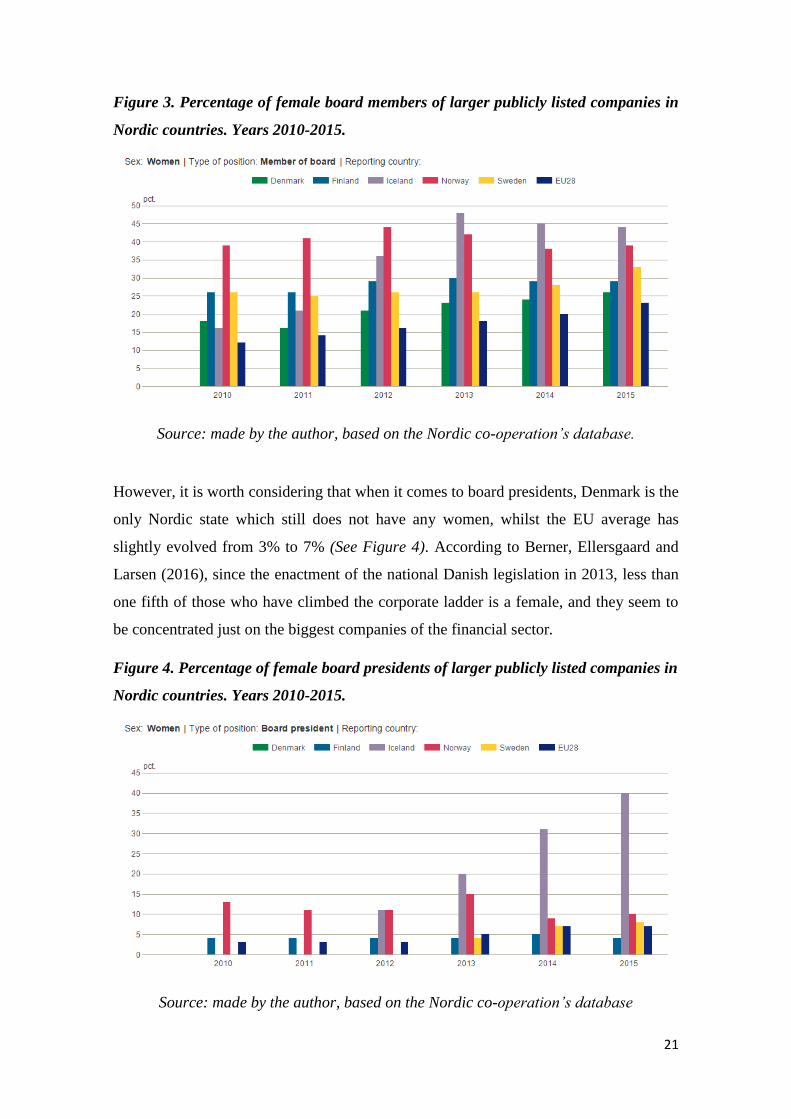
Figure 3. Percentage of female board members of larger publicly listed companies in
Nordic countries. Years 2010-2015.
Source: made by the author, based on the Nordic co-operation’s database.
However, it is worth considering that when it comes to board presidents, Denmark is the
only Nordic state which still does not have any women, whilst the EU average has
slightly evolved from 3% to 7% (See Figure 4). According to Berner, Ellersgaard and
Larsen (2016), since the enactment of the national Danish legislation in 2013, less than
one fifth of those who have climbed the corporate ladder is a female, and they seem to
be concentrated just on the biggest companies of the financial sector.
Figure 4. Percentage of female board presidents of larger publicly listed companies in
Nordic countries. Years 2010-2015.
Source: made by the author, based on the Nordic co-operation’s database

22
3. EMPIRICAL ANALYSIS
In this section we analyze empirically the relationship between WOCB and firm
performance. We will first describe the database that we use; we will next present the
methodology. Finally, we will discuss our results.
3.1 Data analysis
3.1.1 Data collection
Our data is collected from Thomson Reuter’s Datastream, a database which contains
firm performance and corporate governance information for companies all over the
globe. After careful review of all possible populations, we decide to take the firms
included in the Mercado Continuo Español’s stock market, ordered by highest to lowest
level of turnover. However, the final sample is limited to 36 firms13
because of missing
data related to the number of female on board, which is the variable of main interest.
Among these, it is worth noticing 29 companies are listed in the IBEX-35, and that we
effectively checked gender data related to the boards of directors was not available for
the remaining ones in the index.
This report is focused on recent trends concerning WOCB in Spanish companies; hence,
we decide to take a time series request consisting of the last available 5 years. That is,
we download information for the end of the years 2011 until 2015.
As previously mentioned, our empirical section just concentrates on the gender
diversity-firm performance link, so we do not take into account corporate risk-taking
figures. In total, we obtain 134214
board-firm-year observations for the selected sample.
3.1.2 Variable definition
This section provides the description of our variables, which are synthetized in
Appendix 2. After careful review of the missing values, we decide to consider just those
13 Unlike other authors (e.g. Adams and Ferreira (2009); Rose (2007)), we do not exclude companies in the finance
and insurance industry due to several reasons. First, financial firms are usually excluded because the high leverage
that is normal in this sector would probably indicate financial distress for non-financial firms. However, we do not
focus on leverage. Second, as Campbell and Minguez-Vera (2008) show, the financial sector is by far the leading one
regarding announcements of female appointments to board of directors. Finally, since this industry represents as
much as 25% of our sample, excluding these companies would lead to a substantial limitation of our sample size. We
are nevertheless aware that, as mentioned by Rose (2007), these firms are subject to special accounting standards,
thus results should be interpreted with caution.
14 See Table 1.

23
variables that are not significantly affected by this issue. All in all, we take 8 variables
and we group them in 3 main categories.
Independent variable
Because our study focuses on women situation in corporate boards, Female On Board is
the explanatory variable. It is automatically calculated in Datastream by computing the
total percentage of female directors in each firm’s board, which fits with previous
literature such as Laffarga et al. (2015). As mentioned previously, just 36 companies
provide information about it, so this is the variable that sets our sample and therefore
our framework for the analysis.
Dependent variables
According to Adams and Ferreira (2009), Carter et al. (2010), Campbell and Mínguez-
Vera (2008) and Laffarga et al. (2015) among others, financial performance can be
measured by 2 main proxies: ROA and Tobin’s Q.
1. ROA Return On Assets measures operating performance from an accounting
perspective relative to the company’s assets (Carter et al., 2010). This variable is
available in Datastream as a percentage, and it is computed in a different way
depending on whether the firm is a bank, an insurance company or any other firm in
the financial sector15
. However, the general formula comprises the company’s Net
Income over its Total Assets, which Datastream identifies as (Net Income – Bottom
Line + ((Interest Expense on Debt-Interest Capitalized) * (1-Tax Rate))) / Average
of Last Year's and Current Year’s Total Assets * 100.
2. Tobin’s Q Contrary to ROA, this indicator is not based on any accounting
prospect. Rather, it is said to be one of the best proxies for competitive advantage
because it indicates the market valuation of the firm. It relates a company’s market
value to its physical assets, measuring the market’s forecast for future earnings
(Laffarga et al., 2015). Therefore, when Tobin’s Q is high it means the financial
performance increases, and we compute it as the sum of Market Capitalisation plus
Total Liabilities16
, over Total Assets (Campbell and Mínguez-Vera, 2008). In other
words, it corresponds to the sum of Book Value of Debt plus Total Market
Capitalisation, over the Book Value of Equity plus the Book Value of Debt (Rose,
2007). These are all provided by Datastream, except for the Total Liabilities, which
15 See Appendix 2 for detailed formulas.
16 Due to the lack of data related to non-financial debt, the Total Labilities just include financial liabilities.
24
can be found by subtracting Total Assets minus Book Value of Equity. We calculate
this last one by multiplying the Book Value of Equity per share times the Total
Number of Shares.
Control variables
Within this group, we distinguish firm and board characteristics. Each of them consists
of 2 and 3 variables respectively, which are further explained in Appendix 2.
These variables have already been used by some renowned authors, such as Adams and
Ferreira (2009) and Carter et al. (2010), but we download an additional one which we
find interesting and potentially related to our field of study.
-Firm characteristics:
Fortunately, Datastream allows us to download not only common records such as Firm
Size (in terms of asset value17
), but also non-financial data such as the percentage of
Women Employees.
-Board characteristics:
We also control for the total members on the board (Board Size) and the percentage of
Independent Board Members. Finally, we include an additional variable displaying the
percentage of board members with previous industry knowledge (Board Specific Skills).
3.1.3 Descriptive statistics
Table 1 displays the Mean, Standard Deviation, Maximum and Minimum values for
both financial performance and corporate governance variables.
The standard deviation of the selected Key Performance Indicators (ROA and Tobin’s
Q) shows our sample comprises variable financial outcomes. For instance, whereas
there exist some companies with very low financial performance reporting negative
minimum numbers, there are others in the opposite extreme with outstanding results.
The rounded average number of female on board is just 15,21%, thus in line with the
previously mentioned trends in section “Consequences in the EU”. Moreover, the fact
that women employees in the sample represent roughly 36,92% on average reflects not
even half of the staff appears to be a female, though there is some exception because the
maximum value is 79,50%.
Regarding board characteristics, they can be composed by 7 up to 22 members, who
tend to be independent and with a considerable expertise on the sector. At the
17 Firm Size is expressed as the logarithm of total assets, as done in previous literature (Adams and Ferreira, 2009).

25
company’s level, on average firms have a size of 9,79 if measured by log assets, which
corresponds to an asset value of 100.979,9 million euros.
Table 1. Descriptive statistics.
Source: made by the author, based on information downloaded from Datastream
3.1.4 Trends
This section covers a selection of general trends for this specific sample. Different
tables and graphs are made according to our data, but just the most relevant are
explained below.
As observed in Figure 5, the firm which on average shows the largest proportion of
female on board across the concerned period is Red Eléctrica, which belongs to the
energy sector. Prosegur, Acciona, Iberdrola and Inditex follow the subsequent leading
positions, so at first glance it seems that activity sectors do not influence gender equality
on boards (See Appendix 3 for detailed information about sectors). In the opposite
extreme, some companies such as Gas Natural, Técnicas Reunidas or Cellnex report 0
women in their respective boardrooms.
Variables Number of observations Mean St.Dev. Min. Max.
Independent variable
Female On Board (%) 171 15,21 10,26 0,00 45,45
Dependent variables
ROA (%) 168 4,47 7,59 -19,28 41,87
Tobin's Q 171 1,53 1,27 0,77 7,86
Firm characteristics
Firm Size (thousands) 171 9,79 2,01 5,59 14,12
Women Employees (%) 159 36,92 15,62 9,32 79,50
Board Characteristics
Board Size 167 13,70 3,49 7,00 22,00
Independent Board Members (%) 165 42,37 18,82 9,09 88,89
Board Specific Skills (%) 170 38,67 15,94 8,33 100,00

26
Figure 5. Average percentage of Female On Board for each firm (2011-2015).
Source: made by the author, based on information downloaded from Datastream
Focusing on the evolution by activity sectors (See Figure 6), the textile is the one
displaying the uppermost results every single year. Actually, Inditex is the only
company in this sample operating in the textile industry, so the assumptions related to
the previous graph hold. Unlike the other ones, the proportion of women in the
boardroom is constant (27,27%) and therefore still far from the maximum value found
in the overall sample (45,45%).
Most sectors, such as the Wind, Energy, Communications, Infrastructure, Finance and
Insurance show increasing trends; whilst the Hospitality, Real Estate, Manufacturing
and ITC disclose a slightly dropping and uneven pattern.

27
Figure 6. Evolution of Female On Board by Sector (2011-2015).
Source: made by the author, based on information downloaded from Datastream
Another outstanding trend is exhibited in Figure 7. Not only is the textile sector the one
with the prevalent number of female board members, but also with the largest average
number of women employees as of 2015. Thus, our data is consistent with previously
mentioned hypothesis predicted by a wide variety of authors 18
, who stated that women
tend to be found in sectors operating close to end customers. By contrast, the wind
industry records the second minimal proportion of female staff but one of the highest
regarding female on board. Hence, assumptions stating that women holding top
executive positions attract women employees do not seem to hold19
.
18 See page 9. Section “6. Orientation towards Corporate Social Responsibility”.
19 See page 7. Section “1. Attract external talent”.
0,00
5,00
10,00
15,00
20,00
25,00
30,00
Average of 2011 Average of 2012 Average of 2013 Average of 2014 Average of 2015
COMMUNICATIONS ENERGY FINANCE & INSURANCE
HOSPITALITY INFRASTRUCTURE ITC
MANUFACTURING REAL ESTATE TEXTILE
WIND

28
Figure 7. Average Women Employees by Sector in 2015.
Source: made by the author, based on information downloaded from Datastream
Regarding board skills and industry background (see Figure 8), some of the sectors with
the greatest amount of WOCB also hold a top position in this category (e.g. Textile,
Communications, Finance and Insurance). However, the trend is counterbalanced by the
outcomes of Wind, Energy and ITC, so no hypothesis can be supported20
.
Figure 8. Average Board Specific Skills by Sector in 2015.
Source: made by the author, based on information downloaded from Datastream
20 See page 9, Section “3. Choosing inadequate directors”.
12%
7%
12%
12%
8% 8% 4%
13%
19%
5%
COMMUNICATIONS ENERGY FINANCE & INSURANCE
HOSPITALITY INFRASTRUCTURE ITC
MANUFACTURING REAL ESTATE TEXTILE
WIND
16%
8%
13%
6% 9%
13%
8%
6%
13%
8%
COMMUNICATIONS ENERGY FINANCE & INSURANCE
HOSPITALITY INFRASTRUCTURE ITC
MANUFACTURING REAL ESTATE TEXTILE
WIND
29
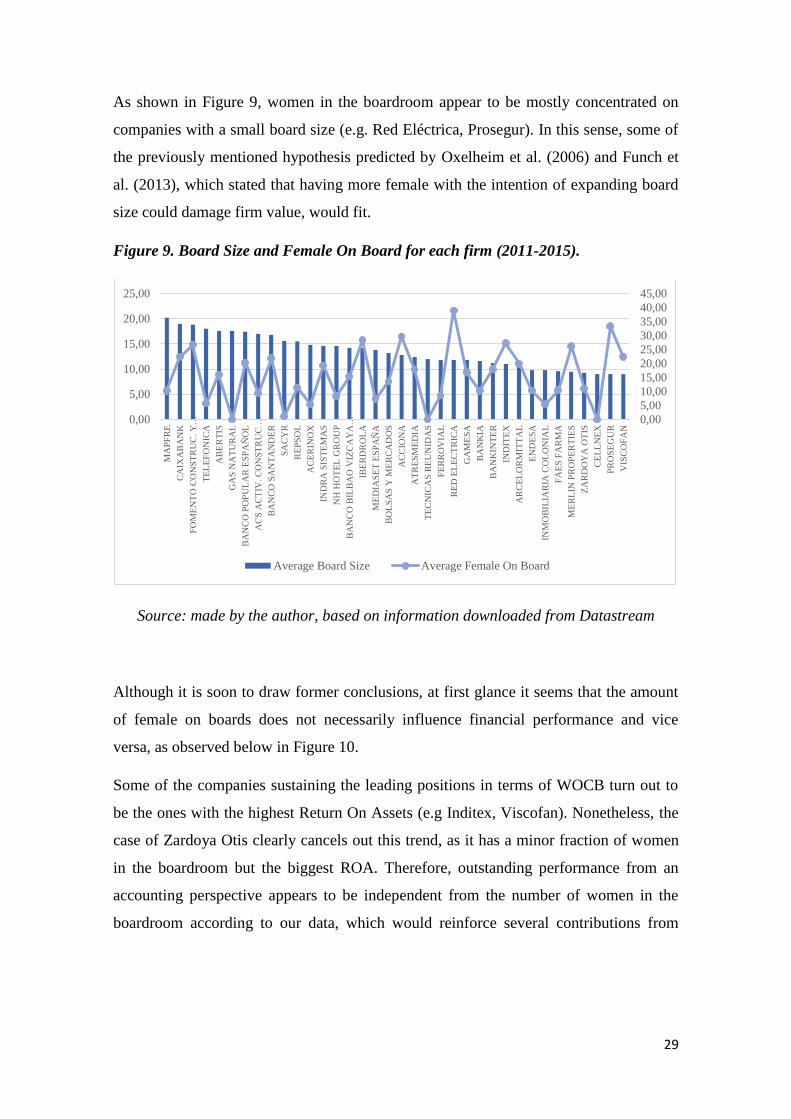
As shown in Figure 9, women in the boardroom appear to be mostly concentrated on
companies with a small board size (e.g. Red Eléctrica, Prosegur). In this sense, some of
the previously mentioned hypothesis predicted by Oxelheim et al. (2006) and Funch et
al. (2013), which stated that having more female with the intention of expanding board
size could damage firm value, would fit.
Figure 9. Board Size and Female On Board for each firm (2011-2015).
Source: made by the author, based on information downloaded from Datastream
Although it is soon to draw former conclusions, at first glance it seems that the amount
of female on boards does not necessarily influence financial performance and vice
versa, as observed below in Figure 10.
Some of the companies sustaining the leading positions in terms of WOCB turn out to
be the ones with the highest Return On Assets (e.g Inditex, Viscofan). Nonetheless, the
case of Zardoya Otis clearly cancels out this trend, as it has a minor fraction of women
in the boardroom but the biggest ROA. Therefore, outstanding performance from an
accounting perspective appears to be independent from the number of women in the
boardroom according to our data, which would reinforce several contributions from
0,00
5,00
10,00
15,00
20,00
25,00
30,00
35,00
40,00
45,00
0,00
5,00
10,00
15,00
20,00
25,00
MA
PF
RE
CA
IXA
BA
NK
FO
ME
NT
O C
ON
ST
RU
C. Y
…
TE
LE
FO
NIC
A
AB
ER
TIS
GA
S N
AT
UR
AL
BA
NC
O P
OP
UL
AR
ES
PA
ÑO
L
AC
S A
CT
IV.
CO
NS
TR
UC
.…
BA
NC
O S
AN
TA
ND
ER
SA
CY
R
RE
PS
OL
AC
ER
INO
X
IND
RA
SIS
TE
MA
S
NH
HO
TE
L G
RO
UP
BA
NC
O B
ILB
AO
VIZ
CA
YA
…
IBE
RD
RO
LA
ME
DIA
SE
T E
SP
AÑ
A
BO
LS
AS
Y M
ER
CA
DO
S
AC
CIO
NA
AT
RE
SM
ED
IA
TE
CN
ICA
S R
EU
NID
AS
FE
RR
OV
IAL
RE
D E
LE
CT
RIC
A
GA
ME
SA
BA
NK
IA
BA
NK
INT
ER
IND
ITE
X
AR
CE
LO
RM
ITT
AL
EN
DE
SA
INM
OB
ILIA
RIA
CO
LO
NIA
L
FA
ES
FA
RM
A
ME
RL
IN P
RO
PE
RT
IES
ZA
RD
OY
A O
TIS
CE
LL
NE
X
PR
OS
EG
UR
VIS
CO
FA
N
Average Board Size Average Female On Board

30
researchers all over the globe21
characterized by supporting neither the resource
dependency nor the human capital theory.
Figure 10. Female On Board and ROA for each firm (2011-2015).
Source: made by the author, based on information downloaded from Datastream
From a market valuation’s point of view (see Figure 11), the trends are pretty similar
and suggest as well that financial performance and female board members do not seem
to be interconnected.
Out of the top 5 companies in terms of female on board, just Inditex shows remarkable
results, whilst the first 4 display quite low ones. Additionally, companies with a small
share of women in the boardroom do not register a significant performance either. All
these observations, together with the fact that Zardoya Otis registers again the peak for
Tobin’s Q, lead us to think that the above-mentioned predictions could fit.
Notwithstanding the foregoing, this association needs to be explained by means of more
solid findings, so we cannot conclude the effect WOCB have on business results yet.
21 See page 12 “1.2 Review of empirical literature”
-5,00
0,00
5,00
10,00
15,00
20,00
25,00
30,00
0,00
5,00
10,00
15,00
20,00
25,00
30,00
35,00
40,00
45,00
RE
D E
LE
CT
RIC
A
PR
OS
EG
UR
AC
CIO
NA
IBE
RD
RO
LA
IND
ITE
X
FO
ME
NT
O C
ON
ST
RU
C. Y
…
ME
RL
IN P
RO
PE
RT
IES
VIS
CO
FA
N
CA
IXA
BA
NK
BA
NC
O S
AN
TA
ND
ER
BA
NC
O P
OP
UL
AR
…
AR
CE
LO
RM
ITT
AL
IND
RA
SIS
TE
MA
S
BA
NK
INT
ER
AT
RE
SM
ED
IA
GA
ME
SA
AB
ER
TIS
BA
NC
O B
ILB
AO
…
BO
LS
AS
Y M
ER
CA
DO
S
RE
PS
OL
ZA
RD
OY
A O
TIS
FA
ES
FA
RM
A
EN
DE
SA
MA
PF
RE
BA
NK
IA
AC
S A
CT
IV.
CO
NS
TR
UC
.…
FE
RR
OV
IAL
NH
HO
TE
L G
RO
UP
ME
DIA
SE
T E
SP
AÑ
A
TE
LE
FO
NIC
A
INM
OB
ILIA
RIA
CO
LO
NIA
L
AC
ER
INO
X
SA
CY
R
CE
LL
NE
X
GA
S N
AT
UR
AL
TE
CN
ICA
S R
EU
NID
AS
Average Female On Board Average ROA

31
Figure 11. Female On Board and Tobin’s Q for each firm (2011-2015).
Source: made by the author, based on information downloaded from Datastream
Figure 12 provides a better grasp of the yearly average evolution of female on board and
financial performance for all the firms during the concerned period.
The share of female in the boardroom shows a modest increasing pattern, so our results
are consistent with the data extracted from the European Commission in Figure 2.
Similarly, Tobin’s Q is also growing throughout the years, even though in 2014 we
appreciate a slight decline. This financial outline is pretty different from ROA though,
which exhibits a decreasing trend until 2013 but a rising one afterwards, and therefore
seems to be explained by the Spanish crisis effects.
0,00
1,00
2,00
3,00
4,00
5,00
6,00
7,00
8,00
0,00
5,00
10,00
15,00
20,00
25,00
30,00
35,00
40,00
45,00
RE
D E
LE
CT
RIC
A
PR
OS
EG
UR
AC
CIO
NA
IBE
RD
RO
LA
IND
ITE
X
FO
ME
NT
O C
ON
ST
RU
C. Y
…
ME
RL
IN P
RO
PE
RT
IES
VIS
CO
FA
N
CA
IXA
BA
NK
BA
NC
O S
AN
TA
ND
ER
BA
NC
O P
OP
UL
AR
ES
PA
ÑO
L
AR
CE
LO
RM
ITT
AL
IND
RA
SIS
TE
MA
S
BA
NK
INT
ER
AT
RE
SM
ED
IA
GA
ME
SA
AB
ER
TIS
BA
NC
O B
ILB
AO
VIZ
CA
YA
…
BO
LS
AS
Y M
ER
CA
DO
S
RE
PS
OL
ZA
RD
OY
A O
TIS
FA
ES
FA
RM
A
EN
DE
SA
MA
PF
RE
BA
NK
IA
AC
S A
CT
IV.
CO
NS
TR
UC
.…
FE
RR
OV
IAL
NH
HO
TE
L G
RO
UP
ME
DIA
SE
T E
SP
AÑ
A
TE
LE
FO
NIC
A
INM
OB
ILIA
RIA
CO
LO
NIA
L
AC
ER
INO
X
SA
CY
R
CE
LL
NE
X
GA
S N
AT
UR
AL
TE
CN
ICA
S R
EU
NID
AS
Average Female On Board Average Tobin's Q

32
Figure 12. Evolution of Female On Board and Financial Performance.
Source: made by the author, based on information downloaded from Datastream
Given that financial performance is measured differently for firms in the financial and
insurance industry, in Figure 13 we check how financial performance relates to female
on board focusing on 2 subsamples: finance and insurance, and the rest of the
companies.
On average, the financial and insurance sector disclose a superior number of WOCB but
a poorer business performance than the other industries. Their low financial results
might be due to the recent financial crisis together with the European sovereign debt
crisis. Indeed, the Spanish banks were very exposed to the real estate bubble and the
following mortgage defaults (Royo, Steinberg, Otero-Iglesias, 2016). The difference
could also be due to the different accounting standards that financial firms are subject to
(Rose, 2007).
0,00
2,00
4,00
6,00
8,00
10,00
12,00
14,00
16,00
18,00
20,00
0,00
0,20
0,40
0,60
0,80
1,00
1,20
1,40
1,60
1,80
2011 2012 2013 2014 2015
Average Tobin's Q Average ROA Average Female On Board

33
Figure 13. Female On Board and Financial Performance by Sectors (2011-2015).
Source: made by the author, based on information downloaded from Datastream
3.2 Methodology
We use two statistical methods to run the regressions in the software Stata: Ordinary
Least Squares (OLS) and panel data. This provides us with a more reliable picture, since
longitudinal data allows us to control for hidden variables, thereby avoiding
unobservable heterogeneity (Wooldridge, 2012).
As highlighted by many influential authors, endogeneity and reverse causality must be
addressed when examining the diversity-performance relationship of a set of companies
over a given period of time (Adams and Ferreira, 2009; Campbell and Mínguez-Vera,
2008; Carter et al., 2010; Laffarga et al., 2015). The first problem can be easily
overcome by using panel data, which partly mitigates endogeneity concerns caused by
omitted variables, such as unobservable firm or board characteristics. However, we are
not able to control for reverse causality, due to the additional advanced techniques out
of the scope for an undergraduate level, such as 2SLS and instrumental variables (IV).
An estimation by fixed effects is performed whenever unobservable heterogeneity is
correlated with the predictor variable, whilst the random effects methodology is
undertaken whenever the effects are not correlated with the explanatory variable. For
0,00
2,00
4,00
6,00
8,00
10,00
12,00
14,00
16,00
18,00
20,00
FINANCE & INSURANCE OTHERS
Average Female On Board Average ROA Average Tobin's Q

34
each model, we select the most convenient estimation approach thanks to the Hausman
test, which states as null hypothesis that the coefficients of both methods are similar,
meaning that if it is rejected we must apply fixed effects (Campbell and Mínguez-Vera,
2008). Besides, we apply robust standard errors in our OLS and panel data regressions
in order to control for potential heteroskedasticity in the dataset (Wooldridge, 2012).
We run the following regression models:
OLS: Yit=β0+β1Xit+β2Zit+εit ; Panel data: Yit=β0+β1Xit+β2Zit+ηi+εit
As explained previously, our dependent variable (Y) stands for Tobin’s Q or ROA,
whereas the independent variable (X) denotes Female On Board. Moreover, “Z” refers
to our control variables, which include a selection of firm and board characteristics.
There are two types of error terms: “ε” describes the one that varies over time and
therefore it is included in both models, whilst “η” represents the firm fixed effects,
which stay constant over time and hence can only be considered in the panel data
equation. Finally, “i” and “t” stand for firm and time period (in years) respectively.
3.3 Results and discussion
Before running the regressions we compute the correlations between the variables in
order to check for multicollinearity. The pair-wise correlation matrix can take values
from -1 (perfect negative correlation) to 1 (perfect positive correlation), and it indicates
multicollinearity whenever this value is too high (e.g. >0,8).
As observed in Table 2, the correlations between our variables are low in general so
they do not display any multicollinearity problem. The most significant relation takes
place between Tobin’s Q and ROA, but this high value was already expected since both
are proxies for financial performance. Hence, we can include all the variables in the
regressions. We notice that the number of female directors shows a positive correlation
with financial performance, and the same trend holds with independent board members
and firm size. On the other hand, it is not correlated with women employees, whilst
board size and specific skills are negatively associated with the explanatory variable, as
predicted in “2.4 Trends”.

35
Table 2. Pair-Wise Correlation Matrix.
Source: made by the author, based on information downloaded from Datastream
We present the results of our regressions in Tables 3-5. Thus, in Tables 3 and 4 we
exhibit how the percentage of women in the boardroom relates to Tobin’s Q and ROA
respectively, starting by univariate regressions (models 1 and 2) to compare how the
outcomes differ when undertaking multivariate regressions (models 3 and 4). Yet, in
Table 5, we perform a robustness check of the previous results based on the research
carried out by Adams and Ferreira (2009) (models 5 and 6). For all the models, we
check how the effects vary when controlling for industry and/or year dummy variables.
In the panel data regressions, we exclude the industry dummies since they are
redundant, captured by the fixed effects.
At first glance, the regressions with Tobin’s Q in Table 3 show divergent results
regarding the coefficient of Female on Board when controlling for the year dummies.
This could be due to the appreciated decline of Tobin’s Q in the year 201422
. Anyway,
the coefficient of Female On Board appears to be positive in the rest of the cases, and it
is significant in the multivariate regressions, though at different levels. Therefore, this is
in line with the results of Campbell and Mínguez-Vera (2008) when analyzing a
Spanish dataset too.
As for the control variables, Firm Size as expressed by the value of assets is negatively
and significantly associated with Tobin’s Q, which implies that large companies in our
sample have a lower performance than smaller ones. Similarly, the coefficients of
22 See Figure 12
VariablesWomen
Employees
Board
Specific
Skills
Female
On
Board
Independent
Board
Members
Board Size ROA Tobin's Q Firm Size
Women Employees 1
Board Specific Skills 0,26 1
Female On Board 0,00 -0,16 1
Independent
Board Members0,11 -0,11 0,33 1
Board Size 0,04 -0,02 -0,14 -0,33 1
ROA 0,04 0,04 0,12 -0,06 -0,23 1
Tobin's Q -0,05 0,15 0,06 -0,15 -0,35 0,73 1
Firm Size 0,30 0,20 0,09 0,20 0,46 -0,40 -0,46 1

36
Independent Board Members and Board Size are also negative, but they are significant
just in the OLS regressions, which might be due to a lack of variation over time.
On the contrary, Board Specific Skills has positive coefficients and it turns out to be
statistically significant. As expected, it is only significant when including the industry
dummy, meaning that directors’ expertise in the company’s sector is positive when
controlling for the type of industry. However, Women Employees is not statistically
significant, so we reject the hypothesis that a more gender-diverse staff influences the
company’s market valuation.
Table 3. Regression results with Tobin’s Q as dependent variable.
Source: made by the author, based on information downloaded from Datastream
In Table 4, when we take ROA as the dependent variable, the coefficient of Female On
Board is positive for all the considered scenarios. Furthermore, it appears to be robust
and statistically significant at 1% and 5% levels for all multivariate regressions, as well
as for the first univariate model. Thus, this implies female directors in our sample
VARIABLES Model 1 Model 1 Model 3 Model 3 Model 3 Model 3 Model 3
Female on Board 0.00810 -0.00120 0.0220*** 0.0154** 0.0156** 0.00672* -0.000214
(0.00689) (0.00470) (0.00725) (0.00616) (0.00703) (0.00397) (0.00580)
Firm Size -0.266*** -0.144** -0.143** -0.262* -0.254*
(0.0511) (0.0610) (0.0614) (0.139) (0.146)
Board Specific Skills 0.0155 0.0197** 0.0198** 0.00627 0.00572
(0.00980) (0.00891) (0.00917) (0.00542) (0.00578)
Women Employees 0.00823 0.00805 0.00844 -0.000856 -0.00318
(0.0106) (0.00782) (0.00838) (0.00655) (0.00695)
Independent Board
Members-0.0107* -0.0152*** -0.0152** -0.00459 -0.00498
(0.00642) (0.00563) (0.00594) (0.00346) (0.00394)
Board Size -0.0726** -0.0485** -0.0478* -0.0152 -0.000519
(0.0331) (0.0232) (0.0250) (0.0173) (0.0144)
4.352***
Constant 1.402*** 1.968*** (0.870) 2.438*** 2.381*** 4.193*** 4.018**
(0.143) (0.234) (0.630) (0.643) -1.525 -1.602
Observations 170 170 149 149 149 149 149
R-squared 0.004 0.447 0.336 0.693 0.695
Industry dummies No Yes No Yes Yes No No
Year dummies No Yes No No Yes No Yes
Regression type OLS OLS OLS OLS OLS Random effectsRandom effects
Robust standard errors in parentheses
*** p<0.01, ** p<0.05, * p<0.1
Tobin's Q

37
positively influence firm performance from an accounting perspective, which is
consistent with the results obtained from Carter et al. (2010) in the US. In particular, our
panel data regression accounting for year dummies indicates that when the proportion of
female representation increases by 10 percentage points, ROA is predicted to change by
about 1,49 percentage points.
Again, Firm Size is negatively and significantly associated with firm performance,
whilst Board Specific Skills shows a positive and significant relationship when
including the industry dummy.
As before, Women Employees is not statistically significant. Moreover, Independent
Board Directors and Board Size are not statistically significant either, not even for the
OLS regressions.
Table 4. Regression results with ROA as dependent variable.
Source: made by the author, based on information downloaded from Datastream
VARIABLES Model 2 Model 2 Model 4 Model 4 Model 4 Model 4 Model 4
Female on Board 0.0902** 0.0685 0.158*** 0.135** 0.149** 0.127** 0.149**
(0.0446) (0.0476) (0.0582) (0.0541) (0.0604) (0.0548) (0.0701)
Firm Size -1.452*** -0.860* -0.866 -1.713*** -1.717***
(0.392) (0.510) (0.538) (0.589) (0.593)
Board Specific Skills 0.0831 0.103* 0.106** 0.0624 0.0689
(0.0520) (0.0531) (0.0513) (0.0479) (0.0472)
Women Employees -0.0246 0.0240 0.0324 -0.0278 -0.0266
(0.0602) (0.0814) (0.0862) (0.0972) (0.0993)
Independent Board
Members-0.00818 -0.0408 -0.0473 0.00773 -0.00214
(0.0379) (0.0369) (0.0389) (0.0510) (0.0548)
Board Size -0.0326 0.0785 0.0528 0.208 0.190
(0.323) (0.366) (0.360) (0.318) (0.312)
Constant 3.085*** 7.121*** 14.66*** 4.164 5.554 14.62* 16.09*
(0.834) -1.653 -4.835 -4.992 -5.082 -8.407 -8.570
Observations 167 167 146 146 146 146 146
R-squared 0.015 0.326 0.176 0.450 0.463
Industry dummies No Yes No Yes Yes No No
Year dummies No Yes No No Yes No Yes
Regression type OLS OLS OLS OLS OLS Random effects Random effects
Robust standard errors in parentheses
*** p<0.01, ** p<0.05, * p<0.1
ROA
38
In Table 5, we do not consider Women Employees and Board Specific Skills, as we aim
at running the same models as Adams and Ferreira (2009)23
.
Unlike their results, our sample does not show a significant association between Female
On Board and Tobin’s Q when we suppress these two control variables, and in
particular Board Specific Skills. However, we do find a positive and significant
relationship at a 10% level between Female On Board and ROA. Therefore, this
suggests that there exists an omitted variable problem. Indeed, when accounting for
Board Specific Skills (which is negatively correlated with Female On Board) we obtain
positive and statistically significant coefficients.
Regarding Board Size, we obtain negative and significant coefficients but only with
Tobin’s Q and OLS regressions. Thus, whether a smaller or larger board influences firm
gains in our sample is not clear.
As for the variable Independent Board Members, they find a positive relationship that is
just significant with ROA. For us, it is still negative as in the previous tables, but in this
case significant with Tobin’s Q. This indicates that a smaller number of independent
board members can add economic value to Spanish firms, but this association is not
meaningful when controlling for additional variables or considering ROA.
Finally, Firm Size is again negative and significant in all scenarios, suggesting that
smaller companies in our sample are the ones performing the best.
23 They consider fewer variables than we do in Models 1-4. Instead of Firm Size expressed as the logarithm of total
assets they use the logarithm of total sales. They do not control for year dummies either.

39
Table 5. Regression results for the Robustness Check.
Source: made by the author, based on information downloaded from Datastream
VARIABLES Model 5 Model 5 Model 5 Model 6 Model 6 Model 6
Female on
Board0.00592 0.00556 -0.00227 0.0758 0.0881 0.126*
(0.00421) (0.00482) (0.00414) (0.0515) (0.0570) (0.0641)
Independent
Board Members-0.0186** -0.0183** -0.00551** -0.0559 -0.0603 -0.0120
(0.00786) (0.00816) (0.00267) (0.0390) (0.0403) (0.0538)
Board Size -0.0714** -0.0701** -0.00412 -0.0112 -0.0399 0.0983
(0.0276) (0.0305) (0.0122) (0.302) (0.293) (0.321)
Firm Size -0.159*** -0.159*** -0.227* -1.384*** -1.374*** -1.615***
(0.0511) (0.0511) (0.130) (0.424) (0.431) (0.482)
Constant 4.696*** 4.601*** 3.914*** 17.94*** 19.50*** 18.62**
(0.691) (0.757) -1.472 -4.826 -5.130 -8.629
Observations 161 161 161 158 158 158
R-squared 0.587 0.589 0.391 0.401
Industry
dummiesYes Yes No Yes Yes No
Year dummies No Yes Yes No Yes Yes
Regression type OLS OLS Random effects OLS OLS Random effects
Robust standard errors in parentheses
*** p<0.01, ** p<0.05, * p<0.1
Robustness Check: Adams & Ferreira (2009)
Tobin's Q ROA

40
4. CONCLUSIONS
In this study, we provide new insights into the relationship between women in the
boardroom and firm performance, by focusing on recent data from Spanish firms listed
on the Spanish stock market. Thus, we contribute to the literature on this topic by
analyzing the results obtained from a different sample, period and set of variables.
As a first approach, we aim at uncovering the characteristics of the few firms in Spain
which integrate female board members. By examining our sample, we identify two
remarkable trends that support some of our hypothesis: (1) we observe that women
directors are usually found in sectors operating close to end customers and (2) they
appear to be concentrated on companies with small boards.
Our findings show that in general there exists a positive and significant relationship
between WOCB and economic performance, which are consistent with those from
Laffarga et al. (2015), Lückerath-Rovers (2013) and Smith et al. (2005) among others.
When measuring financial performance by ROA, a positively significant association
holds in all panel regressions. The same linkage is found when considering Tobin’s Q,
though the coefficient becomes insignificant when including year dummies.
After performing the robustness check and obtaining no statistically significant
relationship, we realize the existence of an omitted variable problem. Indeed, once the
control variable board specific skills is included, we get positive and significant
coefficients for female on board. Hence, our results suggest that women directors can
positively affect firm value once all relevant control variables are accounted for, which
underpins resource dependence and human capital theory. Furthermore, our outcomes
also indicate that smaller firms in terms of total assets perform better than larger ones,
but this may be misleading, due to the fact we are considering banks and insurance
companies. We could not draw any other conclusion concerning the rest of control
variables, since the results were not significant and the signs changed depending on the
chosen financial performance measure.
Future research on this topic would be highly beneficial to overcome current societal,
organizational and legislative concerns. Despite we could contribute with some
substantial outcomes, our study faced some limitations that should be addressed when
carrying out new approaches. Firstly, there is not a substantial amount of Spanish
companies that display data on their number of female directors. The lack of time

41
impeded us using other means to obtain a larger sample, but we believe this should be
one of the main points to be arranged. A larger sample size could also allow performing
the analysis only on a subsample of non-financial firms, to verify the robustness of our
results. Secondly, our initial analysis aimed at including many other interesting
variables, such as the director tenure, board and committee meeting attendance, women
managers and board cultural diversity among others, which had to be rejected because
they exhibited many missing values. Similarly, we believe some variables describing
board members’ level of education and risk-taking would allow for more noteworthy
results, but again it may be too time-consuming. Overall, these variables may be
potentially related to the diversity-performance relationship, so we encourage future
research to consider them. Finally, despite we used a panel data methodology, further
advanced techniques commonly employed to explore this link were beyond the reach
for an undergraduate thesis. As stated in previous literature, performing pooled OLS
and 2SLS regressions implies greater accuracy, as it mitigates the reverse causality
concern. Therefore, when analyzing the direction of causality, we recommend following
the path of Adams and Ferreira (2009), Carter et al. (2010) and Laffarga et al. (2015).

42
5. BIBLIOGRAPHY
Adams, R., Almeida, H and Ferreira, D. 2005. Powerful CEOs and their impact on
corporate performance. Review of Financial Studies. Vol. 18, pp. 1403-1432.
Adams, R. and Ferreira, D. 2009, Women in the boardroom and their impact on
governance and performance, Journal of Financial Economics. Vol. 94, pp. 291-309.
Adams, R., and Funk, P. 2012. Beyond the glass ceiling: Does gender matter?
Management Science. Vol. 58, pp. 219-235.
Adams, R, Grey, S and Nowland, J. 2011. Does Gender Matter in the Boardroom?
Evidence from the Market Reaction to Mandatory New Director Announcements.
Working Paper, City University of Hong Kong and University of Queensland.
Adams, R., Hermalin, E., and Weisbach, M. S. 2010. The role of boards of directors in
corporate governance: A conceptual framework and survey. Journal of Economic
Literature. Vol. 48, pp. 58-107.
Adams, R. and Ragunathan, V. 2013. Lehman sisters. Working paper, University of
New South Wales and University of Queensland.
Aguilera R., Lorenz, R., and Terjesen S. 2015. Legislating a Woman’s Seat on the
Board: Institutional Factors Driving Gender Quotas for Boards of Directors. Journal of
Business Ethics. Vol 128, pp.233–251.
Ahern, K., and Dittmar, A. 2012. The Changing of the Boards: The Impact on Firm
Valuation of Mandated Female Board Representation. The Quarterly Journal of
Economics, Vol. 127, pp.137-197.
Apesteguia, J., Azmat, G., and Iriberri, N. 2012. The Impact of Gender Composition on
Team Performance and Decision-Making: Evidence from the Field, Management
Science, Vol.58, No.1, pp.78-93.
Baixauli-Soler, J.S., Lucas- Pérez, M.A., Martín-Ugedo, J.F., Mínguez-Vera, A., and
Sánchez-Marín, G. 2015. Women on the Board and Managers’ Pay: Evidence from
Spain. Journal of Business Ethics. Vol.129, pp.265-280.
Berger, Allen N., Kick, T., and Schaeck, K. 2014, Executive board composition and
bank risk-taking, Journal of Corporate Finance. Vol 28, pp 48-65.
43
Berner, T., Ellersgaard, C., and Larsen, F. 2016. Kvinder i ledelse - analyse af lov om
måltal og politik for det underrepræsenterede køn. Danmarks Nationale
Menneskerettighedsinstitution.
Calkoen, W.J.L. 2015. The Corporate Governance Review. Law Business Research
LTD, 5th Edition, pp. 341-353.
Campbell, K. and Mínguez-Vera, A. 2007. The influence of gender on Spanish boards
of directors: an empirical analysis. Working Paper, Universidad Politécnica de
Cartagena.
Campbell, K., and Mínguez-Vera, A. 2008. Gender Diversity in the Boardroom and
Firm Financial Performance. Journal of Business Ethics. Vol 83, pp.435–451.
Campbell, K., and Mínguez-Vera, A. 2010. Female board appointments and firm
valuation: short and long-term effects. Journal of Management Governance. Vol. 14, pp
37-59.
Cao, Z., Davalos, S., Feroz, E., and Leng, F. 2015.Corporate governance and default
risk of firms cited in the SEC’s Accounting and Auditing Enforcement Releases. Review
of Quantitative Finance & Accounting. Vol. 44, pp. 113–138.
Carmona, P., De Fuentes, C., and Ruiz, C. 2016. Risk disclosure analysis in the
Corporate Governance Annual Report using fuzzy-set qualitative comparative analysis.
RAE-Revista de Administração de Empresas. Vol. 56, No. 3, pp 342-352.
Carter, D., D’Souza, F., Simkins, B.J., and Simpson, W.G. 2010. The Gender and
Ethnic Diversity of US Boards and Board Committees and Firm Financial Performance.
Corporate Governance: An International Review. Vol. 18, No.5, pp.396–414.
Castro, B. Gómez, N.E., Santero, R., Vega, P.J, 2016. Participación femenina en
puestos directivos y desigualdad salarial. Un análisis en el mercado laboral español.
Estudios de economía aplicada. Vol. 34 – 1, pp.155 – 178.
Dang, R., and Nguyen, D.K. 2016. Does Board Gender Diversity Make a Difference?
New Evidence from Quantile Regression Analysis. Management international. Vol 20,
No. 2, pp. 95-106.
El Economista. February 10, 2017. Fichas de empresas del IBEX 35.

44
European Commission. 2013. National factsheet: Gender Balance in Boards, Denmark.
http://ec.europa.eu/justice/gender-equality/files/womenonboards/womenonboards-
factsheet-dk_en.pdf
European Commission. 2013. National factsheet: Gender Balance in Boards, Spain.
http://ec.europa.eu/justice/gender-equality/files/womenonboards/womenonboards-
factsheet-es_en.pdf Accessed 2 October 2016.
European Commission’s Database. Gender balance in decision-making positions [On
line]. [ref. 24 November 2016]. Available at: http://ec.europa.eu/justice/gender-
equality/gender-decision-making/database/business-finance/supervisory-board-board-
directors/index_en.htm
European Women’s Lobby (EWL). 2014. Women on Boards in Europe: Second
Progress Report. Cracks in the glass ceiling or just a trick of the light?
http://www.womenlobby.org/Cracks-in-the-glass-ceiling-or-just-a-trick-of-the-
light?lang=en
Faccio, M., Marchica, M.T., and Murac. R. 2016. CEO gender gap and risk-taking.
Journal of Corporate Finance. Vol 39, pp.193–209.
Ferreira, D. 2010. Board diversity. In R. Anderson & H.K. Baker (Eds.), Corporate
governance: A synthesis of theory, research, and practice. Chapter 12, pp. 225-242.
Ferreira, D., and Kirchmaier, T. 2013. Corporate boards in Europe: size, independence
and gender diversity. In Belcredi, Massimo and Ferrarini, Guido, (eds.) Boards and
Shareholders in European Listed Companies: Facts, Context and Post-Crisis Reforms.
International Corporate Law and Financial Market Regulation, pp. 191-224. Cambridge
University Press, Cambridge, UK.
Forlani, D. 2013. How Task Structure and Outcome Comparisons Influence Women’s
and Men’s Risk-Taking Self-Efficacies: A Multi-Study Exploration. Psychology and
Marketing, Vol. 30, No. 12, pp. 1088–1107.
Foss, N., and Lyngsie, J. 2016. The more, the merrier? Women in top-management
teams and entrepreneurship in established firms. Strategic Management Journal. No.
38, pp. 487– 505.

45
Funch, M., Munch-Madsen, P., and Rose, C. 2013. Does Board Diversity Really
Matter? Gender does not, but citizenship does. Int. Journal of Business Science and
Applied Management. Vol. 8, Issue 1.
Gallego, I., García, I M. and Rodríguez L. 2010. The influence of gender diversity on
corporate performance. Revista de Contabilidad-Spanish Accounting Review. Vol. 13,
No 1, pp. 53-88.
García, I M. 2010. The effectiveness of corporate governance: board structure and
business technical efficiency in Spain. Central European Journal of Operations
Research. Vol. 18, No. 3, pp. 311-339.
Gazzola, P., Pezzetti, R., and Sepashvili E. 2016. CSR as a mean to promote gender
equality. Economia Aziendale Online. Vol. 7. 1, pp.95-99.
Gimeno, R., Mangas, L E., and Mateos de Cabo, R. 2007. ¿Dónde están las consejeras?:
un análisis de la ausencia de mujeres en los Consejos de Administración de las mayores
empresas españolas. Working paper, X Encuentro de Economía Aplicada.
Gonzalez, A., and Sila, V. 2014. Spillover Effects of Women on Boards. Working
paper, University of Edinburgh.
Hastings, P. 2013. Breaking the Glass Ceiling: Women in the Boardroom Third Edition.
Tara Giunta, Lianne Labossiere, Paul Hastings (Editors), Paul Hastings, LLP.
Hernández, C M., Martín-Ugedo, J F. and Mínguez-Vera, A. 2015. The influence of
gender on financial decisions: evidence from small start-up firms in Spain. E+ M
Ekonomie a Management. Vol. 4, pp. 93.
Huang, J., and Kisgen, D.J. 2013. Gender and Corporate Finance: Are Male Executives
Overconfident Relative to Female Executives. Journal of Financial Economics. Vol 10,
pp. 822-839.
Huddleston, P., Runyan, R., and Swinney, J. 2006. Differences in reported firm
performance by gender. Does industry matter? Journal of Developmental
Entrepreneurship. Vol. 11, No. 2, pp. 99–115.
Huse, M., and Nielsen, S. 2010.The Contribution of Women on Boards of Directors:
Going beyond the Surface. Corporate Governance: An International Review. Vol. 18,
No.2, pp. 136–148.

46
Huse, M., and Nielsen, S. 2010. Women directors’ contribution to board decision-
making and strategic involvement: The role of equality perception. European
Management Review. Vol 7, pp. 16–29.
Izquierdo, M., Möltner, H., and Morten, H. 2016. Value creating boards and gender
diversity. Suggestions to progress in getting women on boards in Spain. Research
Report. BI Norwegian Business School.
Jourová, V. 2016. Gender balance on corporate boards, Europe is cracking the glass
ceiling. The European Commission. http://ec.europa.eu/justice/gender-
equality/files/gender_balance_decision_making/1607_factsheet_final_wob_data_en.pdf
Accessed 3 November 2016.
Karande, K W. and Zinkhan, G M. 2002. Cultural and gender differences in risk-taking
behaviour among American and Spanish decision makers. The Journal of Social
Psychology. Vol. 131, No. 5, pp.741-742.
Laffarga. J., Pilar, D.F., and Reguera-Alvarado, N. 2015 (forthcoming). Does Board
Gender Diversity Influence Financial Performance? Evidence from Spain. Journal of
Business Ethics.
Lückerath-Rovers, M. 2013. Women on boards and firm performance. Journal of
Management and Govovernance. Vol. 17, pp. 491–509.
Marinova J., Plantenga J., and Remery C. 2010. Gender Diversity and Firm
Performance: Evidence from Dutch and Danish Boardrooms. Utrecht School of
Economics, Tjalling C. Koopmans Research Institute. Discussion Paper Series 10-03.
Martín, A., and Mínguez- Vera, A. 2011. Gender and management on Spanish SMEs:
an empirical analysis. The International Journal of Human Resource Management. Vol.
22, No. 14, pp. 2852–2873.
Martín-Ugedo, J.F., and Mínguez-Vera, A. 2014. Firm performance and women on the
board: evidence from Spanish small and medium-sized enterprises. Feminist
Economics. Vol. 20, No. 3, pp. 136–162.
Opstrup, N., and Villadsen, A.R. 2014. The Right Mix? Gender Diversity in Top
Management Teams and Financial Performance. Public Administration Review, Vol. 75,
Iss. 2, pp. 291–301.

47
Orbis. Database: Company information across the globe [On line]. Bureau Van Dijk
[ref. 9 December 2016]. Available at: https://orbis.bvdinfo.com/version-
2016128/Home.serv?product=orbisneo&setlanguage=en
Oxelheim, L., Randøy, T., and Thomsen, S. 2006. A Nordic perspective on corporate
board diversity. Nordic Innovation Center.
http://www.nordicinnovation.org/Global/_Publications/Reports/2006/The%20performa
nce%20effects%20of%20board%20diversity%20in%20Nordic%20Firms.pdf
Packel, A., and Rhode, D. L, 2015. Diversity on corporate boards: How much
difference does difference make? Delaware Journal of Corporate Law. 39, pp. 377-426.
Parrota, P., and Smith, N. 2013. Female-Led Firms: Performance and Risk Attitudes.
IZA Discussion Paper. No. 7613.
Rao, K. Tilt, C. 2016. Board Composition and Corporate Social Responsibility: The
Role of Diversity, Gender, Strategy and Decision Making. Journal of Business Ethics.
Vol. 138, Issue 2, pp. 327–347.
Rose, C. 2007. Does female board representation influence firm performance? The
Danish evidence. Corporate Governance: An International Review, Vol. 15, No. 2, pp.
404-413.
Royo, S. Steinberg, F. Otero-Iglesias M. 2016. The Spanish financial crisis: lessons for
the European Banking Union. Informe Elcano. No. 20.
Smith, N. Smith, V. Verner, M. 2005. Do Women in Top Management Affect Firm
Performance? A Panel Study of 2500 Danish Firms. IZA Discussion Paper. No. 1708.
Smith, N. Smith, V. Verner, M. 2010. The Gender Pay Gap in Top Corporate Jobs in
Denmark: Glass Ceilings, Sticky Floors or Both? IZA Discussion Paper. No. 4848.
Smith, N. Smith, V. Verner, M. 2011. Why Are So Few Females Promoted into CEO
and Vice-President Positions? Danish Empirical Evidence 1997-2007. IZA Discussion
Paper. No. 5961.
Smith, N. Smith, V. 2015. Women in top management positions – why so few? And
does it matter? A survey of recent empirical results for Danish companies. Danish
Journal of Management & Business, No. 1, pp. 27-42.
48
Terjesen S., Sealy, R., and Singh V. 2009. Women Directors on Corporate Boards: A
Review and Research Agenda. Corporate Governance: An International Review. Vol.
17, No. 3, pp 320–337.
The Nordic co-operation. Database: Gender balance on boards [On line].
Statistikbanken [ref. 1 November 2016]. Available at: http://norden.statbank.dk/labo08
See more at: http://www.norden.org/en/fakta-om-norden-1/gender-equality-
indicators/influence-and-power/gender-balance-on-boards
Wooldridge, J. 2012. Introductory Econometrics: A Modern Approach, 5th
Edition.
South Western CENGAGE Learning.
Zander, C. May 21, 2014. “Even Scandinavia Has a CEO Gender Gap.” Wall Street
Journal.

49
APPENDIX
Appendix 1: EU countries regulation of gender balance on corporate
boards
Country Quota Other measures
Austria 35% for supervisory boards by
2018. It only applies to state-owned
firms
Self-regulation
Belgium 33% for both executives and non-
executives in state-owned and listed
companies by 2017, as well as in
listed SMEs by 2019
Self-regulation
Bulgaria No No
Croatia No No
Cyprus No No
Czech
Republic
No No
Denmark No Self-regulation, sanction in case
of not submitting any reporting
Estonia No No
Finland No The Corporate Governance Code
for listed companies
recommends to have an
"equitable proportion of both
sexes" in their boards
France 40% by 2017 for non-executive
directors in all large companies
The AFEP-MEDEF Corporate
Code of 2011 recommends
complying with the quota
Germany 30% for supervisory boards of the
110 biggest listed companies
From 2016, the concerned
companies must self-regulate
Greece 33% applicable to companies fully
or partially owned by the State
Soft and positive actions for the
public sector
Hungary No Soft and positive actions for the
public sector
Ireland No Soft and positive actions for the
public sector employment: 40%
female participation in all state
boards
Italy 33% by 2015 for listed and state-
owned companies
Applicable to both executive and
non-executive boards
Latvia No Soft and positive actions for the
public sector
Lithuania No No
Luxembourg No Soft and positive actions,
recommendation to have an
appropriate representation of
both sexes in all boards
Malta No No

50
Netherlands 30% for large companies Soft mechanism and self-
regulation applying to all boards
Poland No The Code of good practices
contemplates for equally
qualified women. Soft
mechanism
Portugal No A government resolution of
2015 encourages companies to
attain 30% of the under-
represented sex at their
administrative bodies by 2018
Romania No Soft and positive actions for the
public sector employment
Slovakia No No
Slovenia No 40% representation of each sex
for government representatives
in all boards. No sanctions.
Spain 40% by 2015 for large companies,
no sanctions. 30% recommendation
for listed companies from 2016
Soft and positive actions for the
public sector employment
Sweden No Self-regulation
United
Kingdom
No Self-regulation
Source: made by the author, based on the report of gender balance on corporate boards
(European Commission, April 2016).

51
Appendix 2: Variable definition
Variable name Definition
ROA (%) Datastream computes Return On Assets as a percentage
according to each type of firm:
-Annual Time Series:
(Net Income – Bottom Line + ((Interest Expense on Debt-
Interest Capitalized) * (1-Tax Rate))) / Average of Last
Year's and Current Year’s Total Assets * 100
-Banks:
Net Income – Bottom Line + ((Interest Expense on Debt-
Interest Capitalized) * (1-Tax Rate))) / Average of Last
Year's (Total Assets - Customer Liabilities on
Acceptances) and Current Year’s (Total Assets - Customer
Liabilities on Acceptances) * 100. Customer Liabilities on
Acceptances only subtracted when included in Total
Assets
-Insurance Companies:
(Net Income – Bottom Line + ((Interest Expense on Debt-
Interest Capitalized) *(1-Tax Rate))) + Policyholders'
Surplus) / Average of Last Year's and Current Year’s Total
Assets * 100
-Other Financial Companies:
(Net Income – Bottom Line + ((Interest Expense on Debt-
Interest Capitalized) * (1-Tax Rate))) / Average of Last
Year's (Total Assets - Custody Securities) and Current
Year’s (Total Assets - Custody Securities) * 100
Tobin’s Q (Market Capitalization + Total Liabilities)/ Total Assets
(BV of Debt + Market Capitalization)/ (BV of Equity +
BV of Debt, where
Total Liabilities= Total Assets- Book Value of Equity ;
and BV Equity= BV per share * Number of Shares

52
Female On Board (%) Percentage of Female On Board
Board Size The total number of board members at the end of the fiscal
year.
Independent Board
Members (%)
Percentage of independent board members as reported by
the company
Board Specific Skills
(%)
Percentage of board members who have either an industry
specific background or a strong financial background
Women Employees
(%)
Percentage of women employees
Firm Size Logarithm of Total Assets (thousands of Euros), as
reported by the company. Includes the reported sum of
total current assets, long term receivables, investment in
associated companies, other investments, net property
plant and equipment and other assets
Source: made by the author, based on information downloaded from Datastream
Appendix 3: Firms in the sample sorted by sector
SECTOR FIRM
COMMUNICATIONS MEDIASET ESPAÑA
ATRESMEDIA
ENERGY
IBERDROLA
REPSOL
ENDESA
RED ELECTRICA
GAS NATURAL
FINANCE & INSURANCE
BANCO POPULAR ESPAÑOL
BANCO SANTANDER
BANKIA
BANCO BILBAO VIZCAYA
ARGENTARIA
CAIXABANK
MAPFRE
BANKINTER
PROSEGUR
BOLSAS Y MERCADOS

53
HOSPITALITY NH HOTEL GROUP
INFRASTRUCTURE
SACYR
ABERTIS
FERROVIAL
ACS ACTIV. CONSTRUC. Y SERV.
TECNICAS REUNIDAS
FOMENTO CONSTRUC. Y CNTR.
ACCIONA
ITC
TELEFONICA
CELLNEX
INDRA SISTEMAS
MANUFACTURING
ACERINOX
ZARDOYA OTIS
ARCELORMITTAL
FAES FARMA
VISCOFAN
REAL ESTATE
MERLIN PROPERTIES
INMOBILIARIA COLONIAL
TEXTILE INDITEX
WIND GAMESA
Source: made by the author, based on information downloaded from Datastream