women in the utah labor force
TRANSCRIPT

HARD @ WORK Women in the Utah Labor Force
Lecia Parks Langston, Senior Economist Utah Department of Workforce Services

We’re the same. . .

but different.
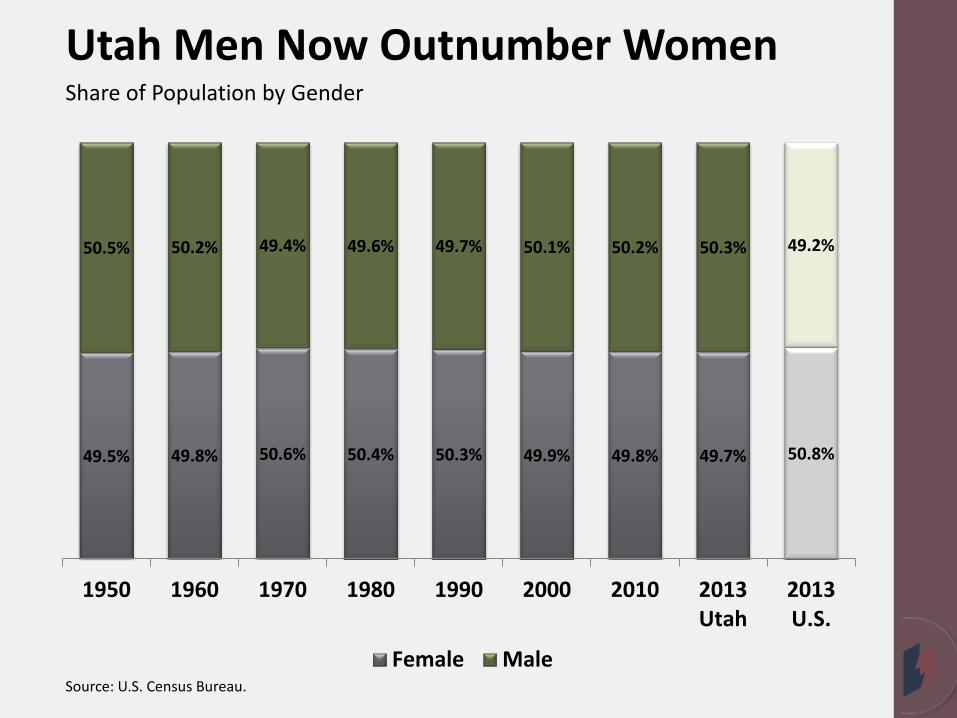
Utah Men Now Outnumber Women
49.5% 49.8% 50.6% 50.4% 50.3% 49.9% 49.8% 49.7% 50.8%
50.5% 50.2% 49.4% 49.6% 49.7% 50.1% 50.2% 50.3% 49.2%
1950 1960 1970 1980 1990 2000 2010 2013Utah
2013U.S.
Female Male
Share of Population by Gender
Source: U.S. Census Bureau.

Utah is the youngest state in the nation. . .
17% 20% 20%
21% 21% 21% 21% 21% 21% 22% 22% 22% 22% 22% 22% 22% 23% 23% 23% 23% 23% 23% 23% 23% 23% 23% 23% 23% 23% 23% 24% 24% 24% 24% 24% 24% 24% 24% 24% 24% 24% 25% 25% 25% 25% 25% 25% 25% 25% 26%
27% 27%
31%
District of ColumbiaVermont
MaineFlorida
Rhode IslandWest Virginia
New HampshireMassachusetts
PennsylvaniaHawaii
New YorkMontana
North DakotaConnecticut
OregonDelaware
VirginiaMarylandMichigan
New JerseySouth Carolina
OhioWashington
WisconsinTennessee
KentuckyPuerto Rico
AlabamaMissouri
North CarolinaIowa
United StatesColoradoWyoming
IllinoisMinnesota
ArkansasNevada
CaliforniaIndiana
LouisianaOklahoma
South DakotaArizona
New MexicoNebraska
KansasMississippi
GeorgiaAlaskaIdahoTexasUtah
Share of 2012 Population Under 18 years
Source: U.S. Census Bureau; American Community Survey.

Utah’s birthrate remains higher than the national average
0
5
10
15
20
25
30
35
1960
1962
1964
1966
1968
1970
1972
1974
1976
1978
1980
1982
1984
1986
1988
1990
1992
1994
1996
1998
2000
2002
2004
2006
2008
2010
2012
UtahU.S.
Births per 1,000 Population
Source: Utah Department of Health.

More births; larger families
2 Person
3 Person
4 Person
5 Person
6 Person
7 Person or more
43%
23%
19%
9%
3%
2%
36%
19%
19%
13%
8%
5%
U.S.Utah
2012 Share of Families by Size
Source: U.S. Census Bureau; American Community Survey.

Utah women are less likely to be married than in the past.
Married 69%
Separated 1%
Divorced 2%
Never Married
19%
Widowed 9%
1950
Married 56%
Separated 1%
Divorced 10%
Never Married
27%
Widowed 6%
2012
Marital Status of Women 15 Years and Older
Source: U.S. Census Bureau; American Community Survey.

Yet, Utah’s divorce rate measures consistently higher than the U.S. average.
0
1
2
3
4
5
6
1960
1962
1964
1966
1968
1970
1972
1974
1976
1978
1980
1982
1984
1986
1988
1990
1992
1994
1996
1998
2000
2002
2004
2006
2008
2010
UtahU.S.
Divorces per 1,000 Population
Source: Utah Department of Health.

Utah women are more likely to be married than their national peers.
Married 46%
Separated 4%
Divorced 12%
Never Married
30%
Widowed 9%
United States
Married 56%
Separated 1%
Divorced 10%
Never Married
27%
Widowed 6%
Utah
2012 Marital Status of Women 15 Years and Older
Source: U.S. Census Bureau; American Community Survey.
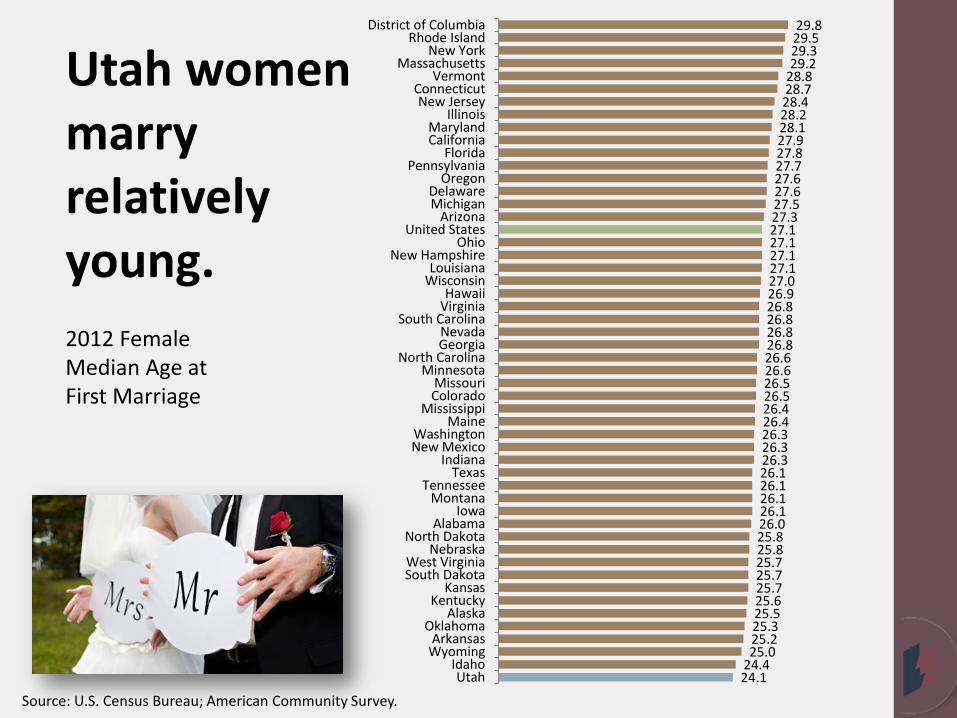
Utah women marry relatively young.
24.1 24.4 25.0 25.2 25.3 25.5 25.6 25.7 25.7 25.7 25.8 25.8 26.0 26.1 26.1 26.1 26.1 26.3 26.3 26.3 26.4 26.4 26.5 26.5 26.6 26.6 26.8 26.8 26.8 26.8 26.9 27.0 27.1 27.1 27.1 27.1 27.3 27.5 27.6 27.6 27.7 27.8 27.9 28.1 28.2 28.4 28.7 28.8 29.2 29.3 29.5 29.8
UtahIdaho
WyomingArkansas
OklahomaAlaska
KentuckyKansas
South DakotaWest Virginia
NebraskaNorth Dakota
AlabamaIowa
MontanaTennessee
TexasIndiana
New MexicoWashington
MaineMississippi
ColoradoMissouri
MinnesotaNorth Carolina
GeorgiaNevada
South CarolinaVirginiaHawaii
WisconsinLouisiana
New HampshireOhio
United StatesArizona
MichiganDelaware
OregonPennsylvania
FloridaCaliforniaMaryland
IllinoisNew Jersey
ConnecticutVermont
MassachusettsNew York
Rhode IslandDistrict of Columbia
Source: U.S. Census Bureau; American Community Survey.
2012 Female Median Age at First Marriage

Utah women have lost their education edge.
1950 1960 1970 1980 1990 2000 2010 2012
6% 7%
10%
15% 17%
22%
26% 28%
5% 6%
8%
13%
18%
23%
28% 29%
UtahUnited States
Share of Population 25 and Older with a Bachelor’s Degree
Source: U.S. Census Bureau; American Community Survey.

Utah has the largest male/female college-education gap in the U.S.
-6.5 -4.9
-4.0 -3.7
-2.8 -2.5 -2.2 -2.0 -1.8 -1.7 -1.6 -1.3 -1.2 -1.2 -1.2 -1.2 -1.1 -1.1 -1.0 -1.0 -0.9 -0.9 -0.8 -0.8 -0.7 -0.6 -0.4 -0.3 -0.1
0.0 0.0 0.1 0.1 0.2 0.2 0.3 0.4 0.5 0.6 0.7 0.7 0.8 0.8 0.8 0.8 1.0 1.1
1.7 2.0
2.4 2.8
4.9
AlaskaVermont
North DakotaHawaiiMaine
MississippiSouth Dakota
WisconsinLouisianaNebraska
West VirginiaNew Hampshire
ArkansasMontana
IowaNorth Carolina
KentuckyMinnesota
MissouriNew YorkWyomingDelaware
KansasOklahoma
New MexicoGeorgia
IllinoisIndiana
TennesseeMaryland
United StatesMichiganAlabama
South CarolinaMassachusetts
TexasOregon
ColoradoCalifornia
Rhode IslandOhio
PennsylvaniaNevada
ConnecticutVirginia
WashingtonNew Jersey
FloridaArizona
IdahoDistrict of Columbia
Utah*Population 25 years and over. Source: U.S. Census Bureau; American Community Survey.
2012 Percentage Point Difference between the Share of Men and Women with a Bachelor’s Degree

Utah’s divorce rate trends
higher than the national average
Utah women have more
children and larger
families
Utah women get
married young
Utah women have lost
their educational
edge
Utah has the largest
male/female college education gap in the country
A smaller share of Utah women
are married now than in the
past

A higher percentage of Utah women participate in the labor force than the U.S. average.
0%
10%
20%
30%
40%
50%
60%
70%
1950 1960 1970 1980 1990 2000 2010 2012
U.S.
Utah
After 1980, Utah’s female
participation rates measure higher
than U.S. figures.
Percent of Women* in the Labor Force
*Population 16 years and over. Source: U.S. Census Bureau; American Community Survey.

Utah women in their early twenties are most likely to work outside the home.
16 to 1920 and 21
22 to 2425 to 2930 to 3435 to 4445 to 5455 to 59
60 and 6162 to 6465 to 6970 to 74
75 and Older
51%
80%
79% 72%
67%
72% 75%
64%
60% 46%
28% 17%
3%
Utah 2012 Labor Force Participation Rate by Age
Source: U.S. Census Bureau; American Community Survey.

Utah women are less likely than U.S. women to participate during the typical child-bearing years.
51%
80%
79%
72%
67%
72%
75%
64%
60%
46%
28%
17%
3%
39%
67%
76%
78%
76%
76%
76%
67%
57%
45%
28%
14%
4%
16 to 1920 and 21
22 to 2425 to 2930 to 3435 to 4445 to 5455 to 59
60 and 6162 to 6465 to 6970 to 74
75 and OlderUtahU.S.
Utah 2012 Labor Force Participation Rate by Age
Source: U.S. Census Bureau; American Community Survey.
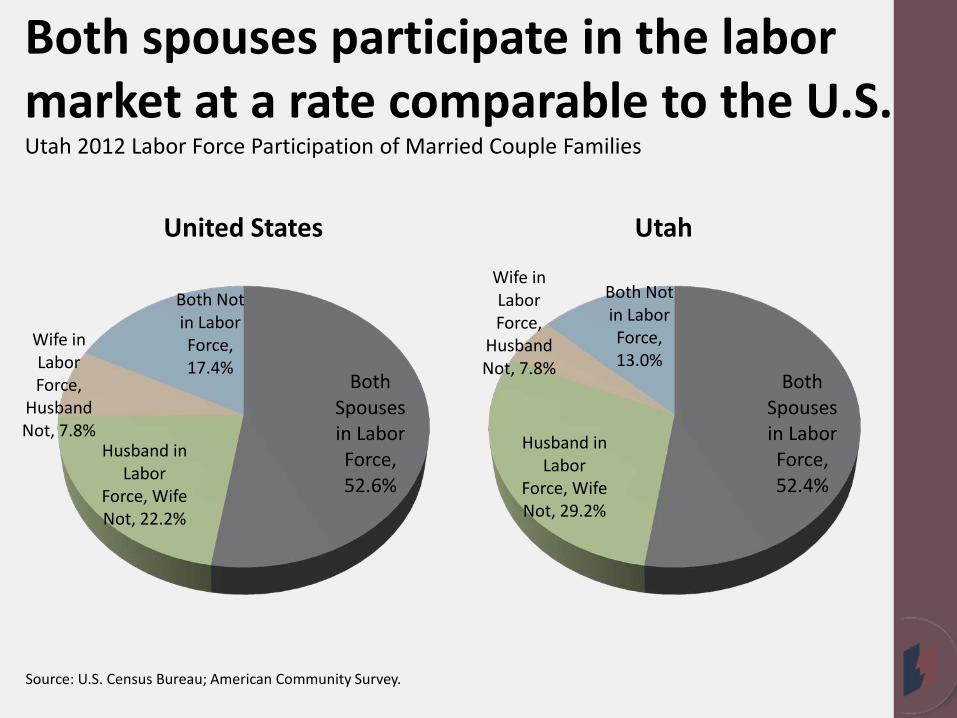
Both spouses participate in the labor market at a rate comparable to the U.S.
Both Spouses in Labor Force, 52.6%
Husband in Labor
Force, Wife Not, 22.2%
Wife in Labor Force,
Husband Not, 7.8%
Both Not in Labor Force, 17.4%
United States
Both Spouses in Labor Force, 52.4%
Husband in Labor
Force, Wife Not, 29.2%
Wife in Labor Force,
Husband Not, 7.8%
Both Not in Labor Force, 13.0%
Utah
Source: U.S. Census Bureau; American Community Survey.
Utah 2012 Labor Force Participation of Married Couple Families

Utah mothers of young children are much less likely to work than U.S. mothers.
70%
64%
77%
73%
61%
51%
73%
76%
Children Under Six
Children Under Six and 6 to 17
Children 6 to 17 only
No Children Under 18
United States Utah
Utah 2012 Labor Force Participation of Women* with Children
*Women 20 to 64 years. Source: U.S. Census Bureau; American Community Survey.

Utah children are less likely to have both parents in the labor force.
58%
65%
76%
82%
46%
56%
79%
87%
Living with Two Parents, Both Parents inLabor Force
Under 6 Years
6 to 17 Years
Living with One Parent, Parent in LaborForce
Under 6 Years
6 to 17 Years
United States Utah
Utah 2012 Labor Force Participation of Parents
Source: U.S. Census Bureau; American Community Survey.
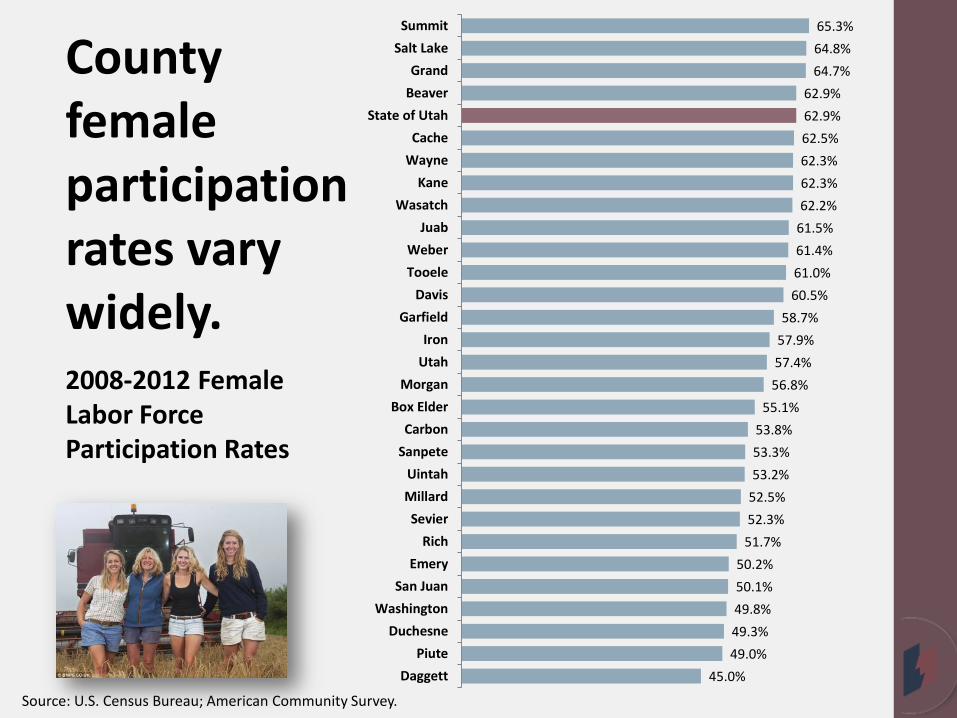
County female participation rates vary widely.
45.0% 49.0% 49.3% 49.8% 50.1% 50.2%
51.7% 52.3% 52.5% 53.2% 53.3% 53.8%
55.1% 56.8% 57.4% 57.9% 58.7%
60.5% 61.0% 61.4% 61.5% 62.2% 62.3% 62.3% 62.5% 62.9% 62.9%
64.7% 64.8% 65.3%
DaggettPiute
DuchesneWashington
San JuanEmery
RichSevier
MillardUintah
SanpeteCarbon
Box ElderMorgan
UtahIron
GarfieldDavis
TooeleWeber
JuabWasatch
KaneWayneCache
State of UtahBeaverGrand
Salt LakeSummit
2008-2012 Female Labor Force Participation Rates
Source: U.S. Census Bureau; American Community Survey.
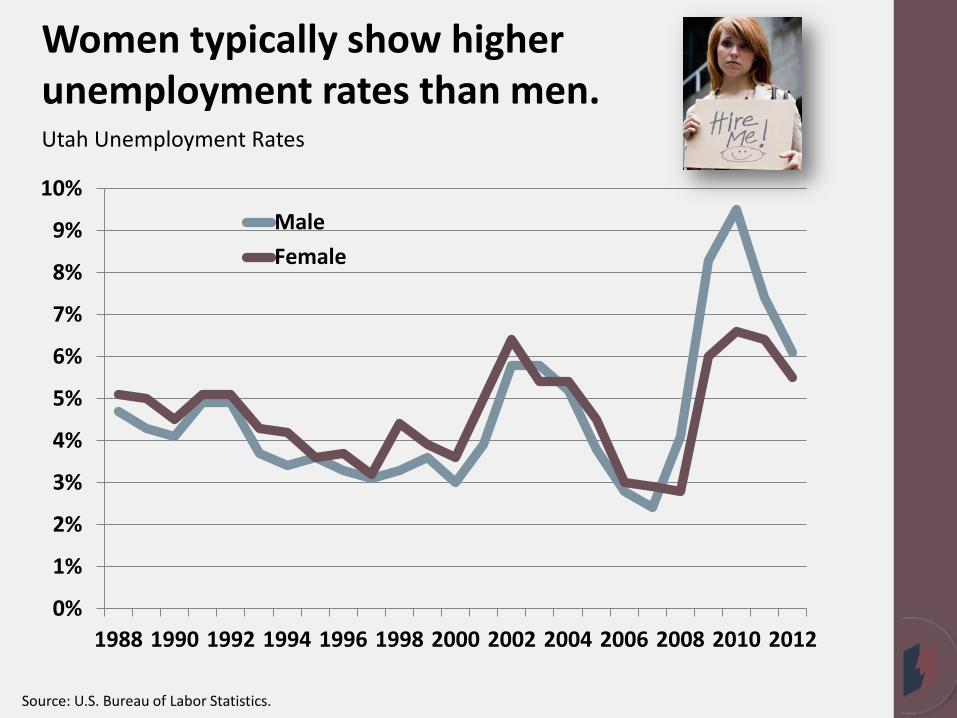
Women typically show higher unemployment rates than men.
0%
1%
2%
3%
4%
5%
6%
7%
8%
9%
10%
1988 1990 1992 1994 1996 1998 2000 2002 2004 2006 2008 2010 2012
MaleFemale
Utah Unemployment Rates
Source: U.S. Bureau of Labor Statistics.

Utah women work fewer hours than their U.S. counterparts
36
41
33
40
Females Males
United States Utah
2012 Mean Usual Hours Worked per Week
Source: U.S. Census Bureau; American Community Survey.

Utah women are more likely to work part-time.
59%
31%
10%
81%
15%
4%
35 or More Hours
15 to 34 Hours
1 to 14 HoursMales
Females
2012 Share of Workers by Usual Hours Worked per Week
Source: U.S. Census Bureau; American Community Survey.

Utah women are more likely to work part-time.
69%
25%
6%
59%
31%
10%
35 or More Hours
15 to 34 Hours
1 to 14 HoursUtah
United States
2012 Share of Workers by Usual Hours Worked per Week
Source: U.S. Census Bureau; American Community Survey.

Utah women moved into production and protective service occupations.
45% 31%
50% 21%
11% 34%
58% 40%
70% 48%
66% 84%
19% 58%
39% 82%
48% 74%
22% 2%
5% 33%
15%
44% 32%
48% 20%
12% 34%
56% 41%
70% 44%
64% 84%
24% 60%
39% 79%
47% 71%
19% 2%
4% 30%
17%
TotalManagement
Business and Financial OperationsComputer and MathematicalArchitecture and Engineering
Life, Physical and Social ScienceCommunity and Social Services
LegalEducation, Training and Library
Arts, Design, Entertainment, Sports and MediaHealthcare Practitioners and Technical
Healthcare SupportProtective Service
Food Preparation and ServingBuilding and Grounds Cleaning/Maintenance
Personal Care and ServiceSales and Related
Office and AdministrativeFarming, Fishing, Forestry
Construction and ExtractionInstallation, Maintenance and Repair
ProductionTransporation and Material Moving
2000 2006-2010
Utah Female Share of Major Occupations
Source: U.S. Census Bureau; EEO Tabulation.
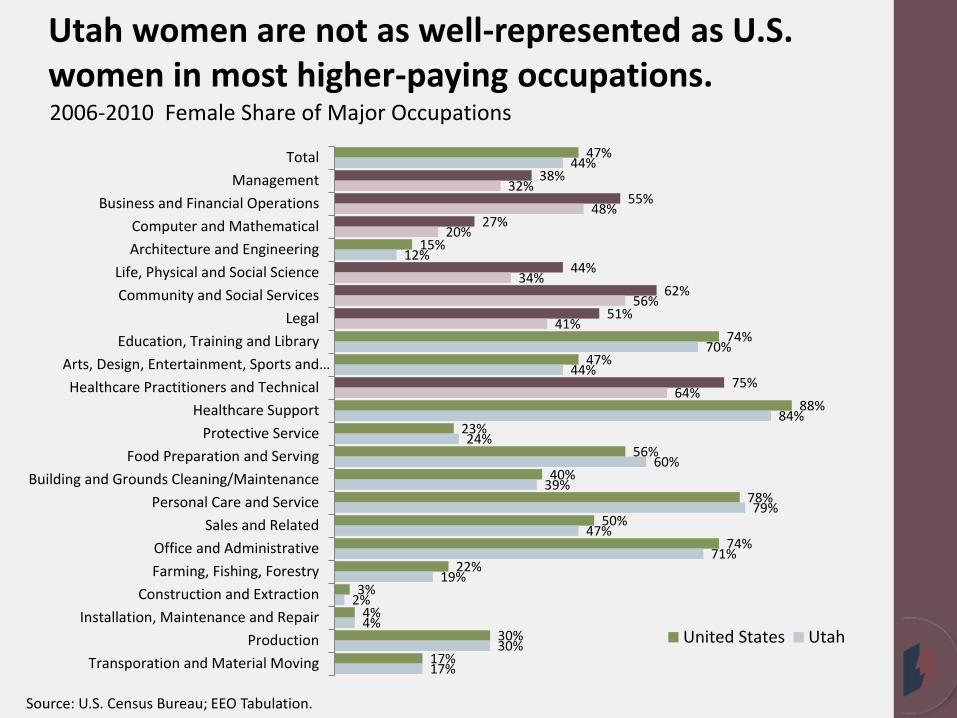
Utah women are not as well-represented as U.S. women in most higher-paying occupations.
47% 38%
55% 27%
15% 44%
62% 51%
74% 47%
75% 88%
23% 56%
40% 78%
50% 74%
22% 3% 4%
30% 17%
44% 32%
48% 20%
12% 34%
56% 41%
70% 44%
64% 84%
24% 60%
39% 79%
47% 71%
19% 2%
4% 30%
17%
TotalManagement
Business and Financial OperationsComputer and MathematicalArchitecture and Engineering
Life, Physical and Social ScienceCommunity and Social Services
LegalEducation, Training and Library
Arts, Design, Entertainment, Sports and…Healthcare Practitioners and Technical
Healthcare SupportProtective Service
Food Preparation and ServingBuilding and Grounds Cleaning/Maintenance
Personal Care and ServiceSales and Related
Office and AdministrativeFarming, Fishing, Forestry
Construction and ExtractionInstallation, Maintenance and Repair
ProductionTransporation and Material Moving
United States Utah
2006-2010 Female Share of Major Occupations
Source: U.S. Census Bureau; EEO Tabulation.

Many lower-paying occupations are dominated by Utah women.
100% 99% 99%
98% 97% 97%
96% 95% 95%
94% 93%
92% 91%
90% 90%
89% 89% 89%
88% 88% 88%
87% 87% 87% 87%
Occupational therapy assistants and aidesPreschool and kindergarten teachers
Medical transcriptionistsDental hygienists
Hairdressers, hairstylists, and cosmetologistsSecretaries and administrative assistants
Dental assistantsMiscellaneous personal appearance workers
Dietitians and nutritionistsChildcare workersTeacher assistants
Tailors, dressmakers, and sewersMedical assistants
Billing and posting clerksProofreaders and copy markers
Special education teachersLibrary technicians
Licensed practical and licensed vocational nursesReceptionists and information clerks
Word processors and typistsHosts and hostesses, restaurant, lounge, and coffee…
Maids and housekeeping cleanersBookkeeping, accounting, and auditing clerks
Recreational therapistsVeterinary assistants and laboratory animal caretakers
2006-2010 Utah Female-dominated Occupations
Source: U.S. Census Bureau; EEO Tabulation.
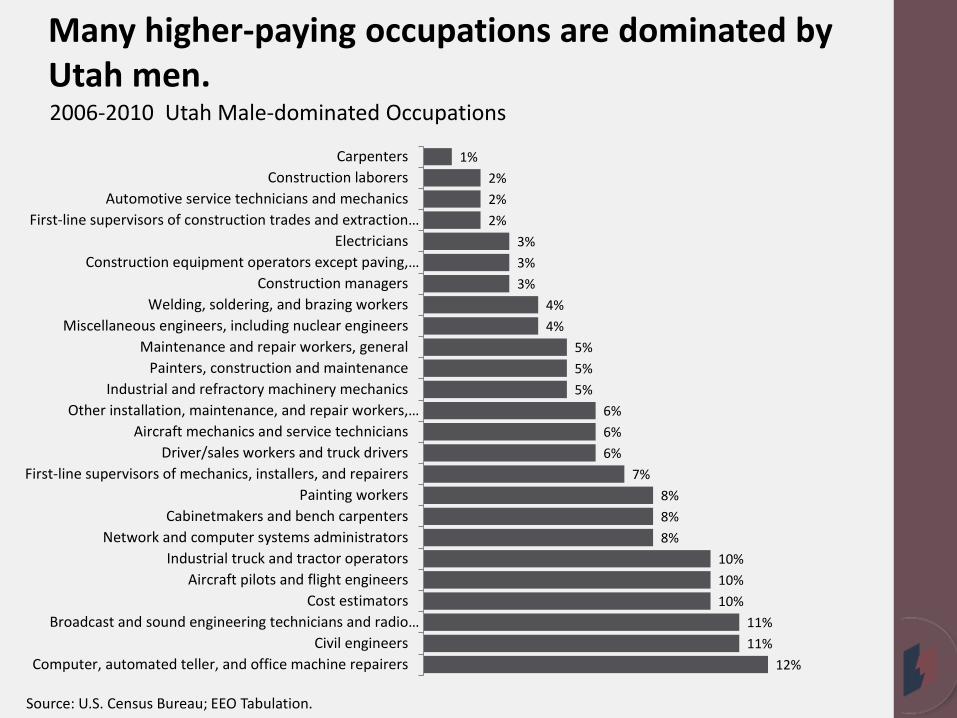
Many higher-paying occupations are dominated by Utah men.
1% 2% 2% 2%
3% 3% 3%
4% 4%
5% 5% 5%
6% 6% 6%
7% 8% 8% 8%
10% 10% 10%
11% 11%
12%
CarpentersConstruction laborers
Automotive service technicians and mechanicsFirst-line supervisors of construction trades and extraction…
ElectriciansConstruction equipment operators except paving,…
Construction managersWelding, soldering, and brazing workers
Miscellaneous engineers, including nuclear engineersMaintenance and repair workers, general
Painters, construction and maintenanceIndustrial and refractory machinery mechanics
Other installation, maintenance, and repair workers,…Aircraft mechanics and service technicians
Driver/sales workers and truck driversFirst-line supervisors of mechanics, installers, and repairers
Painting workersCabinetmakers and bench carpenters
Network and computer systems administratorsIndustrial truck and tractor operators
Aircraft pilots and flight engineersCost estimators
Broadcast and sound engineering technicians and radio…Civil engineers
Computer, automated teller, and office machine repairers
2006-2010 Utah Male-dominated Occupations
Source: U.S. Census Bureau; EEO Tabulation.
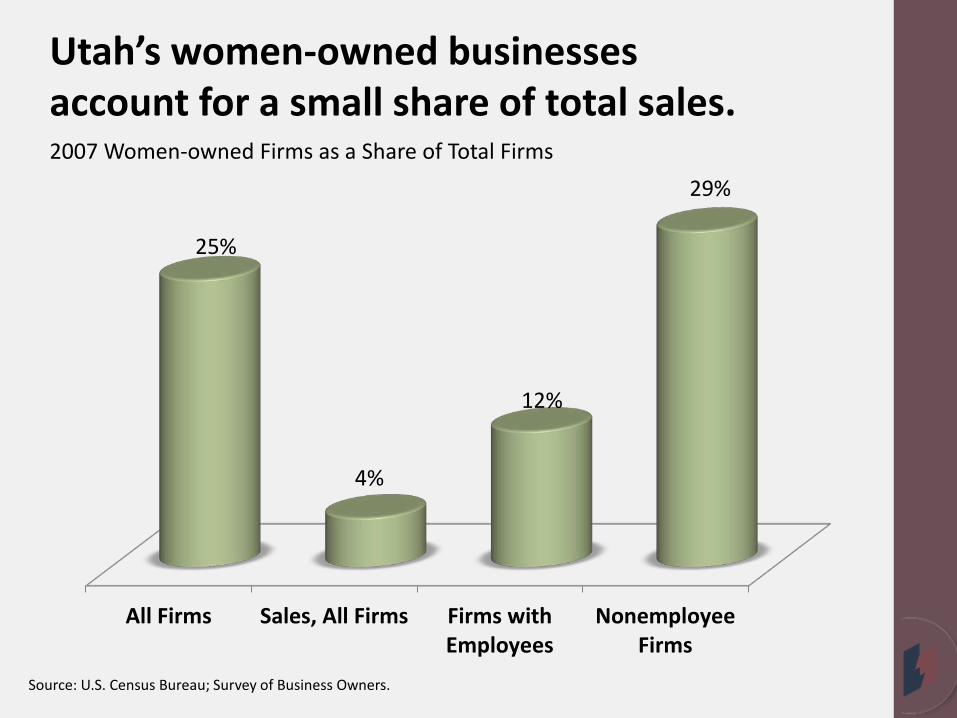
Utah’s women-owned businesses account for a small share of total sales.
All Firms Sales, All Firms Firms withEmployees
NonemployeeFirms
25%
4%
12%
29% 2007 Women-owned Firms as a Share of Total Firms
Source: U.S. Census Bureau; Survey of Business Owners.

Utah women work fewer hours than Utah men
Most Married Utah Women Work Outside
the home
Most Utah Women
Work
Most Utah Mothers
Work Outside the
Home
Utah Shows Higher Female
Labor Force Participation than
the U.S.
Utah women have been
slower to move into higher-
paying occupations

The gap in wages has lessened.
0%
10%
20%
30%
40%
50%
60%
70%
80%
90%
U.S. Female Median Usual Weekly Earnings as Percentage of Male Usual Weekly Earnings
Source: U.S. Bureau of Labor Statistics; Current Population Survey.

Statistically, Utah women make less than Utah men.
$34,062
$48,540
Women Men
2012 Utah Median Earnings of Year-Round, Full-time Workers
Source: U.S. Census Bureau; Survey of Business Owners.

Source: U.S. Census Bureau; American Community Survey.
Utah Female Median Annual Earnings as a Percent of Male Median Annual Earnings, 2012
70 Cents
On average, Utah women make 70 cents compared to the Utah male’s dollar

Utah women have the fourth-largest wage gap in the nation.
63.8% 66.9%
69.9% 70.2% 71.1%
73.3% 73.7% 73.8% 74.2% 75.1% 75.6% 75.8% 76.0% 76.2% 76.2% 76.3% 76.5% 76.8% 76.9% 77.2% 77.5% 77.5% 77.5% 77.6% 77.9% 78.1% 78.2% 78.4% 78.6% 78.6% 78.8% 78.9% 78.9% 79.1% 79.1% 79.8% 80.0% 80.3% 80.6% 81.1% 81.2% 82.2% 82.5% 82.9% 83.2% 83.6% 83.7% 83.9% 84.9% 85.3% 85.3%
90.1%
WyomingLouisiana
West VirginiaUtah
AlabamaIndiana
MichiganNorth Dakota
AlaskaIdaho
MississippiPennsylvania
KentuckyOklahoma
KansasMontanaMissouriArkansas
OhioNew Hampshire
TennesseeNebraska
IowaSouth Carolina
WisconsinSouth Dakota
WashingtonConnecticut
IllinoisNew Jersey
United StatesVirginiaOregon
MassachusettsTexas
MinnesotaColorado
New MexicoRhode Island
DelawareGeorgia
North CarolinaArizona
MaineHawaiiFlorida
CaliforniaNew YorkVermont
NevadaMaryland
District of Columbia
Source: U.S. Census Bureau; American Community Survey.
2012 Annual Female Median Earnings as a Percentage of Male Median Earnings, Year-Round, Full-time Workers

Changing to weekly earnings, closes the wage gap.
65.5% 72.0% 72.6% 73.9% 75.0% 76.0% 76.0% 76.4% 76.4% 77.0% 77.2% 77.3% 78.1% 78.1% 78.2% 78.3% 78.5% 78.7% 79.1% 79.2% 79.4% 79.5% 79.5% 79.5% 79.6% 80.4% 80.6% 80.6% 80.7% 80.8% 80.9% 80.9% 81.3% 81.7% 82.0% 82.1% 82.2% 82.6% 82.7% 82.8% 82.9% 83.0% 83.0% 83.3% 83.9% 84.1% 84.2% 84.9% 85.2% 86.0% 86.8%
94.8%
WyomingLouisiana
West VirginiaAlaska
MississippiUtah
WashingtonAlabamaGeorgia
ConnecticutMontanaMichigan
IndianaNorth Dakota
IdahoColoradoMissouri
KansasIllinois
New HampshireNew Jersey
IowaMaine
VirginiaTexas
New MexicoVermont
WisconsinNevada
MassachusettsUnited States
North CarolinaKentucky
PennsylvaniaSouth Dakota
HawaiiMinnesotaTennessee
Rhode IslandOhio
New YorkDelaware
OklahomaSouth Carolina
OregonArkansasNebraska
FloridaMarylandCalifornia
ArizonaDistrict of Columbia
Source: U.S. Bureau of Labor Statistics; Current Population Survey.
2012 Female Median Usual Weekly Earnings as a Percentage of Male Median Earnings, Full-time Workers

The highest-paying occupations for men are also the highest-paying occupations for women.
$18,834
$19,264
$19,518
$20,808
$23,706
$26,359
$29,421
$30,625
$30,631
$32,643
$33,637
$37,409
$38,987
$39,504
$40,160
$40,455
$41,157
$43,143
$45,359
$50,487
$52,180
$52,712
$54,956
$55,247
$56,340
$59,786
Building/grounds cleaning/maintenance
Food preparation and serving related
Personal care and service
Farming, fishing, and forestry
Healthcare support
Production
Sales and related
Transportation
Office and administrative support
Fire fighting/prevention/protective service
Total
Installation, maintenance, and repair
Community and social service
Arts/design/entertainment/sports/media
Law enforcement
Construction and extraction
Education, training, and library
Business and financial operations
Life, physical, and social science
Management
Legal
Healthcare practitioners and technical
Material moving
Architecture and engineering
Computer and mathematical
Health practitioners/technical
Source: U.S. Census Bureau; American Community Survey.
2008-2012 Utah Female Annual Median Earnings, Year-Round, Full-time Workers

The wage gap varies by occupation.
49.0%
60.0%
65.0%
65.0%
68.0%
68.0%
68.0%
68.0%
68.0%
71.0%
71.0%
73.0%
77.0%
78.0%
78.0%
79.0%
79.0%
80.0%
81.0%
82.0%
83.0%
87.0%
87.0%
87.0%
88.0%
95.0%
Legal
Sales and related
Health practitioners/technical
Building/grounds cleaning/maintenance
Total
Business and financial operations
Production
Transportation
Material moving
Management
Healthcare practitioners and technical
Education, training, and library
Arts/design/entertainment/sports/media
Architecture and engineering
Fire fighting/prevention, protective service
Law enforcement workers
Farming, fishing, and forestry
Computer and mathematical
Installation, maintenance, and repair
Life, physical, and social science
Personal care and service
Community and social service
Healthcare support
Office and administrative support
Food preparation and serving related
Construction and extraction
Source: U.S. Bureau of Labor Statistics; Current Population Survey.
2008-2012 Utah Annual Female Median Earnings as a Percentage of Male Median Earnings, Year-Round, Full-time Workers

More promotions =
higher wages.
More experience in
an occupation = higher wages.
More education =
higher wages.
More hours worked = more pay.
Occupations requiring more math, science,
analysis, management =
higher pay.
Moving in and out of the labor
force = lower pay.

The Gap explained? • Differences in human capital (education
experience) and worker characteristics can account for most of the male/female wage gap.
• Apples-to-apples comparisons shrink the wage gap.
• Differences in socialization, culture and expectations.
• Discrimination.

EDUCATION AND OCCUPATIONAL CHOICE are the largest factors behind the wage gap

Who is mostly likely to be poor?
5%
7%
8%
9%
10%
10%
13%
26%
26%
28%
29%
34%
Bachelor's Degree or Higher
65 Years and Older
Employed Male
Some College, Associate Degree
White, NonHispanic
Employed Female
All Persons
Less than a High School Graduate
Unemployed Male
Native American Indian
Hispanic/Latino
Unemployed Female
2012 Utah Percent of Persons with Incomes Below the Poverty Level
Source: U.S. Census Bureau.

What households are poor?
6%
15%
19%
28%
35%
44%
Married Couple Families
Male-headed Households
Nonfarmily Households
Female-headed Households
Female-headed Households withchildren under 18
Female-headed Households withchildren under 5
2012 Utah Percent of Households with Incomes Below the Poverty Level
Source: U.S. Census Bureau.

• Lecia Parks Langston • Senior Economist, Utah Department of
Workforce Services • 435-688-3115 • [email protected]
http://jobs.utah.gov/wi/pubs/hardatwork/
http://jobs.utah.gov/wi/pubs/specialreports.html
County-level data:
PowerPoint slides: