woce and beyond woce and beyond nov. 2002 sea level rise: can we explain what we measure? anny...
TRANSCRIPT

WOCE and BEYOND WOCE and BEYOND Nov. 2002Nov. 2002
Sea Level Rise:Sea Level Rise:Can we explain Can we explain
what we measure?what we measure?
Anny CazenaveAnny CazenaveLEGOS-GRGS/CNESLEGOS-GRGS/CNES
Toulouse, FranceToulouse, France


- - STERIC sea level: change in STERIC sea level: change in DensityDensity
-- EUSTATIC sea level: change in EUSTATIC sea level: change in Ocean Mass Ocean Mass
Temperature Temperature SalinitySalinity
Water mass exchange Water mass exchange with continents and ice capswith continents and ice caps
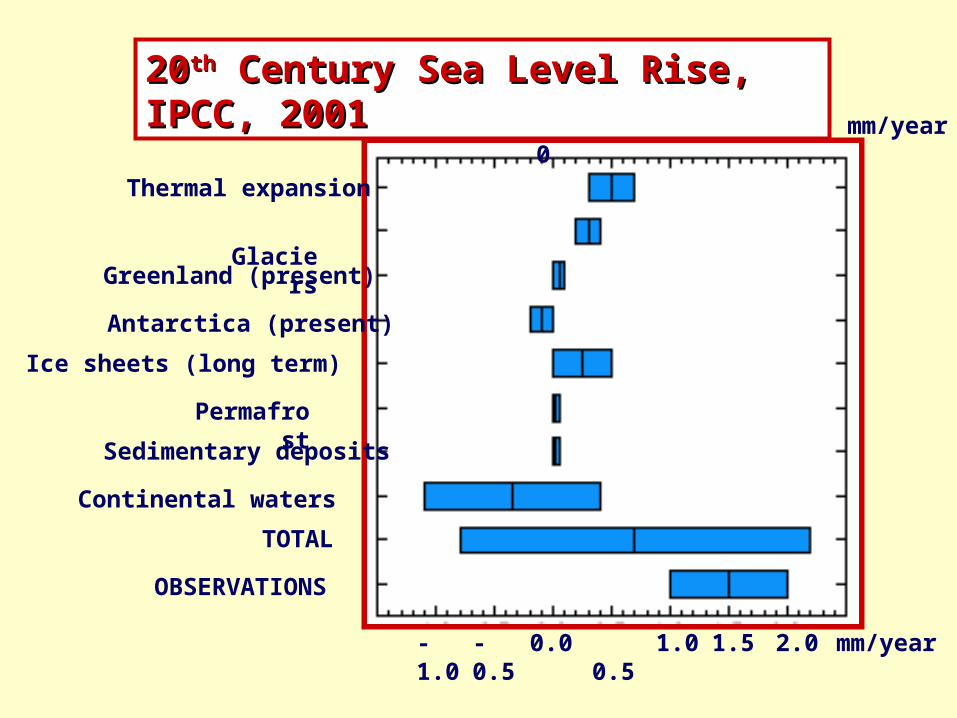
-1.0 -0.5 0.5 1.0 1.5 2.00.0
0.0 1.0-1.0
mm/year
2.0 mm/year
Thermal expansion
Glaciers
Greenland (present)
Antarctica (present)
Ice sheets (long term)
Permafrost
Sedimentary deposits
TOTAL
OBSERVATIONS
Continental waters
2020thth Century Sea Level Rise, IPCC, 2001 Century Sea Level Rise, IPCC, 2001
SUMMARY OF RECENT RESULTSSUMMARY OF RECENT RESULTS
During the 1990s, sea level has been rising by During the 1990s, sea level has been rising by ~ 3 mm/yr evidence for a recent acceleration ???~ 3 mm/yr evidence for a recent acceleration ???
Steric and eustatic sea level change recognized as Steric and eustatic sea level change recognized as highly non uniform overestimate of the 20highly non uniform overestimate of the 20thth century sea level rise by tide gauges ???century sea level rise by tide gauges ???
New rates for glaciers and ice sheets recent meltingNew rates for glaciers and ice sheets recent melting
Land water mass contribution to sea level rise can Land water mass contribution to sea level rise can now be estimatednow be estimated

ObservationsObservationsofof
Present-Day Sea Level RisePresent-Day Sea Level Rise

Sea Level Rise Sea Level Rise during the 1990sduring the 1990s
fromfromSatellite AltimetrySatellite Altimetry
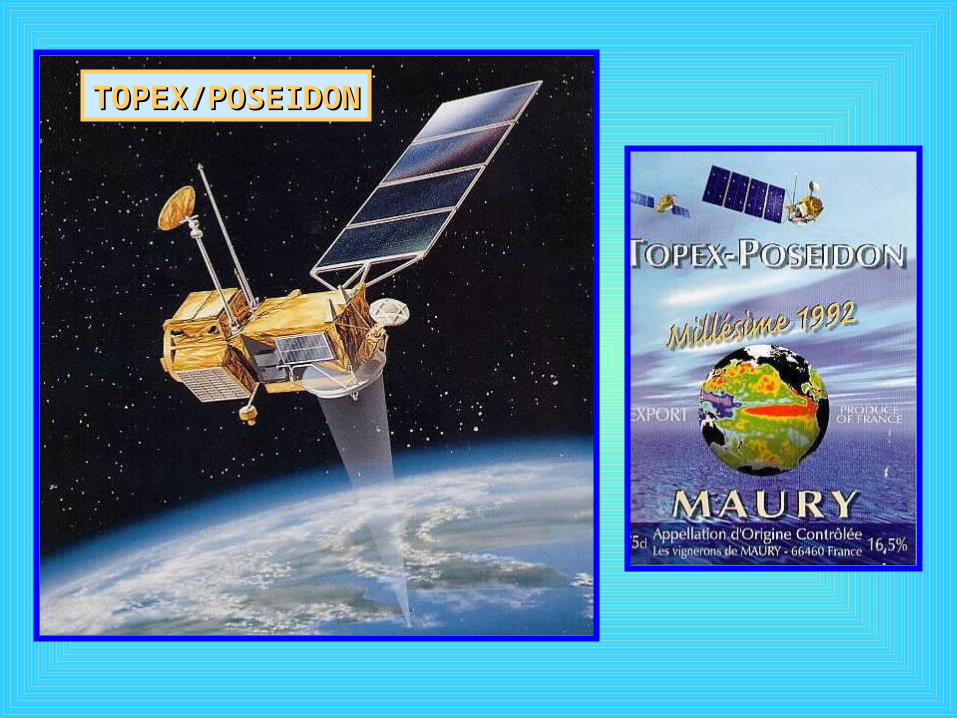
TOPEX/POSEIDONTOPEX/POSEIDON


SEA LEVEL TRENDS measured by SEA LEVEL TRENDS measured by TOPEX/POSEIDON (1993-2001)TOPEX/POSEIDON (1993-2001)
Trends in mm/year

Satellite Altimetry forSatellite Altimetry for Global Mean Sea Level Global Mean Sea Level
AdvantagesAdvantages• high-precisionhigh-precision• high spatio-temporal high spatio-temporal
resolutionresolution• global coverageglobal coverage• absolute absolute
measurementsmeasurements
DrawbacksDrawbacks• time series still short time series still short
(10 years)(10 years)
• no coverage of high-no coverage of high-latitude oceans (T/P latitude oceans (T/P & Jason)& Jason)

Sea Level Rise Sea Level Rise during the 20during the 20thth century century
fromfromTide GaugesTide Gauges

WORLDWIDE TIDE GAUGE NETWORK -2001-

Tide gauges used by B. Douglas (1997)Tide gauges used by B. Douglas (1997)

SAN FRANCISCOSAN FRANCISCO BRESTBREST
NEW YORKNEW YORK STOCKHOLMSTOCKHOLM

Main processes causing vertical land motions
• Tectonic deformationsTectonic deformations• Seismic activitySeismic activity• Volcanic activityVolcanic activity• Viscous deformation of the Earth’s mantleViscous deformation of the Earth’s mantle (Post Glacial Rebound)(Post Glacial Rebound)• Land subsidence due to sediments compaction, Land subsidence due to sediments compaction,
underground water extraction, etc.underground water extraction, etc.
• Surface loading due to air and water mass Surface loading due to air and water mass redistribution among atmosphere, oceans, redistribution among atmosphere, oceans, continental water reservoirs and ice capscontinental water reservoirs and ice caps

Deformation of the Earth’s mantle under ice sheet loadingDeformation of the Earth’s mantle under ice sheet loadingand POST GLACIAL REBOUNDand POST GLACIAL REBOUND

TIDE GAUGE-BASEDTIDE GAUGE-BASEDSEA LEVEL RISE SEA LEVEL RISE
FOR THE 20FOR THE 20thth CENTURY CENTURYGlobalGlobal
• 1.5 1.5 +/- 0.5 mm/yr (IPCC, 2001)+/- 0.5 mm/yr (IPCC, 2001)
• 1.711.71 +/- 0.55 mm/yr (Douglas, 2001; +/- 0.55 mm/yr (Douglas, 2001;
27 sites)27 sites)
• 1.841.84 +/- 0.35 mm/yr (Peltier, 2001; +/- 0.35 mm/yr (Peltier, 2001;
27 sites)27 sites)
• 1.51.5 +/- 0.4 mm/yr (Tamaseia et al., 2001; 23 +/- 0.4 mm/yr (Tamaseia et al., 2001; 23 sites)sites)
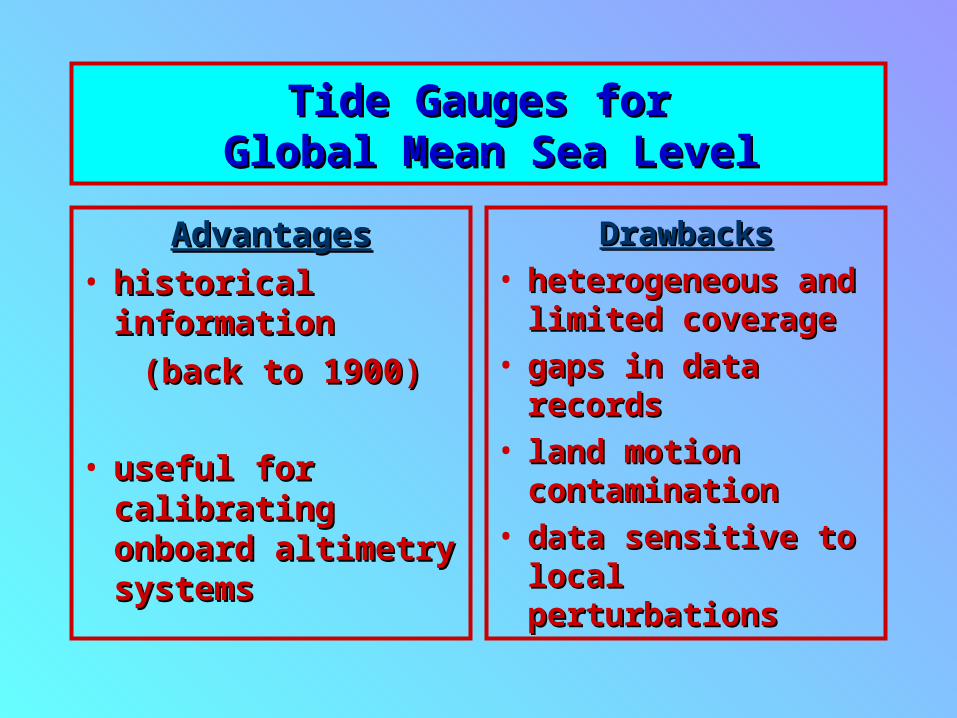
Tide Gauges forTide Gauges for Global Mean Sea Level Global Mean Sea Level
AdvantagesAdvantages• historical historical
information information
(back to 1900)(back to 1900)
• useful for calibrating useful for calibrating onboard altimetry onboard altimetry systemssystems
DrawbacksDrawbacks• heterogeneous and heterogeneous and
limited coveragelimited coverage• gaps in data recordsgaps in data records• land motion land motion
contaminationcontamination• data sensitive to local data sensitive to local
perturbationsperturbations

Sea level change during the last 6000 yearsSea level change during the last 6000 years
20th century
-6000 years present
From Lambeck, 2002From Lambeck, 2002

CONSTRAINTS CONSTRAINTS FROM FROM
ASTRONOMICAL/GEOPHYSICALASTRONOMICAL/GEOPHYSICAL OBSERVABLESOBSERVABLES
CONSTRAINTS CONSTRAINTS FROM FROM
ASTRONOMICAL/GEOPHYSICALASTRONOMICAL/GEOPHYSICAL OBSERVABLESOBSERVABLES

Astronomical/Geophysical ObservablesAstronomical/Geophysical Observables
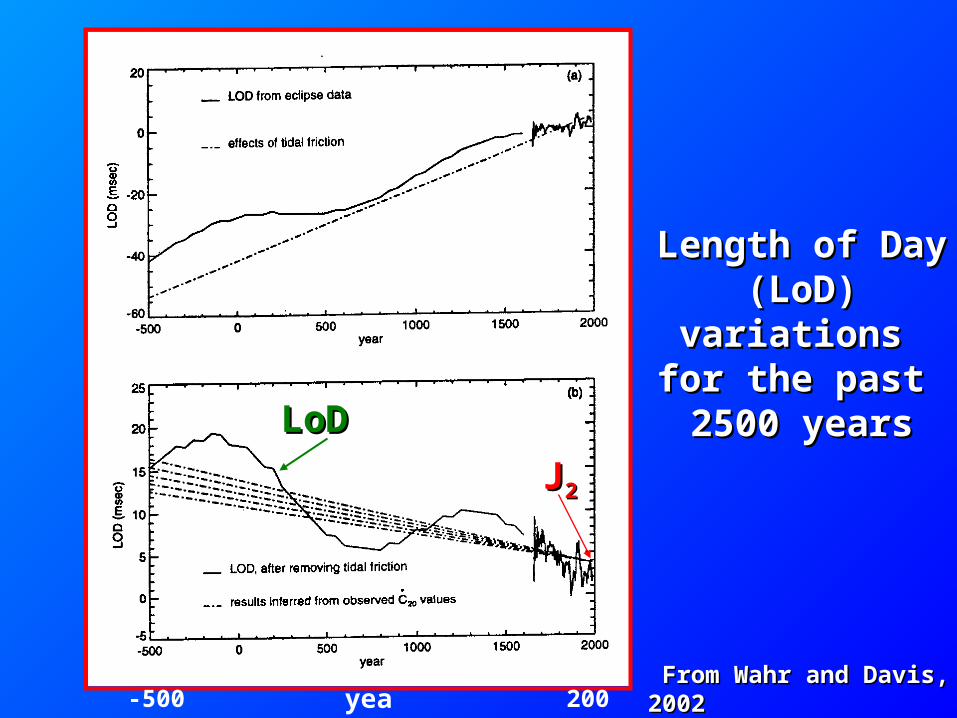
Non-tidal Earth ’s rotation acceleration or Non-tidal Earth ’s rotation acceleration or length of day -LOD- deceleration: -0.6 ms/cy length of day -LOD- deceleration: -0.6 ms/cy for the past 2500 yearsfor the past 2500 years
Secular decrease of the Earth ’s dynamical Secular decrease of the Earth ’s dynamical flattening : -3x10flattening : -3x10-11-11/yr for the past 25 years/yr for the past 25 years
Secular movement of the Earth ’s rotation Secular movement of the Earth ’s rotation pole: 10 m/cy towards Greenland over the past pole: 10 m/cy towards Greenland over the past 100 years100 years
2J&

From Wahr and Davis, 2002 From Wahr and Davis, 2002
Length of DayLength of Day(LoD)(LoD)
variations variations for the past for the past 2500 years2500 yearsLoDLoD
JJ22
-500 year 2000
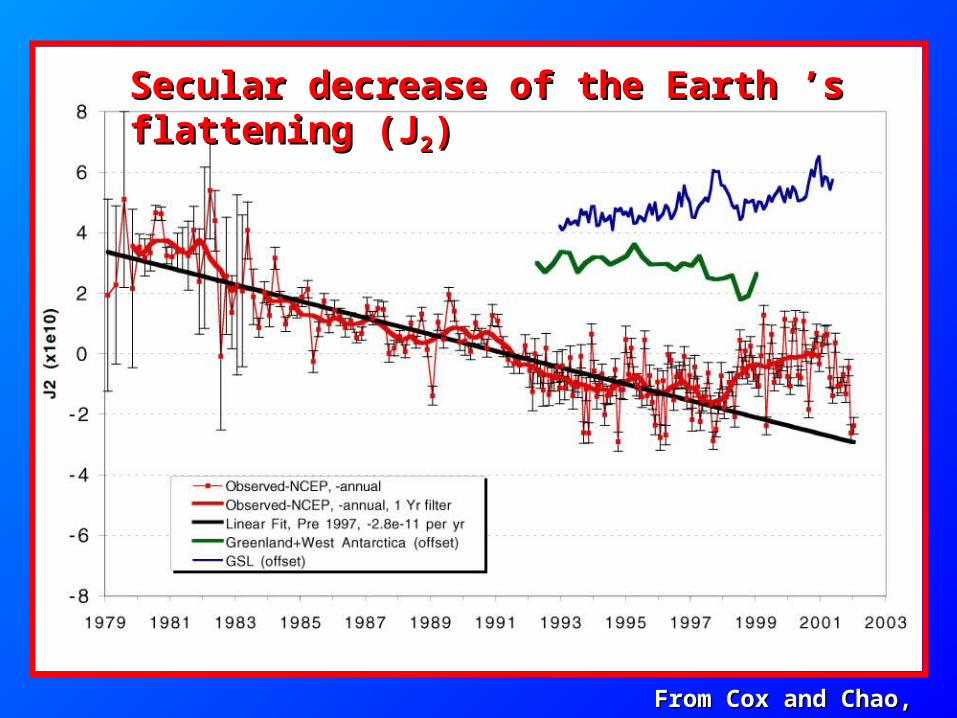
Secular decrease of the Earth ’s flattening (JSecular decrease of the Earth ’s flattening (J22))
From Cox and Chao, 2002From Cox and Chao, 2002
From Wahr and Davis, 2002 From Wahr and Davis, 2002
Length of DayLength of Day(LoD)(LoD)
variations variations for the past for the past 2500 years2500 yearsLoDLoD
JJ22
-500 year 2000


From Sabadini and Vermeersen, 2002From Sabadini and Vermeersen, 2002
Post Glacial Rebound
PGR + present-day melting
AA+G
observation
Secular Decrease of the Earth’s FlatteningSecular Decrease of the Earth’s Flattening

Long-wavelength geoidLong-wavelength geoid Sketch of the Earth’s interiorSketch of the Earth’s interior
Viscosity of the Earth’s mantleViscosity of the Earth’s mantle

Sketch of the Earth’s interiorSketch of the Earth’s interior
Lower Lower mantlemantle
CoreCore
Upper Upper mantlemantle
Viscosity profilesViscosity profiles from global from global
circulation modelscirculation models

Secular decreases ofSecular decreases ofLength of Day and Earth’s flattening Length of Day and Earth’s flattening
are not are not strong constraints on strong constraints on
present-day eustatic sea level risepresent-day eustatic sea level rise

DO WE UNDERSTAND DO WE UNDERSTAND OBSERVATIONS OBSERVATIONS
OFOFPRESENT-DAY PRESENT-DAY
SEA LEVEL RISE?SEA LEVEL RISE?
Sea Level Rise Sea Level Rise duringduring
the 1990sthe 1990s

Carte des dérives duniveau de la mer entre
1993 et 1998
en haut :Topex/Poseidon
en bas :expansion thermique
SEA LEVEL TRENDS SEA LEVEL TRENDS FOR 1993-1998FOR 1993-1998
(mm/yr)(mm/yr)
Upper map : Upper map : ObservedObserved
(Topex/Poseidon)(Topex/Poseidon)
Bottom map: Bottom map: Computed Computed
(thermal expansion)(thermal expansion)
--
Topex/Poseidon (1993-1998)Topex/Poseidon (1993-1998)
Thermal expansion (1993-1998)Thermal expansion (1993-1998)
From Cabanes et al., 2001-27 mm/yr +27

World ocean temperature data base
S. Levitus, C. Stephens, J.I. Antonov & T.P. BoyerNOAA Atlas NESDIS 40, 2000
World ocean temperature data base
S. Levitus, C. Stephens, J.I. Antonov & T.P. BoyerNOAA Atlas NESDIS 40, 2000
Global gridded time series of ocean temperature data at different depths:
• 0-500 m : yearly means for 1945-1998• 0-3000 m : 5-year means for 1945-1995
Global gridded time series of ocean temperature data at different depths:
• 0-500 m : yearly means for 1945-1998• 0-3000 m : 5-year means for 1945-1995

Topex/Poseidon sea level---Topex/Poseidon sea level---Thermal expansion----Thermal expansion----Résidual----Résidual----
From Cabanes et al., 2001
Sea level rise measured by Topex/Poseidon is mainly caused by
thermal expansion (warming) of ocean waters

Sea Level Rise Sea Level Rise duringduring
the 20the 20thth century century

-1.0 -0.5 0.5 1.0 1.5 2.00.0
0.0 1.0-1.0
mm/year
2.0 mm/year
Thermal expansion
Glaciers
Greenland (present)
Antarctica (present)
Ice sheets (long term)
Permafrost
Sedimentary deposits
TOTAL
OBSERVATIONS
Continental waters
2020thth Century Sea Level Rise, IPCC, 2001 Century Sea Level Rise, IPCC, 2001

Past CenturyPast Century Sea Level Rise:Sea Level Rise:
is the observedis the observed1.5 mm/yr rate1.5 mm/yr rate
too high?too high?OROR
are climate-related are climate-related contributions contributions
underestimated?underestimated?
Past CenturyPast Century Sea Level Rise:Sea Level Rise:
is the observedis the observed1.5 mm/yr rate1.5 mm/yr rate
too high?too high?OROR
are climate-related are climate-related contributions contributions
underestimated?underestimated?
Steric Sea Level Trends for the Upper 3000m (1955-1994)
Global Steric Sea Level (0 - 3000 m)
0.5 +/- 0.05 mm/yr
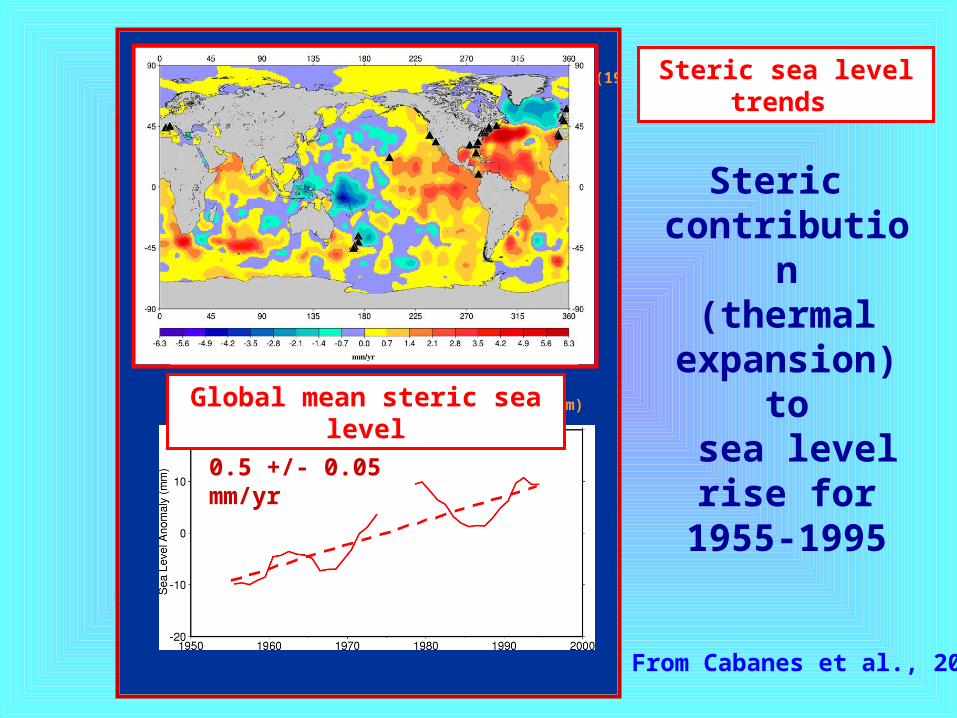
Steric contribution
(thermal expansion)
to sea level rise for 1955-1995
0.5 +/- 0.05 mm/yr
Steric sea level trends
Global mean steric sea level
From Cabanes et al., 2001
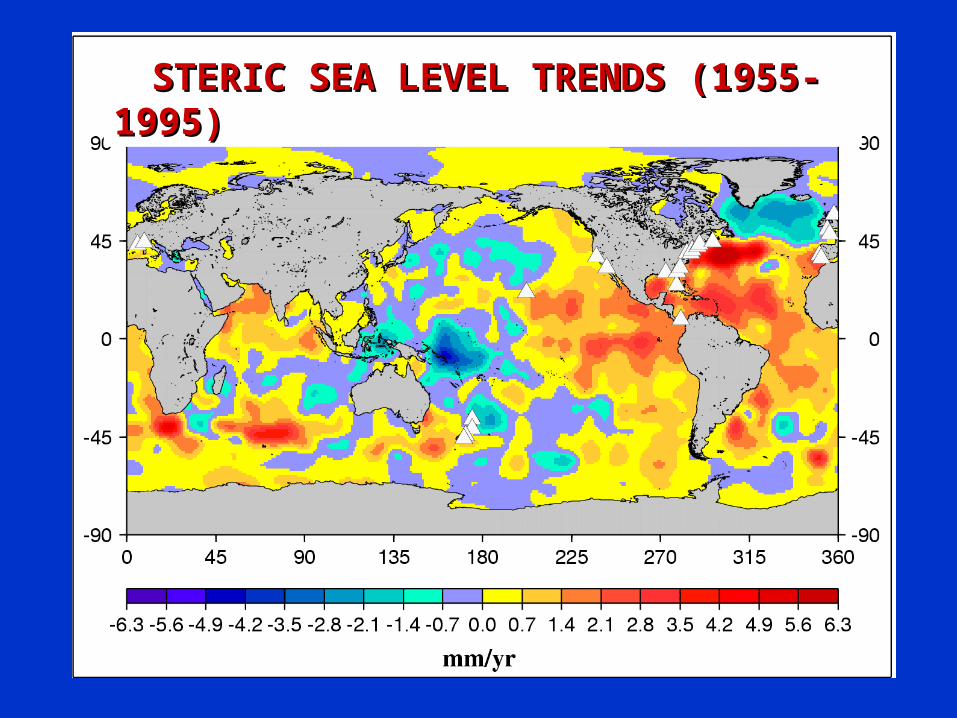
STERIC SEA LEVEL TRENDS (1955-1995)STERIC SEA LEVEL TRENDS (1955-1995)
0.5 +/- 0.05 mm/yr
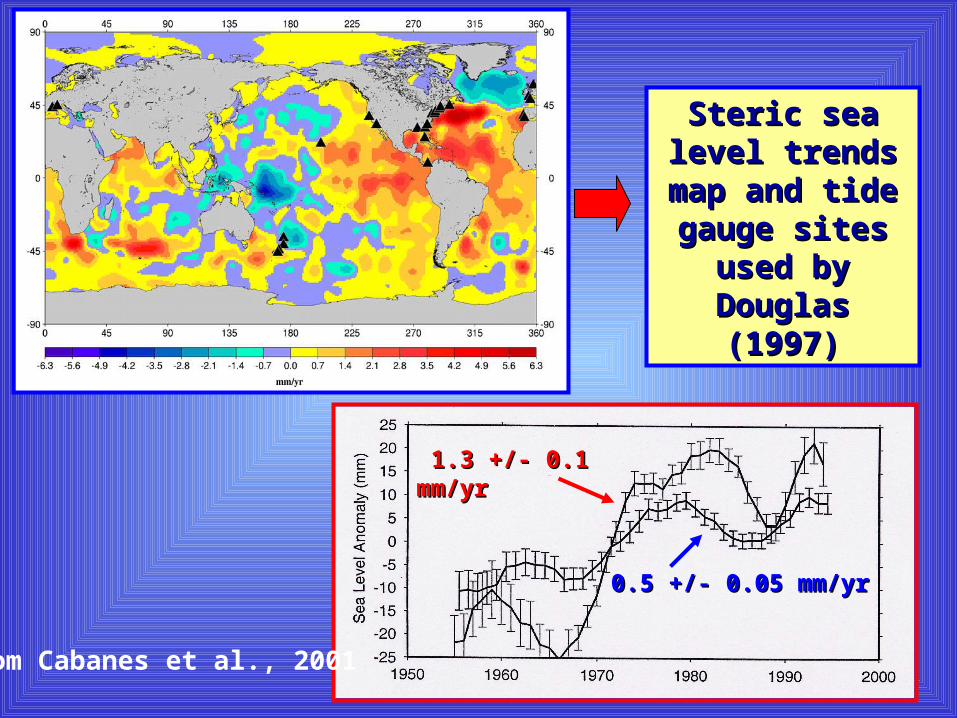
1.4 +/- 0.1 mm/yr
Steric sea level Steric sea level trends map and trends map and tide gauge sites tide gauge sites used by Douglas used by Douglas
(1997)(1997)
1.3 +/- 0.1 1.3 +/- 0.1 mm/yrmm/yr
0.5 +/- 0.05 mm/yr0.5 +/- 0.05 mm/yr
From Cabanes et al., 2001

SEA LEVEL RISE (1955-1995)SEA LEVEL RISE (1955-1995)
Steric average at the 25 tide gauge sites:Steric average at the 25 tide gauge sites: 1.3 +/- 0.1 mm/yr1.3 +/- 0.1 mm/yr
Observed by tide gauges (25 sites) : Observed by tide gauges (25 sites) : 1.6 +/- 0.15 mm/yr1.6 +/- 0.15 mm/yr
Thermal expansion (global mean) : Thermal expansion (global mean) : 0.5 +/- 0.05 mm/yr0.5 +/- 0.05 mm/yr
Salinity effect (global mean) : Salinity effect (global mean) : 0.05 +/- 0.02 mm/yr0.05 +/- 0.02 mm/yr
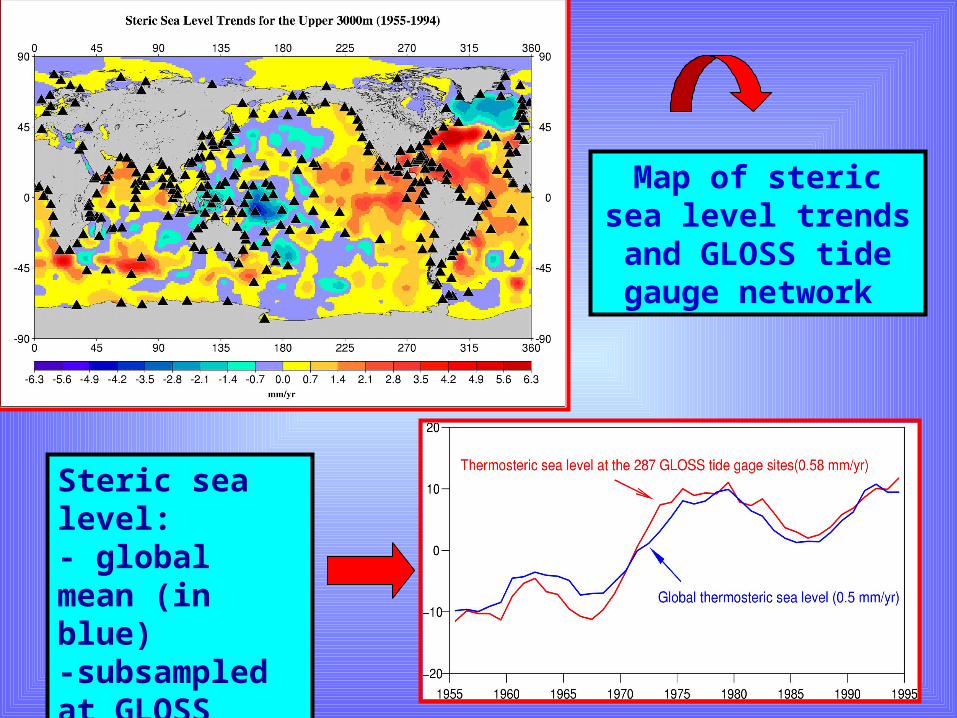
Map of steric sea level trends and GLOSS tide gauge network
Steric sea level:- global mean (in blue)-subsampled at GLOSS sites (in red)

The inhomogeneous distribution of historical tide gauges used to estimate the 20th century sea level rise cannot capture
the regional thermosteric variability
Tide gauge-based estimates of 20th century sea level rise too high???

EUSTATIC EUSTATIC SEA LEVEL RISESEA LEVEL RISE
(ocean mass change)(ocean mass change)

Eustatic contribution Eustatic contribution from from
land water storageland water storage(change in the global water cycle(change in the global water cycle))
Eustatic contribution Eustatic contribution from from
land water storageland water storage(change in the global water cycle(change in the global water cycle))

-1.0 -0.5 0.5 1.0 1.5 2.00.0
0.0 1.0-1.0
mm/year
2.0 mm/year
Thermal expansion
Glaciers
Greenland (present)
Antarctica (present)
Ice sheets (long term)
Permafrost
Sedimentary deposits
TOTAL
OBSERVATIONS
Continental waters
2020thth Century Sea Level Rise, IPCC, 2001 Century Sea Level Rise, IPCC, 2001

Precipitation
Evaporation
Evaporation
Transpiration
Precipitation :
RiversLakes
Oceans Soil Moisture
Ground Waters
Atmosphere
Snow Pack
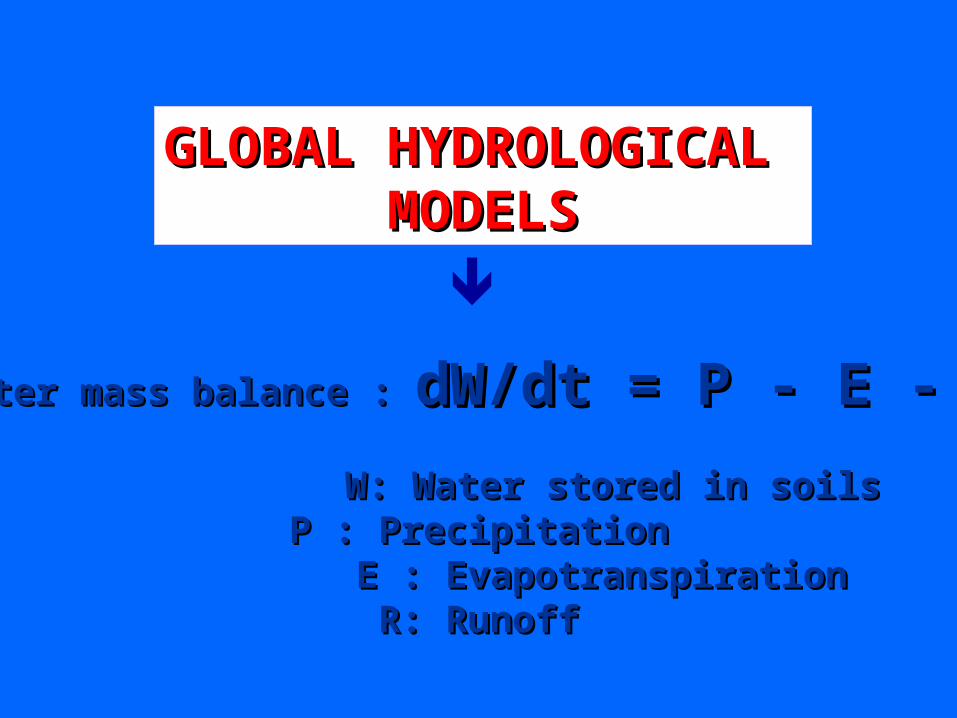
Water mass balance : Water mass balance : dW/dt = P - E - RdW/dt = P - E - R
W: Water stored in soilsW: Water stored in soilsP : PrecipitationP : Precipitation
E : EvapotranspirationE : EvapotranspirationR: RunoffR: Runoff
GLOBAL HYDROLOGICAL GLOBAL HYDROLOGICAL MODELSMODELS
THE LAND DYNAMICS (LaD) MODELTHE LAND DYNAMICS (LaD) MODEL
P.C.D. Milly and A.B. ShmakinP.C.D. Milly and A.B. ShmakinNOAA/university of PrincetonNOAA/university of Princeton
J. Hydrometeorology, 2001J. Hydrometeorology, 2001
GLOBAL MODELING OF LAND WATER GLOBAL MODELING OF LAND WATER AND AND
ENERGY BALANCESENERGY BALANCES
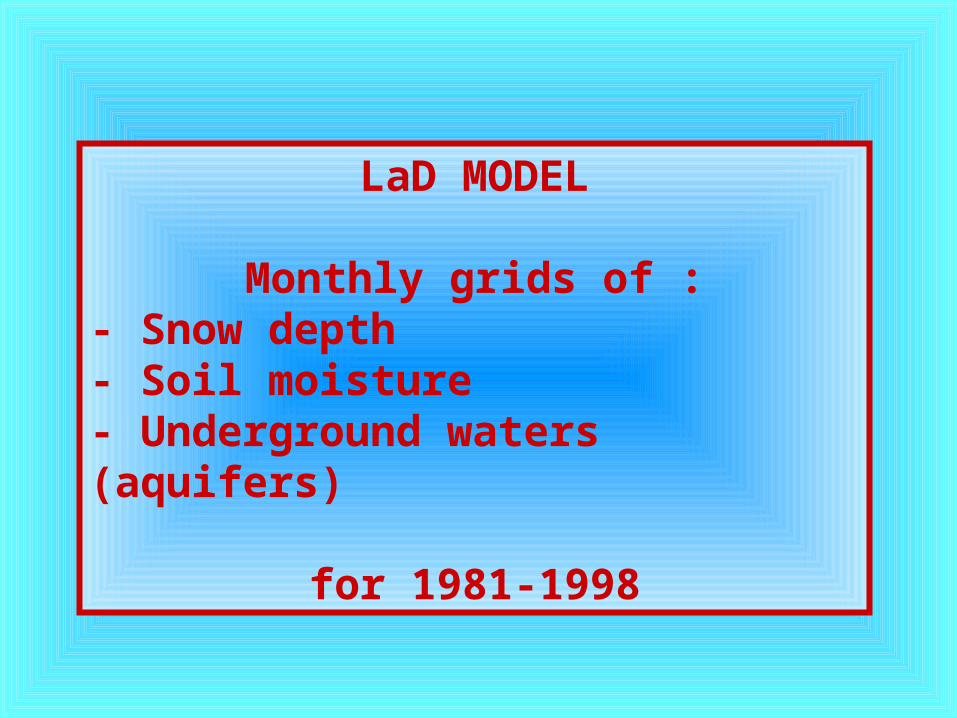
LaD MODEL
Monthly grids of :- Snow depth- Soil moisture- Underground waters (aquifers)
for 1981-1998

LAND WATER MASS CONTRIBUTION TO SEA LEVEL CHANGELAND WATER MASS CONTRIBUTION TO SEA LEVEL CHANGELAND WATER MASS CONTRIBUTION TO SEA LEVEL CHANGE
0.13 mm/yr0.13 mm/yr
0.05 mm/yr0.05 mm/yr
0.18 mm/yr0.18 mm/yr
Soil watersSoil waters
SnowSnow
TotalTotal

Trends in land water content (1981-1998)Trends in land water content (1981-1998)
drierdrier wetterwetter - 3 mm/yr 3 mm/yr- 3 mm/yr 3 mm/yr

Trends in precipitation on land (1981-1998)
drierdrier wetterwetter

Land water mass contribution to sea level rise over 1980-2000
amounts to 0.2 mm/year

EUSTATIC CONTRIBUTION EUSTATIC CONTRIBUTION FROM FROM
MOUNTAIN GLACIERS MOUNTAIN GLACIERS ANDAND
ICE SHEETSICE SHEETS
EUSTATIC CONTRIBUTION EUSTATIC CONTRIBUTION FROM FROM
MOUNTAIN GLACIERS MOUNTAIN GLACIERS ANDAND
ICE SHEETSICE SHEETS

Eustatic contribution from mountain Eustatic contribution from mountain glaciers, ice sheets and land watersglaciers, ice sheets and land waters
MOUNTAIN GLACIERSMOUNTAIN GLACIERS : < +0.5 mm/yr : < +0.5 mm/yr
ICE SHEETSICE SHEETS : : Greenland : +0.13 mm/yr Greenland : +0.13 mm/yr (Krabill et al., 2000)(Krabill et al., 2000)
Antarctica : +0.16 +/- 0.05 mm/yr (WA) Antarctica : +0.16 +/- 0.05 mm/yr (WA) 0 +/- 0.07 mm/yr (EA)0 +/- 0.07 mm/yr (EA) total = + 0.16 mm/yrtotal = + 0.16 mm/yr
(Rignot and Thomas, 2002)(Rignot and Thomas, 2002)
LAND WATERLAND WATER :+0.2 mm/yr :+0.2 mm/yr (Milly et al., 2002)(Milly et al., 2002)
TOTAL : ~1 mm/yrTOTAL : ~1 mm/yr

From Dyurgerov and Meier, 2002From Dyurgerov and Meier, 2002
Sea level rise due to mountain glaciersSea level rise due to mountain glaciers

Eustatic contributions from mountain Eustatic contributions from mountain glaciers, ice sheets and land watersglaciers, ice sheets and land waters
MOUNTAIN GLACIERSMOUNTAIN GLACIERS : < +0.5 mm/yr : < +0.5 mm/yr
ICE SHEETSICE SHEETS : : Greenland : +0.13 mm/yr Greenland : +0.13 mm/yr (Krabill et al., 2000)(Krabill et al., 2000)
Antarctica : +0.16 +/- 0.05 mm/yr (WA) Antarctica : +0.16 +/- 0.05 mm/yr (WA) 0 +/- 0.07 mm/yr (EA)0 +/- 0.07 mm/yr (EA) total = + 0.16 mm/yrtotal = + 0.16 mm/yr
(Rignot and Thomas, 2002)(Rignot and Thomas, 2002)
LAND WATERLAND WATER :+0.2 mm/yr :+0.2 mm/yr (Milly et al., 2002)(Milly et al., 2002)
TOTAL : ~1 mm/yrTOTAL : ~1 mm/yr

since SEA LEVEL RISE of the since SEA LEVEL RISE of the 1990s is fully explained by 1990s is fully explained by
thermal expansion, there is no thermal expansion, there is no room for an additional 1 mm/yr room for an additional 1 mm/yr
eustatic contribution…..eustatic contribution…..

-1.0 -0.5 0.5 1.0 1.5 2.00.0
0.0 1.0-1.0
mm/year
2.0 mm/year
Thermal expansion
Glaciers
Greenland (present)
Antarctica (present)
Ice sheets (long term)
Permafrost
Sedimentary deposits
TOTAL
OBSERVATIONS
Continental waters
2020thth Century Sea Level Rise, IPCC, 2001 Century Sea Level Rise, IPCC, 2001

ACCELERATION OF SEA LEVEL ACCELERATION OF SEA LEVEL RISE IN THE LAST 1-2 DECADES ???RISE IN THE LAST 1-2 DECADES ???

STERIC SEA LEVEL ---------OBSERVED BY TOPEX/POSEIDON ------
1950 1990
1945 20001970
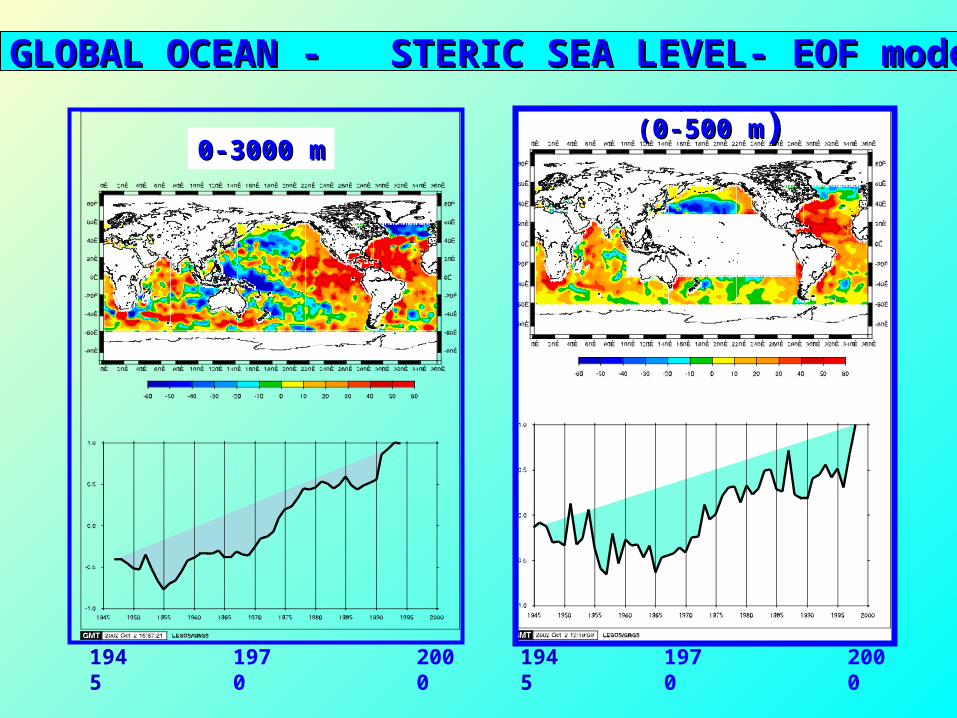
GLOBAL OCEAN - STERIC SEA LEVEL- EOF mode 1GLOBAL OCEAN - STERIC SEA LEVEL- EOF mode 1
(0-500 m(0-500 m))0-3000 m0-3000 m
1945 1970 2000

1945 20001970
ATLANTIC OCEAN - STERIC SEA LEVEL-EOF mode 1ATLANTIC OCEAN - STERIC SEA LEVEL-EOF mode 1
0-500 m0 -3000 m
1945 1970 2000

TOPEX/POSEIDONTOPEX/POSEIDONSEA LEVELSEA LEVEL
EOF mode 1EOF mode 1
1993 2003

From Dyurgerov and Meier, 2002From Dyurgerov and Meier, 2002
Sea level rise due to mountain glaciersSea level rise due to mountain glaciers
change in rate?

PERSPECTIVESPERSPECTIVES
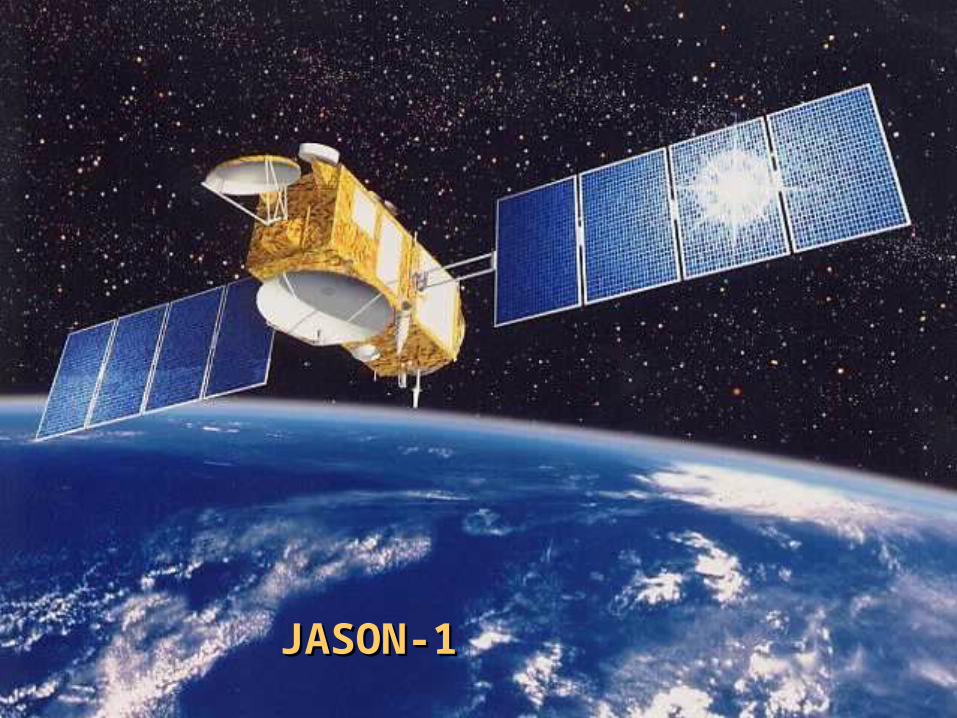
JASON-1JASON-1
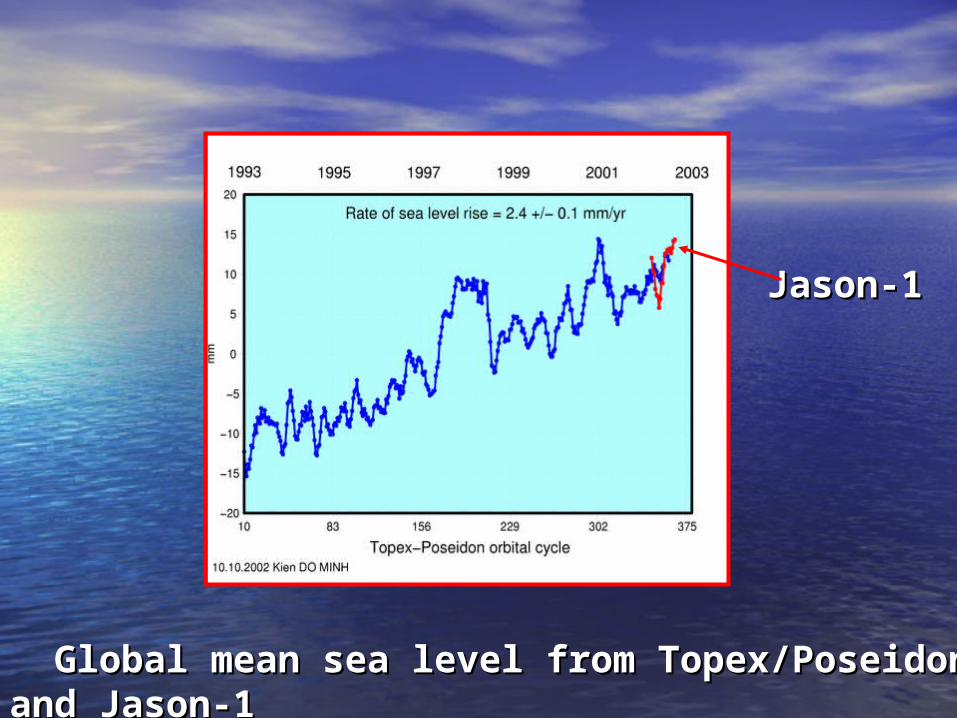
Global mean sea level from Topex/Poseidon and Jason-1Global mean sea level from Topex/Poseidon and Jason-1
Jason-1Jason-1

GRACE satellites launched on March 17, 2002
Circulation oceanique
Variations temporelles du champ de gravitéVariations temporelles du champ de gravitéTEMPORAL CHANGE OF THE GRAVITY FIELDTEMPORAL CHANGE OF THE GRAVITY FIELD
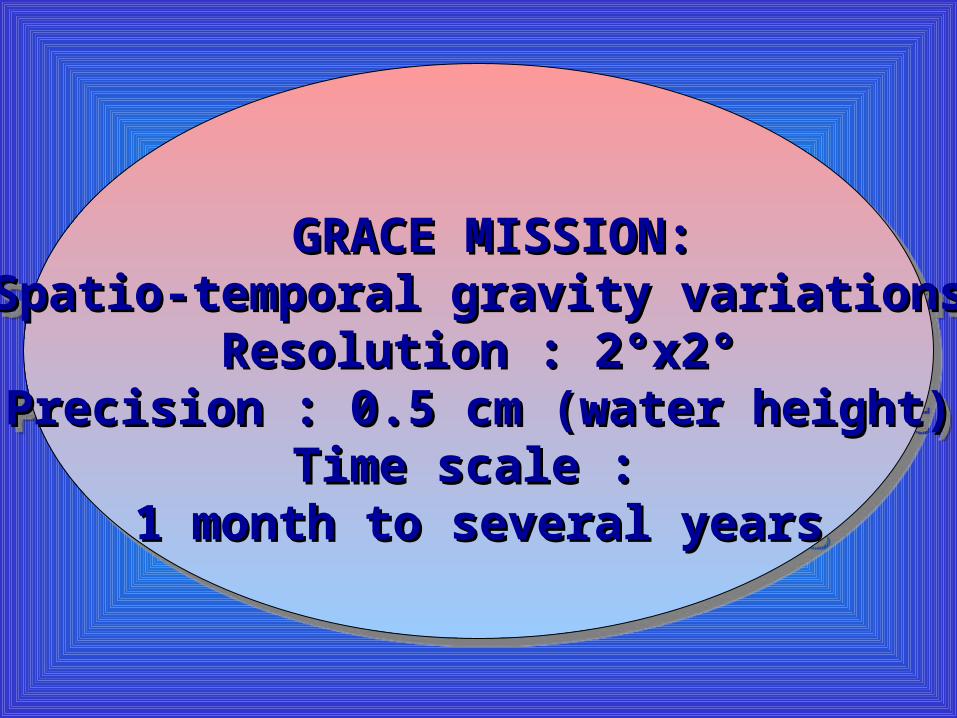
GRACE MISSION:GRACE MISSION:
Spatio-temporal gravity variationsSpatio-temporal gravity variationsResolution : 2°x2°Resolution : 2°x2°
Precision : 0.5 cm (water height)Precision : 0.5 cm (water height)Time scale : Time scale :
1 month to several years1 month to several years
GRACE MISSION:GRACE MISSION:
Spatio-temporal gravity variationsSpatio-temporal gravity variationsResolution : 2°x2°Resolution : 2°x2°
Precision : 0.5 cm (water height)Precision : 0.5 cm (water height)Time scale : Time scale :
1 month to several years1 month to several years

Precipitation
Evaporation
Evaporation
Transpiration
Precipitation :
RiversLakes
Oceans Soil Moisture
Ground Waters
Atmosphere
Snow Pack


Separation of thermalSeparation of thermal and mass contributionsand mass contributions
Sea level riseSea level riseGRACE (land)GRACE (land)
Land water Land water andand
ice sheetsice sheets mass balancemass balance
Ocean water mass changeOcean water mass change
GRACE (ocean)GRACE (ocean)
JASONJASON
