wnt signaling regulates mitochondrial physiology and insulin sensitivity
TRANSCRIPT

Wnt signaling regulates mitochondrialphysiology and insulin sensitivity
John C. Yoon,1,2 Aylwin Ng,3 Brian H. Kim,4 Antonio Bianco,4 Ramnik J. Xavier,3
and Stephen J. Elledge1,5
1Howard Hughes Medical Institute, Division of Genetics, Brigham and Women’s Hospital, Department of Genetics, HarvardMedical School, Boston, Massachusetts 02115, USA; 2Diabetes Unit, Department of Medicine, Massachusetts General Hospital,Harvard Medical School, Boston, Massachusetts 02114, USA; 3Center for Computational and Integrative Biology, MassachusettsGeneral Hospital, Harvard Medical School, Boston, Massachusetts 02114, USA; 4Thyroid Division, Department of Medicine,Brigham and Women’s Hospital, Harvard Medical School, Boston, Massachusetts 02115, USA
Mitochondria serve a critical role in physiology and disease. The genetic basis of mitochondrial regulation inmammalian cells has not yet been detailed. We performed a large-scale RNAi screen to systematically identifygenes that affect mitochondrial abundance and function. This screen revealed previously unrecognized roles for>150 proteins in mitochondrial regulation. We report that increased Wnt signals are a potent activator ofmitochondrial biogenesis and reactive oxygen species (ROS) generation, leading to DNA damage and accelerationof cellular senescence in primary cells. The signaling protein insulin receptor substrate-1 (IRS-1), shown here to bea transcriptional target of Wnt, is induced in this setting. The increased level of IRS-1 drives activation ofmitochondrial biogenesis; furthermore, in insulin-responsive cell types, it enhances insulin signaling, raising thepossibility that Wnt proteins may be used to modulate glucose homeostasis. Our results identify a key componentof the mitochondrial regulatory apparatus with a potentially important link to metabolic and degenerativedisorders.
[Keywords: RNAi screen; mitochondria; Wnt signaling; IRS-1]
Supplemental material is available at http://www.genesdev.org.
Received March 11, 2010; revised version accepted June 7, 2010.
Mitochondrial dysfunction has been implicated as causalor contributory factors in several important human dis-orders (DiMauro and Schon 2003; Loeb et al. 2005; Lowelland Shulman 2005; Wallace 2005; Kroemer 2006; Lin andBeal 2006). Congenital defects in mitochondrial energymetabolism underlie a multitude of clinical syndromesin the pediatric population (DiMauro and Schon 2003).Several common metabolic and degenerative disorders ofadulthood also have strong links to mitochondrial dys-function (Loeb et al. 2005; Lowell and Shulman 2005; Linand Beal 2006). An elaborate system of regulatory controlover mitochondrial abundance and function is essential,given the wide-ranging impact of mitochondria on manyvital cellular processes. The currently known regulatorsof mitochondria have been identified primarily by gain-of-function approaches and are few in number. As such,there is a compelling need for a better understanding ofthe genes involved in normal mitochondrial regulation inmammalian cells. To this end, we carried out an RNAi-based genetic screen to identify novel regulators of mi-
tochondrial density and membrane potential. Our resultsprovide a framework for further investigation of mito-chondrial biology in mammalian cells.
Results
We developed a flow cytometry-based siRNA screentargeting 6363 genes (Fig. 1A). A C2C12 mouse musclecell line was employed because it is a well-characterized,nontransformed cell line that may have potential rele-vance with respect to understanding muscle mitochon-drial abnormalities seen in type 2 diabetes. Many con-genital mitochondrial disorders are associated withprominent neuromuscular phenotypes as well (DiMauroand Schon 2003). Cells were plated in 96-well plates andtransfected with siRNAs in duplicate. Five days later, thecells were stained with two different mitochondria-specificdyes, MitoTracker Green and MitoTracker Red CMXRos,and analyzed by high-throughput flow cytometry. Thisstrategy has been employed previously for simultaneousassessment of mitochondrial abundance and membranepotential in live cells (Poot and Pierce 2001; Pendergrasset al. 2004). Both dyes vary with mitochondrial abun-dance. MitoTracker Red is also sensitive to mitochondrial
5Corresponding author.E-MAIL [email protected]; FAX (617) 525-4500Article is online at http://www.genesdev.org/cgi/doi/10.1101/gad.1924910.
GENES & DEVELOPMENT 24:1507–1518 � 2010 by Cold Spring Harbor Laboratory Press ISSN 0890-9369/10; www.genesdev.org 1507
Cold Spring Harbor Laboratory Press on April 10, 2019 - Published by genesdev.cshlp.orgDownloaded from

membrane potential, while MitoTracker Green is mini-mally affected; thus, the ratio of Red-to-Green can beused to detect changes in the mitochondrial membranepotential while adjusting for any concomitant changes inmitochondrial mass. A positive correlation was notedbetween MitoTracker Green and MitoTracker Red, asexpected, but not between MitoTracker Green and theRed-to-Green ratio (Fig. 1B). As a proof of principle, weconfirmed that siRNAs targeting Sin3A and Ccnd1—twogenes reported previously to negatively regulate mito-chondria (Pile et al. 2003; Wang et al. 2006)—produced anincrease in the Red-to-Green ratio or both the Mito-Tracker Green signal and the Red-to-Green ratio, respec-tively (Fig. 1C,D; Supplemental Figs. S1, S2A). These
changes were further validated by directly measuringmitochondrial DNA by quantitative PCR and by measur-ing mitochondrial membrane potential with the potenti-ometric dye tetramethyl rhodamine ethyl ester (TMRE)(Fig. 1D; Supplemental Fig. S2B).
The initial screen used pools of four siRNAs per gene.Pools were classified as possible hits if they altered theMitoTracker Green signal (reflecting a change in mito-chondrial mass), the MitoTracker Red signal (reflectinga change in either mitochondrial mass, membrane poten-tial, or both), or the Red-to-Green ratio (reflecting achange in mitochondrial membrane potential) by anincrease >40% or a decrease >20% compared with theplate mean. Candidate genes were then validated by
Figure 1. siRNA screen for mitochondrial regulators. (A) Schematic diagram of the screen. (B) Distribution of MitoTracker Greenversus MitoTracker Red CMXRos signals (left plot) and MitoTracker Green versus the Red-to-Green ratio (right plot) in the primaryscreen. (C) Assessment of mitochondrial content by MitoTracker Green signal and mitochondrial DNA quantitation after siRNAdepletion of Sin3A and Ccnd1. (*) P < 0.05 by unpaired t-test. (D) Assessment of mitochondrial membrane potential by the Red-to-Green ratio and TMRE signal after siRNA depletion of Sin3A and Ccnd1. (*) P < 0.05. (E) Network extension of the WNT pathway. Thenetwork was constructed by anchoring on canonical WNT pathway components (diamonds) using protein interaction data,incorporating interactions with human orthologs of screen hits (red) via up to one bridging component (blue). The interactions shownfulfilled a Benjamini and Hochberg (BH)-adjusted P-value of <0.05 for the given network size.
Yoon et al.
1508 GENES & DEVELOPMENT
Cold Spring Harbor Laboratory Press on April 10, 2019 - Published by genesdev.cshlp.orgDownloaded from
repeating the transfection experiments with each of thefour individual siRNAs. In the validation round, the com-parison was made to wells receiving a control siRNA.Confirmation required at least two out of the four oligo-nucleotides reproducing the phenotype, which decreasesthe likelihood of off-target effects. About 2.8% of the genesscreened were found to significantly alter one of the threeparameters in this fashion (Supplemental Table S1).
The validated hits include genes participating in a di-verse array of biological processes, and are statisticallyenriched for genes involved in nucleic acid metabolism,protein metabolism and modification, intracellular pro-tein trafficking, and regulation of the cell cycle (Supple-mental Figs. S3, S4; Supplemental Tables S2–S5). In termsof molecular function, there was an enrichment forkinases (Supplemental Fig. S4; Supplemental Table S6).Many of these genes have been implicated previously invarious human disorders linked to degenerative, onco-logic, or metabolic processes (Supplemental Fig. S3;Supplemental Table S7), while others have been cited inthe literature in key functional contexts such as senes-cence, DNA damage, apoptosis, and diabetes (Supple-mental Fig. S5; Supplemental Table S8). Fifteen proteinshave previous associations with mitochondria (Supple-mental Table S9). An siRNA directed against pyruvatedehydrogenase kinase (PDK1), a negative regulator ofpyruvate entry into the TCA cycle, produced an increasein the Red-to-Green ratio, suggesting that it normallyreduces mitochondrial activity. Depletion of uncouplingprotein 2 (UCP2) likewise increased the Red-to-Greenratio, consistent with the notion that it normally dissi-pates the mitochondrial membrane potential withoutsignificantly affecting mitochondrial mass. The screenalso identified Wolfram syndrome 1 (WFS1), a putativetransmembrane protein of unknown function discoveredrecently to be a type 2 diabetes susceptibility gene bygenome-wide association studies (Sandhu et al. 2007),suggesting another link between diabetes and mitochon-drial regulation.
Wnt signaling activates mitochondrial biogenesisand oxidative phosphorylation (OXPHOS)gene expression
Among the validated hits, we noted the presence of twogenes with known connections to the Wnt signaling path-way. The APC gene scored during the validation roundin the MitoTracker Red category, suggesting that Wntsignaling may enhance mitochondrial biogenesis and/oractivity. The transcriptional regulator ZBTB33 (alsoknown as kaiso), reported previously to negatively regu-late Wnt signaling in Xenopus, scored in the MitoTrackerGreen and Red categories (Ruzov et al. 2004; Park et al.2005). We further tested siRNAs directed against b-cateninand Axin2, two well-established components of this path-way, and found results consistent with a role for Wntsignaling as a positive activator of mitochondrial pro-liferation (data not shown). Based on these observations,we constructed an extended Wnt network using proteininteraction data (Keshava et al. 2009), which revealed
connections to a number of other hits from the screen(Fig. 1E). Wnt signaling has been a subject of intensiveinvestigation in recent years, especially in the contexts ofdevelopment, tissue renewal, degenerative diseases, andcancer (Moon et al. 2004; Clevers 2006)—all processes inwhich mitochondria are thought to play prominent roles.We hypothesized that some of the biological phenotypesof Wnt signaling may be mediated through its effects onmitochondria, and, given the importance of the processescontrolled by Wnt signaling, further reasoned that a care-ful analysis of this pathway in the context of mitochon-drial regulation may yield valuable insights.
In order to test if a direct modulation of the Wntsignaling pathway could affect mitochondria, we addedrecombinant Wnt3A protein to the C2C12 cell culturemedia. We found that mitochondrial biogenesis wasmarkedly induced within 3 d in a dose-dependent fashion,as assessed by MitoTracker Green staining and directquantitation of mitochondrial DNA (Fig. 2A). To furtherevaluate structural changes in mitochondria, we exam-ined these cells using transmission electron microscopy.We observed a range of mitochondrial morphologies thatlargely overlapped between the control and Wnt3A-treatedcells. Quantitative analysis revealed that Wnt3A-treatedcells showed a nearly twofold increase in mitochondrialvolume density compared with controls (Fig. 2B,C; Sup-plemental Fig. S6). Individual mitochondria of unusuallylarge size or length were seen occasionally in Wnt3A-treated cells but not in controls (Supplemental Fig. S7).
To determine if the increased mitochondria were func-tional, we examined cellular oxygen consumption inWnt3A-treated C2C12 cells. Significant enhancement ofbasal cellular respiration was seen in Wnt3A-treated cells(Fig. 2D,E); addition of the uncoupler 2,4-dinitrophenol(DNP) elicited a much greater increase in Wnt3A-treatedcells compared with untreated cells, consistent witha bona fide increase in functional mitochondrial abun-dance and the maximal respiratory capacity (Fig. 2D).There was no significant difference in the inner mito-chondrial membrane proton leak, measured by adding theATP synthase inhibitor oligomycin (Fig. 2E), indicatingthat nearly all of the changes in mitochondrial bioener-getics produced by Wnt3A treatment involved respirationcoupled to OXPHOS. Consistent with this idea, we alsofound an induction in the expression of key mitochon-drial OXPHOS genes (Fig. 2F), such as ATP synthase g
subunit (ATP5g1), cytochrome c (Cyc1), and mitochon-drially encoded cytochrome oxidase subunit 2 (Cox2).These increases were detectable at 48 h after initiation oftreatment, and were more pronounced at 72 h. We ob-served essentially the same results in primary mouseembryonic fibroblasts (MEFs) (Fig. 2G,H), indicating thatthis pathway is likely to be functionally important acrossdifferent cell types. Analysis of the OXPHOS complexesat the protein level (Supplemental Fig. S8) and assays ofcitrate synthase activity (Supplemental Fig. S9) providedfurther confirmation of the increases in respiratory ca-pacity. Intact mitochondria purified from Wnt3A-treatedcells also showed enhanced state III oxidation with aden-osine disphosphate (ADP) (Supplemental Fig. S10).
Wnt signaling regulates mitochondria
GENES & DEVELOPMENT 1509
Cold Spring Harbor Laboratory Press on April 10, 2019 - Published by genesdev.cshlp.orgDownloaded from

We also investigated the effect of adding recombinantDkk-1 protein, a soluble antagonist of Wnt signaling (Moonet al. 2004; Clevers 2006), and found a reduction inMitoTracker Green fluorescence and mitochondrial DNAcontent (Fig. 2I). This shows that attenuation of endogenousWnt signaling produces significant effects on mitochondria,and is consistent with the notion that Wnt signals mayrepresent a control point for mitochondrial regulation.
We next asked whether this effect of Wnt3A is medi-ated through the canonical signaling cascade involving
b-catenin and TCF, or through noncanonical pathways.C2C12 cells stably expressing the dominant-negativeTCF4 cDNA (Supplemental Fig. S11), which binds theTCF target sites but is not regulated by b-catenin, showedreduced levels of mitochondrial DNA, and were resistantto the stimulatory effects of Wnt3A (Fig. 2J). These cellsalso showed a significant reduction in basal and stimu-lated respiration, while the proton leak was unaffected(Fig. 2K,L). These results suggest that the Wnt3A effect onmitochondria is primarily through the canonical pathway
Figure 2. Increased Wnt signals activate mitochondrial biogenesis and OXPHOS gene expression. Cells received either 0.1% BSA inPBS (control) or the recombinant Wnt3A protein at the doses indicated. (*) P < 0.05 by unpaired t-test; (**) P < 0.01. (A) Mitochondrialproliferation in C2C12 cells following Wnt3A treatment as assessed by mitochondrial DNA quantitation. (B) Electron micrographs ofC2C12 cells treated with control or 50 ng/mL Wnt3A protein for 3 d. (C) Wnt3A-treated cells show a significant increase inmitochondrial volume density (P < 0.05), as quantified by using a grid superimposed on electron micrographs (N = 15 each). The numberof points falling within mitochondria was expressed as a percentage of the number of points falling within cytoplasm. A small increasein cristae surface density was also noted (data not shown). Error bars represent SEM. (D,E) Increased cellular oxygen consumptionresults from Wnt3A treatment. Drugs were added at the indicated times. (F) Activation of mitochondrial OXPHOS gene expressionfrom Wnt3A treatment. (G,H) Mitochondrial proliferation and increased OXPHOS gene expression in MEFs following 3 d of Wnt3Aexposure. (I) Treatment with the Wnt3A antagonist Dkk-1 (5 mg/mL) for 1 wk reduces mitochondrial DNA in MEFs. (J) Stableexpression of dominant-negative TCF4 (DN TCF4) cDNA reduces mitochondrial DNA and abrogates the Wnt3A effect onmitochondrial proliferation. C2C12 cells were transduced with retroviruses carrying an empty vector or the dominant-negativeTCF4 cDNA, and were selected for puromycin resistance. (*) P < 0.05 for control versus Wnt3A; (y) P < 0.05 for vector versus dominant-negative TCF4 (DN TCF4). (K,L) Dominant-negative TCF4 cDNA expression reduces oxygen consumption. DNP and oligomycin wereinjected at the indicated times to measure the maximal respiratory capacity and uncoupled respiration, respectively.
Yoon et al.
1510 GENES & DEVELOPMENT
Cold Spring Harbor Laboratory Press on April 10, 2019 - Published by genesdev.cshlp.orgDownloaded from
involving TCF4. Interestingly, we also found that theaddition of recombinant Wnt5A protein, which has beenreported to signal through noncanonical pathways in avariety of assays (Ishitani et al. 2003; Topol et al. 2003),antagonizes the Wnt3A effect on mitochondria in a dose-dependent fashion (Supplemental Fig. S12). This raisesthe possibility of complex functional interactions be-tween the Wnt3A-mediated mitochondrial proliferationpathway and other signaling cascades activated by extra-cellular modulators.
We also examined the transcriptional regulatorZBTB33 by generating cell lines stably expressing shRNAagainst ZBTB33. Two independent shRNAs that pro-duced a significant knockdown of the ZBTB33 transcript(>60%) substantially increased the mitochondrial DNA,mitochondrial OXPHOS gene expression, and cellularoxygen consumption (Supplemental Fig. S13A–C). Over-expression of the cDNA significantly reduced cellularoxygen consumption (Supplemental Fig. S13D). Takentogether, these results reinforce the notion that Wntsignaling is a key regulator of mitochondrial function.
Wnt-mediated cellular senescence is dependenton mitochondrial reactive oxygen species(ROS) production
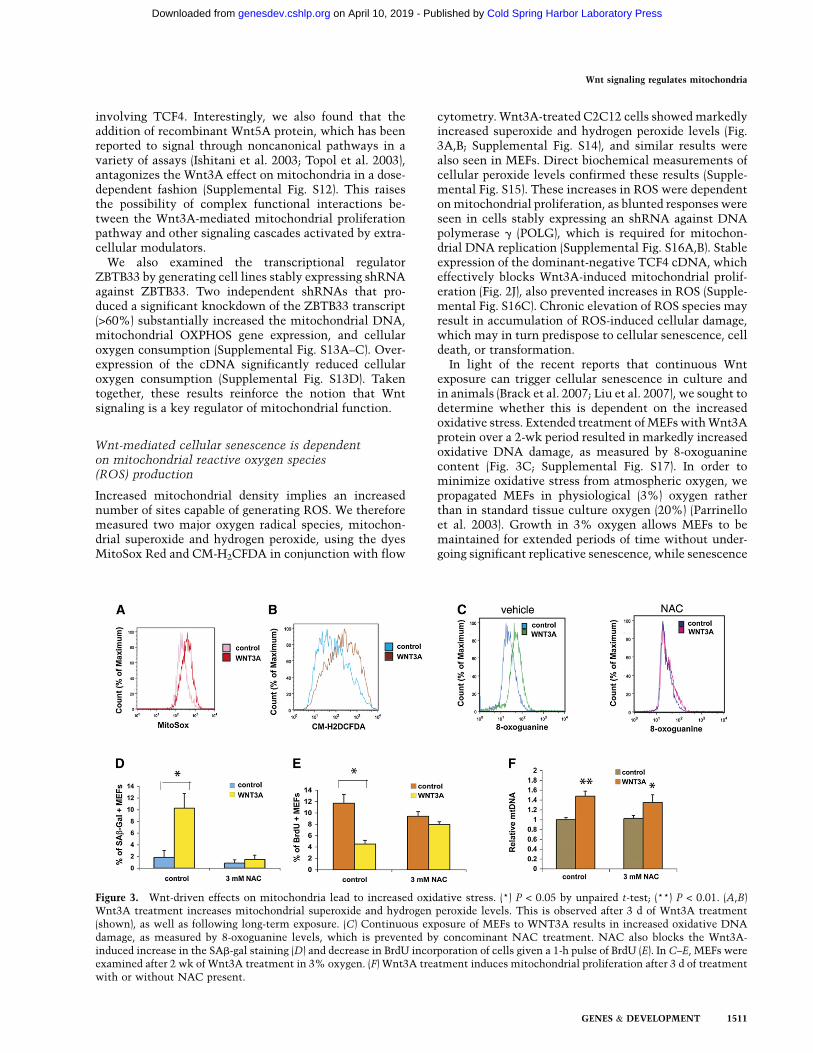
Increased mitochondrial density implies an increasednumber of sites capable of generating ROS. We thereforemeasured two major oxygen radical species, mitochon-drial superoxide and hydrogen peroxide, using the dyesMitoSox Red and CM-H2CFDA in conjunction with flow
cytometry. Wnt3A-treated C2C12 cells showed markedlyincreased superoxide and hydrogen peroxide levels (Fig.3A,B; Supplemental Fig. S14), and similar results werealso seen in MEFs. Direct biochemical measurements ofcellular peroxide levels confirmed these results (Supple-mental Fig. S15). These increases in ROS were dependenton mitochondrial proliferation, as blunted responses wereseen in cells stably expressing an shRNA against DNApolymerase g (POLG), which is required for mitochon-drial DNA replication (Supplemental Fig. S16A,B). Stableexpression of the dominant-negative TCF4 cDNA, whicheffectively blocks Wnt3A-induced mitochondrial prolif-eration (Fig. 2J), also prevented increases in ROS (Supple-mental Fig. S16C). Chronic elevation of ROS species mayresult in accumulation of ROS-induced cellular damage,which may in turn predispose to cellular senescence, celldeath, or transformation.
In light of the recent reports that continuous Wntexposure can trigger cellular senescence in culture andin animals (Brack et al. 2007; Liu et al. 2007), we sought todetermine whether this is dependent on the increasedoxidative stress. Extended treatment of MEFs with Wnt3Aprotein over a 2-wk period resulted in markedly increasedoxidative DNA damage, as measured by 8-oxoguaninecontent (Fig. 3C; Supplemental Fig. S17). In order tominimize oxidative stress from atmospheric oxygen, wepropagated MEFs in physiological (3%) oxygen ratherthan in standard tissue culture oxygen (20%) (Parrinelloet al. 2003). Growth in 3% oxygen allows MEFs to bemaintained for extended periods of time without under-going significant replicative senescence, while senescence
Figure 3. Wnt-driven effects on mitochondria lead to increased oxidative stress. (*) P < 0.05 by unpaired t-test; (**) P < 0.01. (A,B)Wnt3A treatment increases mitochondrial superoxide and hydrogen peroxide levels. This is observed after 3 d of Wnt3A treatment(shown), as well as following long-term exposure. (C) Continuous exposure of MEFs to WNT3A results in increased oxidative DNAdamage, as measured by 8-oxoguanine levels, which is prevented by concominant NAC treatment. NAC also blocks the Wnt3A-induced increase in the SAb-gal staining (D) and decrease in BrdU incorporation of cells given a 1-h pulse of BrdU (E). In C–E, MEFs wereexamined after 2 wk of Wnt3A treatment in 3% oxygen. (F) Wnt3A treatment induces mitochondrial proliferation after 3 d of treatmentwith or without NAC present.
Wnt signaling regulates mitochondria
GENES & DEVELOPMENT 1511
Cold Spring Harbor Laboratory Press on April 10, 2019 - Published by genesdev.cshlp.orgDownloaded from

is routine in 20% oxygen (Parrinello et al. 2003). Underthe low-oxygen conditions, endogenous ROS generation,which largely takes place within mitochondria, is themajor determinant of oxidative stress in cells. We saw aclear increase in senescence-associated b-galactosidase(SAb-gal) staining, and a decrease in proliferation mea-sured by BrdU incorporation in Wnt3A-treated cells (Fig.3D,E; Supplemental Fig. S18). Importantly, all of theseparameters were effectively normalized by the concom-itant addition of the peroxide scavenger N-acetylcysteine(NAC) (Fig. 3C–E; Supplemental Fig. S18). Stable expres-sion of the mitochondrial superoxide dismutase (SOD2)cDNA had a similar but less pronounced effect (Supple-mental Fig. S19A–C). Mitochondrial biogenesis was stillstimulated by Wnt under these circumstances (Fig. 3F),consistent with the idea that it is directly activated byWnt rather than as a secondary response to an increase inROS levels. The induction of Wnt-mediated senescence,in contrast, required elevated ROS levels. These datastrongly suggest that Wnt induces replicative senescencein MEFs via increased mitochondrial biogenesis and theconsequent increase in ROS-mediated damage.
Wnt-mediated mitochondrial proliferation involvesIRS-1 and Myc
In light of the above data suggesting that Wnt3A acts onmitochondria through the canonical pathway (Fig. 2J–L),we hypothesized that transcriptional targets of TCF4 arelikely to mediate the mitochondrial phenotype. Weexamined known targets of TCF4 and focused on thetranscription factor Myc, which has been shown to bindand activate genes involved in mitochondrial biogenesisand function, and to increase ROS (He et al. 1998; Vafaet al. 2002; Li et al. 2005; Kim et al. 2008). These effects ofMyc on mitochondrial proliferation are consistent withits role as a pleiotropic regulator of cellular functions,including growth, differentiation, and apoptosis. Indeed,we found that siRNA or shRNA-based depletion of Mycreduced Wnt-mediated mitochondrial proliferation at day3 by more than half (Fig. 4A; Supplemental Figs. S20, S21).Interestingly, while Myc is known to be a direct target ofTCF4 in colon cancer cells (He et al. 1998; Hatzis et al.2008), we found the Myc transcript levels did not riseuntil ;36 h after treatment with Wnt3A protein (Fig. 4B),and the Myc protein levels initially remained the same aswell (Fig. 4C; Supplemental Fig. S22).
The delay in Myc induction kinetics suggested thepossible existence of another Wnt target that is activatedearlier and facilitates the subsequent induction of Myc.We therefore examined gene expression patterns inC2C12 cells following Wnt3A treatment using DNAmicroarrays. We looked for genes that were elevated atleast twofold at both 5 h and 24 h after Wnt3A treatment,and compared this group to a recently published list of;7000 high-confidence TCF4 chromatin occupancy sites(Hatzis et al. 2008) to identify potential direct TCF4targets. The overlapping genes’ mRNAs were then in-dividually depleted in C2C12 cells with siRNA orshRNA, and treated with Wnt3A to look for a diminution
of response. The docking protein insulin receptor sub-strate-1 (IRS-1) emerged as an attractive candidate, pro-ducing a substantial reduction in Wnt-mediated mito-chondrial proliferation when depleted by RNAi (Fig. 4D;Supplemental Fig. S23). The IRS-1 mRNA and proteinwere induced rapidly in both C2C12 cells and MEFsfollowing Wnt3A treatment, and remained elevatedthroughout (Fig. 4B,C), suggesting that it is likely a directtranscriptional target. The IRS-1 protein was also inducedby stable expression of the Wnt3A cDNA—about two-fold—and was suppressed by ;40% when the Dkk-1cDNA was expressed (Fig. 4E), consistent with the notionthat endogenous Wnt signaling regulates the basal ex-pression of IRS-1. In addition, stable expression of thedominant-negative TCF4 cDNA reduced the basal IRS-1levels and abolished its induction by Wnt3A (Fig. 4F);TCF4 shRNAs likewise attenuated Wnt-dependent IRS-1induction (Supplemental Fig. S24). Chromatin immuno-precipitation (ChIP) analysis further confirmed that TCF4is bound to the promoter of IRS-1 (Fig. 4G). Stable over-expression of IRS-1 led to increased mitochondrial pro-liferation, elevated superoxide levels, and increased Myctranscript in the absence of exogenous Wnt, while de-pleting IRS-1 reduced the Myc transcript levels andlargely prevented its induction with Wnt3A (Supplemen-tal Figs. S25, S26).
We next attempted to understand how IRS-1 increasesthe Myc transcript. While the cytosolic/membrane local-ization of IRS-1 in association with the insulin andinsulin-like growth factor 1 (IGF-1) receptors is widelyknown, nuclear accumulation of IRS-1 following stimu-lation with IGF-1 has also been reported in the literature(Tu et al. 2002). Once inside the nucleus, IRS-1 is capableof associating with and activating specific promoters,although IRS-1 does not contain a DNA-binding motif(Wu et al. 2008). We reasoned that Wnt3A treatment maylead to an analogous set of events if the overall inductionof IRS-1 increases the nuclear IRS-1 concentration asa secondary consequence. We in fact saw a pronouncedelevation in nuclear IRS-1 following Wnt treatment inboth C2C12 cells and MEFs (Fig. 4H; data not shown).Much of the nuclear IRS-1 was chromatin-bound, consis-tent with a role in transcriptional regulation. We wereable to confirm by ChIP analysis the binding of IRS-1 tothe Myc promoter in a Wnt-dependent fashion (Fig. 4I).TCF4 also bound the same region of the Myc promoter,which led us to speculate that IRS-1 may associate withthe TCF4 transcriptional complex. Reciprocal coimmu-noprecipitation experiments using antibodies to IRS-1and TCF4 revealed a physical interaction between thesetwo proteins (Fig. 4J). Depletion of IRS-1 significantlyimpaired the chromatin association of the coactivatorb-catenin following Wnt3A treatment (Fig. 4K), suggest-ing that IRS-1 may enhance transcription in part bymodulating recruitment of other coactivators.
These data are consistent with the model that Wnt3Arapidly induces IRS-1, which then accumulates in thenucleus and increases transcription from the Myc pro-moter (Fig. 5D), in part by enhancing the recruitment ofb-catenin to the TCF complex occupying this promoter.
Yoon et al.
1512 GENES & DEVELOPMENT
Cold Spring Harbor Laboratory Press on April 10, 2019 - Published by genesdev.cshlp.orgDownloaded from

Myc, in turn, increases mitochondrial proliferation andROS production. In addition, the cytosolic targets of IRS-1are also likely to play a significant contributory role.
Wnt-mediated induction of IRS-1 enhancesinsulin signaling
Given the role of IRS-1 as a core signaling element ininsulin action, we examined whether Wnt-mediated in-duction of IRS-1 alters insulin action in insulin-responsivecells. Both treatment with recombinant Wnt3A proteinand stable expression of Wnt3A cDNA enhanced insulin-
stimulated Akt activation in C2C12 cells, as indicated byincreased phosphorylation of Akt at Ser473 (Fig. 5A,B).These differences were most pronounced at physiological(<1 nM) concentrations of insulin, although they werestill readily appreciable at concentrations as high as 10 nM.In muscle and liver, activated Akt is known to phosphor-ylate glycogen synthesis kinase 3, and thus stimulateglycogen synthesis, one of the hallmarks of insulin actionon cellular glucose metabolism (Taniguchi et al. 2006).Consistent with this, Wnt3A treatment produced signif-icant increases in insulin-stimulated glycogen synthesisin C2C12 myocytes, as assessed by incorporation of
Figure 4. Wnt-driven mitochondrial biogenesis involves Myc and IRS-1. (A) Depletion of Myc by shRNA reduces Wnt-drivenmitochondrial proliferation. Cells transduced with viruses expressing Myc shRNAs or controls were treated with Wnt3A for 3 d andassayed for MitoTracker Green signal. (B) IRS-1 mRNA is rapidly induced in MEFs by Wnt3A treatment, while the Myc mRNAinduction shows delayed kinetics. Similar induction was seen in C2C12 cells (not shown). (C) The IRS-1 protein is induced within 12 hfollowing Wnt3A treatment. (D) Depletion of IRS-1 by shRNA reduces Wnt-driven mitochondrial proliferation. Cells expressing IRS-1shRNAs or controls were treated with Wnt3A for 3 d and were analyzed as in A. (E) Stable expression of Wnt3A induces IRS-1 in C2C12cells, while expressing Dkk-1 has the opposite effect. Cells were transduced with viruses expressing the Wnt3A cDNA or the Dkk-1cDNA, selected, and examined. (F) Stable expression of dominant-negative TCF4 cDNA reduces the IRS-1 protein levels and abrogatesWnt3A-mediated induction of IRS-1. Cells were treated with recombinant Wnt3A protein for 3 d. (G) TCF4 binds the IRS-1 promoter, asdetermined by ChIP and quantitative PCR. C2C12 cells were treated with Wnt3A protein for 1 d and subjected to chemical cross-linking, and the DNA was sheared and immunoprecipitated with rabbit IgG or the TCF4 antibody. (H) The IRS-1 protein accumulatesin the chromatin fraction following Wnt3A treatment in C2C12 cells. (TOT) Total lysate; (CYT) cytoplasmic proteins; (SN) solublenuclear proteins; (CHR) chromatin fraction. Histone H2A and Ras are chromatin and cytosolic markers, respectively. (I) IRS-1 occupiesthe Myc promoter in a Wnt-dependent fashion. C2C12 cells were treated for 1 d with vehicle or Wnt3A protein, cross-linked, andprocessed for ChIP with rabbit IgG or the IRS-1 antibody. (J) Reciprocal coimmunoprecipitation studies of TCF4 and IRS-1 in Wnt3A-treated C2C12 cells. (K) Depletion of IRS-1 impairs Wnt3A-induced chromatin accumulation of b-catenin.
Wnt signaling regulates mitochondria
GENES & DEVELOPMENT 1513
Cold Spring Harbor Laboratory Press on April 10, 2019 - Published by genesdev.cshlp.orgDownloaded from

radiolabeled glucose into the total cellular glycogen pool(Fig. 5C). These results demonstrate that Wnt-mediatedinduction of IRS-1 can bring about both enhanced insulinsensitivity and increased oxidative stress in muscle cells,which is notable because these two entities are oftenviewed as being in opposition (Houstis et al. 2006).
Discussion
In this study, we identified >150 candidate proteins aspotential regulators of mitochondrial biogenesis andfunction. These proteins fall into diverse functionalclasses, including modifiers of proteins and nucleic acids,signaling molecules, and transcriptional regulators, il-lustrating the complexity of mitochondrial biology. Thedisease associations of some of these genes, such as thetype 2 diabetes gene WFS1, may help generate noveltestable hypotheses about their functions, and serve tofurther highlight the utility of genetic approaches instudying complex biological processes.
We focused in particular on the functional role of theWnt signaling pathway in mitochondrial regulation. Wntsignaling has been implicated in numerous critical as-pects of physiology and disease, including embryonicdevelopment, stem cell self-renewal and aging, and on-cogenesis (Clevers 2006). More recently, connectionshave also been made to the pathogenesis of type 2 dia-betes in humans (Grant et al. 2006; Christodoulides et al.2008), with a common variant of the TCF7L2 gene (alsoknown as TCF4) conferring on individuals an increasedrisk of developing the disease. We show here for the firsttime that Wnt signaling strongly activates mitochondrialbiogenesis, which in turn produces elevated levels of ROS
and oxidative damage. It is tempting to speculate that thiseffect on mitochondria and ROS generation may be re-sponsible for some of the major biological consequencesof aberrantly activated Wnt signaling, such as depletion ofstem cells or predisposition to certain tumors. At least inthe case of Wnt-induced cellular senescence, ROS appearsto be a critical factor, as antioxidant therapy or ectopicSOD2 expression can produce amelioration of the phe-notype. It is conceivable that, under other circumstances,chronic exposure to elevated ROS levels predisposes thecell to additional growth-promoting DNA mutations thatultimately lead to cancer.
Our data placing IRS-1 immediately downstream fromWnt activation are especially intriguing given its role asa core signaling molecule in insulin and IGF-1 action.Insulin signaling is known to enhance mitochondrialrespiration and mitochondrial protein synthesis (Boirie2003), and there is a compelling body of evidence impli-cating the insulin/IGF-1 pathway in the regulation of lifespan and aging across different species (Russell and Kahn2007). These ideas together point to previously unappre-ciated parallels between Wnt-mediated and insulin/IGF-1-mediated cellular aging. Furthermore, we showed thatWnt-mediated induction of IRS-1 can directly modulateinsulin signaling, as illustrated by enhancement of in-sulin-stimulated glycogen synthesis in C2C12 myocytes.Disruption of the TCF4 activity with the dominant-negative allele impairs Wnt-mediated induction of IRS-1and reduces basal IRS-1 levels, suggesting a potentialmechanism by which a loss of TCF4 function may pre-dispose to the development of insulin resistance in targettissues. Of interest, it has been reported recently thata genetic variant near the IRS1 gene is associated with
Figure 5. Wnt regulates insulin signaling in muscle cells in culture. (A) Stable expression of Wnt3A cDNA enhances insulin-stimulated Akt activation. C2C12 cells virally transduced to express the Wnt3A cDNA were incubated in serum-free medium for 3 h,treated with different doses of insulin, and examined for the phosphorylation of Akt at Ser473. (B) Treatment with recombinant Wnt3Aprotein augments insulin-stimulated Akt activation. C2C12 cells were treated with control or 50 ng/mL Wnt3A protein for 1 d,incubated in serum-free medium, and stimulated with insulin. (C) Treatment with Wnt3A protein enhances insulin-stimulatedglycogen synthesis in C2C12 myocytes. Cells were treated with control or Wnt3A protein for 1 d, stimulated with varying doses ofinsulin, incubated in medium containing 14C-glucose, and lysed, and the glycogen was extracted for measurement of incorporated 14Cradioactivity. (*) P < 0.05 by unpaired t-test. (D) A model of Wnt3A-mediated regulation of mitochondria and insulin signaling.
Yoon et al.
1514 GENES & DEVELOPMENT
Cold Spring Harbor Laboratory Press on April 10, 2019 - Published by genesdev.cshlp.orgDownloaded from

reduced basal levels of the IRS-1 protein and peripheralinsulin resistance (Rung et al. 2009). As a caveat, theseconcepts may not necessarily be applicable in humandisease associated with TCF4 polymorphisms, as therecould be significant differences between humans andmice regarding the TCF4 protein expression and contri-bution to physiology at key sites—one example being theb cell (Yi et al. 2005). The enhancement of insulinsignaling by Wnt3A in muscle cells is also significantbecause it raises the possibility of harnessing this path-way to modulate cellular metabolism. The generation ofmouse models should enable detailed characterization ofpotential consequences on systemic glucose and lipidhomeostasis. The observed improvement in insulin sen-sitivity is noteworthy, especially in the context of ac-companying increases in ROS generation. It has beensuggested that elevated ROS levels cause insulin resis-tance (Houstis et al. 2006), and thus the present exampleof Wnt3A signaling in muscle may represent an interest-ing exception.
As a prototypical adaptor protein, IRS-1 is thought tocarry out its function largely by activating the Erk andPI3-kinase pathways. An emerging notion, reinforced byour findings here, is that of IRS-1 as a nuclear transcrip-tional regulator that responds to extracellular signals.IRS-1 has been reported previously to interact with theestrogen receptor a on estrogen-responsive promoters,and to activate IGF-1-responsive promoters (Morelli et al.2004; Wu et al. 2008). IRS-1 is known to signal down-stream from many classical hormones, including growthhormone, prolactin, and gonadal steroid hormones, aswell as various cytokines and growth factors, and it isconceivable that this paradigm of nuclear coactivation byIRS-1 is conserved in other contexts. The mechanismwhereby Wnt enhances nuclear localization of IRS-1remains to be elucidated. We have thus far been unableto find any evidence that IRS-2 undergoes similar regula-tion in response to Wnt, suggesting a possible basis forfunctional differences between IRS-1 and IRS-2.
The sequential induction of IRS-1 and Myc followingWnt stimulation provides an example of how a cascade ofgene expression can result from activation of an adaptorprotein. After the initial induction by Wnt3A and TCF4,IRS-1 accumulates and helps further activate additionalTCF4 targets such as Myc, which then triggers expressionof a third tier of genes. The induction of a coactivator inthis case enables one transcription factor to drive multi-ple temporal stages of a response.
The functional antagonism of the Wnt3A effect oncultured muscle cells by noncanonical Wnt5A signalingsuggests that cross-talk with other regulatory pathwaysexist, which may be further defined and exploited. Adeeper understanding of the interplay between thesepathways could lead to new insights into mechanismsof aging, cancer, diabetes mellitus, and other degenerativedisorders characterized by mitochondrial dysfunction.Likewise, other genes in our collection of candidate mito-chondrial regulators may contribute significantly to as-pects of human biology, potentially displaying functionalallelic variations in the human population, as is the case
with WFS1. Further work on the mitochondrial pheno-types of these genes may uncover important links tophysiological and pathological processes associated withmitochondrial abnormalities.
Materials and methods
Constructs and reagents
Human ZBTB33 and dominant-negative TCF4 cDNAs werekindly provided by A. Prokhortchouk and E. Fearon, respectively.The mouse Wnt3A cDNA was from American Type CultureCollection, the SOD2 and Dkk-1 cDNAs were from OpenBiosystems, and the IRS-1 and Myc cDNAs were from Addgene.The cDNAs were subcloned into pMSCV or pHAGE expressionvectors. Antibodies were purchased from commercial vendors,including TCF4 (Cell Signaling), IRS-1 (Bethyl Laboratories),Myc (Cell Signaling), Wnt3A (Cell Signaling), Histone H2A (Up-state Biotechnologies), Ras (Upstate Biotechnologies), b-catenin(BD Biosciences), ATP synthase subunit a (MitoSciences), Com-plex I subunit NDUF8 (MitoSciences), GADPH (Santa CruzBiotechnology), and b-actin (Santa Cruz Biotechnology). PurifiedWnt3A, Wnt5A, and Dkk-1 proteins were purchased from R&DSystems. NAC was from Sigma.
Cell culture
C2C12 cells (American Type Culture Collection) were main-tained in DMEM containing 10% fetal calf serum (Invitrogen).For differentiation, confluent cells were kept in DMEM with 2%horse serum for 3 d. Primary MEFs were obtained at passage 1(Stem Cell Technologies) and maintained in DMEM with 10%fetal calf serum in a low-oxygen (3%) incubator.
siRNA screen
An arrayed siRNA library targeting 6363 genes in the mousegenome was obtained from Dharmacon, and was reformattedinto 96-well plates. The siRNA pools, consisting of four distinctsiRNAs per gene, were transiently transfected into C2C12 cellswith Lipofectamine 2000 (Invitrogen) at a 100 nM final concen-tration. After 5 d, cells were stained with MitoTracker Green andMitoTracker Red CMXRos (Invitrogen) for 1 h, washed with PBS,and analyzed using a BD LSRII flow cytometer equipped witha high-throughput sampler designed for 96-well plates. TheMitoTracker Green signal was collected using the FITC channelat 530 nm, while the MitoTracker Red signal was detected usingthe PerCP channel at 660 nm. Cell counts, forward scatter, andside scatter were also collected. Firefly luciferase siRNA, whichlacks significant homology with known mouse genes, and a non-targeting control siRNA were present on each plate. A fluores-cently labeled siGLO oligonucleotide and the cytotoxic Plk1siRNA served as visual and functional transfection controls.Ccnd1 siRNA and Sin3A siRNA pools were used as positivecontrols. The screen was performed in duplicate. The replicateMitroTracker Green and MitroTracker Red values and the Red-to-Green ratios were normalized to the plate mean, and anaverage increase >40% or a decrease >20% in any of the threeparameters was chosen as a cutoff for the primary hit list. Theintention was to include as many candidates as possible at theinitial stage, with both positive and negative regulators repre-sented. This hit list was then filtered for correlated toxicity,defined as a reduction >80% in cell count relative to controlduring a set sampling period. This resulted in 345 candidates inthe primary hit list that were then subjected to the validation
Wnt signaling regulates mitochondria
GENES & DEVELOPMENT 1515
Cold Spring Harbor Laboratory Press on April 10, 2019 - Published by genesdev.cshlp.orgDownloaded from

round. The setup of the validation round was essentially identi-cal, except that the four individual oligonucleotides from eachpool used in the primary screen were placed into separate wells.The mean MitoTracker signals from duplicate wells werecompared with the mean signals from the wells receivinga control siRNA, arbitrarily set at 5000. An individual siRNAwas considered to score if it sufficiently altered the MitoTrackerGreen signal (<4000 or >7000), MitoTracker Red signal (<4000or >9000), or the Red-to-Green ratio (<0.9 or >1.4). Validation ofa gene required at least two out of four independent siRNAsscoring in this fashion, with a phenotype consistent with thatfrom the primary screen. This resulted in 176 validated hits, fora 51% confirmation rate.
Classification of screen hits
Hits were classified into molecular function and biologicalprocess categories using the Panther classification system(Thomas et al. 2003). Statistical enrichment was assessed usingthe hypergeometric distribution, and a Benjamini and Hochberg-adjusted P-value of <0.05 was considered significant.
Extension of the WNT network
The network was constructed using human protein interactiondata (Keshava et al. 2009), and anchoring on components of thecanonical WNT signaling pathway (KEGG ID: hsa04310). Screenhits were mapped to human orthologs using mapping data fromNCBI. The network uses graph theoretic representations—which abstract components (gene products) as nodes, and in-teractions (Bejamini and Hochberg-adjusted P-value of <0.05)between components as edges—implemented in the Perl pro-gramming language.
Viral packaging and infection
Viral supernatants were prepared by transfecting 293T cells witha retroviral or lentiviral vector along with packaging plasmids.pMSCV-PM and pLKO shRNA vectors (Open Biosystems) wereused for gene knockdown, while pMSCV and pHAGE vectorswere used for overexpression. The control shRNAs 1 and 2included a nontargeting scrambled sequence (CCTTCGATTCCCTCAAAGACA) or no hairpin insert. ZBTB33 shRNAs 1 and 2included the hairpin sequences CGTGTTAATTTGATCTACCAT and GCCACCAAACAAGCGTATGAA, respectively. IRS-1shRNAs 1 and 2 included the sequences CGGAACAATTAGTGTGCATAA and CGGTCCTCTCTTACTACTCAT. Myc shRNAs1 and 2 included the hairpin sequences GCTTCGAAACTCTGGTGCATA and CATCCTATGTTGCGGTCGCTA. POLGshRNA included the hairpin sequence CGATACTATGAGCATGCACAT. Viruses were collected 48 h after transfection, filteredwith a 0.45-mm filter, and used to infect C2C12 cells or MEFs inthe presence of 5 mg/mL polybrene. The transduced cell popula-tions were selected with 2 mg/mL puromycin.
Isolation of intact mitochondria
Cells were washed with cold PBS, collected, resuspended in ice-cold isolation buffer (10 mM Tris-MOPS, 1 mM EGTA, 200 mMsucrose), and homogenized with a glass-Teflon motorized ho-mogenizer. Mitochondria were obtained using a standard densitycentrifugation protocol and were used immediately.
Oxygen consumption measurement
Real-time measurements of oxygen tension and pH in culturedcells were obtained in 24-well microplates using the XF24 flux
analyzer (Seahorse Bioscience). The oxygen consumption rateand the proton extrusion rates were calculated from these mea-surements and normalized to protein content from cell lysates.When appropriate,DNP (final concentration 40 mM) or oligomycin(final concentration 2 mg/mL) was added to assess the maximumrespiratory capacity and the inner mitochondrial membrane pro-ton leak, respectively. For measurement of mitochondrial respi-ration, isolated mitochondria were diluted in mitochondrial assaysolution (115 mM KCl, 10 mM KH2PO4, 2 mM MgCl2, 3 mMHEPES, 1 mM EGTA, 0.2% fatty acid-free BSA) and attached tothe bottom of the 24-well microplates by centrifugation at 3000g
for 20 min, and the oxygen tension was recorded using the XF24flux analyzer. State III respiration was measured by adding0.25 mM ADP in the presence of 5 mM succinate.
ROS and oxidative DNA damage measurements
For quantitation of superoxide or peroxide levels, cells werestained with MitoSox Red or CM-H2CFDA (Invitrogen) accord-ing to instructions and analyzed with the LSRII flow cytometer(BD Biosciences). As an alternative method based on xylenolorange–iron complex formation, cells were washed, lysed, andassayed with Peroxide Assay Kit (Biomedical Research Service).For quantitation of oxidative DNA damage, cells were dissociated,fixed, permeabilized overnight, stained with an 8-oxoguanineantibody in the OxyDNA Kit (BD Biosciences), and analyzed byflow cytometry.
Cellular senescence assays
BrdU assays were performed with a BrdU Labeling Kit (BDBiosciences) according to the manufacturer’s instructions.Briefly, cells were pulsed with 0.1 mg/mL BrdU for 1 h, fixed,permeabilized, stained with anti-BrdU-FITC antibody, and ana-lyzed by flow cytometry to measure the number of cells inS phase. SAb-gal staining was performed with a b-galactosidaseStaining Kit (Sigma). Percentage positive staining was deter-mined by dividing the number of b-gal-positive cells into thetotal cell number within 10 random fields from duplicate dishes.
Mitochondrial DNA measurement
Total cellular DNA was isolated from cells or tissues withDNAeasy Blood and Tissue Kit (Qiagen). Mitochondrial DNAcontent was determined by quantitative real-time PCR bycomparing the mitochondrially encoded Cox2 gene to an intronof the nuclear-encoded b-globin gene. An Applied BiosystemsPrism 7500 Sequence Detection System and a SYBR Green PCRKit were used.
Mitochondrial gene expression
Total RNA was extracted from cells or tissues with either anRNAeasy Plus RNA Isolation Kit (Qiagen) or Trizol (Invitrogen).cDNA was prepared using SuperScript III RT (Invitrogen), andwas subjected to quantitative real-time PCR using a SYBR GreenPCR Kit on an Applied Biosystems 7500 Sequence DetectionSystem. Primer sequences used for real-time PCR are provided inSupplemental Table S2.
Citrate synthase assay
Cells were lysed and processed using the reagents provided in theCitrate Synthase Assay Kit (Sigma). A colorimetric reaction wasused to measure the rate of reaction between acetyl coenzyme Aand oxaloacetic acid.
Yoon et al.
1516 GENES & DEVELOPMENT
Cold Spring Harbor Laboratory Press on April 10, 2019 - Published by genesdev.cshlp.orgDownloaded from

Electron microscopy
The samples were fixed for 1 h in a mixture of 2.5% glutaralde-hyde and 2% formaldehyde in 0.1 M sodium cacodylate buffer(pH 7.4), washed with 0.1 M cacodylate buffer, post-fixed with1% osmium tetroxide/1.5% potassium ferrocyanide for 1 h,washed with water, stained with 1% uranyl acetate, washedagain with water, and dehydrated with 70% ethanol for 15 min,90% ethanol for 15 min, and then 100% ethanol for 15 mintwice. Samples were infiltrated and embedded in Epon, andultrathin sections were cut on a microtome, placed on coppergrids, and viewed on a Tecnai G2 microscope. The quantificationof mitochondrial volume density and cristae surface density wasperformed as described (Weibel 1979).
Microarray analysis
RNA samples from Wnt3A-treated C2C12 cells were reverse-transcribed and used to generate Cy3- and Cy5-labeled cRNAusing the Two-Color Linear Amplification Kit (Agilent). Mousegene expression microarray (Agilent) was hybridized, scanned,and feature-extracted following the manufacturer’s instructions.
Western analysis
Whole-cell extracts were prepared by cell lysis, and equalamounts of lysates were resolved by SDS/PAGE, transferred toImmobilon-P membrane (Millipore), and probed with the appro-priate antibodies. The proteins were visualized by ECL chemi-luminescence (Pierce).
Coimmunoprecipitation
C2C12 cells were treated with 0.1% BSA in PBS (control) or50 ng/mLWnt3A for 24 h, washed with PBS, and lysed in 13 lysisbuffer (20 mM Tris-HCl at pH 8, 137 mM NaCl, 10% glycerol,1% NP-40, 2 mM EDTA). Immunoprecipitation with IRS-1antibody, TCF4 antibody, or rabbit IgG was performed usingprotein A-conjugated beads as described previously.
ChIP
Chromatin/protein complexes were prepared from C2C12 cellstreated with 0.1% BSA in PBS or 50 ng/mL Wnt3A for 24 h.Chemical cross-linking was carried out as described previously(Cunningham et al. 2007), consisting of a 20-min treatment with1.5 mM DSP at 37°C prior to a 10-min treatment with 1%formaldehyde at room temperature. The DNA was enzymati-cally sheared with Micrococcal nuclease to generate fragmentsof 150–900 base pairs (bp). Following immunoprecipitation,purified DNA was analyzed by PCR. Ratios of input DNA tobound DNA were obtained, and data were normalized to theWnt-treated sample. Primer sequences used for PCR amplifica-tion of the Myc and IRS-1 promoters are provided in Supplemen-tal Table S10.
Cell fractionation
Chromatin fractionations were performed as described previ-ously (Zou et al. 2002). Briefly, 3 3 106 cells were washed andresuspended in a HEPES-based buffer containing protease andphosphatase inhibitors and were lysed with 0.1% Triton, and cy-toplasmic proteins were separated from nuclei by low-speedcentrifugation. Isolated nuclei were subsequently lysed, andsoluble nuclear proteins were separated from chromatin by mul-tiple centrifugation steps.
Glycogen synthesis assay
C2C12 cells grown in six-well plates were treated with 50 ng/mLWnt3A for 24 h and incubated in serum-free DMEM for 4 h.Cells were washed gently with warm Krebs-Ringer-HEPES-BSA(KRHB) buffer, incubated in 1 mL of KRHB buffer for 15 min, andstimulated with an appropriate concentration of insulin for 1 h.A mixture of 14C-glucose (specific activity 250 mCi/mmol) anddeoxyglucose was added to cells to the final concentrations of2.5 uCi/mL and 5 mM, respectively, which were then incubatedfor another hour at 37°C. Cells were washed three times withice-cold PBS, lysed by adding 300 mL of 1 M KOH, incubated for30 min at room temperature, vortexed, boiled for 30 min, andcooled on ice. After removing a small aliquot for protein assay,50 mL of glycogen carrier and 900 mL of cold ethanol were added,and the samples were kept overnight at �20°C before being spunat 17,000g for 10 min. The glycogen pellet was washed with coldethanol and resuspended in water, and the incorporation ofradioactivity was measured using a scintillation counter. Theglycogen synthesis rate was normalized to protein content.
Acknowledgments
We thank J. Cunningham, P. Puigserver, and members of theElledge laboratory for advice and discussions; M. Rosene and Y.Leng for technical assistance; and the ICCB and the EM Core forassistance with the siRNA library and electron microscopy,respectively. This work was supported by a fellowship from theDamon Runyon Cancer Research Foundation awarded to J.C.Y.;a fellowship from the Crohn’s and Colitis Foundation of Americato A.N.; NIH career development grants to J.C.Y. and B.H.K.;NIH research grants to A.B., R.J.X., and S.J.E.; and a CMRC grantto S.J.E. S.J.E. is an Investigator with the Howard HughesMedical Institute.
References
Boirie Y. 2003. Insulin regulation of mitochondrial proteins andoxidative phosphorylation in human muscle. Trends Endo-
crinol Metab 14: 393–394.Brack AS, Conboy MJ, Roy S, Lee M, Kuo CJ, Keller C, Rando
TA. 2007. Increased Wnt signaling during aging alters musclestem cell fate and increases fibrosis. Science 317: 803–810.
Christodoulides C, Lagathu C, Sethi J, Vidal-Puig A. 2008.Adipogenesis and WNT signaling. Trends Endocrinol Metab
20: 16–24.Clevers H. 2006. Wnt/b-catenin signaling in development and
disease. Cell 127: 469–480.Cunningham JT, Rodgers JT, Arlow DH, Vazquez F, Mootha VK,
Puigserver P. 2007. mTOR controls mitochondrial oxidativefunction through a YY1–PGC1a transcriptional complex.Nature 450: 736–740.
DiMauro S, Schon EA. 2003. Mitochondrial respiratory-chaindiseases. N Engl J Med 348: 2656–2668.
Grant SF, Thorleifsson G, Reynisdottir I, Benediktsson R,Manolescu A, Sainz J, Helgason A, Stefansson H, EmilssonV, Helgadottir A, et al. 2006. Variant of transcription factor7-like 2 (TCF7L2) gene confers risk of type 2 diabetes. NatGenet 38: 320–323.
Hatzis P, van der Flier LG, van Driel MA, Guryev V, Nielsen F,Denissov S, Nijman IJ, Koster J, Santo EE, Welboren W, et al.2008. Genome-wide pattern of TCF7L2/TCF4 chromatinoccupancy in colorectal cancer cells. Mol Cell Biol 28:2732–2744.
He TC, Sparks AB, Rago C, Hermeking H, Zawel L, da Costa LT,Morin PJ, Vogelstein B, Kinzler KW. 1998. Identification of
Wnt signaling regulates mitochondria
GENES & DEVELOPMENT 1517
Cold Spring Harbor Laboratory Press on April 10, 2019 - Published by genesdev.cshlp.orgDownloaded from

c-MYC as a target of the APC pathway. Science 281: 1509–1512.
Houstis N, Rosen ED, Lander ES. 2006. Reactive oxygen specieshave a causal role in multiple forms of insulin resistance.Nature 440: 944–948.
Ishitani T, Kishida S, Hyodo-Miura J, Ueno N, Yasuda J,Waterman M, Shibuya H, Moon RT, Ninomiya-Tsuji J,Matsuomoto K. 2003. The TAK1–NLK mitogen activatedprotein kinase cascade functions in the Wnt-5a/Ca2+ path-way to antagonize Wnt/b-catenin signaling. Mol Cell Biol 22:131–139.
Keshava PTS, Goel R, Kandasamy K, Keerthikumar S, Kumar S,Mathivanan S, Telikicheria D, Raju R, Shafreen B, VenugopalA, et al. 2009. Human protein reference database—2009 up-date. Nucleic Acids Res 37: D767–D772. doi: 10.1093/nar/gkn892.
Kim J, Lee JH, Iyer VR. 2008. Global identification of Myc targetgenes reveals its direct role in mitochondrial biogenesis andits E-box usage in vivo. PLoS One 3: e1798. doi: 10.1371/journal.pone.0001798.
Kroemer G. 2006. Mitochondria in cancer. Oncogene 25: 4630–4632.
Li F, Wang Y, Zeller KI, Potter JJ, Wonsey DR, O’Donnell KA,Kim JW, Yustein JT, Lee LA, Dang CV. 2005. Myc stimulatesnuclearly encoded mitochondrial genes and mitochondrialbiogenesis. Mol Cell Biol 25: 6225–6234.
Lin MT, Beal MF. 2006. Mitochondrial dysfunction and oxidativestress in neurodegenerative diseases. Nature 443: 787–795.
Liu H, Fergusson MM, Castilho RM, Liu J, Cao L, Chen J, MalideD, Rovira II, Schimel D, Kuo J, et al. 2007. Augmented Wntsignaling in a mammalian model of accelerated aging.Science 317: 803–806.
Loeb LA, Wallace DC, Martin GM. 2005. The mitochondrialtheory of aging and its relationship to reactive oxygenspecies damage and somatic mtDNA mutations. Proc NatlAcad Sci 102: 18769–18770.
Lowell BB, Shulman GI. 2005. Mitochondrial dysfunction andtype 2 diabetes. Science 307: 384–387.
Moon RT, Kohn AD, De Ferrari GV, Kaykas A. 2004. Wnt andb-catenin signaling: Diseases and therapies. Nat Rev Genet
5: 689–699.Morelli C, Garfalo C, Sisci D, del Rincon S, Cascio S, Tu X,
Vecchione A, Sauter ER, Miller WH Jr, Surmacz E. 2004.Nuclear insulin receptor substrate 1 interacts with estrogenreceptor a at ERE promoters. Oncogene 23: 7517–7526.
Park JI, Kim SW, Lyons JP, Ji H, Nguyen TT, Cho K, Barton MC,Deroo T, Vleminckx K, Moon RT, et al. 2005. Kaiso/p120-catenin and TCF/b-catenin complexes coordinately regulatecanonical Wnt gene targets. Dev Cell 8: 843–854.
Parrinello S, Samper E, Krtolica A, Goldstein J, Melov S, CampisiJ. 2003. Oxygen sensitivity severely limits the replicativelifespan of murine fibroblasts. Nat Cell Biol 5: 741–747.
Pendergrass W, Wolf N, Poot M. 2004. Efficacy of MitoTrackerGreen and CMXRosamine to measure changes in mitochon-drial membrane potentials in living cells and tissues. Cytom-
etry A 61: 162–169.Pile L, Spellman PT, Katzenberger RJ, Wassarman DA. 2003.
The SIN3 deacetylase complex represses genes encodingmitochondrial proteins. J Biol Chem 278: 37840–37848.
Poot M, Pierce RH. 2001. Analysis of mitochondria by flowcytometry. Methods Cell Biol 64: 118–128.
Rung J, Cauchi S, Albrechtsen A, Shen L, Rocheleau G,Cavalcanti-Proenca C, Bacot F, Balkau B, Bellisle A, Broch-Johnsen K, et al. 2009. Genetic variant near IRS1 is associ-ated with type 2 diabetes, insulin resistance, and hyper-insulinemia. Nat Genet 41: 1110–1115.
Russell SJ, Kahn CR. 2007. Endocrine regulation of ageing. Nat
Rev Mol Cell Biol 8: 681–691.Ruzov A, Dunican DS, Prokhortchouk A, Pennings S, Stancheva
I, Prokhortchouk E, Meehan RR. 2004. Kaiso is a genome-wide repressor of transcription that is essential for amphib-ian development. Development 131: 6185–6194.
Sandhu MS, Weedon MN, Fawcett KA, Waasson J, DebenhamSL, Daly A, Lango H, Frayling TM, Neumann RJ, Sherva R,et al. 2007. Common variants in WFS1 confer risk of type 2diabetes. Nat Genet 39: 951–952.
Taniguchi CM, Emanuelli B, Kahn CR. 2006. Critical nodes insignaling pathways: Insights into insulin action. Nat Rev
Mol Cell Biol 7: 85–96.Thomas PD, Campbell MJ, Kejariwal A, Mi H, Karlak B,
Daverman R, Diemer K, Muruganujan A, Narechania A.2003. Panther: A library of protein families and subfamiliesindexed by function. Genome Res 13: 2129–2141.
Topol L, Jiang X, Choi H, Garrett-Beal L, Carolan PJ, Yang Y.2003. Wnt-5a inhibits the canonical Wnt pathway by pro-moting GSK-3-independent b-catenin degradation. J CellBiol 162: 899–908.
Tu X, Batta P, Innocent N, Prisco M, Casaburi I, Belletti B,Baserga R. 2002. Nuclear translocation of insulin receptorsubstrate-1 by oncogenes and Igf-1. J Biol Chem 277: 44357–44365.
Vafa O, Wade M, Kern S, Beeche M, Pandita TK, Hampton GM,Wahl GM. 2002. c-Myc can induce DNA damage, increasereactive oxygen species, and mitigate p53 function: A mech-anism for oncogene-induced genetic instability. Mol Cell 9:1031–1044.
Wallace DC. 2005. A mitochondrial paradigm of metabolic anddegenerative diseases, aging, and cancer: A dawn for evolu-tionary medicine. Annu Rev Genet 39: 359–407.
Wang C, Li Z, Lu Y, Du R, Katiyar S, Yang J, Fu M, Leader JE,Quong A, Novikoff PM, et al. 2006. Cyclin D1 repression ofnuclear factor 1 integrates nuclear DNA synthesis andmitochondrial function. Proc Natl Acad Sci 103: 11567–11572.
Weibel E. 1979. Stereological methods: Practical methods forbiological morphometry. Academic Press, London.
Wu A, Chen J, Baserga R. 2008. Nuclear insulin receptor sub-strate-1 activates promoters of cell cycle progression genes.Oncogene 27: 397–403.
Yi F, Brubaker PL, Jin T. 2005. TCF4 mediates cell type-specificregulation of proglucagon gene expression by b-catenin andglycogen synthase kinase-3b. J Biol Chem 280: 1457–1464.
Zou L, Cortez D, Elledge SJ. 2002. Regulation of ATR substrateselection by Rad17- dependent loading of Rad9 complexesonto chromatin. Genes Dev 16: 198–208.
Yoon et al.
1518 GENES & DEVELOPMENT
Cold Spring Harbor Laboratory Press on April 10, 2019 - Published by genesdev.cshlp.orgDownloaded from

10.1101/gad.1924910Access the most recent version at doi: 24:2010, Genes Dev.
John C. Yoon, Aylwin Ng, Brian H. Kim, et al. sensitivityWnt signaling regulates mitochondrial physiology and insulin
Material
Supplemental
http://genesdev.cshlp.org/content/suppl/2010/07/12/24.14.1507.DC1
References
http://genesdev.cshlp.org/content/24/14/1507.full.html#ref-list-1
This article cites 40 articles, 15 of which can be accessed free at:
License
ServiceEmail Alerting
click here.right corner of the article or
Receive free email alerts when new articles cite this article - sign up in the box at the top
Copyright © 2010 by Cold Spring Harbor Laboratory Press
Cold Spring Harbor Laboratory Press on April 10, 2019 - Published by genesdev.cshlp.orgDownloaded from