wms 9.0 tutorial watershed modeling – orange county ...wmstutorials-9.0.aquaveo.com/22...
TRANSCRIPT
v. 9.0
WMS 9.0 Tutorial Watershed Modeling – Orange County Hydrology – Using GIS Data Learn how to delineate sub-basins and compute soil losses for Orange County (California) hydrologic modeling
Objectives This tutorial shows you how to use digital terrain and GIS data to delineate watershed sub-basins and to compute Orange County soil loss rates using soil type and land use data.
Page 1 of 13 © Aquaveo 2012
Prerequisite Tutorials Introduction – Images Introduction – Basic Feature
Objects Editing Elevations – DEM
Basics
Required Components Data Drainage Map Hydrology Hydrologic Models
Time 30-45 minutes
1 Contents
1 Contents ...............................................................................................................................2 2 Introduction.........................................................................................................................2 3 Automated Sub-area Delineation.......................................................................................3
3.1 DEM Data ....................................................................................................................3 3.2 Trimming the DEM......................................................................................................3 3.3 Compute Flow Directions and Accumulations.............................................................4 3.4 Add Concentration Point (Outlet) ................................................................................5 3.5 Delineate Sub-area (Basin)...........................................................................................6
4 Creating Multiple Models (Rational and Unit Hydrograph) ..........................................7 5 Creating Additional Sub-areas ..........................................................................................7
5.1 Create Additional Concentration Points (Outlets)........................................................7 5.2 Delineate Sub-areas (Basins)........................................................................................8
6 Computing Loss Rates ........................................................................................................9 6.1 Add Land Use and Soil Type Coverages .....................................................................9 6.2 Add Land Use Data ......................................................................................................9 6.3 Add Soil Type Data....................................................................................................10 6.4 Compute GIS Attributes.............................................................................................11 6.5 View Results ..............................................................................................................11
7 Getting a Background Image Using Online Services .....................................................11 7.1 Create a local copy of the images...............................................................................12
8 Data Catalog ......................................................................................................................13 8.1 Open Background Image............................................................................................13 8.2 Get Data .....................................................................................................................13
2 Introduction
WMS has many features and tools that will help you to get the most use out of digital terrain and GIS data for delineating sub-areas and computing loss rates. This exercise demonstrates how to use WMS to automate sub-area delineation with a Digital Elevation Model (DEM) for rational and unit hydrograph analyses and shows how to compute Orange County loss rates (Fm and Ybar) with soil type and land use GIS data. Refer to the following chapters in the standard WMS tutorials for an in depth treatment of GIS data:
Images (2 Introduction-Images)
Basic Feature Objects (3 Introduction-BasicFeatureObjects)
DEM Basics (4 EditingElevations-DEMBasics)
Advanced Feature Objects (6 Introduction-AdvancedFeatureObjects)
DEM Delineation (7 WatershedModeling-DEMDelineation)
Time of Concentration Calculations and Computing a Composite CN (9 WatershedModeling-TimeConcAndCN)
Page 2 of 13 © Aquaveo 2012
WMS Tutorials Watershed Modeling – Orange County Hydrology – Using GIS Data
3 Automated Sub-area Delineation
3.1 DEM Data
1. Close all instances of WMS
2. Open WMS
3. Select File | Open…
4. Locate the OrangeCounty\UnitHydro folder in your tutorial files. If you have used default installation settings in WMS, the tutorial files will be located in \My documents\WMS 9.0\Tutorials\.
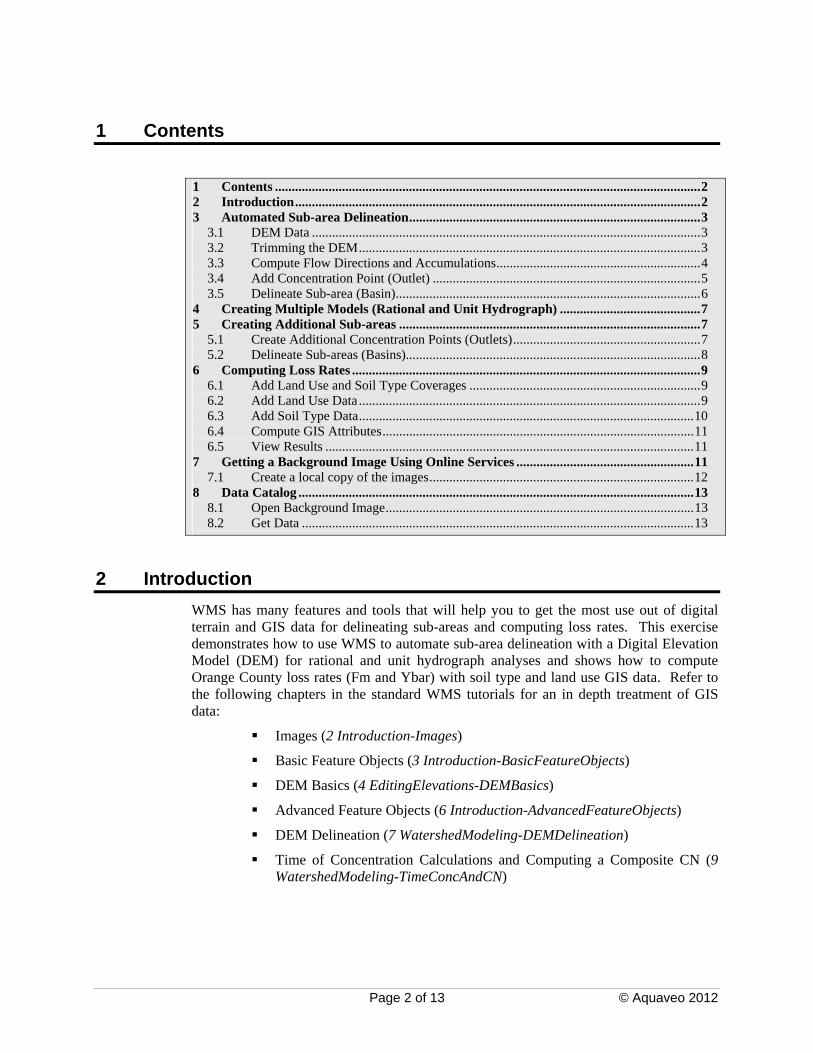
5. Open “LagunaBeach.asc” and “SanJuanCapistrano.asc”
Figure 3-1: Preliminary DEM import information
6. Select OK
7. Select Edit | Current Projection…
8. Set Horizontal System to State Plane NAD 83 (US)
9. Set Horizontal Units to Meters
10. Set St. Plane Zone to California 6 – 0406
11. Set Vertical Units to Meters
12. Select OK
3.2 Trimming the DEM
The DEM often covers a much larger area than the user is really interested in. To decrease the amount of computations required, it is often beneficial to “trim” the DEM.
Page 3 of 13 © Aquaveo 2012
WMS Tutorials Watershed Modeling – Orange County Hydrology – Using GIS Data
1. Switch to the Terrain Data module
2. Select DEM | Trim | Polygon…
3. Select Enter a polygon interactively
4. Select OK
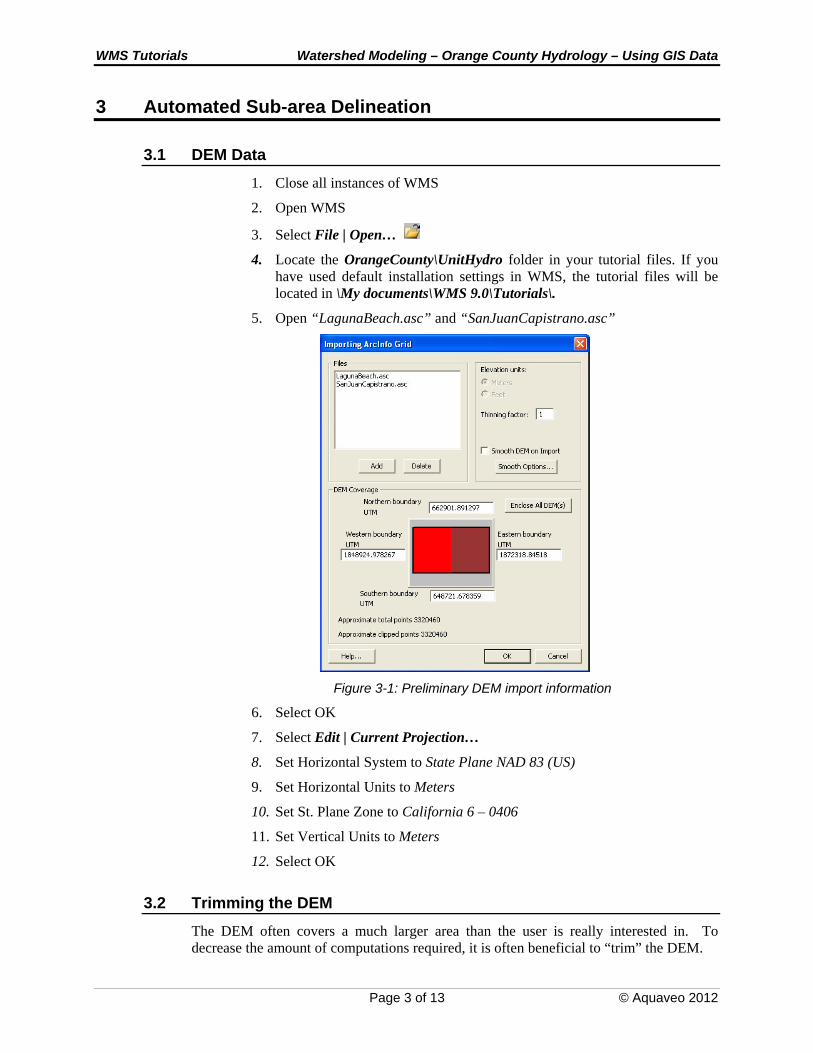
5. Use the left mouse button to outline an area that approximates the rectangle shown in Figure 3-2 below. Double-click on the last corner to end the polygon and trim the DEM.
Figure 3-2: DEM trim area
3.3 Compute Flow Directions and Accumulations
1. Select the Frame macro
2. Switch to the Drainage module
3. Select DEM | Compute TOPAZ Flow Data…
4. Select OK
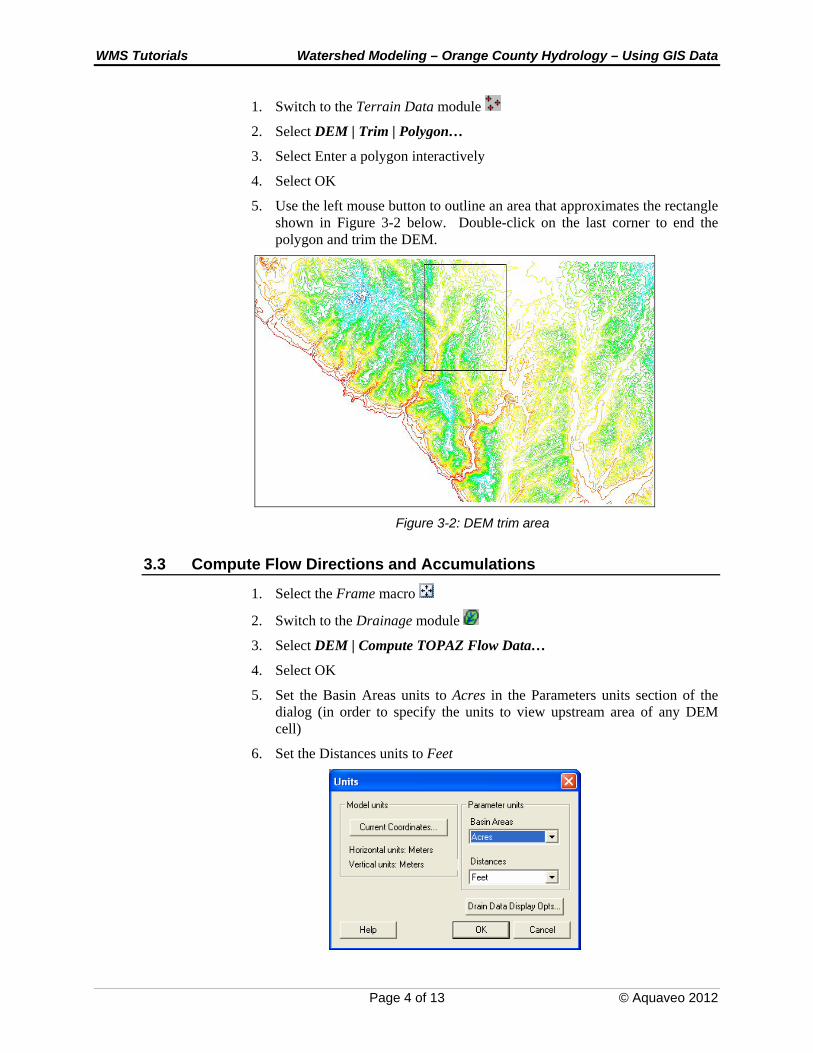
5. Set the Basin Areas units to Acres in the Parameters units section of the dialog (in order to specify the units to view upstream area of any DEM cell)
6. Set the Distances units to Feet
Page 4 of 13 © Aquaveo 2012

WMS Tutorials Watershed Modeling – Orange County Hydrology – Using GIS Data
Figure 3-3: Exhibited units
7. Select OK
8. Choose Close once TOPAZ finishes running (you may have to wait a few seconds to a minute or so)
9. Select Display | Display Options…
10. Select DEM Data and change Min Accumulation For Display to 5.0 acres on the DEM tab
11. Select OK
3.4 Add Concentration Point (Outlet)
1. Use the Zoom tool to zoom in to the rectangle shown in Figure 3-4
Figure 3-4: Zoom in to add concentration point
2. Select the Create Outlet Point tool
As the cursor is moved over any DEM cell that has flow accumulation data, the total upstream area is displayed in the bottom part of the screen. This feature helps you to place concentration points at appropriate locations.
Page 5 of 13 © Aquaveo 2012
WMS Tutorials Watershed Modeling – Orange County Hydrology – Using GIS Data
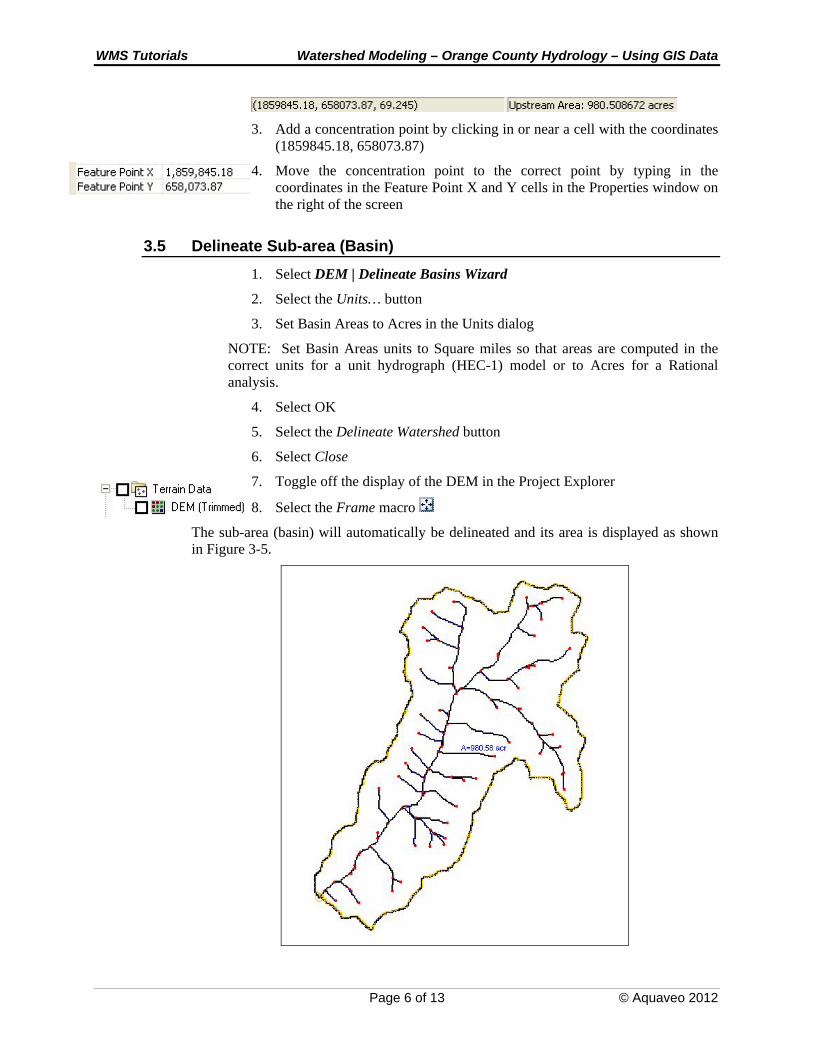
3. Add a concentration point by clicking in or near a cell with the coordinates (1859845.18, 658073.87)
4. Move the concentration point to the correct point by typing in the coordinates in the Feature Point X and Y cells in the Properties window on the right of the screen
3.5 Delineate Sub-area (Basin)
1. Select DEM | Delineate Basins Wizard
2. Select the Units… button
3. Set Basin Areas to Acres in the Units dialog
NOTE: Set Basin Areas units to Square miles so that areas are computed in the correct units for a unit hydrograph (HEC-1) model or to Acres for a Rational analysis.
4. Select OK
5. Select the Delineate Watershed button
6. Select Close
7. Toggle off the display of the DEM in the Project Explorer
8. Select the Frame macro
The sub-area (basin) will automatically be delineated and its area is displayed as shown in Figure 3-5.
Page 6 of 13 © Aquaveo 2012
WMS Tutorials Watershed Modeling – Orange County Hydrology – Using GIS Data
Figure 3-5: Delineated sub-area
4 Creating Multiple Models (Rational and Unit Hydrograph)
If performing both Rational and Unit Hydrograph analyses on the same watershed, it may be beneficial to create a second drainage coverage so that the Rational method can be performed using one while the Unit Hydrograph method is performed using the other. The two hydrologic models require different parameters for analysis.
1. Right-click on the Drainage coverage and select Duplicate
2. Right-click on the Copy of Drainage coverage and select Rename
3. Enter “Unit Hydro” for the coverage name
4. In the Hydrologic Tree Data folder of the Project Explorer right-click on the Copy of Drainage Coverage Tree and select Rename
5. Enter “Unit Hydro Tree”
6. Switch to the Hydrologic Modeling module
7. Select OC Hydrograph in the Model pull down menu at the top of the screen
8. In the Hydrologic Tree Data folder of the Project Explorer select the Drainage Coverage Tree to make it the active hydrologic tree
9. Select OC Rational in the Model pull down menu at the top of the screen
5 Creating Additional Sub-areas
When working with the rational method, the initial sub-area should be no more than 10 acres and have a flow path less than 330 feet. Succeeding sub-areas will gradually increase in size until reaching the final concentration point. In order to create additional sub-areas, the user merely needs to create the concentration points for each of the sub-areas and run the Delineate Basins Wizard.
5.1 Create Additional Concentration Points (Outlets)
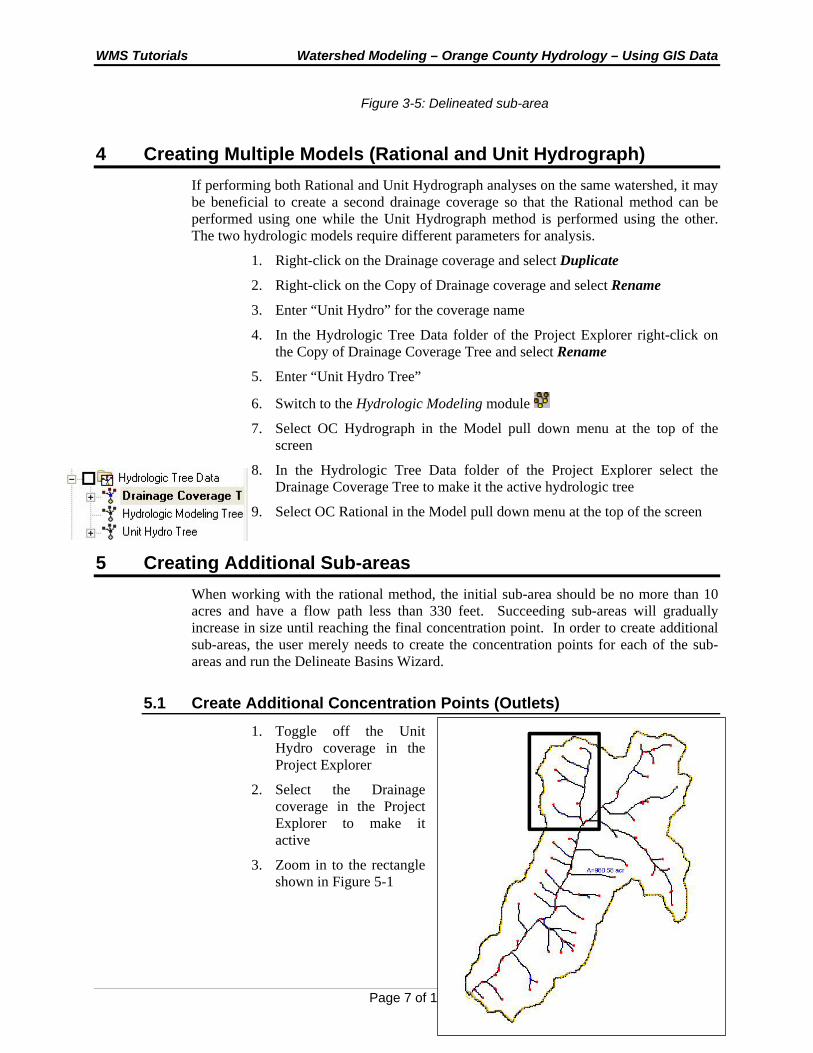
1. Toggle off the Unit Hydro coverage in the Project Explorer
2. Select the Drainage coverage in the Project Explorer to make it active
3. Zoom in to the rectangle shown in Figure 5-1
Page 7 of 13 © Aquaveo 2012
WMS Tutorials Watershed Modeling – Orange County Hydrology – Using GIS Data
Figure 5-1: Zoom to rectangle to add additional sub-areas
4. Switch to the Drainage module
5. Use the Create Outlet Point tool to add concentration points at or near the locations shown in Table 5-1 (remember that you can always add the concentration point and enter the exact coordinates in the Properties window on the right side of the screen):
Table 5-1: Concentration points
X Y
1861174.92 660701.38
1861154.71 660581.42
1861144.65 660501.35
1861104.98 660319.40
1861084.98 659937.40
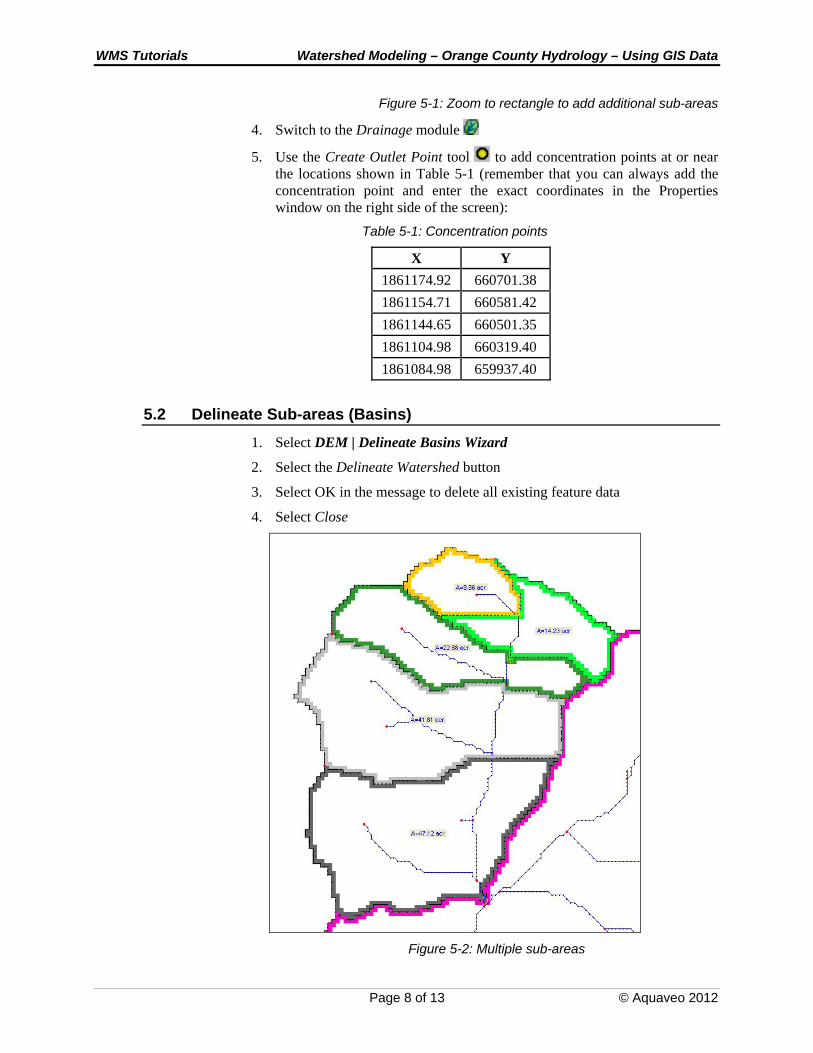
5.2 Delineate Sub-areas (Basins)
1. Select DEM | Delineate Basins Wizard
2. Select the Delineate Watershed button
3. Select OK in the message to delete all existing feature data
4. Select Close
Figure 5-2: Multiple sub-areas
Page 8 of 13 © Aquaveo 2012
WMS Tutorials Watershed Modeling – Orange County Hydrology – Using GIS Data
6 Computing Loss Rates
6.1 Add Land Use and Soil Type Coverages
1. Select the Frame macro
2. Right-click on the Coverages folder in the Project Explorer and select New Coverage
3. Change the Coverage type to Land Use
4. Select OK
5. Right-click on the Coverages folder in the Project Explorer again and select New Coverage
6. Change the Coverage type to Soil Type
7. Select OK
6.2 Add Land Use Data
Land use data can come from many different sources. It is possible to digitize polygons representing different land use types using a background image/map or an aerial photograph. WMS also has tools for generating land use data from existing CAD data.
1. Ensure that the Land Use coverage is the active coverage by selecting it in the Project Explorer
2. Switch to the GIS module
3. Select Data | Add Shapefile Data…..
4. Open “niguellanduse.shp”
5. Select Mapping | Shapes -> Feature Objects
6. Select Yes to use all shapes in all visible shapefiles for mapping
7. Select Next >
Notice that the Level2 column is automatically mapped to the Level2 Mapping type and that the LU_CODE column is automatically mapped to the Land use Mapping type in WMS. This maps attributes in the shapefile database table to become attributes of the polygons that will be generated as feature objects.
8. Select Next >
9. Select Finish
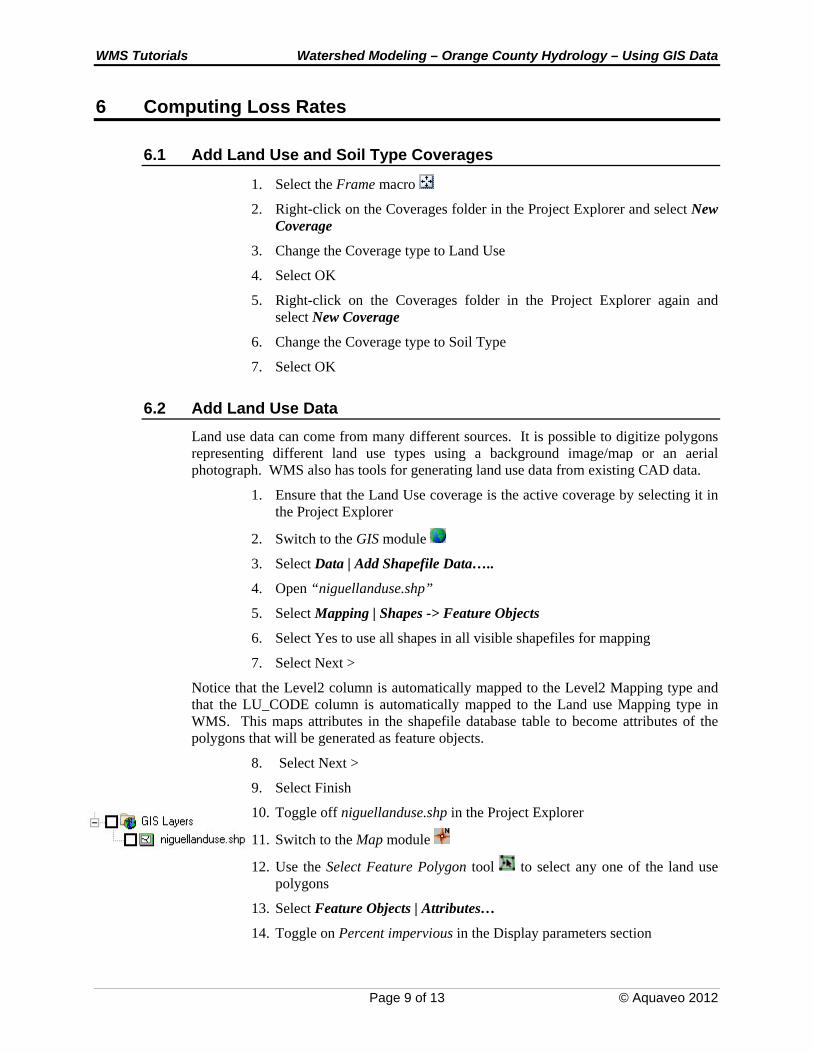
10. Toggle off niguellanduse.shp in the Project Explorer
11. Switch to the Map module
12. Use the Select Feature Polygon tool to select any one of the land use polygons
13. Select Feature Objects | Attributes…
14. Toggle on Percent impervious in the Display parameters section
Page 9 of 13 © Aquaveo 2012
WMS Tutorials Watershed Modeling – Orange County Hydrology – Using GIS Data
The Land use mapping dialog appears. This dialog shows the land use ID that was mapped from the shapefile to the polygon, but there is no curve number or percent impervious data for the land use IDs. Add this data by importing a land use table.
15. For Import file type choose Orange County Land use file
16. Click on the Import file button
17. Select OK on the overwrite message
18. Open “ocland.tbl”
Notice that curve numbers and percent impervious values now exist for each land use ID.
19. Select Close
6.3 Add Soil Type Data
1. Make the Soil Type coverage the active coverage by selecting it in the Project Explorer
2. Switch to the GIS module
3. Select Data | Add Shapefile Data…
4. Open “Soilgroup_Bdy.shp”
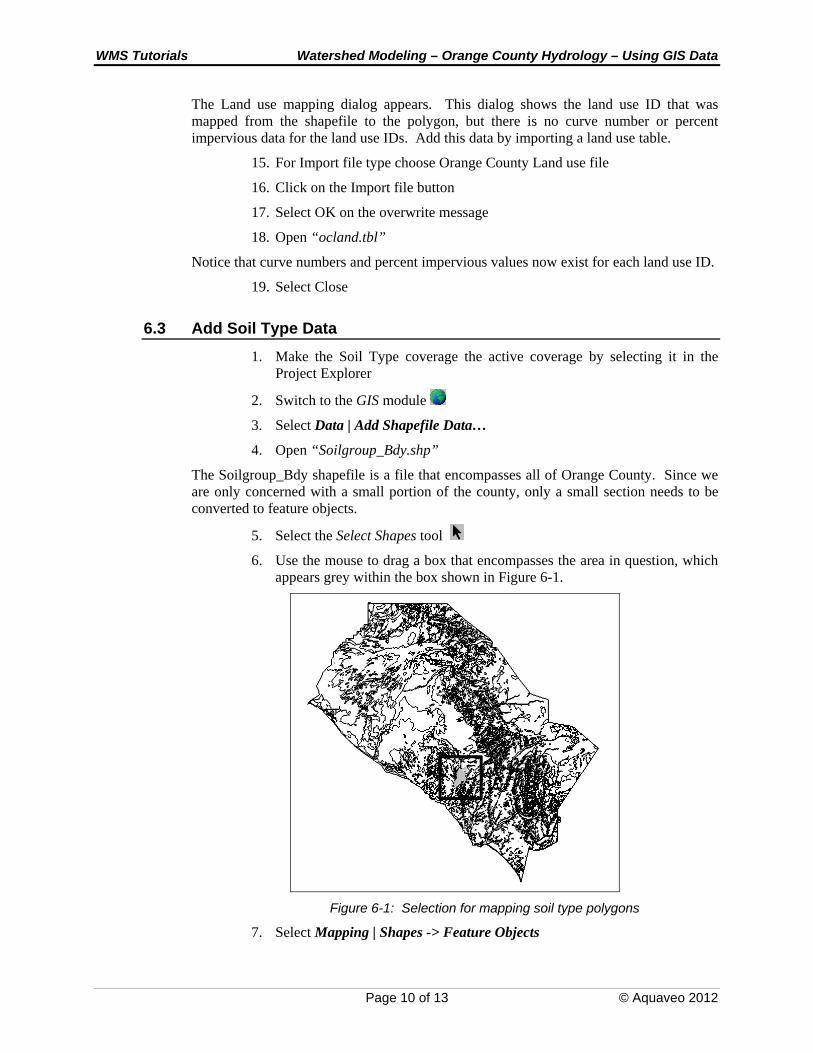
The Soilgroup_Bdy shapefile is a file that encompasses all of Orange County. Since we are only concerned with a small portion of the county, only a small section needs to be converted to feature objects.
5. Select the Select Shapes tool
6. Use the mouse to drag a box that encompasses the area in question, which appears grey within the box shown in Figure 6-1.
Figure 6-1: Selection for mapping soil type polygons
7. Select Mapping | Shapes -> Feature Objects
Page 10 of 13 © Aquaveo 2012
WMS Tutorials Watershed Modeling – Orange County Hydrology – Using GIS Data
8. Select Next >
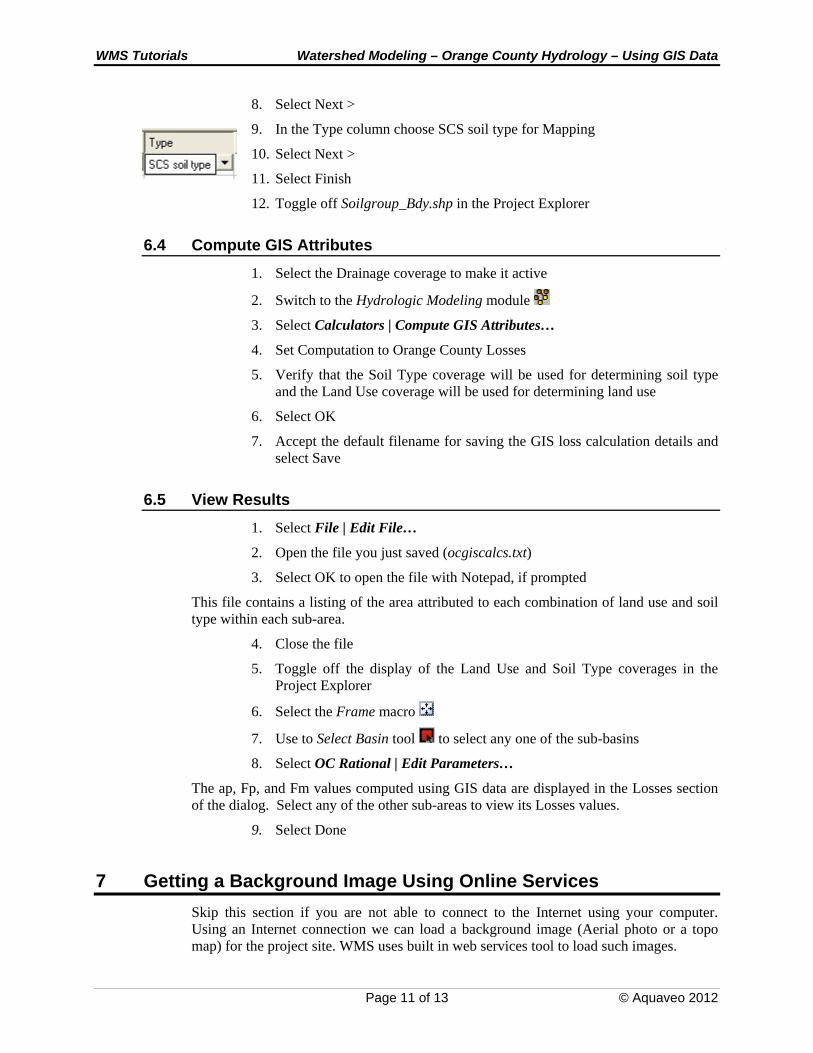
9. In the Type column choose SCS soil type for Mapping
10. Select Next >
11. Select Finish
12. Toggle off Soilgroup_Bdy.shp in the Project Explorer
6.4 Compute GIS Attributes
1. Select the Drainage coverage to make it active
2. Switch to the Hydrologic Modeling module
3. Select Calculators | Compute GIS Attributes…
4. Set Computation to Orange County Losses
5. Verify that the Soil Type coverage will be used for determining soil type and the Land Use coverage will be used for determining land use
6. Select OK
7. Accept the default filename for saving the GIS loss calculation details and select Save
6.5 View Results
1. Select File | Edit File…
2. Open the file you just saved (ocgiscalcs.txt)
3. Select OK to open the file with Notepad, if prompted
This file contains a listing of the area attributed to each combination of land use and soil type within each sub-area.
4. Close the file
5. Toggle off the display of the Land Use and Soil Type coverages in the Project Explorer
6. Select the Frame macro
7. Use to Select Basin tool to select any one of the sub-basins
8. Select OC Rational | Edit Parameters…
The ap, Fp, and Fm values computed using GIS data are displayed in the Losses section of the dialog. Select any of the other sub-areas to view its Losses values.
9. Select Done
7 Getting a Background Image Using Online Services
Skip this section if you are not able to connect to the Internet using your computer. Using an Internet connection we can load a background image (Aerial photo or a topo map) for the project site. WMS uses built in web services tool to load such images.
Page 11 of 13 © Aquaveo 2012
WMS Tutorials Watershed Modeling – Orange County Hydrology – Using GIS Data
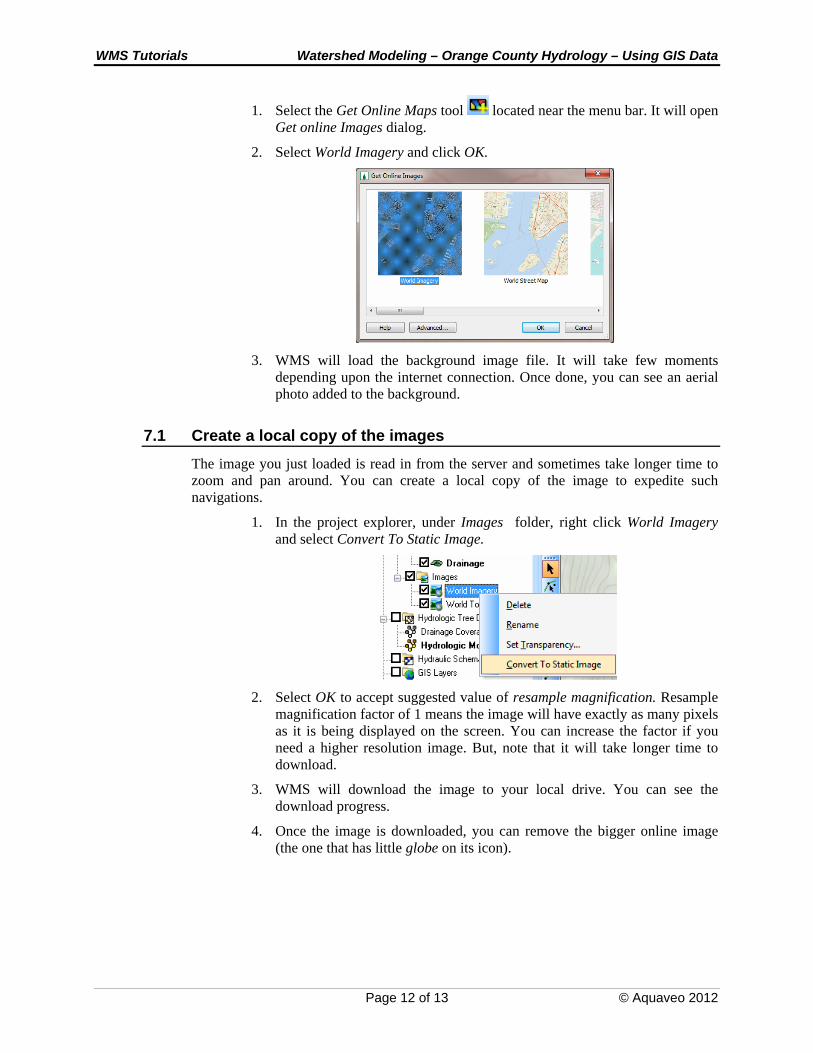
1. Select the Get Online Maps tool located near the menu bar. It will open Get online Images dialog.
2. Select World Imagery and click OK.
3. WMS will load the background image file. It will take few moments depending upon the internet connection. Once done, you can see an aerial photo added to the background.
7.1 Create a local copy of the images
The image you just loaded is read in from the server and sometimes take longer time to zoom and pan around. You can create a local copy of the image to expedite such navigations.
1. In the project explorer, under Images folder, right click World Imagery and select Convert To Static Image.
2. Select OK to accept suggested value of resample magnification. Resample magnification factor of 1 means the image will have exactly as many pixels as it is being displayed on the screen. You can increase the factor if you need a higher resolution image. But, note that it will take longer time to download.
3. WMS will download the image to your local drive. You can see the download progress.
4. Once the image is downloaded, you can remove the bigger online image (the one that has little globe on its icon).
Page 12 of 13 © Aquaveo 2012

WMS Tutorials Watershed Modeling – Orange County Hydrology – Using GIS Data
8 Data Catalog
The remaining sections are to be completed only if the Orange County data files are accessible.
8.1 Open Background Image
1. Select File | New
2. Select No if prompted to save changes to the project
3. Select File | Open…
4. Open “OCMap.tif”
8.2 Get Data
1. Select the Get Data tool
2. Drag a box over a location on the map in Orange County
3. Choose the Catalog option
4. Click on the Browse… button
5. Open “OCCatalog.txt”
6. Toggle on DEM Data
7. Change Resolution to 10 Meter
8. Toggle on Image – Topo
9. Toggle on Shapefile – Soil Type
10. Select OK
11. Select OK to read in DEMs
Page 13 of 13 © Aquaveo 2012