wl-tr-95-3077 halon replacement program for aviation
TRANSCRIPT

WL-TR-95-3077
HALON REPLACEMENT PROGRAM FOR AVIATION Aircraft Engine Nacelle Application Phase I Operational Parameters Study
Mr. Mathias L. Kolleck Mr. Jon A. Wheeler
Booz«Allen and Hamilton, Inc. 4141 Colonel Glenn Highway Suite 131 Dayton, Ohio 45431-1662
Mr. J. Michael Bennett Captain Gregg M. Caggianelli
WL/FIVS Building 63 1901 Tenth Street Wright-Patterson AFB, Ohio 45433-7605
APRIL 1997
FINAL REPORT FOR PERIOD OCTOBER 1992 - SEPTEMBER 1993
FLIGHT DYNAMICS DIRECTORATE WRIGHT LABORATORY AIR FORCE MATERIEL COMMAND WRIGHT-PATTERSON AFB, OHIO 45433-7562
DTIC QUÄLET? INSPECTED 3
19970918 136

NOTICE
USING GOVERNMENT DRAWINGS, SPECIFICATIONS, OR OTHER DATA INCLUDED IN THIS DOCUMENT FOR ANY PURPOSE OTHER THAN GOVERNMENT PROCUREMENT DOES NOT IN ANY WAY OBLIGATE THE US GOVERNMENT. THE FACT THAT THE GOVERNMENT FORMULATED OR SUPPLIED THE DRAWINGS, SPECIFICATIONS, OR OTHER DATA DOES NOT LICENSE THE HOLDER OR ANY OTHER PERSON OR CORPORATION; OR CONVEY ANY RIGHTS OR PERMISSION TO MANUFACTURE, USE, OR SELL ANY PATENTED INVENTION THAT MAY RELATE TO THEM.
THIS REPORT IS RELEASABLE TO THE NATIONAL TECHNICAL INFORMATION SERVICE (NTIS). AT NTIS, IT WILL BE AVAILABLE TO THE GENERAL PUBLIC, INCLUDING FOREIGN NATIONS.
THIS TECHNICAL REPORT HAS BEEN REVIEWED AND IS APPROVED FOR PUBLICATION.
J.jteHAEL BENNETT JAMES HODGES Technical Director Chief Halon Replacement Program for Aviation Survivability and Safety Enhancement Branch
Chief Vehicle Systems Division
IF YOUR ADDRESS HAS CHANGED, IF YOU WISH TO BE REMOVED FROM OUR MAILING LIST, OR IF THE ADDRESSEE IS NO LONGER EMPLOYED BY YOUR ORGANIZATION PLEASE NOTIFY WL/FIVS, BUILDING 63, 1901 TENTH STREET, WRIGHT-PATTERSON AFB OH 45433-7562 TO HELP MAINTAIN A CURRENT MAILING LIST.
Do not return copies of this report unless contractual obligations or notice on a specific document requires its return.

REPORT DOCUMENTATION PAGE Form Approved
OMB No. 074-0188 Public reporting burden for this collection of information is estimated to average 1 hour per response, including the time for reviewing instructions, searching existing data sources, gathering and maintaining the data needed, and completing and reviewing this collection of information. Send comments regarding this burden estimate or any other aspect of this collection of information, including suggestions for reducing this burden to Washington Headquarters Services, Directorate for Information Operations and Reports, 1215 Jefferson Davis Highway, Suite 1204, Arlington, VA 22202-4302, and to the Office of Management and Budget, Paperwork Reduction Project (0704-0188), Washington, DC 20503
1. AGENCY USE ONLY (Leave blank) 2. REPORT DATE April 1997
3. REPORT TYPE AND DATES COVERED Final From October 1992 to September 1993
4. TITLE AND SUBTITLE
Halon Replacement Program for Aviation, Aircraft Engine Nacelle Application Phase I - Operational Parameters Study
6. AUTHOR(S)
Mr. J. Michael Bennett Capt Gregg Caggianelli
Mr. Mathias L. Kolleck Mr. Jon A. Wheeler
7. PERFORMING ORGANIZATION NAME(S) AND ADDRESS(ES)
Booz'AUen and Hamilton 4141 Colonel Glenn Highway Suite 131 Dayton, Ohio 45431-1662
Survivability and Safety Branch (WL/FIVS) Wright Laboratory, Building 63 1901 Tenth Street Wright-Patterson AFB OH 45433-7605
9. SPONSORING / MONITORING AGENCY NAME(S) AND ADDRESS(ES)
FLIGHT DYNAMICS DIRECTORATE WRIGHT LABORATORY AIR FORCE MATERIEL COMMAND WRIGHT-PATTERSON AFB OHIO 45433-7562 POC: Lt Jim Tucker, WL/FIVST, 937-255-6052
5. FUNDING NUMBERS
C: DLA900-90-D-0424 PE: 63106 PR: HALF TA: 92 WU: 03
8. PERFORMING ORGANIZATION REPORT NUMBER
SURVIAC TR-95-011
10. SPONSORING / MONITORING AGENCY REPORT NUMBER
WL-TR-95-3077
11. SUPPLEMENTARY NOTES
12a. DISTRIBUTION / AVAILABILITY STATEMENT
Approved for public release; distribution is unlimited
12b. DISTRIBUTION CODE
13. ABSTRACT (Maximum 200 Words)
This report documents the work performed under Phase I - Operational Parameters Study - of the Halon Replacement Program for Aviation for the Aircraft Engine Nacelle Application. Phase I is the first of a three- phase program to determine a replacement for Halon 1301 in aircraft engine nacelle applications. The objective of Phase I testing was to determine which parameters, in an aircraft engine nacelle fire, most influence the amount of agent needed to extinguish that fire. Of the 15 parameters tested, the factors which were most influential in an engine nacelle fire were: Surface Temperature, Fuel Temperature, Pre-Burn Time, Agent, Fuel Type, Cross- Sectional Area, and Air Temperature. These factors were recommended for inclusion in Phase II of the overall test program.
14. SUBJECT TERMS
Fire Protection; Fire; Halon Replacement; Operational Study; Aircraft Engine Nacelle
15. NUMBER OF PAGES 72
16. PRICE CODE
17. SECURITY CLASSIFICATION OF REPORT
UNCLASSIFIED
18. SECURITY CLASSIFICATION OF THIS PAGE
UNCLASSIFIED
19. SECURITY CLASSIFICATION OF ABSTRACT
UNCLASSIFIED
20. LIMITATION OF ABSTRACT
SAR NSN 7540-01-280-5500 Standard Form 298 (Rev. 2-89)
Prescribed by ANSI Std. Z39-18 298-102

TABLE OF CONTENTS
Section Page
EXECUTIVE SUMMARY 1
1.0 INTRODUCTION 5
2.0 TEST OBJECTIVE 8
3.0 APPROACH 9 3.1 Test Article Configuration 11
3.1.1 Aircraft Engine Nacelle Fire Test Simulator 11 3.1.2 Engine Nacelle Configuration 12 3.1.3 Extinguishant Conditioning and Delivery 13 3.1.4 Extinguishants 14 3.1.5 Airflow 14 3.1.6 Data Requirements 15 3.1.7 Photo Coverage 15 3.1.8 Video 15
3.2 Procedure 15 3.2.1 Qualification Testing 15
3.2.1.1 Stage I - System Checkout 16 3.2.1.2 Stage U - Facility Extremes/Airflow Parameter Settings 16 3.2.1.3 Stage El - L-32 Qualification Testing - Flammability
Studies 17 3.2.1.4 Stage IV - L-32 Qualification Testing - Fire Suppression
Studies 18 3.2.2 Full-Scale Testing 22
4.0 RESULTS 26 4.1 Data Analysis 26
4.1.1 Analysis of the Factorial Experiment 28 4.1.2 Transformation of the Response Variable 34 4.1.3 Analysis of the Factorial Experiment After Log Transformation 35
4.2 Analysis Summary 41
5.0 CONCLUSIONS AND RECOMMENDATIONS 42 5.1 Conclusions 42 5.2 Recommendations 42
5.2.1 Phase II Test Parameters 42 5.2.2 Reignition Phenomenon 42
6.0 REFERENCES 43
LIST OF APPENDICES
Appendix Page
A 120° Annulus Qualification Testing A-l B Powder Extinguishant Testing B-l
iii

LIST OF FIGURES
Figure Page
3-1 Bracketing Procedure 11 3-2 Adjustable Test Fixture 12 3-3 Close View of Clutter Around Fire Point 13 3-4 Y-Shaped Distribution Tubing 14 3-5 Picture of Engine Nacelle Fire With Fuel Spray 24 3-6 Diagram of Engine Nacelle Fire With Fuel Spray 24 3-7 Picture of Engine Nacelle Fire With Fuel Spray Turned Off 25 3-8 Diagram of Engine Nacelle Fire With Fuel Spray Turned Off 25
4-1 Effect Sum of Squares as Percent of Total 32 4-2 Normal Plot of the Effects 33 4-3 Residual Values Versus Predicted Values - Phase 1 35 4-4 Effect Sum of Squares as Percent of Total After Log Transformation 39 4-5 Normal Plot of the Effects After Log Transformation 40 4-6 Residual Values Versus Predicted Values After Log Transformation - Phase 1 41
IV

LIST OF TABLES
Table Page
1 Phase I Parameters and Settings 3
1-1 Phase I Parameters and Settings 7
3-1 Fire Science Parameters 9 3-2 Phase I Parameters and Settings 10 3-3 Mass Flow Versus Pressure 16 3-4 Air-Related Parameter Settings 17 3-5 Flammability Studies Parameter Settings 17 3-6 Flammability Study Test Matrix 19 3-7 Post-Discharge Fuel Flow Time Study - Parameter Settings 20 3-8 Post-Discharge Fuel Flow Time Study Results - JP-8 20 3-9 Post-Discharge Fuel Flow Time Study Results - MIL-H-83282 21 3-10 Worst-Case Fire Parameter Settings 21 3-11 Worst-Case Fire Results 22 3-12 Data Collection Worksheet 23
4-1 Phase I Parameters and Settings 26 4-2 Phase I Test Matrix Showing Orthogonal High-Low Pattern 27 4-3 Phase I Test Matrix With Response Variable 28 4-4 Analysis of the Factorial Experiment 29 4-5 Confounded Two-factor Interaction Sets - Engine Nacelle 30 4-6 Rankings of Main Effects - Engine Nacelle 31 4-7 Interaction Groups - Engine Nacelle 31 4-8 Analysis of Variance - Phase I Test Matrix - Engine Nacelle 34 4-9 Analysis of the Factorial Experiment After Log Transformation 36 4-10 Confounded Two-factor Interaction Sets After Log Transformation - Engine Nacelle ....37 4-11 Rankings of Factors After Log Transformation - Engine Nacelle 38 4-12 Interaction Groups After Log Transformation - Engine Nacelle 38 4-13 Analysis of Variance After Log Transformation - Phase I Test Matrix -
Engine Nacelle 40

GLOSSARY
amp ampere
ASC Aeronautical Systems Center
ASRF Aircraft Survivability Research Facility
cfm cubic feet per minute
degrees of freedom
DOX
statistical reference to the number of independent terms used to estimate the variability in the data from that variable Design of Experiments
op degrees Fahrenheit
FAA Federal Aviation Administration
fps feet per second
HP Hewlett Packard
Hz Hertz
KHz Kilohertz
kts knots
mm millimeter
MSDS Material Safety Data Sheets
NIST National Institute of Standards and Technology
psig pounds per square inch gage
PT pressure transducer
residuals statistically, a residual at a given observation is (the observed response value from the experimental data) minus (the predict« response value from the fitted linear model)
SURVIAC Survivability/Vulnerability Information Analysis Center
T2 Technology Transition
TC thermocouple
V volt
WL Wright Laboratory
WPAFB Wright-Patterson Air Force Base
VI

PREFACE
This research and development task was sponsored by the Air Force, Army, Navy, and Federal Aviation Administration. Data Management activities for this effort were performed as Task 94-05 under contract DLA900-90-D-0424. This final technical report summarizes work performed in Phase I of the Halon Replacement Program for Aviation, Aircraft Engine Nacelle Application, from October 1992 to September 1993. This task was administered under the technical direction of Mr. J. Michael Bennett (WL/FrVS), Wright-Patterson Air Force Base, Ohio.
Vll

EXECUTIVE SUMMARY
The Clean Air Act Amendments (CAAA) of 1990 and U.S. Environmental Protection Agency (EPA) rules limit U.S. production of ozone depleting substances (ODS). These actions carry out the United States obligations under the "Montreal Protocol on Substances that Deplete the Ozone Layer," an international treaty ratified by the Senate in December 1988, limiting global production of such chemicals. Subsequent international and national legislation has dictated the phase-out of the production of these chemicals.
As a result of these actions, the U.S. Air Force made a decision in 1992 to develop a "nonozone depleting solution" for on-board aircraft fire extinguishing by 1995. This timeline was dictated by the program schedule of the F-22 fighter, so that this alternative solution could be considered for implementation. A program for evaluating and identifying alternative extinguishants that would be commercially available was developed by the Air Force's Wright Laboratory. This program - The Halon Replacement Program for Aviation - was subsequently expanded in scope to include the requirements of all U.S. military and commercial aircraft engine nacelle and military dry bay applications and was jointly sponsored by the U.S. Air Force, Navy, Army, and Federal Aviation Administration. A Department of Defense Halon Alternatives Steering Group was established to oversee this and other similar programs.
A Small Business Innovative Research (SBIR) effort funded by Wright-Patterson Air Force Base investigated a total of 600 chemicals with a configuration similar to the halons as potential replacements. These potential replacement chemicals were investigated for toxicity, physical traits, and fire-fighting effectiveness to determine which had the potential to meet aviation requirements. It was determined that ten chemicals had characteristics acceptable for aircraft use and the capability to generate the necessary supplemental data within the required program timelines. To these ten, the Air Force added two, which were suggested from other data sources. A screening program to reduce this list of 12 to the three best for full-scale testing was conducted by the National Institute of Standards and Technology (NIST). Concurrently with this NIST testing, Phase I of the Halon Replacement Program for Aviation was conducted at Wright Laboratory.
This final report documents the work performed under Phase I - Operational Parameters Study - of the Halon Replacement Program for Aviation, Aircraft Engine Nacelle Application. This joint program was designed to find a replacement chemical extinguishant for halon as a fire extinguishant on-board military and commercial aircraft. There are two applications considered under this program - engine nacelles and dry bays. This report deals with the engine nacelle application. The concern for engine nacelle fires centers around the space between the engine cowling and the engine core, where fuel lines, hydraulic lines, and other protuberances and equipment are affixed to the core. An analogous series of tests was also conducted to determine a halon replacement for the dry bay application. That work was documented in a similar series of reports.
Halons are being replaced because they have been found to deplete the earth's protective stratospheric ozone layer. Stratospheric ozone depletion is predicted to have a significant adverse global impact on human health, climate, and natural environmental systems. Accordingly, international and national legislation has dictated the phase-out of the production of these substances and production has ceased as of 1 January 1994. Halons are important because they have been in use as fire extinguishants in military and commercial aircraft since the late 1940s. After many years of operational experience, Halon 1301 (CF3Br) emerged as the dominant extinguishant for aircraft. This is due primarily to the wide range of applications to which Halon 1301 is suited. However, increasing environmental concerns with ozone depletion have resulted in a mandate to discontinue its use in new systems, as well as other halons used as fire extinguishants.

There are several important considerations in replacing halon in aircraft fire protection systems. The most obvious among these is the weight and volume of the extinguishant and of the delivery equipment. Since there are severe weight and space limitations on aircraft systems, engineers may be forced to compromise fire suppression capability to comply with a restriction on system weight. This could cause a significant decrease in aircraft and crew member survivability. These were some of the issues considered in the program.
Phase I - Operational Parameters Study - was the first of a three-phase full-scale live-fire test program to determine a replacement for halon in engine nacelle applications. The objective of Phase I testing was to determine which parameters (factors) in an aircraft engine nacelle fire most influence the amount of extinguishant needed to extinguish that fire. The parameters that were found to be significant were used in Phase II to evaluate three potential replacements for Halon 1301. The three potential replacement extinguishants were selected by a Technology Transition (T2) team consisting of members from the Air Force, Army, Navy, the Federal Aviation Administration (FAA), and industry. The T2 team made their selections based on the results of extinguishant screening testing conducted by the National Institute of Standards and Technology (NIST) on 12 possible extinguishants and the results of Phase I testing conducted at Wright Laboratory. The NIST testing is documented in NIST SP 861, Evaluation of Alternative In-Flight Fire Suppressants for Full Scale Testing in Simulated Aircraft Engine Nacelles and Dry Bays, April 1994. The NIST testing was conducted concurrently with the Wright Laboratory Phase I testing.
In Phase II - Operational Comparison of Selected Extinguishants - the three extinguishants identified as most promising from the extinguishant screening testing conducted by NIST and selected by the T2 team were tested using the parameters determined in Phase I. The outcome of Phase II was the selection of the best engine nacelle extinguishant. This extinguishant was then used for Phase III testing.
Phase IE - Establishment of Design Criteria Methodologies - was conducted in FY95. Phase III established design criteria for the new extinguishant in the engine nacelle application. The outcome of this phase was design equations for use in sizing fire-extinguishing systems based on the new extinguishant.
Through discussions with leading experts in the field of aviation fire protection, 19 previously identified aviation fire parameters relating to the engine nacelle were narrowed to the 16 parameters (factors) which were felt to be the most influential in determining the quantities of extinguishant necessary for engine nacelle fire extinguishment (response variable). Design of experiments (DOX) methodology was used to reduce the potential number of test cases from well over 32,000 to a more manageable 32. Two extreme settings were selected for each of the parameters (factors) for testing. The parameter "Extinguishant" was included in this group in order to measure the differential impact of a gaseous versus liquid type of extinguishant in the effects of fire zone parameters on the amount of extinguishant required. This parameter is not meant to recommend the extinguishant that was to be selected as the outcome of Phase II of the program. Halon 1301 and HFC-227ea were selected as the settings for this parameter (factor) because they represent extinguishants which have significantly different physical characteristics and suppress fires with different mechanisms, as discussed in Section 3.1.4. These 16 parameters (factors) and the values of the two settings for each are presented in the following table.

Table 1. Phase I Parameters and Settings
PARAMETER SYMBOL LOW SETTING HIGH SETTING
Extinguishant EXTNGT HFC-227ea Halon 1301
Extinguishant Discharge Location ALOC Side Top
Extinguishant Distribution (either use of a simple distribution tube or "dumped" directly into the outer nacelle)
DIST Dump Dist Tube
Extinguishant Bottle Temperature BTMP -20° F 160° F
Ventilation Air Pressure APRS 14.5 psia 17.0 psia
Ventilation Air Temperature ATMP 100° F 275° F
Extinguishant Bottle Pressure BPRS 400 psi 800 psi
Clutter (simulated by ribs protruding from core and nacelle)
CLUT 1-inch high rib 2-inch high rib
Configuration (simulating longer or shorter nacelle)
CONF Short (123 inches) Long (170 inches)
Clearance (distance between outer nacelle and engine core)
CLEAR 6 inches 12 inches
Fire Location in Nacelle LOCA Bottom Top
Fuel FUEL MIL-H-83282 JP-8
Fuel Temperature FTMP 100° F 200° F (83282)
325° F (JP-8)
Internal Ventilation Air Mass Flow Rate
INTE 1.25 Ib/s 2.75 lb/s
Preburn Time PREB 5 sec 20 sec
Surface Temperature STMP 175° F 1300°F
These parameters were arranged in a Plackett-Burman L-32 Matrix. The Plackett- Burman two-level fractional factorial design was used for the test series to allow one to study the effects of the 16 factors and interactions of pairs of factors using only 32 test runs, as opposed to 216 combinations of factors. The mass of extinguishant needed to extinguish the fire was the response variable.
A series of baseline tests was conducted prior to gaseous extinguishant testing to ensure a fire could be achieved and extinguished in every set of matrix conditions. Baseline tests were conducted with fire extinguisher parameters, fire quality parameters, various fixtures, and airflow parameters. In addition, checklists were developed which would ensure that the test procedures would be easily and accurately duplicated in order to protect the integrity of the data for this test series.
All tests were performed at the Aircraft Engine Nacelle Fire Test Simulator (AENFTS) located at Wright-Patterson Air Force Base (WPAFB), Ohio. The AENFTS is a ground test facility designed to simulate the fire hazards which exist in the annular compartment around an aircraft engine, and to test the effectiveness of the methods used to prevent, detect, and extinguish fires in that area. This fixture can simulate a full 360° airflow field and has a realistic helical extinguishant distribution.

Initially, the test data were analyzed using Yates Algorithm to calculate effective size and sum of squares for each factor and interaction between factors. The sum of squares was then expressed as a percent of total variability. This ratio represents the amount of variability in the response variable explained by the factor. The larger this ratio is for any factor, the stronger the indication from the data that the effect of that factor on the response variable is of sufficient size to stand out from the experimental error, or noise. The factors with the largest percent of variability explained were:
Surface Temperature - 26% Fuel Temperature -15% Preburn Time - 6% Extinguishant - 5% Fuel - 5% Clearance - 4% Air Temperature - 4%
Some two-factor interactions also explained a substantial portion of the variability. This means a change in the parameter settings of these factors in combination significantly affects the response variable - the amount of extinguishant required to extinguish the fire.
These data were then logarithmically transformed, which is common statistical practice when the range of the response variable exceeds one order of magnitude (10X). Similar analysis of the transformed data confirmed that the factors with the largest variability explained were:
• Surface Temperature - 34% • Extinguishant - 14% • Clearance - 12%
The logarithmic transformation reduced the impact of the other parameters below 4% of the total variability and also reduced the importance of the two-factor interactions.
These three factors - Surface Temperature, Extinguishant, Clearance - were therefore recommended for inclusion in the Phase II Test Matrix. The inclusion of the parameters Fuel Temperature, Air Temperature, Preburn Time, and Fuel were also considered based on an evaluation of their impact in the engine nacelle fire phenomenon.
It is also recommended that the reignition phenomenon be studied in greater depth. Testing conducted during this phase of the overall test program has uncovered the problems associated with keeping a fire suppressed after the extinguishant has been discharged and fuel continues to impinge on hot surfaces. Post-discharge fuel flow time - the maximum length of time fuel can continue to flow after the release of the maximum amount of extinguishant available and still not have reignition - needs to be investigated in greater detail for various types of fuel.

1.0 INTRODUCTION
The Clean Air Act Amendments (CAAA) of 1990 and U.S. Environmental Protection Agency (EPA) rules limit U.S. production of ozone depleting substances (ODS). These actions carry out the United States obligations under the "Montreal Protocol on Substances that Deplete the Ozone Layer," an international treaty ratified by the Senate in December 1988, limiting global production of such chemicals. Subsequent international and national legislation has dictated the phase-out of the production of such chemicals. In response, industry producers have ceased production as of 1 January 1994. Other substances are likely to be added in the future. These restrictions were put in place because of data showing that the atmospheric chlorine loading caused by these chemicals correlates to depletion of the earth's protective stratospheric ozone layer. Stratospheric ozone depletion is predicted to have a significant adverse global impact on human health, climate, and natural environmental systems.
Some of the most important ODS chemicals are the halons, especially Halon 1301. The importance of halons derives from the fact they are used as the primary fire-extinguishing chemical for all aviation use, including military and civilian aircraft, for engine nacelle and military dry bay protection. The concern for engine nacelle fires centers around the space between the engine cowling and the engine core, where fuel lines, hydraulic lines, and other protuberances and equipment are affixed to the core and can rupture or leak fuel and be ignited by sparks or hot engine surfaces.
Halons have been used as fire extinguishants in military and commercial aircraft since the late 1940s. After many years of operational experience, Halon 1301 (CF3Br) emerged as the dominant extinguishant for aircraft (with some Air Force use of Halons 1202 and 1011). This is due primarily to the wide range of applications to which Halon 1301 is suited, as well as toxicity and efficiency. However, increasing environmental concerns with ozone depletion have resulted in a mandate to discontinue its further implementation.
A decision was made by the U.S. Air Force in 1992 to develop a "nonozone depleting solution" for on-board aircraft fire extinguishing by 1995. This timeline was dictated by the program schedule of the F-22 fighter, so that this alternative solution could be considered for implementation. A program for evaluating and identifying alternative extinguishants that would be commercially available at that time was developed by the Air Force's Wright Laboratory. This program - The Halon Replacement Program for Aviation - was subsequently expanded in scope to include the requirements of all U.S. military and commercial aircraft engine nacelle and dry bay applications and was sponsored by the U.S. Air Force, Navy, Army, and Federal Aviation Administration. A Department of Defense Halon Alternatives Steering Group was established to oversee this and other similar programs.
A Small Business Innovative Research (SBIR) effort funded by Wright-Patterson Air Force Base investigated a total of 600 chemicals with physical properties similar to the halons as potential replacements. These potential replacement chemicals were investigated for toxicity, physical traits, and fire-fighting effectiveness to determine which had the potential to meet aviation requirements. It was determined that ten chemicals had characteristics acceptable for aircraft use and the capability to generate the necessary supplemental data to potentially field such chemicals within the required program timelines. To these ten, the Air Force added two from other data sources. A screening program to reduce this list of 12 to the three best for full- scale testing was conducted by the National Institute of Standards and Technology (NIST) under the direction of Wright Laboratory. Concurrently with this NIST testing, Phase I of the Halon Replacement Program for Aviation began at Wright Laboratory. Phase I testing was intended to identify the fire zone parameters most relevant to sizing fire extinguishing systems.

There are several important considerations in replacing halon in aircraft fire protection systems. The most obvious among these are the weight and volume of the extinguishant and of the delivery equipment. Since there are severe weight and space limitations on aircraft systems, engineers may be forced to compromise fire suppression capability in order to meet a restriction on system weight. This could cause a significant decrease in aircraft and pilot safety and survivability. These were some of the issues addressed in this program.
This final report documents the work performed under Phase I - Operational Parameters Study - of the Halon Replacement Program for Aviation for the engine nacelle application. This is the first of a three-phase program to select an extinguishant to replace Halon 1301 in aircraft fire suppression systems. The purpose of this testing was to define the aircraft fire zone factors which most influence the amount of extinguishant required to extinguish an aircraft engine nacelle fire. The factors found to be significant were used in Phase II to evaluate three potential replacements for Halon 1301. The three potential replacement extinguishants were selected by a Technology Transition (T2) team consisting of members from the Air Force, Army, Navy, Federal Aviation Administration (FAA), and industry. The T2 team made their selections based on the results of extinguishant screening testing conducted by NIST on the 12 possible extinguishants and the results of Phase I testing conducted at Wright Laboratory. The NIST testing is documented in NIST SP 861, Evaluation of Alternative In-Flight Fire Suppressants for Full Scale Testing in Simulated Aircraft Engine Nacelles and Dry Bays, April 1994. The NIST testing was conducted concurrently with the Wright Laboratory Phase I testing.
Through discussions with leading experts in the field of aviation fire protection, 19 previously identified aviation fire zone parameters (factors) were narrowed to the 16 which were felt to be the most influential in determining the quantity of extinguishant necessary for engine nacelle fire extinguishment. Two extreme but realistic operational settings were selected for each of the parameters for testing. These parameters and their settings are presented in Table 1-1.
In this test program, the quantity of extinguishant necessary to extinguish a given fire is referred to as the response variable. Statistical Design of Experiments (DOX) methodology was used to reduce the potential number of test configurations from well over 32,000 to a more manageable 32. Two settings were selected for each of the parameters for testing. A Plackett-Burman two- level fractional factorial design was used for the test series to allow one to study the effects of the 16 factors and interactions of pairs of factors using only 32 test runs, as opposed to 216
combinations of factors.
All testing was performed by the Survivability and Safety Branch of Wright Laboratory (WL/FTVS) using the Aircraft Engine Nacelle Fire Test Simulator (AENFTS or AEN) located at Wright-Patterson AFB, OH. The AEN is a ground test facility designed to simulate the fire hazards which exist in the annular compartment around an aircraft engine and to test the effectiveness of the methods used to prevent, detect and extinguish fires in that area. This fixture can simulate a full 360° airflow field and allows a realistic helical extinguishant distribution. The zone volume was adjusted by a wide or narrow internal insert that represented the engine casing. The outer dimension remained constant. The compartment configuration (basically nacelle length) was controlled by placing the extinguishant release inlet at two different locations within the nacelle. A standard clutter configuration, composed of longitudinal and circumferential ribs of varying height around the outer nacelle interior and engine casing exterior, was used around the fire zone to act as a flame holder. Removable clutter was used upstream to hinder extinguishant distribution and generate realistic airflow paths. Engine case hot surfaces were achieved by means of an electrically heated panel. Air delivery and conditioning allow for the simulation of atmospheric and above-atmospheric test pressures. In addition, controllable heating of the air was provided by duct heaters located upstream.

Table 1-1. Phase I Parameters and Settings
PARAMETER SYMBOL LOWSETTING HIGH SETTING
Extinguishant Discharge Location ALOC Side Top
Extinguishant Distribution (either use of a simple distribution tube or "dumped" directly into the outer nacelle)
DIST Dump (no distribution tube)
Distribution Tube
Extinguishant Bottle Temperature BTMP -20° F 160° F
Extinguishant Bottle Pressure BPRS 400 psi 800 psi
Clutter (simulated by ribs protruding from core and nacelle)
CLUT 1 inch high rib 2 inch high rib
Configuration (simulating longer or shorter nacelle)
CONF Short (123 inches) Long (170 inches)
Clearance (distance between outer nacelle and engine core)
CLEAR 6 inches 12 inches
Surface Temperature STMP 175° F 1300°F
Extinguishant EXTNGT HFC-227ea Halon 1301
Fire Location in Nacelle LOCA Bottom Top
Fuel FUEL MIL-H-83282 (hydraulic fluid)
JP-8
Fuel Temperature FTMP 100° F 200° F (83282) 325° F (JP-8)
Internal Air Mass Flow Rate INTE 1.25 lb/s 2.75 lb/s
Preburn Time PREB 5 sec 20 sec
Ventilation Air Pressure APRS 14.5 psia 17.0 psia
Ventilation Air Temperature ATMP 100° F 275° F
A series of baseline tests was conducted prior to gaseous extinguishant testing to ensure that a fire could be achieved and extinguished under every set of matrix conditions. Baseline tests were conducted with fire extinguisher parameters, fire quality parameters, various fixtures, and airflow parameters. In addition, checklists were developed which would ensure that the test procedures would be easily and accurately duplicated in order to protect the integrity of the data for this test series.

2.0 TEST OBJECTIVE
The objective of this test series was to determine which parameters in an aircraft engine nacelle fire most influence the amount of extinguishant needed to extinguish that fire. The parameters that were found to be significant were used in Phase II of the Halon Replacement Program for Aviation to evaluate potential replacement extinguishants for Halon 1301.

3.0 APPROACH
Table 3-1 lists a number of fire science parameters which are considered to be important in aircraft engine nacelle fires. To the right of each parameter is the mechanism by which it influences the characteristics of an engine nacelle fire. These fire science parameters are not necessarily independent. For instance, the internal airflow rate depends on the volume size/configuration and the internal air velocity.
Table 3-1. Fire Science Parameters
PARAMETER MECHANISM
Extinguishant (Bottle) Fill Pressure Discharge rate
Extinguishant Bottle Temperature Extinguishant liquid/vapor state, evaporation
Extinguishant Properties Vaporization, propagation, extinguishant concentration
Air Pressure Burn rate, flame stability, reaction rate, mixing
Air Temperature Fuel residence times, burning reaction rates, extinguishant evaporation
Air Velocity Extinguishant/fuel residence time, vortex effects, fuel/air mixture
Bottle Throat Size/ Configuration Discharge rate
Fire Zone Configuration Flame spread /suppression/propagation characteristics
Fire Zone Surface Temperature Pyrolysis/ignition
Fuel Flow Rate Combustion rate, fuel/air ratio, fuel spread, heat output
Fuel Pressure Droplet character
Fuel Temperature Volatility, flammability
Fuel Velocity Mixing, evaporation
Ignition Source Initial fire intensity, and spread
Preburn Time Fire size, temperature and hot surface creation
Volume Size/Configuration Extinguishant dilution, flame spread and fire location
Through discussions with leading experts in the field of aviation fire protection, these factors were narrowed to the 16 parameters, shown in Table 3-2, for study in the evaluation of their influence upon the quantity of extinguishant necessary for extinguishment of engine nacelle fires. Two extreme but realistic levels were chosen for each of these parameters (factors). The settings chosen for each level were based upon data collected by the Survivability/Vulnerability Information Analysis Center (SURVIAC) on actual aircraft operating conditions for these parameters, from data obtained from initial baseline tests requiring constraint of initial parameter extremes, and some limitations due to test facility constraints. The two level settings of Short and Long for the parameter Configuration (CONF) refer to the two different locations within the nacelle from which the extinguishant was released and were measured from the two extinguishant release points to the downstream flange.

Table 3-2. Phase I Parameters and Settings
FACTOR SYMBOL LOW SETTING HIGH SETTING
Extinguishant EXTNGT HFC-227ea Halon 1301
Extinguishant Discharge Location ALOC Side of Nacelle Top of Nacelle
Extinguishant Distribution (either use of a simple distribution tube or "dumped" directly into outer nacelle)
DIST Dump
(no distribution tube)
Distribution Tube
Extinguishant Temperature BTMP -20° F 160° F
Air Pressure APRS 14.5 psia 17.0 psia
Air Temperature ATMP 100° F 275° F
Extinguishant Bottle Pressure, at Room Temperature
BPRS 400 psi 800 psi
Clutter (simulated by ribs protruding from core and nacelle)
CLUT 1-inch high rib 2-inch high rib
Configuration (simulating longer or shorter nacelle)
CONF Short (123 inches) Long (170 inches)
Clearance (distance between outer nacelle and engine core)
CLEAR 6 inches 12 inches
Fire Location LOCA Bottom Top
Fuel FUEL MIL-H-83282 JP-8
Fuel Temperature FTMP 100° F 200° F (83282)
325° F (JP-8)
Internal Air Mass Flow Rate DMTE 1.25 lb/s 2.75 lb/s
Preburn Time PREB 5 sec 20 sec
Surface Temperature STMP 175° F 1300°F
Baseline tests were conducted to ensure consistently extinguishable fires could be maintained. For each test, a fire had to be produced and also be extinguished in order to maintain the DOX test methodology.
A Plackett-Burman two-level fractional factorial design was used for this test series. This type of design allows one to study the effects of 16 factors and interactions of pairs of factors using only 32 test runs. The trade-off is that interactions of more than two factors in this design are "confounded," or indistinguishable from main factors. Two-factor interactions are not confounded with main factors. This is not a problem if the multifactor (more than two) interactions are negligible, but for this test series it was desirable to at least consider the significant two-factor interactions. Significant interactions among three or more variables are extremely rare in most cases.
The most difficult consideration in the DOX design was the measurement of the response variable - amount of extinguishant to extinguish the fire. This was actually an input to determine if the selected quantity extinguished the fire or not, rather than a direct output measurement during the conduct of the test.
To address this problem, a bracketing procedure was devised (Figure 3-1) which uses an iterative process to narrow down the amount of extinguishant required to extinguish the fire. In all tests, a minimum of four iterations was used, each adjusting the quantity of extinguishant
10

Test 3 Completion
Increase Amount by 1 .25 x l(Test 1 - Test 2)1 |
Decrease Amount by .25 x l(Test 1 - Test 2)l
Test 4 Completion
Increase Amount by 125 x l(Test 1 - Test 2)l.
Decrease Amount by 125 x irrest 1 -Test 2) I
Final Value
Final accepted value is an iteration between tests 3 and 4, with a tolerance of ±6.25% of the upper test value.
Figure 3-1. Bracketing Procedure
used, in order to determine the threshold of extinguishant mass. This methodology provided an uncertainty of ±6.25%.
3.1
3.1.1
Test Article Configuration
Aircraft Engine Nacelle Fire Test Simulator
The evaluation of the replacement fire extinguishants for the aircraft engine nacelle application was performed in the AEN located at WPAFB, OH. The AEN is a ground test facility designed to simulate the fire hazards which exist in the annular compartment around an aircraft engine, and to test the effectiveness of the methods used to prevent, detect, and

extinguish fires in that area. This facility includes air delivery and conditioning equipment designed to simulate engine compartment ventilation air flow, a test fixture within which fire testing may be safely conducted, and an exhaust system which can cool the combustion products and scrub them sufficiently to allow their release into the atmosphere. Electrical heaters were used during the program to provide a hot area on the engine simulator insert surface.
3.1.2 Engine Nacelle Configuration
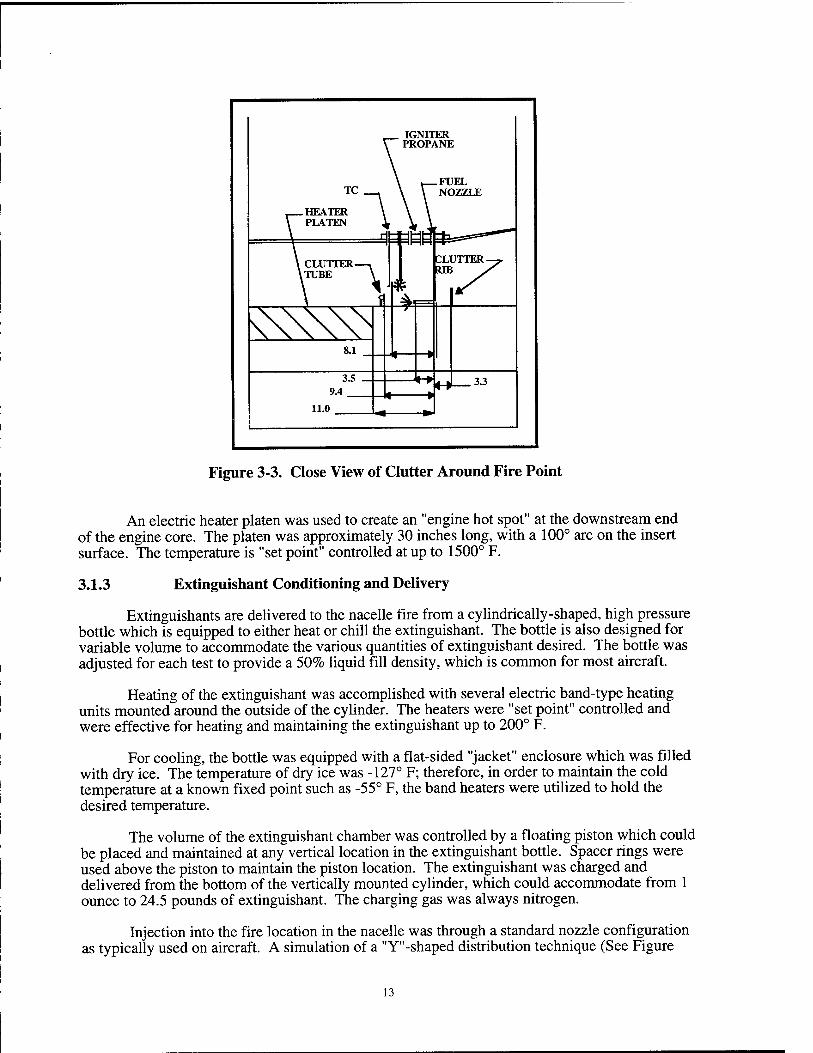
An adjustable test fixture (Figure 3-2) was designed and fabricated for the AEN and placed "on line" in March 1994. The goal of the new fixture was to simulate a full 360° airflow field and thus permit a realistic helical extinguishant distribution. The parameter Clearance (CLEAR) was adjusted by using a 24-inch diameter or 36-inch diameter internal insert that represented the engine casing. The outer diameter remained constant at 48 inches. The parameter Configuration (basically nacelle length) was varied by placing the extinguishant release inlet at two different locations within the nacelle. A standard clutter configuration was used around the fire zone to act as a flame holder (Figure 3-3), which consisted of a rib on the engine casing just upstream of the fuel release tube and igniter to stabilize the flame, and a 2- inch tube downstream of the fuel igniter which represented engine plumbing and allowed the flame to attach and heat. Removable clutter (also consisting of ribs alternating on the nacelle wall and engine casing every 12 inches and varying in height from 1 to 2 inches) was used upstream to hinder extinguishant distribution.
CONTOURED FUEL SUMP
r EXISTING EXIT COKE f HEATER
I IGNTTOR ^\
F FUEL INJECTION
A AGEKT RELEASE POIHT
Tli MULTIPLE TCS
TR DOUBLE TCS
PM MULTIPLE PRESSURE TRAKS
PR DOUBLE PRESSEURE TRANS
I FIXED DEPTH
T ADJUSTABLE DEPTH
DUAL PORT WINDOWS
"jE^i—-ji—i—-3y , r IR""T ir i—rr,'
-if
_(t(4.M> -
D|145901 3411-16-8173 |1 Sai.ffi.1, ,, , \m„£ZxZ
Figure 3-2. Adjustable Test Fixture
12
IGNITER PROPANE
.HEATER PLATEN
CLUTTER- iTUBE
^^
8.1
3.5 9.4
11.0
*-» «-K .3.3
Figure 3-3. Close View of Clutter Around Fire Point
An electric heater platen was used to create an "engine hot spot" at the downstream end of the engine core. The platen was approximately 30 inches long, with a 100° arc on the insert surface. The temperature is "set point" controlled at up to 1500° F.
3.1.3 Extinguishant Conditioning and Delivery
Extinguishants are delivered to the nacelle fire from a cylindrically-shaped, high pressure bottle which is equipped to either heat or chill the extinguishant. The bottle is also designed for variable volume to accommodate the various quantities of extinguishant desired. The bottle was adjusted for each test to provide a 50% liquid fill density, which is common for most aircraft.
Heating of the extinguishant was accomplished with several electric band-type heating units mounted around the outside of the cylinder. The heaters were "set point" controlled and were effective for heating and maintaining the extinguishant up to 200° F.
For cooling, the bottle was equipped with a flat-sided "jacket" enclosure which was filled with dry ice. The temperature of dry ice was -127° F; therefore, in order to maintain the cold temperature at a known fixed point such as -55° F, the band heaters were utilized to hold the desired temperature.
The volume of the extinguishant chamber was controlled by a floating piston which could be placed and maintained at any vertical location in the extinguishant bottle. Spacer rings were used above the piston to maintain the piston location. The extinguishant was charged and delivered from the bottom of the vertically mounted cylinder, which could accommodate from 1 ounce to 24.5 pounds of extinguishant. The charging gas was always nitrogen.
Injection into the fire location in the nacelle was through a standard nozzle configuration as typically used on aircraft. A simulation of a "Y"-shaped distribution technique (See Figure
13

3-4), pointed downstream, was used for half of the tests to assess its influence, and the other half of the tests simply dumped the extinguishant through the side of the outer nacelle with no control of distribution. The injection location could be varied at two axial locations in the nacelle chamber.
Figure 3-4. Y-Shaped Distribution Tubing
3.1.4 Extinguishants
The two extinguishants chosen for gaseous extinguishant testing were Halon 1301 and HFC-227ea. These extinguishants were chosen because their extinguishing mechanisms are radically different from one another. Halon 1301 extinguishes fires by both physical and chemical means. It physically suppresses a fire by diluting and cooling and chemically suppresses by reacting with the intermediate combustion products to break down the combustion process. In contrast, HFC-227ea has less volatility, a higher boiling point, and is more likely to be released as a liquid at lower air temperatures. Its primary fire-extinguishing mechanism is physical in nature. Its high specific heat causes it to absorb the energy of the fire. HFC-227ea was chosen as the extreme compared to halon instead of perfluorohexane (as originally intended) because, although it had a higher boiling point, it could not demonstrate adequate distribution to fires a great distance from the release point to assure extinguishing under those test conditions.
3.1.5 Airflow
Air delivery and conditioning allowed for the simulation of test pressure conditions of atmospheric pressures. In addition, controllable heating and cooling of the air were provided. The inlet air supply originated from two sources: (1) an air blower with a maximum capacity of 8,780 SCFM (11.2 pounds per second) and (2) a high pressure blow-down system with a storage capacity of 8,800 pounds of air at 2,000 psig. A flow control and vent by-pass system was used to control airflow to the engine nacelle. Standard commercial-type controllers were used to control the blower airflow. The airflow controller system consisted of a differential pressure/current transmitter, controller, current/pneumatic transducer, and a 24-inch butterfly valve with pneumatic actuator and positioner.
The air exhaust subsystem included those components downstream of the nacelle transition. Major components include the 24-inch piping from the nacelle outlet to the 10 and 24-inch butterfly valves, the 10-inch butterfly valve at the ejector inlet, the 24-inch atmospheric throttling butterfly valve, the ejector, the adaptive piping for the 10 and 24-inch pipe merging and enlarging to the 48-inch pipe, a water quencher/sump section, the 48-inch exhaust stack, a
14

scrubber bypass valve, the scrubber with recirculating water pump, scrubber-to-fan ducting (42- inch), and a centrifugal exhaust fan with outlet ducting. A water treatment system, which was located at ground level, accepts liquids pumped from the quench/sump section and also liquids which drain or overflow from the scrubber. In addition, combustibles are separated from the water/chemical solution through a series of baffles in the water treatment tank where quality is sensed for monitoring in the control room. Accumulated combustibles are manually drained into the facility waste fuel sump, and the water/chemical solution was recirculated until the water quality is on the verge of being chemically unacceptable, at which time the solution is expelled into the base sanitary sewer system.
3.1.6 Data Requirements
The primary data requirements were whether the fire was extinguished (observed visually and recorded) and the mass of the extinguishant required to extinguish the fire. These two data items established the measure of effectiveness used in this phase of testing. In addition, other data included ventilation temperature, ventilation pressure, mass flow rate, nacelle free volume, extinguishant discharge time, and compartment surface temperature.
Type K thermocouples were used to measure the surface temperature of the compartment walls as well as the ventilation air temperatures.
3.1.7 Photo Coverage
Static photographic support was provided by the Aeronautical System Center (ASC) Technical Photo Department located at WPAFB.
3.1.8 Video
Video cameras were placed at two locations to view the fire through ports on the nacelle fixture. One view was from directly behind the fuel injection nozzle looking downstream. The other was a side view of the fire location. The two views of each fire test are recorded on videotape which becomes part of the permanent record of the program.
3.2 Procedure
3.2.1 Qualification Testing
The purpose of this phase of testing was to qualify the new full-annulus test fixture at the AEN. For the eight combinations of those variables that influence fire quality - mass flow, air temperature, and air pressure - it had to be demonstrated that sustained fires could be achieved, and also extinguished, under all the setting conditions required by the 32-run Phase I test matrix. The methodology of qualifying the operating parameters for this new test fixture followed the lessons learned from the previous year's testing with the 1/3-annulus test fixture. See Appendix A for test-peculiar information.
The Qualification Test Series consisted of four stages. Stage I was simply a system checkout of the fixture itself. Stage II established the values of the airflow parameters that the facility could support. Stage III was the actual flammability qualification test process that insured sustained fires would result at each combination of parameter settings used in the L-32 Phase I Parameter Study Test Matrix following the Qualification Testing. Stage rv explored different worst-case scenarios to insure that a maximum charge of extinguishant could extinguish a fire. It was important to establish the fact that not only could a reliable fire be maintained for each airflow associated with the various combinations of mass flow, air
15

temperature, and air pressure, but that a maximum charge of extinguishant (limited by the extinguisher size) would extinguish these fires.
3.2.1.1 Stage I - System Checkout
When the test engineers felt the primary installation and implementation task was complete, all critical instrumentation was in working order, all plumbing and hardware was attached, and all system components were operational, the qualification testing began. Prior to an actual test, the following checkouts were made:
1. Nitrogen pressurization checkout: It was demonstrated that for both the atmospheric and high pressure atmospheric conditions in the nacelle, the nitrogen pressure regulator system could be maintained at the 0.5 psia pressure differential within the inner nacelle core above the testing air pressure. This was required for heater operation to insure that hot flammable gases would not enter the inside of the engine core and be explosive. Even though this 0.5 psia pressure differential was manually operated (eventually an automatic system was installed), testing was allowed to proceed since the heater could adequately be protected.
2. Heater checkout: A graduated test series was conducted to allow for the heater components, and the surrounding material, to gradually be prepared for maximum thermal loads.
3.2.1.2 Stage II - Facility Extremes/Airflow Parameter Settings
The purpose of this phase of the qualification testing was to establish the maximum and minimum parameter levels for mass flow, air pressure, and air temperature the facility and the new test section could support. It was important to realize that due to the operation of the facility at extreme settings, these three parameters might be very dependent upon each other.
Stage ila: Prefire system testing. The 24-inch inner core section was installed with 1-inch clutter (LOW). Using the high pressure air system and beginning with 0.1 lb/s mass flow, minimum and maximum attainable air pressure values were established. Mass flow was increased by 0.1 lb/s and again maximum attainable air pressure values were measured. Minimum mass flow required to maintain a maximum air pressure was recorded. Results are reported in Table 3-3. Mass flows below 0.5 lb/s did not permit stable air flows due to control relays. Therefore, Table 3-3 only indicates the results at and above 0.5 lb/s of mass flow.
Table 3-3. Mass Flow Versus Pressure
MASS FLOW (lb/s) MAX PRESSURE SUPPORTED (psia)
0.1-0.49 unstable
0.5 15 stable
0.6 15.2
0.7 15.5
0.8 15.8
0.9 16.04
1.0 16.3
1.08 16.5
1.25 17.0
16

A similar, less extensive test of the blower system was done to investigate minimum pressures and mass flow values that could be obtained with the blower. For the range of mass flow rate and pressure extremes demonstrated (and necessary to maintain tangible extremes in testing), only 2.75 Ib/s of airflow could be used to heat the air to 275° F and generate 17 psia of air. A minimum temperature of 100° F was used because it was controllable, being above ambient, since a chiller was not available to control the temperature at lower levels. As a result of these tests the settings shown below in Table 3-4 were set as extremes for the major air-related parameters used in experiments.
Table 3-4. Air-Related Parameter Settings
PARAMETER LOW HIGH
Mass flow 1.25 lb/s 2.75 lb/s
Air Pressure 14.5 psia 17 psia
Air Temperature 100° F 275° F
Stage üb: Hot Surface Measurements. As a result of previous studies, a hot surface temperature of 1300° F was desired for the hot surface temperature HIGH setting. Testing was done and confirmed that this condition could be achieved.
3.2.1.3 Stage III - L-32 Qualification Testing - Flammability Studies
The purpose of this stage of testing was to establish that a strong 5 second fire was attainable at each of the airflows resulting from the various combinations of mass flow, air temperature, and air pressure. Testing incorporated both fuels (JP-8 and MIL-H-83282) at 100° F and used four different nozzles for each fuel. The full nacelle was in the TOP configuration with the 36-inch inner core section and 2-inch clutter (HIGH) installed. Parameter settings are summarized below in Table 3-5.
Table 3-5. Flammability Studies Parameter Settings
PARAMETER SETTING
Clutter 2"
Fuel Temperature 100° F
Burn Time 5 sec
Fire Location Top
Clearance 6 inches
Fuel JP-8 & MIL-H-83282
The first exercise investigated the vertical positioning of the fuel nozzles. Following qualification tests to determine the thermocouple locations for flame temperature measurements, it was determined that two open-ended thermocouples would be installed so that the ends were 0.5-inch off the 36-inch core section surface. For consistency, the temperature, measured by a thermocouple located 6 inches downstream, would be used for the evaluation. Using this process, it was found that the vertical positions of 0.5 or 0.75-inch above the core section caused

the hottest flame temperatures. Lower temperatures were observed if the nozzle was placed any closer to the core surface, and in some cases a fire was not possible.
After the thermocouple and nozzle vertical positions were established, the flammability study was begun. Initially, it was desired that the total 64 configuration matrix would be run twice using two different longitudinal locations for the igniter. This would accommodate off- stoichiometric combustion conditions and insure that all extinguishants were tested against a fully developed hot fire. However, scheduling constraints forced the selection and utilization of only one igniter location.
Table 3-6 shows the results of the flammability study. Each nozzle (FNOZ) and fuel type category is grouped for easy comparison. For MIL-H-83282 hydraulic fluid, the 2 and 6 gallons/hour (gph) rated nozzles were ruled out because there were cases where a flame could not be lit. Based on the highest average temperatures observed, the 6 gph rated nozzle was selected for JP-8 and the 4 gph rated nozzle was selected for MIL-H-83282. Accordingly, for the rest of the qualification testing, and for the Phase I Parameter Study Test Matrix, these nozzles were used with their respective fuels. The actual fuel mass flows as determined from collected discharges for the nozzles were: JP-8, with a 6 gph rated Monarch Nozzle -11.3 gph; and, MIL- H-83282, with a 4 gph rated Stainless Nozzle - 33.91 gph. These higher flow rates were due to the high pressures applied to the systems.
3.2.1.4 Stage IV - L-32 Qualification Testing - Fire Suppression Studies
The purpose of this stage of the Qualification Test Series was to verify that all fires could be suppressed by a maximum volume of extinguishant. These tests brought to light the issue of reignition. This phenomenon required that a new parameter — post-discharge fuel flow time (PTJJVI) — be established for each of the two fuels used. Post-discharge fuel flow time was defined to be the maximum length of time the fuel could continue to flow after the initial release of the maximum amount of extinguishant available and not have a reignition. The parameter settings used in this testing, which were considered to be worst-case fires, are presented in Table 3-7.
Table 3-8 summarizes the results of this testing. The first test confirmed the possibility that a maximum amount of extinguishant would not be able to extinguish a fire. Perfluorohexane was not able to extinguish a fire when the Extinguishant Discharge Location was SIDE, Configuration SHORT, and Fire Location TOP. Subsequent tests with Halon 1301, HFC-227ea, HFC-125, and CF3I showed that maximum fills of these extinguishants were able to extinguish the fire with these parameter settings. As a result, perfluorohexane was dropped from the program, and HFC-227ea was inserted as the second extinguishant to be used with Halon 1301 since it differed most dramatically from halon among the remaining effective extinguishants. This replacement applied to the Phase I Parameter Study Test Matrix as well as in the rest of the Qualification Test Series. Table 3-8 also shows that there were no reignitions for either a TUBE or DUMP release of maximum extinguishant quantity at 5 seconds or less of post-discharge fuel flow time for any extinguishant. The TUBE test of CF3I was never conducted because of bad weather restrictions on when CF3I could be tested. The first eight tests used a post-discharge fuel flow time (PTIM) of 3 seconds.

Table 3-6. Flammability Study Test Matrix
TEST INTE | APRS | ATMP
(lb/s) ! (psia)i CD
FUEL! FNOZ
(gph)
FTMP
CD TEST INTE | APRS | ATMP
Ob/s) | (psia) | CD
| FUEL | FNOZ
\ ! (gph)
j FTMP
1 CD 1
2
1.25 j 14.5 j 100 JP-8 j 2 978 33 3.00 | 14.5 I 100 j JP-8 j 2 | 1083
j 1132
| 1511
1.25 j 14.5 | 100 JP-8 j 4
6
1148
1383
34
35
3.00 j 14.5 |
3.00 j 14.5 j
100
100
! JP-8 1 4
| JP-8 j 6 3
4
5
6
7
8
9
10
11
12
13
14
15
16
17
18
19
20
21
22
23
24
25
26
27
1.25 | 14.5 j 100 JP-8 j
1.25 j 14.5 j
1.25 j 14.5 j
1.25 j 14.5 |
100
100
100
JP-8 j
83282 j
83282 j
8
2
4
1315
1900
1760
36
37
38
3.00 | 14.5 |
3.00 | 14.5 I
3.00 ; 14.5 I
100
100
100
1 JP-8 j 8
! 83282 | 2
j 83282 | 4
| 1328
! NONE
! 1807
1.25 1 14.5 j
1.25 | 14.5 |
100
100
83282 ;
83282 j
6
8
| 1777
| 1422
39
40
3.00 | 14.5 I
3.00 \ 14.5 j
100
100
f 83282 1 6
j 83282 | 8
| 1851
1 1963
1.25 j 14.5 j
1.25 | 14.5 |
275
275
j JP-8 j
JP-8 |
2
4
I 1103
| 1328
41
42
3.00 | 14.5 |
3.00 | 14.5 |
3.00 | 14.5 j
275
275
275
| JP-8 j 2
| JP-8 | 4
! JP-8 j 6
j 1238
j 1322
| 1381 1.25 | 14.5 !
1.25 j 14.5 j
275 JP-8 \ 6 j 1281 43
275 ! JP-8 j 8 | 1349 44 3.00 j 14.5 | 275
275
j JP-8 j 8
I 83282 | 2
j 1316
| 1748 1.25 1 14.5 j
1.25 | 14.5 j
1.25 j 14.5 |
1.25 | 14.5 |
1.25 ! 17.0 !
275
275
275
| 83282 ; 2 j 1716 45 3.00 j 14.5 |
| 83282 |
| 83282 |
4
6
| 1834
j 1669
46
47
3.00 ! 14.5 !
3.00 ] 14.5 j
275
275
j 83282 j 4
| 83282 | 6
| 1966
| 1747
| 2000
| 1200
j 1282
| 1396
275
100
j 83282 j
I JP-8 |
8
2 | 926
48
49
3.00 1 14.5 j
3.00 | 17.0 \
275
100
j 83282 j 8
| JP-8 j 2
j JP-8 | 4
f JP-8 1 6 1.25 | 17.0 j
1.25 | 17.0 !
1.25 ! 17.0 |
1.25 j 17.0 j
1.25 | 17.0 j
100
100
100
100
j JP-8
j JP"8
1 JP-8
| 83282
4 j 1150 50 3.00 | 17.0 j
3.00 j 17.0 |
100
100 6
8
2
1 1296
| 1243
j 1896
51
52
53
3.00 | 17.0 |
3.00 | 17.0 |
100
100
100
100
| JP-8 | 8
| 83282 j 2
j 83282 | 4
j 83282 j 6
! 1177
{ NONE
j 1641
| 1611
100 j 83282 4 | 1911 54 3.00 j 17.0 j
3.00 j 17.0 j 1.25 | 17.0 I 100 | 83282 6 | NONE 55
1.25 j 17.0 j 100 I 83282 8 | 871 56 3.00 j 17.0 j
3.00 | 17.0 j
100
275
\ 83282 | 8
i JP-8 | 2
| 1532
j 1228 1.25 | 17.0 \
1.25 ] 17.0 |
1.25 | 17.0 j
275
275
275
| JP-8
j JP-8
2
4
| 1013
| 1049
57
58 3.00 I 17.0 | 275 | JP-8 I 4 I 1246
j JP-8 6 j 1312 59 3.00 j 17.0 j 275
275
275
j JP-8 j 6
; JP-8 j 8
| 83282 ; 2
| 1339
! 1334
| 1295
28
29
30
1.25 I 17.0 !
1.25 ! 17.0 |
275
275
| JP-8 8 I 1131 60 3.00 j 17.0 I
; 83282 2 ; 1772 61 3.00 | 17.0 |
1.25 | 17.0 j 275 ] 83282 4
6
! 8
j 1806 62 3.00 | 17.0 j 275 ! 83282 j 4 j 1909
31
32
1.25 | 17.0 I
j 1.25 ! 17.0 j
275
275
| 83282
I 83282
j 357
\ 830
63
| 64
3.00 j 17.0 j
3.00 ! 17.0 |
275
275
1 83282 | 6
1 83282 | 8
| 625
j 1941
19

Table 3-7. Post-Discharge Fuel Flow Time Study - Parameter Settings
PARAMETER SETTING
Extinguishant All
Extinguishant Amount Max
Extinguishant Discharge Location
Side
Extinguishant Pressure 400 psia
Extinguishant Temperature -20° F
Air Pressure 17 psia
Air Temperature 275° F
Clutter 2"
Configuration Short
Clearance 6 inches
Distribution Dump, Tube
Fire Location Top
Fuel JP-8, MIL-H-83282
Hot Surface 1300° F
Mass Flow 2.75 lb/s
Preburn Time 20 sec
Table 3-8. Post-Discharge Fuel Flow Time Study Results - JP-8
RUN DIST EXTNGT PTIM (sec) AMT (lbs)** REIG?
1 Dump Perfluorohexane 3 32.5 Y*
2 Dump 1301 3 32.5 N
3 Dump HFC-227ea 3 28.5 N
4 Dump HFC-125 3 24.5 N
5 Dump CF3I 3 32.5 N
6 Tube HFC-227ea 3 28.5 N
7 Tube HFC-125 3 24.5 N
8 Dump CF3I 3 10.0 N
9 Dump HFC-227ea 6 28.5 Y
10 Dump HFC-227ea 4.5 28.5 N
11 Dump HFC-227ea 5.3 28.5 N
12 Dump CF3I 5.3 24.5 N
13 Dump HFC-125 5.3 24.5 N
*Fire could not be extinguished using Perfluorohexane. **Maximum amount of extinguishant stored (variable due to density) -Test #8 was an
exception.
20

Once it was established that fires could be extinguished, the next step was to vary the post-discharge fuel flow time itself. This was done using the same conditions outlined above with HFC-227ea as the extinguishant. Table 3-8 shows that with a post-discharge time of 5.3 seconds there was no hot surface reignition, but with a post-discharge of 6 seconds there was. Additional tests with maximum allowable fills of HFC-125 and CF3I confirmed that there was no hot surface reignition with the 5.3 second post-discharge. As a result, it was established that for JP-8, a post-discharge fuel flow time of 5 seconds would be used for Phase I testing.
Further testing using MIL-H-83282 hydraulic fluid uncovered a worse situation. Hydraulic fluid burns in a very rich manner, i.e., there is excess hydraulic fluid that does not burn. Consequently, hydraulic fluid revealed a greater tendency for hot surface reignition. The fluid that does not burn is blown downstream along the core section outer surface, until it comes in contact with the hot surface. Sometimes this reignition process took 15 to 17 seconds after the extinguisher was fired. Table 3-9 shows the results of a short test series which varied the post- discharge fuel flow time of the MIL-H-83282 to study this situation. In order to obtain a condition where maximum amounts of extinguishant could prevent a hot surface ignition, the post-discharge fuel flow time had to be set to 0 seconds.
Table 3-9. Post-Discharge Fuel Flow Time Study Results - MIL-H-83282
RUN} DKT EXTNGT PTTM(sec) AMT (lbs) REIG?
1 Dump HFC-227ea 5 28.50 Y
2 Dump HFC-227ea 2.5 28.50 Y
3 Dump HFC-227ea 1.3 28.50 Y
4 Dump HFC-227ea 0 28.50 Y
5 Dump CF3I 0 10.00 N
Additional testing was conducted to ensure that maximum amounts of each of the three candidate extinguishants (HFC-227ea, HFC-125, and CF3I) would extinguish a worst-case fire using both distribution methods (TUBE and DUMP) with the fire on the opposite side (BOTTOM) of the nacelle from the extinguishant discharge location (TOP). Table 3-10 shows the settings which were used for this test series. Table 3-11 shows the results; in all six test runs, the fire was extinguished with no reignition.
Table 3-10. Worst-Case Fire Parameter Settings
PARAMETER /', .SETTING PARAMETER ■ . SETTING
Air Pressure 17 psia Extinguishant Temperature -20° F
Air Temperature 275° F Extinguishant Pressure 400 psia
Mass Flow 2.75 lb/s Fire Location Bottom
Preburn Time 20 seconds Configuration Short
Extinguishant Discharge Location Top Clearance 6 inches
Post-Discharge Time 5 seconds Clutter 2"
Fuel JP-8 Hot Surface Off
Extinguishant HFC 227ea, HFC 125, CF3I Extinguishant Distribution Tube, Dump
Extinguishant Amount Max Fuel Temperature 100° F
21

Table 3-11. Worst-Case Fire Results
RUN DISTRIBUTION EXTINGraSHANT MfpUNTObs) EIRE EXTINGUISHED
4ala Dump HFC-227ea 28.5 YES
4alb Tube HFC-227ea 28.5 YES
4a2a Dump HFC-125 24.5 YES
4a2b Tube HFC-125 24.5 YES
4a3a Dump CF3I 10.0 YES
4a3b Tube CF3I 10.0 YES
Reignition after the extinguishant has been dumped is an issue if fuel continues to flow and an ignition source is still available (such as the simulated hot engine casing). This methodology of setting the post-discharge fuel flow time to a value where the maximum amount of available extinguishant will prevent a reignition has been selected as the standard for this program. The maximum available extinguishant was limited by the extinguisher size. It was sized by determining the maximum amount of halon stored per unit volume that is currently fielded in existing aircraft and adjusted for the volume of the existing simulator. In essence, it is sized to deliver the maximum amount of halon available in existing systems, with a corresponding overall level of protection and range of protection conditions equivalent to existing systems. This quantity was calculated to be approximately 32 pounds of halon and the test extinguisher was sized to this amount. Due to density variations, slightly different mass maximums of the alternative extinguishants are possible. The reignition phenomenon is a significant problem and should be studied in further testing. Resource constraints did not allow any further investigation under this test program.
3.2.2 Full-Scale Testing
Data collection worksheets for the basic 32-run test matrix design were provided to test personnel. This experimental configuration was developed using a Placket-Burman experimental matrix to determine the relative influence of each of these variables on the response variable, or output, which is the amount of extinguishant required to extinguish a particular fire. Table 3-12 shows these worksheets. This worksheet records the LOW/HIGH level settings for each factor for each test run. Run 1 shows each factor set at its LOW level. Successive test runs vary the level of different factors as shown.
Each test run was repeated four times (adjusting the extinguishant quantity using the bracketing procedure) and an estimate of the amount of extinguishant required to extinguish the fire obtained. This procedure was required because of the difficulty involved in directly determining the response variable as previously described in Paragraph 3.0. The bracketing procedure is shown in Figure 3-1.
22

Table 3-12. Data Collection Worksheet
RUN CLEAR
(in)
CONF INTE (lb/s)
LOCA CLUT STMP PF)
DIST BTMP PREB (sec)
BPRS (psia)
APRS (p»ia>
EXTNGT ATMP (°F)
FUEL FTMP (°F)
ALOC AMT (lbs)
1 6 Short 1.25 Bot Low 175 Dump Low 5 400 14.5 HFC-227ca 100 83282 100 Side
2 6 Short 1.25 Bot Low 175 Dump Low 20 800 17 1301 275 IP-8 325 Top
3 6 Short 1.25 Bot High 1300 Tube High 20 800 17 1301 100 83282 100 Side
4 6 Short 1.25 Bot High 1300 Tube High 5 400 14.5 HFC-227ea 275 JP-8 325 Top
5 6 Short 2.75 Top High 1300 Dump Low 5 400 17 1301 275 JP-8 100 Side
6 6 Short 2.75 Top High 1300 Dump Low 20 800 14.5 HFC-227ea 100 83282 200 Top
7 6 Short 2.75 Top Low 175 Tube High 20 800 14.5 HFC-227ca 275 JP-8 100 Side
8 6 Short 2.75 Top Low 175 Tube High 5 400 17 1301 100 83282 200 Top
9 6 Long 2.75 Bot Low 1300 Tube Low 5 800 17 HFC-227ea 100 JP-8 325 Side
10 6 Long 2.75 Bot Low 1300 Tube Low 20 400 14.5 1301 275 83282 100 Top
11 6 Long 2.75 Bot High 175 Dump High 20 400 14.5 1301 100 JP-8 325 Side
12 6 Long 2.75 Bot High 175 Dump High 5 800 17 HFC-227ca 275 83282 100 Top
13 6 Long 1.25 Top High 175 Tube Low 5 800 14.5 1301 275 83282 200 Side
14 6 Long 1.25 Top High 175 Tube Low 20 400 17 HFC-227ca 100 JP-8 100 Top
15 6 Long 1.25 Top Low 1300 Dump High 20 400 17 HFC-227ca 275 83282 200 Side
16 12 Long 1.25 Top Low 1300 Dump High 5 800 14.5 1301 100 JP-8 100 Top
17 12 Long 1.25 Bot Low 175 Tube High 5 400 17 1301 275 JP-8 100 Side
18 12 Long 1.25 Bot Low 175 Tube High 20 800 14.5 HFC-227ca 100 83282 200 Top
19 12 Long 1.25 Bot High 1300 Dump Low 20 800 14.5 HFC-227ea 275 JP-8 100 Side
20 12 Long 1.25 Bot High 1300 Dump Low 5 400 17 1301 100 83282 200 Top
21 12 Long 2.75 Top High 1300 Tube High 5 400 14.5 HFC-227ca 100 83282 100 Side
22 12 Long 2.75 Top High 1300 Tube High 20 800 17 1301 275 JP-8 325 Top
23 12 Long 2.75 Top Low 175 Dump Low 20 800 17 1301 100 83282 100 Side
24 12 Long 2.75 Top Low 175 Dump Low 5 400 14.5 HFC-227ea 275 JP-8 325 Top
25 12 Short 2.75 Bot Low 1300 Dump High 5 800 14.5 1301 275 83282 200 Side
26 12 Short 2.75 Bot Low 1300 Dump High 20 400 17 HFC-227ea 100 JP-8 100 Top
27 12 Short 2.75 Bot High 175 Tube Low 20 400 17 HFC-227ca 275 83282 200 Side
28 12 Short 2.75 Bot High 175 Tube Low 5 800 14.5 1301 100 JP-8 100 Top
29 12 Short 1.25 Top High 175 Dump High 5 800 17 HFC-227ea 100 JP-8 325 Side
30 12 Short 1.25 Top High 175 Dump High 20 400 14.5 1301 275 83282 100 Top
31 12 Short 1.25 Top Low 1300 Tube Low 20 400 14.5 1301 100 JP-8 High Side
32 12 Short 1.25 Top Low 1300 Tube Low 5 800 17 HFC-227ea 275 8328 Low Top
below. The procedures which were followed in the conduct of Phase I testing are presented
1. Configure test article. 2. Charge extinguishant distribution bottle. 3. Physically leave room if fire test involved. 4. Set remaining test parameters. 5. Initiate data acquisition instrumentation. 6. Initiate test fire. 7. Release extinguishant after predetermined preburn time. 8. Continue fuel flow for 5 seconds after extinguishant release to insure fuel
reaches engine (0 seconds for MLL-H-83282). 9. Terminate data acquisition after 45 seconds.
10. Continue, or increase, airflow to cool down test article (560°R). 11. Remove fuel from facility. 12. Shut down to prepare for next test.
A TI Programmer or equivalent was used for all critical timing events. Output response variables recorded were:
23

1. Amount of extinguishant used to extinguish the fire. 2. Fire intensity (thermocouple, TV). 3. Temperature of exhaust gases. 4. CO and C02 in exhaust gases. 5. Time to extinguish fire (extinguishant dump to fire out). 6. Keep down time - fire out to reignition - if reignition occurred.
The following sequence of pictures and diagrams illustrates a test configuration and results. Figures 3-5 through 3-8 show the engine nacelle fire with fuel spray and the nacelle fire after the fuel spray was turned off.
Figure 3-5. Picture of Engine Nacelle Fire With Fuel Spray
-RADIATION SHIELD PROPANE IGNITER
TOP VIEW PERSPECTIVE
-r——"i i / I HEATER PLATEN-1 2INCIITLTJING / I ne«ienri.MiciM (ENGIWpi,™§ING) i
-^—r \ i
—\ «—r
-u—
Figure 3-6. Diagram of Engine Nacelle Fire With Fuel Spray
24

Figure 3-7. Picture of Engine Nacelle Fire With Fuel Spray Turned Off
RADIATION SHIELD PROPANE IGNITER
Figure 3-8. Diagram of Engine Nacelle Fire With Fuel Spray Turned Off
25

4.0 RESULTS
4.1 Data Analysis
The factors used in Phase I and the settings for each level are shown in Table 4-1. The 32-run Phase I Test Matrix and the factor settings, shown as -1 and 1 for the Low and High Settings respectively, are shown in Table 4-2. The 32-run Phase I Test Matrix with the actual factor satinfs and the value of the response variable are shown in Table 4-3. The response variable (AMT) is defined to be the average of the minimum weight of extinguishant that put out the fire and the maximum weight of extinguishant that did not, and was determined using the bracketing procedure described previously.
Table 4-1. Phase I Parameters and Settings
PARAMETER SYMBOL LÖWSETTING(-l) HIGH SETTING (+1)
Extinguishant EXTNGT HFC-227ea Halon 1301
Extinguishant Discharge Location
ALOC Side Top
Extinguishant Distribution DIST Dump Tube
Extinguishant Temperature BTMP -20° F 160° F
Air Pressure APRS 14.5 psia 17.0 psia
Air Temperature ATMP 100° F 275° F
Bottle Pressure BPRS 400 psi 800 psi
Clutter GLUT Low (1-inch) High (2 inches)
Configuration CONF Short Long
Clearance CLEAR 6 inches 12 inches
Fire Location LOCA Bottom Top
Fuel FUEL MIL-H-83282 JP-8
Fuel Temperature FTMP 100° F 200° F(83282)
325° F(JP-8)
Internal Air Flow DSTTE 1.25 lb/s 2.75 lb/s
Preburn Time PREB 5 sec 20 sec
Surface Temperature STMP 175° F 1300°F
26

Table 4-2. Phase I Test Matrix Showing Orthogonal High-Low Pattern
CLEAR CONF INTE LOCA (XUT STMP DIST BTMP PREB BPRS APRS EXTGT ATMP :FÜEL;:' ETMP ALOC
.j _i _1 -1 -1 -1 -1 -1 -1 -1 -1 -1 -1 -1 ■1 ~l
_! _1 -1 -1 -1 -1 -1
_| _1 -1 -1 -1 -1 -1
_! .J _1 -1 -1 -1 -1 -1
.1 -1 -1 -1 -1 -1 "1
_, -1 -1 -1 -1 -1 -1
.! -1 -1 -1 -1 -1 ~*
.1 -1 -1 -1 -1 -1 -1
-1 -1 -1 -1 -1 -1
-1 -1 -1 -1 -1 -l . — -1 -1 -1 -1
-1 -1 -1 -1 -1 ■1
_j -1 -1 -1 -1 '*
_1 -1 -1 -1 -I
_1 -1 -1 -1 "1
-I -1 -1 -1 -1 ~1
_i -1 ■I '*■
_1 -1 -1 -1 -1
_1 -1 -1 -1 -1 ■1 ~'
_i -1 -1 -1 -1 -1
-1 -1 -1 -1 -1 -1 "1
-1 -1 -I -1 ~1 _1
-1 -1 -1 -1 -1
-1 -1 -1 -1 "' _, -1 -1 -1 ~l
-1 -1 -1 ■1
-1 -1 -1 -1 ■I
_i -1 -1 -1 -1 -1
_i -1 -1 -1 -1
_i -1 -1 -1 "1
1 A _i 1 | -1 -1 1 -1 -1 "
27

Table 4-3. Phase I Test Matrix With Response Variable
RUN CLEAR (in)
CpNF INTE LOCA CLUT STMP en
DIST BTMP
CF) ■PRE»
(sec)'
»PRS
(i*>i»V APRS (pjia)
EXTNGTV ATMP FUEL FTMP f0n
ALOC AMT
Ofes)
6 Short 1.25 Bol Low 175 Dump -20 5 400 14.5 HFC-227ea 100 83282 100 Side 1.375
2 6 Short 1.25 Bot Low 175 Dump -20 20 800 17 1301 275 JP-8 325 Top 1.125
3 6 Short 1.25 Bot High 1300 Tube 160 20 800 17 1301 100 83282 100 Side 2.750
9000 4
5
6
6
Short
Short
1.25
2.75
Bot
Top
High
High
1300
1300
Tube
Dump
160
-20
5
5
400
400
14.5
17 1301 275 JP-8 100 Side 1.375
6 2.75 Top High 1300 Dump -20 20 800 14.5 HFC-227ea 100 83282 200 Top 17.57
6 Short 2.75 Top Low 175 Tube 160 20 800 14.5 HFC-227ea 275 JP-8 100 Side 0.940
8 6 Short 2.75 Top Low 175 Tube 160 5 400 17 1301 100 83282 200 Top
Side
0.141
1.875 9
10
6
6
6
Long
Long
2.75
2.75
2.75
Bot
Bot
Bot
Low
Low
High
1300
1300
175
Tube
Tube
Dump
-20
-20
160
5
20
20
800
400
400
14.5
14.5
1301
1301
275
100
83282
JP-8
100
325
Top
Side
6.875
0.345
12 6 Long 2.75
1.25
Bot
Top
High
High
175
175
Dump
Tube
160
-20
5
5
800
800
17
14.5
HFC-227ea
1301
275
275
83282
83282
100
200
Top
Side
3.750
0.235
1.25 Top High 175 Tube -20 20 400 17 HFC-227ca 100 JP-8 100 Top 2.250
15
16
6
6
Long Long
1.25
1.25
Top
Top
Low
Low
1300
1300
Dump
Dump
160
160
20
5
400
800
17
14.5
HFC-227ea
1301
275
100
83282
JP-8
200
100
Side
Top
26.94
0.815
17
18
12
12
Long
Long
1.25
1.25
Bot
Bot
Low
Low
175
175
Tube
Tube
160
160
5
20
400
800
17
14.5
1301
HFC-227ea
275
100
JP-8
83282
100
200
Side
Top
4.500
3.250
4.500 19
20
12
12
Long
Long
1.25
1.25
2.75
Bot
Bot
Top
High
High
High
1300
1300
1300
Dump
Dump
Tube
-20
-20
160
20
5
5
800
400
400
17
14.5
1301
HFC-227ea
100
100
83282
83282
200
100
Top
Side
9.000
9.000
22
23
24
12
12
12
Long
Long
Long
2.75
2.75
2.75
Top
Top
Top
High
Low
Low
1300
175
175
Tube
Dump
Dump
160
-20
-20
20
20
5
800
800
400
17
17
14.5
1301
1301
HFC-227ea
275
100
275
JP-8
83282
JP-8
325
100
325
Top
Side
Top
15.00
0.940
5.500
25
26
27
28
29
30
31
32
12
12
12
12
12
12
12
12
Short
Short
Short
Short
Short
Short
Short
Short
2.75
2.75
2.75
2.75
1.25
1.25
1.25
1.25
Bot
Bot
Bot
Bot
Top
Top
Top
Top
Low
Low
High
High
High
High
Low
Low
1300
1300
175
175
175
175
1300
1300
Dump
Dump
Tube
Tube
Dump
Dump
Tube
Tube
160
160
-20
-20
160
160
-20
-20
5
20
20
5
5
20
20
5
800
400
400
800
800
400
400
800
14.5
17
17
14.5
17
14.5
14.5
17
1301
HFC-227ea
HFC-227ca
1301
HFC-227ea
1301
1301
HFC-227ea
275
100
275
100
100
275
100
275
83282
JP-8
83282
JP-8
JP-8
83282
JP-8
8328
200
100
200
100
325
100
High
Low
Top
Side
Top
Side
Top
Side
Top
10.50
17.57
1.125
2^50
0.280
15.00
7.500
4.1.1 Analysis of the Factorial Experiment
The calculations of effect size and sum of squares for each factor and interaction sets between factors were performed and the results are shown in Table 4-4. The sum of squares for each factor was then expressed as a percent of total variability. The larger the percentage of total v^abihty accounted for by any factor, the stronger the indication from the data that the.effect of that factor on the response variable is of sufficient size to stand out from the experimental error, or "noise."
28

Table 4-4. Analysis of the Factorial Experiment
FACTOR EFFECT SUM OF SQUARES 1 ^PERCENT OF TOTAL
STMP 6.69525 358.611 26.1423
FTMP 5.08225 206.634 15.0634
IASet5 3.38713 91.7809 6.69073
PREB 3.3365 89.0579 6.49222
IA Set 13 3.17588 80.6895 5.88217
EXTNGT -3.07838 75.8111 5.52655
FUEL -2.87913 66.3149 4.83428
CLEAR 2.72213 59.2797 4.32142
ATMP 2.619 54.8733 4.0002
BPRS -2.56412 52.5979 3.83433
IASet9 2.49837 49.935 3.64021
IA Set 14 2.35913 44.5238 3.24573
IASet8 -2.071 34.3123 2.50133
IA Set 12 -1.6915 22.8894 1.66861
IA Set 10 -1.6465 21.6877 1.58101
IASet3 -1.39288 15.5208 1.13145
INTE 1.04537 8.74247 0.637316
APRS 1.041 8.66945 0.631993
IA Set 15 -0.83475 5.57446 0.406372
LOCA 0.82475 5.4417 0.396694
ALOC -0.682125 3.72236 0.271356
BTMP 0.666 3.54845 0.258678
IASetl 0.659 3.47425 0.253269
CONF -0.54475 2.37402 0.173063
IASet4 0.44525 1.58598 0.115616
IASet6 -0.434 1.50685 0.109848
CLUT -0.392875 1.23481 0.090016
IASet2 -0.2715 0.589698 0.0429883
DIST -0.265875 0.565516 0.0412255
IASetll -0.158375 0.200661 0.014628
IASet7 -0.040875 0.0133661 0.000974375
1 TOTAL 1371.763 100.00%
Those factors that were 3% or more of the total sum of squares were identified as variables to be included in the next phase of the experimentation. More typically, only those factors that are 5 to 10% of the total sum of squares would be identified as probably having an effect distinguishable from statistical noise. Since this was only the first phase of experimentation, it was decided to err on the conservative side and not exclude variables from future phases of the experiment.
29

Those factors that are each 3% or more of the total Sum of Squares are:
1. Surface Temperature (STMP) - 26.1 % 2. Fuel Temperature (FTMP) - 15.1% 3. Preburn Time (PREB) - 6.5% 4. Extinguishant (EXTNGT) - 5.5% 5. Fuel (FUEL) - 4.8% 6. Clearance (CLEAR) - 4.3% 7. Air Temperature (ATMP) - 4.0% 8. Bottle Pressure (BPRS) - 3.8% 9. Two-factor interactions. The significant interaction (IA) sets are:
• IA Set 5 - 6.7% • IA Set 13-5.9% • IA Set 9 - 3.6% • IA Set 14 - 3.2%
Each interaction set consists of eight two-factor interactions statistically confounded with one another. Determining which interactions in a given IA set are physically meaningful involves a combination of statistical analysis and engineering judgment. The statistical methodology is presented below.
The factors involved in each IA set are provided in Table 4-5.
Table 4-5. Confounded Two-factor Interaction Sets - Engine Nacelle
INTERACTION SETS INTERACTIONS
IASetl AB=CF=GH=EL=DK=MN=JO=IP
IASet2 AC=DG=BF=HK=IO=EM=LN=JP
IASet3 AD=CG=FH=IL=BK=JM=NO=EP
IASet4 AE=GJ=IK=BL=CM=FN=HO=DP
IASet5 BC=AF=DH=U=GK=LM=EN=OP
IA Set 6 BD=CH=EI=FG=AK=JN=MO=LP
IASet7 BE=DI=HJ=AL=FM=CN=GO=KP
IASet8 CD=AG=BH=EJ=FK=IN=LO=MP
IASet9 CE=DJ=HI=BN=FL=AM=KO=GP
IA Set 10 DE=BI=CJ=KL=GM=HN=FO=AP
IASetll DF=BG=AH=CK=JL=IM=EO=NP
IA Set 12 EF=GI=JK=CL=BM=AN=DO=HP
IA Set 13 AI=EK=FJ=DL=HM=GN=CO=BP
IA Set 14 AJ=EG=FI=HL=DM=KN=BO=CP
IA Set 15 CI=BJ=EH=GL=KM=DN=AO=FP
FAG roRS A=FTMP E=CLEAR I=STMP M=ATMP
B=CLUT F=PREB J=LOCA N=DIST
C=INTE G=FUEL K=EXTNGT 0=BRPS
D=CONF H=BTMP L=APRS P=ALOC
30

To begin the statistical analysis, each of the factors (variables) was ranked from 16 (largest effect) to 1 (smallest effect) based on each factor's percent of total sum of squares (see Table 4-4). The ranking of the factors is given in Table 4-6.
Table 4-6. Rankings of Main Effects - Engine Nacelle
RANK NUMBER FACTOR
RANK NUMBER FACTOR
RANK NUMBER FACTOR
RANK NUMBER FACTOR
16 I 12 G 8 C 4 H
15 A 11 E 7 L 3 D
14 F 10 M 6 J 2 B
13 K 9 0 5 P 1 N
Next each factor in an interaction was replaced by its rank number. The interaction (IA) between factors STMP and FTMP, for example, would be replaced by 16*15, indicating that this interaction involves the two largest main effects. Those interactions with the largest product would be likely candidates to be the interactions that are the active ones. It is possible for two factors to have small main effects but still have a significant interaction. This means the combination of settings of two or more variables have a pronounced effect on the response variable However, typically one of the interaction factors is significant as a mam effect by itself to produce a significant two-factor interaction with another. The interaction groups are shown in Table 4-7.
Table 4-7. Interaction Groups - Engine Nacelle
INTERACTION
1
10
11
12
13
14
15
INTERACTION PAIR WITH FACTOR REPLACED WITH RANK NUMBER IN THE
ANALYSIS
15*2=8*14=12*4=11*7=3*13=10*1=6*9=16*5
15*8=3*12=2*14=4*13=16*9=11*10=7*1=6*5
15*3=8*12=14*4=16*7=2*13=6*10=1*9=11*6
15*11=12*6=16*13=2*7=8*10=14*1=4*9=3*5
2*8=15*14=3*4=16*6=12*13=7*10=11*1=9*5
2*3=8*4=11*16=14*12=15*13=6*1=10*9=7*6
2*11=3*16=4*6=15*7=14*10=8*1=12*9=13*5
8*3=15*12=2*4=11*6=14*13=16*1=7*9=10*5
8*11=3*6=4*16=2*1=14*7=15*10=13*9=12*5
3*11=2*16=8*6=13*7=12*10=4*1=14*9=15*5
3*14=2*12=15*4=8*13=6*7=16*10=11*9=1*6
11*14=12*16=6*13=8*7=2*6=15*1=3*9=4*5
15*16=11*13=14*6=3*7=4*10=12*1=8*9=2*6
15*6=11*12=14*16=4*7=3*10=13*1=2*9=8*5
8*16=2*6=11*4=12*7=13*10=3*1=15*9=14*5
MOST LIKELY INTERACTION
COMBINATIONS
CF IP
AC IO
CG IL
AE IK
AF GK
EI AK
FM GO
AG FK
AM KO
GM FO
CK IM
EF GI
AI EK
EG FI
KM AO
31

Based on this analysis, the significant two-factor interactions in each of the IA sets of interest are: __
• IA Set 5 - Either STMPxLOCA or FTMPxPREB • IA Set 9 - Either FTMPxATMP or EXTNGTxBPRS • IA Set 13 - Either FTMPxSTMP or CLEARxEXTNGT • IA Set 14 - Either CLEARxFUEL or PREBxSTMP
The screening (or scree) plot of each factor's Sum of Squares as a percent of the total demonstrates the relative influences of different fire zone factors on quantities of extinguishant needed (Figure 4-1). Points indicated with numbers (e.g., IA Set 5) are two-factor interactions, rather than single factors. In all the scree plots that follow, "Effect Sum of Squares" refers to the contribution to the test measurement variability for each factor.
30 T
Q. 5 to 2?
•<j- <D fc- CJ i— T- r» _ „ b _ co *- — <D CD W CO ?S m
CO CO ö rn " CO < — CO a m
CO < < -
Factors and Interaction Sets
Figure 4-1. Effect Sum of Squares as Percent of Total
To further examine the data, a Normal Plot of the effects (a plot on Normal graph paper) was constructed. With this type of experimental design, there is no replication of experimental conditions to provide an estimate of experimental error. An analysis method often used to separate real effects from noise is a Normal Plot of the effects. Assuming that the data are approximately Normally distributed, the effects of the factors that have little or no influence on the response variable should plot as a straight line on the Normal Plot. Points that fall considerably off the line formed by the majority of plotted values suggest that those effects are having a stronger influence on the response variable. An examination of the Normal Plot, shown in FiAre 4-2, clearly shows factors STMP, FTMP, PREB, CLEAR, and ATMP, and at the low end FUEL EXTNGT, and possibly BPRS are well off the line formed by the majority of points. All of these effects are statistically significant at the 0.05 level. This means there is a 95% probability that the identified factors do indeed have an effect on the weight of extinguishant required The effects that appear to lie on the line are "pooled" into a term to estimate the experimental error and used in the analysis of variance. The plot also seems to indicate that perhaps some two-factor interactions are "off the line."
32

0.97
St- o s
I 05
>STMP
• FTMP
CLEAR
LOCA
IASetl4 IA Set 15 ^
IA Set 10
E APRS
BTMP IASetl
fNTE APE
• IA
©IASetS • PREB
•iASetll
ATMP Set 3
DIST flASetn CLUT W IASet2
CONF tßIA Set 7 iblMl
- #IA Set 6
•lASet8 Ä •lASetl3 • lASet9
• BPRS
• FUEL
* EXTNGT
-3.07838 1.80844 6.69525
Inverse of the Normal Probability Function
Figure 4-2. Normal Plot of the Effects
Table 4-8 presents a preliminary Analysis of Variance (ANOVA) for the Phase I test matrix results. In all the ANOVA tables that follow, the following abbreviations are used:
• D.F. - degrees of freedom describe the relative efficiency of the different estimators. Estimates vary more with fewer degrees of freedom.
• S.S. - sum of squares, calculated as the sum of the squared deviation of each observation from the mean.
• MS- mean square, calculated as the S.S. divided by the degrees of freedom. The greater the M.S., the greater the variance of the factor (parameter), and therefore, the more likely the factor has a statistically significant effect on the response variable (the amount of extinguishant required to extinguish a fire).
• F - F- ratio, calculated as the mean square for each factor (parameter) divided by the M.S. of the error term. When the F-ratio is close to 1.0, the estimates of the M.S. for a specific factor and the M.S. of the error are similar. This is an indication that the factor under consideration
33

probably does not have a significant effect on the response variable. However, when the F-ratio is large, the estimates are dissimilar, and this dissimilarity is taken to be an indication of potential real effect of the factor on the response variable. The F-ratio can also be thought of as discriminating between the real effects (signal) of each factor and statistical fluctuations (noise).
Table 4-8. Analysis of Variance - Phase I Test Matrix - Engine Nacelle
FACTOR D.F. S.S. M. S. F •.
STMP 1 358.611 358.611 48.10028
FTMP 1 206.634 206.634 27.7157
IASet5 1 91.7809 91.7809 12.31052
PREB 1 89.0579 89.0579 11.94528
IA Set 13 1 80.6895 80.6895 10.82284
EXTNGT 1 75.8111 75.8111 10.1685
FUEL 1 66.3149 66.3149 8.894779
CLEAR 1 59.2797 59.2797 7.951151
AIRT 1 54.8733 54.8733 7.360123
BPRS 1 52.5979 52.5979 7.054925
IASet9 1 49.935 49.935 6.697752
IA Set 14 1 44.5238 44.5238 5.971951
Error 19 141.6542411 7.455486374
Total 31 1371.763241
4.1.2 Transformation of the Response Variable
When performing an analysis of data, it is often the case that the data are better analyzed using a transformation of the response variable rather than the original metric in which the data are reported. Common statistical practice dictates an analysis of the data using a logarithm^ol the response variable should be considered when the range of the response data is large, typically an order of magnitude. Such was the case here.
To determine if a transformation of the data was needed, a plot of the residuals versus predicted values was constructed. The residual at each observation is defined as the observed response value minus the predicted response value. If the plot shows a purely random pattern about zero, a transformation is not indicated. Predicted values of the response variable were generated using a predictive model of the general form Y = b0 + bjX, + b2X2 +...+ bkX k ^uch a model can be fitted to the experimental conditions and used to generate predicted values. Here the X.'s are the factors (parameters), in their standard units and test values, that are judged to standout from the "noise". The remaining effects are set equal to zero. For example if the factors STMP, FTMP, PREB, EXTNGT, FUEL, CLEAR, ATMP, and BPRS were judged to stand out from the noise (see Figure 4-2), and the more likely interactions were selected from the interaction sets, a predictive model of the form
34

Predicted Amount of Extinguishant = 5.301995 - 0.0012514*STMP - 0 0371929*FTMP - 0.4009593*PREB - 2.0786543* EXTNGT - 2.1575296*FUEL
+ 0.4536875*CLEAR - 0.0008004*ATMP - 0.0064103*BPRS + 0.0023017*FTMP*PREB + 0.0000205*FTMP*STMP + 0.0000870*FTMP*ATMP + 0.0002796*PREB*STMP
was developed. Please note the b0 and fy values are based on model development with the factors (X's) in their standard units and test values, except for the factors EXTNGT and FUEL which used the coded values (-1/+1) for LOW and HIGH settings, respectively. Different values for b0 and the b;'s would have been derived if coded values had been used for all the factors. A plot of the residuals versus predicted values was constructed and is shown in Figure 4-3. Negative predicted values are due to inaccuracies associated with the predictive model.
Figure 4-3. Residual Values Versus Predicted Values - Phase I
This plot does not show the characteristics of a random scatter about zero that would be expected if the underlying assumptions of the analysis were being satisfied. Rather, the plot indicates that an analysis should be considered using some transformation of the original response variable. Accordingly, a natural logarithmic transformation was performed and the data reanalyzed.
4.1.3 Analysis of the Factorial Experiment After Log Transformation
Table 4-9 shows the results of analysis of the factorial experimental data after performing a natural logarithmic transformation.
Those factors that were 3% or more of the total sum of squares were identified as variables to be included in the next phase of the experimentation. More typically, only those factors that are 5 to 10% of the total sum of squares would be identified as probably having an effect distinguishable from statistical noise. Since this was only the first phase of testing, it was decided to err on the conservative side and not exclude variables from future phases of the experiment.
35

Table 4-9. Analysis of the Factorial Experiment After Log Transformation
FACTOR EFFECT SUM OF SQUARES PERCENT^OF TOTAL
STMP 1.59655 20.3917 33.7784
EXTNGT -1.04339 8.70932 14.4268
CLEAR 0.947613 7.18377 11.8997
IASet4 0.583619 2.72489 4.51371
IASet5 0.575816 2.65252 4.39383
IA Set 12 -0.56266 2.53268 4.19532
IA Set 13 0.540963 2.34113 3.87802
FTMP 0.482258 1.86059 3.08202
ATMP -0.468527 1.75614 2.909
IASet3 -0.45738 1.67359 2.77227
LOCA -0.40387 1.30488 2.1615
PREB 0.403451 1.30218 2.15703
IA Set 14 0.38573 1.1903 1.9717
IASet9 0.379103 1.14975 1.90454
IASet7 -0.30827 0.760247 1.25933
BPRS -0.30546 0.746454 1.23648
APRS 0.284879 0.649249 1.07546
IASet2 -0.18884 0.285289 0.472575
FUEL -0.18798 0.282704 0.468292
IASetl 0.158242 0.200325 0.331834
IASet6 -0.15384 0.189323 0.313609
BTMP -0.11692 0.109364 0.181159
INTE 0.114186 0.104308 0.172784
IASetll -0.10392 0.0863984 0.143117
DIST 0.09332 0.0696684 0.115404
CONF 0.06784 0.0368184 0.0609889
CLUT -0.0642 0.0329712 0.054616
ALOC 0.052799 0.0223021 0.0369429
IASet8 -0.04839 0.0187344 0.0310331
IA Set 10 0.010678 0.000912179 0.001511
IA Set 15 0.008743 0.000611563 0.00101304
TOTAL 60.369119642 100.00%
36

With the transformation, those factors that are 3% or more of the total Sum of Squares are:
1. 2. 3. 4. 5. 6.
Surface Temperature (STMP) - 33.8% Extinguishant (EXTNGT) -14.4% Clearance (CLEAR) -11.9% Fuel Temperature (FTMP) - 3.1% Air Temperature (ATMP) - 2.9% Two-factor interactions. The significant interaction sets are: • IA Set 4 - 4.5% • IA Set 5 - 4.4% • IA Set 12 - 4.2% • IA Set 13 - 3.9%
The same methodology used previously to investigate the pretransformed data (Paragraph 4.1.1) is repeated for the post-transformed. The factors studied in the interaction sets are given in Table 4-10.
Table 4-10. Confounded Two-factor Interaction Sets After Log Transformation - Engine Nacelle
INTERACTION SETS! INTERACTIONS
IASetl AB=CF=GH=EL=DK=MN=JO=IP
IASet2 AC=DG=BF=HK=IO=EM=LN=JP
IASet3 AD=CG=FH=IL=BK=JM=NO=EP
IASet4 AE=GJ=IK=BL=CM=FN=HO=DP
IASet5 BC=AF=DH=U=GK=LM=EN=OP
IASet6 BD=CH=EI=FG=AK=JN=MO=LP
IASet7 BE=DI=HJ=AL=FM=CN=GO=KP
IASet8 CD=AG=BH=e=FK=IN=LO=MP
IASet9 CE=DJ=HI=BN=FL=AM=KO=GP
IA Set 10 DE=BI=CJ=KL=GM=HN=FO=AP
IASetll DF=BG=AH=CK=JL=IM=EO=NP
IA Set 12 EF=GI=JK=CL=BM=AN=DO=HP
IASetB AI=EK=FJ=DL=HM=GN=CO=BP
IA Set 14 AJ=EG=H=HL=DM=KN=BO=CP
IA Set 15 CI=BJ=EH=GL=KM=DN=AO=FP
FAC1 DORS >£s?s\': "" "-:,;":"v.:-:':?::N-'^vJ'^'i.-^V':,;"V/' :';':,.i' :->""s-v'"-vr''■*'. '■:"?-"~> ""- -■'■'■•
A=FTMP E=CLEAR I=STMP M=ATMP
B=CLUT F=PREB J=LOCA N=DIST
C=INTE G=FUEL K=EXTNGT 0=BRPS
1 D=CONF H=BTMP L=AIRP P=ALOC
Again each of the main factors was ranked from 16 (largest effect) to 1 (smallest effect) based on each factor's percent of total sum of squares (see Table 4-9). The ranking of the factors is given in Table 4-11.
37

Table 4-11. Rankings of Factors After Log Transformation - Engine Nacelle
RANK NUMBER FACTOR
«RANK , NUMBER FACTOR
RANK'BS NUMBER« FACTOR
RANK NUMBER FACTOR
16 I 12 M 8 L 4 N
15 K 11 J 7 G 3 D
14 E 10 F 6 H 2 B
13 A 9 0 5 C 1 P
Next each factor in an interaction was replaced by its rank number. Interaction IK, for example, would be replaced by 16*15, indicating that this interaction involves the two largest main effects. Those interactions with the largest product would be likely candidates to be the interactions that are the active ones. It is possible for two factors to have small mam effects but still have a significant interaction. This means the combination of settings of two or more variables have a pronounced effect on the response variable. However, typically one of the interaction factors is significant as a main effect by itself to produce a significant two-factor interaction with another. The interaction groups are shown in Table 4-12.
Table 4-12. Interaction Groups After Log Transformation - Engine Nacelle
INTERACTION :..;,.;sETr-:f.v>:.>;
1
10
11
12
13
14
15
INTERACTION PAIR WITH FACTOR REPLACED WITH RANK NUMBER IN THE
ANALYSIS
12*1=4*9=6*5=13*7=2*14=11*3=10*8=16*1
12*4=2*6=1*9=5*14=15*8=13*11=7*3=11*1
12*2=4*6=9*5=15*7=1*14=10*11=3*8=14*1
12*13=6*10=15*14=1*7=4*11=9*3=5*8=3*1
1*4=12*9=2*5=15*10=6*14=7*11=13*3=9*1
1*2=4*5=13*15=9*6=12*14=10*3=11*8=8*1
1*13=2*15=5*10=12*7=9*11=4*3=6*8=15*1
4*2=12*6=1*5=13*10=9*14=15*3=7*8=12*1
4*13=2*10=5*15=1*3=9*7=12*11=14*8=7*1
2*13=1*15=4*10=14*7=6*11=5*3=9*8=13*1
2*9=1*6=12*5=4*14=10*7=15*11=13*8=4*1
13*9=6*15=10*14=4*7=1*11=12*3=2*8=6*1
12*15=13*14=9*10=2*7=5*11=6*3=4*8=2*1
13*6=9*15=14*8=5*7=2*11=14*3=1*8=5*1
4*15=1*10=13*5=6*7=14*11=2*3=12*8=10*1
MOST LIKELY INTERACTION
COMBINATIONS
EL JO
IO EM
IL JM
AE IK
D AF
EI AK
AL FM
EJ FK
AM KO
KL FO
IM EO
EF JK
AI EK
FI AJ
KM AO
Based on this analysis, the significant two-factor interactions in each of the IA sets of
interest are: ^ JA Set 4 - Either EXTNGTxSTMP or FTMPxCLEAR . IA Set 5 - Either STMPxLOCA or FTMPxPREB or AfRTxAIRP • IA Set 12 - Either PREBxCLEAR or EXTNGTxLOCA . IA Set 13 - Either FTMPxSTMP or EXTNGTxCLEAR or PREBxLOC
38

The scree plot of each factor's Sum of Squares as a percent of the total demonstrates the relative influences of different fire zone factors on quantities of extinguishing extinguishant needed (Figure 4-4).
<M m a. " - 2 © © EL
CO CD < < C CD -J
Factors and Interaction Sets
Figure 4-4. Effect Sum of Squares as Percent of Total After Log Transformation
A Normal Plot of the effects after the Log transformation was constructed The re suits are shown in Figure 4-5. Now the Normal Plot is much more definitive. Only STMP, CLbAK, and EXTNGT are seen to stand out from the line formed by the other effects, as well a^ some two-factor interactions. This means that a change in the settings of these factors sipificantly affects the response variable - the amount of extinguishant required to extinguish the tire. Only these three effects have an influence on the response variable large enough to clearly stand out from the experimental error and are statistically significant at the 0.05 level Less obvious are the factors FTMP and ATMP, each being approximately 3% of the Sum of Squares, lhe remaining effects are "pooled" into a term to estimate experimental error and used in the ANOVA results shown in Table 4-13.
39

£
2.5 r
2 ■•
1.5
1 ■-
0.5 o
iS W
£ o
3 -0.5-
-1.5
-2
-2.5
• STemp
• Clear
• IAS«t(4) ■ IASet(5)
• IAS«iU13) • fTlPP
i«S14)
• BPre • IASat(7)
• Loc • lASet(3)
• IASet(12)
* Extngt
Inverse of the Normal Probability Function
Figure 4-5. Normal Plot of the Effects After Log Transformation
Table 4-13. Analysis of Variance After Log Transformation - Phase I Test Matrix Engine Nacelle
FACTOR :^B:;Pm.:'m: :£:m:smm M.S. F
STMP 20.3917 20.3917 43.91158274
EXTNGT 8.70932 8.70932 18.75469067
CLEAR 7.18377 7.18377 15.46956413
IASet4 2.72489 2.72489 5.86779095
IASet5 2.65252 2.65252 5.711949051
IA Set 12 2.53268 2.53268 5.453885031
IA Set 13 2.34113 2.34113 5.04140036
FTMP 1.86059 1.86059 4.006603262
ATMP 1.75614 1.75614 3.781680141
Error 22 10.21637964 0.464380893
TOTAL 31 60.36911964
Using the five factors presented in Table 4-13 above and selecting the most likely interactions from the interaction sets, a predictive model of the form
40

Ln(Predicted Amount of Extinguishant) = -1.1744833 + 0-0°°3465*STMP :0.0020966*FTMP - 0.838772*EXTNGT + 0.1232584*CLEAR + 0.0026773*ATMP + 0.0003338*EXTNGT*STMP + 0.0000151*STMP*LOCA - 0.2813294*EXTNGT*LOCA + 0.0000059*FTMP*STMP
was developed and used to generate predicted values. A plot of residual values versus predicted values was made to check on the fit of the model, as shown in Figure 4-6. The residual plot now looks much more like a random scatter plot of points above zero. Negative predicted values are the result of a logarithmic transformation of a number less than 1 or inaccuracies associated with the predictions of the model.
1.5 -r
H 1.0 + O J < 0.5 + >
J 0.0 p -2 a -0.5 -- CO W tf -1.0 -
■1.5 -L
f ■ .0 0.<fc 1.0 P.o 3.0 4.0
PREDICTED VALUE
Figure 4-6. Residual Values Versus Predicted Values After Log Transformation - Phase I
4.2 Analysis Summary
The data analysis was performed on the original response variable (weight of extinguishant required to extinguish fire) and on the logarithm of the response variable. The conclusions were similar for both analyses. The three most important factors influencing the response were Surface Temperature, Extinguishant, and Clearance. With the transformed data, these three factors combined account for 60% of the variability of the response variable. The individual contributions are shown below:
• Surface Temperature - 33.8% • Extinguishant - 14.4% • Clearance-11.9%
41

5.0 CONCLUSIONS AND RECOMMENDATIONS
5.1 Conclusions
Based on the statistical analysis of the data generated under this test program and documented in this report, three factors in an aircraft engine nacelle fire most influence the amount of extinguishant needed to extinguish that fire. These three factors stand out as being statistically more significant than any other factor or interaction between two factors. These factors are:
• Surface Temperature • Extinguishant • Clearance
5.2 Recommendations
5.2.1 Phase II Test Parameters
A meeting of the Phase H Test Planning Working Group was held on August 3,1994 to review the results of the 360° engine nacelle testing and to consider the factors to be used in Phase II testing. Based on the results of Phase I, participants recommended that the factors Surface Temperature, Extinguishant, and Clearance be included in the Phase E test matrix, as well as others based upon two-factor interactions and other predicted potential effects based upon the three extinguishants selected for testing in Phase II.
5.2.2 Reignition Phenomenon
It is recommended that the reignition phenomenon be studied in greater depth. Testing conducted during this phase of the overall test program has uncovered the problems associated with keeping a fire suppressed after the extinguishant has been discharged and fuel continues to impinge on hot surfaces. Post-discharge fuel flow time - the maximum length of time fuel can continue to flow after the release of the maximum amount of extinguishant available and still not have reignition - needs to be investigated in greater detail for various types of fuel.
42

6.0 REFERENCES
1. Little, Bennett, Lee, "Comprehensive Test Plan, Halon Replacement Program for Aviation," October 1992.
2. Ball, Robert E., "The Fundamentals of Aircraft Combat Survivability Analysis and Design," 1985.
3 National Institute of Standards and Technology NIST SP 861, "Evaluation of Alternative In-Flight Fire Suppressants for Full Scale Testing in Simulated Aircraft Engine Nacelles and Dry Bays," April 1994.
43

APPENDIX A
120° ANNULUS TEST FIXTURE QUALIFICATION TESTING
A-l

1. INTRODUCTION
During the period of May - August 1993, the L-32 Test Matrix developed for the engine nacelle application was run on the 120° annulus test fixture (one third of an engine nacelle) in the engine nacelle test facility at Wright-Patterson Air Force Base. Reasons for this test series were twofold:
• The 120° annulus fixture was initially the test fixture operational within the engine nacelle facility. While providing most of the capabilities necessary to conduct the test matrix, there were a number of shortfalls. The most significant of these was the fact that neither the clearance of the nacelle simulator nor the extinguishant discharge location could be varied. As a consequence, the test matrix parameters Clearance (CLEAR) and Extinguishant Discharge Location (ALOC) could not be varied while using this simulator. In addition, the representation of one third of an engine nacelle did not allow for realistic distribution of extinguishant in the fixture and during the test. Despite these shortcomings, the test matrix was run in order to insure that some data were available in the event that the full 360° annulus test fixture could not be installed and qualified in a time frame sufficient to allow for completion of the L-32 test matrix.
• Conduct of the test matrix on the 120° annulus provided valuable "lessons learned" for the test team to use when performing the test matrix on the 360° annulus.
2. DESCRIPTION
The 120° (1/3) annulus engine nacelle simulator was a two-radian sector of concentric cylinders. The inner cylinder had a 15-inch radius; the outer cylinder, 24-inches. This provided the simulator with a nominal clearance of 9 inches. Hot surface capabilities were provided by three heated sections with a total length of 37 inches. An unheated inlet section of approximately five feet, together with an inlet transition, provided uniform flow within the nacelle test section. The inlet section transitioned from a 24-inch diameter duct to the 9 inch clearance test section. The last of the three heated sections directed airflow into a 4-foot diameter plenum, which then transitioned into a 24-inch diameter exhaust duct. The test simulator could also be rotated, thereby allowing the establishment of fires in the top and bottom of the test simulator.
3. 120° ANNULUS TEST MATRIX
The parameters and level settings used in the 120° annulus test matrix are shown below in Table A-l. These parameters and their level settings are identical to those presented in Table 3-2 with the exception that Table A-l does not contain the parameter Extinguishant Discharge Location (ALOC) and the level for the parameter Clearance (CLEAR) is constant for both the LOW and HIGH settings.
The test matrix is presented in Table A-2. All shots were made with CLEAR at 9 inches.
A-2

Table A-l. 120° Annulus Parameters and Settings
PARAMETERS SYMBOL LOW SETTING HIGH SETTING
Extinguishant EXTTNGT Perfluorohexane Halon 1301
Extinguishant Distribution DIST Dump Dist Tube
Extinguishant Temperature BTMP -20°F 160°F
Air Pressure APRS 14.5 psia 17.0 psia
Air Temperature ATMP 100°F 275°F
Bottle Pressure (non-adjusted) BPRS 400 psi 800 psi
Clutter CLUT Low ffigh
Configuration CONF Short Long
Clearance (distance between outer nacelle and engine core)
CLEAR 9 inches 9 inches
Fire Location (in nacelle) LOCA Bottom Top
Fuel FUEL MJL-H-83282 hydraulic fluid
JP-8
Fuel Temperature FTMP 100°F 200°F(83282)
325°F (JP-8)
Internal Ventilation Airflow INTE 1.25 lb/s 2.75 lb/s
Preburn Time PREB 5 sec 20 sec
Surface Temperature STMP 175°F 1300°F
A-3

Table A-2. 120° Annulus Test Matrix
CONF JNTE xqcA CLOT STMP »1ST ■'BTMP '■■iW ■■
PREB ÄAPRS,. EXTOGX.:: -.ATMPi'-. „PEL -.■"AWT.:*.
Short 0.6 Bot Low 175 Dump -20 5 270 14.5 Pert 100 83282 100
Short 0.6 Bot Low 175 Dump -20 20 800 17.0 1301 260 JP-8 325 0.340
Short 0.6 Bot High 1300 Tube 160 20 800 17.0 1301 100 83282 100 0.520
Short 0.6 Bot High 1300 Tube 160 5 460 14.5 Perf 260 JP-8
Short 2.5 Top High 1300 Dump -20 5 400 17.0 1301 260 JP-8 100
Short 2.5 Top High 1300 Dump -20 20 540 14.5 Perf 100 83282
Short 2.5 Top Low 175 Tube 160 20 1000 14.5 Perf 260 JP-8
Short 2.5 Top Low 175 Tube 160 5 400 17.0 1301 100 83282 200
Long 2.5 Bot Low 1300 Tube -20 5 540 17.0 Perf 100 JP-8 325 1.950
2.5 Bot Low 1300 Tube -20 20 400 14.5 1301 260 83282 100
Long 2.5 Bot High 175 Dump 160 20 400 14.5 1301 100 JP-8 325 0.385
Long 2.5 Bot High 175 Dump 160 5 1000 17.0 Perf 260 83282
Long 0.6 Top High 175 Tube -20 5 800 14.5 1301 260 83282 200
0.6 Top High 175 Tube -20 20 270 17.0 Perf 100 JP-8
Long 0.6 Top Low 1300 Dump 160 20 460 17.0 Perf 260 83282 200 31.19
0.6 Top Low 1300 Dump 160 5 800 14.5 1301 100 JP-8
0.6 Bot Low 175 Tube 160 5 400 17.0 1301 260 JP-8 100 0.315
Long 0.6 Bot Low 175 Tube 160 20 1070 14.5 Perf 100 83282 200 0.690
Long 0.6 Bot High 1300 Dump -20 20 620 14.5 Perf 260 JP-8
0.6 Bot High 1300 Dump -20 5 400 17.0 1301 100 83282
2.5 Top High 1300 Tube 160 5 460 14.5 Perf 100 83282 100
2.5 Top High 1300 Tube 160 20 800 17.0 1301 260 JP-8 325
2.5 Top Low 175 Dump -20 20 800 17.0 1301 100 83282 100
2.5 Top Low 175 Dump -20 5 270 14.5 Perf 260 JP-8 325
Short 2.5 Bot Low 1300 Dump 160 5 800 14.5 1301 260 83282 200
Short 2.5 Bot Low 1300 Dump 160 20 460 17.0 Perf 100 JP-8 100
Short 25 Bot High 175 Tube -20 20 270 17.0 Perf 260 83282 200
Short 2.5 Bot High 175
175
Tube -20
160
5
5
800
1000
14.5
17.0
1301
Perf
100
100
JP-8
JP-8
100
325 0.810
Short
Short
0.6
0.6 Top High 175 Dump 160 20 400 14.5 1301 260 83282 100 0.260
Short 0.6 Top Low 1300 Tube -20 20 400 14.5 1301 100 JP-8 325
Short 0.6 Top Low 1300 Tube -20 5 540 17.0 Perf 260 83282
4. ANALYSIS OF THE 120° NACELLE TEST MATRIX
The data were analyzed to calculate effect size and sum of squares for each factor and interaction^beTween fectors, as shown in Table A-3. The sum of squares for each factor was then expre^seTas a percent^ total Sum of Squares, or total variability. The larger the percentage of toTavariabUky accounted for by any factor, the stronger the indication from the data that the effect rfthat factor on the response variable is of sufficient size to stand out from the experimental error, or "noise."
kA

Table A-3. Analysis of the Factorial Experiment for 120° Annulus
FACTOR EFFECT SUM OF SQUARES PERCENT OF TOTAL
APRS 5.4195 234.968 11.9586
LOCA 5.0383 203.072 10.3353
IA Set 12 4.9705 197.647 10.0592
ATMP 4.9211 193.74 9.8603
IASet4 4.7414 179.845 9.1532
STMP 4.5586 166.248 8.4612
IASet5 3.9626 125.619 6.3936
EXTNGT -3.5658 101.717 5.1768
IA Set 13 -2.8843 66.5512 3.3871
INTE -2.4533 48.1475 2.4505
IASet6 -2.4351 47.4387 2.4144
IASet8 -2.428 47.1615 2.4002
PREB 2.4095 46.4455 2.3638
IA Set 11 2.1168 35.845 1.8243
IA Set 15 1.9989 31.964 1.6268
CONF 1.9633 30.8348 1.5693
DIST 1.9026 28.9599 1.4739
CLUT -1.8711 28.0089 1.4255
IASet7 1.8674 27.8967 1.4198
FUEL -1.8149 26.3502 1.3411
IASet2 1.4549 16.9333 0.8618
IA Set 10 1.4068 15.8316 0.8057
IASetl 1.3683 14.9769 0.7622
IA Set 14 -1.2876 13.2638 0.6751
DUM1 1.2164 11.8365 0.6024
FTMP 0.9386 7.0481 0.3587
BPRS 0.768 4.7186 0.2402
BTMP 0.7386 4.3645 0.2221
DUM2 0.7055 3.9818 0.2027
IASet3 0.5976 2.8573 0.1454
IASet9 0.267 0.5703 0.0290
TOTAL 1964.84 100.00%
A-5

Those factors and two-factor interactions that are each 4% or more of the total Sum oi Squares are:
1. 2. 3. 4. 5. 6.
Air Pressure (APRS) -12.0% Fire Location (LOCA) -10.3% Air Temperature (ATMP) - 9.9% Surface Temperature (STMP) - 8.5% Extinguishant (EXTNGT) - 5.2% Two-factor interactions
Those factors that were 4% or more of the total sum of squares were identified as probably having an effect distinguishable from statistical noise. More typically, only those factors that are greater than 5 to 10 percent of the total would be identified as having a significant effect. However, at this stage of experimentation, it was decided to err on the conservative side and not exclude variables from possible future phases of experimentation.
The scree plot of each factor's Sum of Squares as a percent of the total demonstrates the relative influences of different fire zone factors on quantities of extinguishant needed (Figure A- 1).
CO CL a. <
< CSJ 0. 2 I- <
m (- co - a -
co <
-I 1 h- LU CO 00
— CO CO < < co Q
CO < Parameters and Interactions
Figure A-l. Effect Sum of Squares as Percent of Totalfor 120° Annulus
The remaining factors and interactions were "pooled" into a term to provide an estimate of the experimental error. This pooling was used in the analysis of variance (ANOVA) data shown in Table A-4.
A-6

Table A-4. ANOVA for 120° Annulus
FACTOR D.F. ■::.?:S.S<:M M.S. F
APRS 234.968 234.968 9.616
LOCA 203.072 203.072 8.311
IA Set 12 197.647 197.647 8.089
ATMP 193.74 193.74 7.929
IASet4 179.845 179.845 7.360
STMP 166.248 166.248 6.804
IASet5 125.619 125.619 5.141
EXTNGT 101.717 101.717 4.163
Error 23 561.987 24.434
Total 1964.84 ' 1 4.1 Transformation of the Response Variable
When performing an analysis of data, it is often the case that the data are better analyzed using a transformation of the response variable rather than the original metric in which the data are reported. Common statistical practice dictates an analysis of the data using a logarithm of the response variable should be considered when the range of the data is large, typically an order of magnitude.
To determine if a transformation of the data was needed, a plot of the residuals versus predicted values was constructed. If the plot shows a purely random pattern about zero, a transformation is not indicated. Predicted values of the response variable were generated using a predictive model of the general form Y=b0+b,X1+b2X2+...+bkXk. Such a model can be fitted to the experimental conditions and used to generate predicted values. Here the X^ are the coded values (-1 for the LOW setting and +1 for the HIGH setting) of the effects that are judged to stand out from the "noise", b0 is the mean of all the response data, and the b; coefficient for each effect in the model is one-half the effect for that variable. The remaining effects are set equal to zero. For example, if the factors APRS, LOCA, ATMP, STMP, and AGNT are judged to stand out from the noise, a predictive model of the form
Predicted Value of Extinguishant = 3.704 + 2.710*APRS + 2.519*LOCA + 2 461*ATMP + 2.279*STMP - 1.783*EXTNGT + 1.981*STMP*LOCA + 2.371*LOCA *ATMP + 2.485*STMP*ATMP
was developed. The interactions shown in the model were selected from their respective interaction sets based on the fact that they are composed of factors which individually are considered significant. Please note that the b0 and b; values are based on model development with the coded values (-1/+1). Different values would have been derived if actual data had been used. A plot of the residuals versus predicted values was constructed and is shown in Figure A- 2.
A-7

Ed OS
10 T
5 --
■ 0 --
-2 -5 -
-10 --
-15 --
-20 --
J'"i,
10 14 18 22
PREDICTED VALUE
Figure A-2. Residual Values Versus Predicted Values for 120° Annulus
This plot does not show the characteristics of a random scatter about zero that would be expected if the underlying assumptions of the analysis were being satisfied. Rather, the plot fndfcates hat an analysis should be considered using some transformation of the original response vaSaWe Accordingly, a natural logarithmic transformation was performed and the data reanalyzed.
4.2 Analysis of the Factorial Experiment After Log Transformation
Table A-5 shows the results of analysis of the factorial experimental data after performing a natural logarithmic transformation.
A-8

Table A-5. Analysis of the Factorial Experiment After Log Transformation for 120° Annulus
FACTOR EXTNGT
APRS PREB STMP
IA Set 15 CONF ATMP IASetl IASet4
IA Set 12 LOCA DIST
IASet7 IA Set 13 IASet6 IASetll IA Set 14 IASet2
INTE DUM1 BTMP IASet3 IASet5 FUEL
IASet9 CLUT BPRS
IASet8 IA Set 10
DUM2 FTMP
TOTAL
EFFECT -1.486 1.1112 0.8484 0.7763 0.7159 0.7113 0.6943 0.6792 0.6307 0.5954 0.4748 0.4379 0.4201 -0.4082 0.3763 0.3633 0.3551 0.3321 -0.3192 0.2338 -0.186
-0.1727 0.1385 -0.137 0.1232 -0.0788 -0.0669 -0.0369 -0.0347 -0.0214 -0.0196
mm
SUM OF SQUARES
17.6649 9.8784 5.7577 4.8213 4.0999 4.0476 3.8562 3.6906 3.1819
PERCENT OF TOTAL
2.8358 1.8032 1.5341 1.412 1.333
1.1328 1.0559 1.0085 0.8823 0.8149 0.4375 0.2766 0.2385 0.1535 0.1501 0.1215 0.0496 0.0358 0.0109 -0.0096 0.0037 0.0031 78.2822
24.4324 13.6629 7.9635 6.6683 5.6706 5.5982 5.3336 5.1045 4.4009 3.9222 2.494 2.1218 1.9529 1.8437 1.5668 1.4604 1.3949 1.2202 1.1271 0.6051 0.3826 0.3298 0.2123 0.2076 0.168 0.0687 0.0495 0.015 0.0133 0.0051 0.0043
100.00%
With the transformation, those factors and two-factor interactions that are 4% or more of the total Sum of Squares are:
1. 2. 3. 4. 5. 6. 7.
Extinguishant (EXTNGT) - 24.4% Air Pressure (APRS) -13.7% Preburn Time (PREB) - 8.0% Surface Temperature (STMP) - 6.7% Configuration (CONF) - 5.6% Air Temperature (ATMP) - 5.3% Two-factor interactions
A-9

Following the methodology for determining the most likely interactions in each of the two-factor interaction sets (in Section 4.1.1 and 4.1.3), the most likely interactions are:
IA Set 15 - STMP*CONF or PREB*ATMP, IA Set 1 - CONF*EXTNGT or INTE*PREB, and IA Set 4 - STMP*APRS or LOCA*ATMP.
Figure A-3 shows the screening (or scree) plot of the Sum of Squares as a percent of the total for each factor and two-factor interaction sets following log transformation.
< &lli§Qlil»l|- <■ < co — — <
< (Ö < co co < — ^ — ^ ^ —
*- a. co w 2 2*-*- Q E CO CO
°> t to «o 2 ~ Sj - ' CL ID - Z> H-
CO CO ,5 Q u- < CO — < Ü
Factors and Interaction Sets
Figure A-3. Effect Sum of Squares as Percent of Total After Log Transformation for 120° Annulus
The remaining effects are "pooled" into a term to estimate experimental error for use in the ANOVA results shown in Table A-6.
A-10

Table A-6. ANOVA After Log Transformation for 120° Annulus
FACTOR D.F. S.S. M.S. ' F
EXTNGT 17.6649 17.6649 29.7556
APRS 9.8784 9.8784 16.6397
PREB 5.7577 5.7577 9.6986
STMP 4.8213 4.8213 8.1212
IA Set 15 4.0999 4.0999 6.9060
CONF 4.0476 4.0476 6.8179
ATMP 3.8562 3.8562 6.4956
IASetl 3.6906 3.6906 6.2166
IASet4 3.1819 3.1819 5.3597
IA Set 12 2.8358 2.8358 4.7767
Error 21 12.448 0.5928 ' V" '
TOTAL 31 72.2822
A plot of residuals versus predicted values was made to check on the fit of the model, as shown in Figure A-4 below. A predictive model of the form
LnfPredicted Value of Extinguishant) = -0.058 - 0.743*EXTNGT + 0.556*APRS + 0.424*PREB + 0.388*STMP +0.356*CONF + 0.347* ATMP + 0.340*CONF*EXTNGT + 0.315*LOCA *ATMP + 0.298*STMP* ATMP + 0.358*PREB*ATMP
was developed and used to generate the predicted values. The residual plot in Figure A-4 now looks much more like a random scatter plot of points about zero than the previous residual plot (Figure A-2).
A-ll

Cd P < >
g CO
2 T
1.5 --
1 -- ■
0.5 --
0
-0.5 <-
-1 --
-1.5 - -
-2 --
-■t- 1 2 ■ _
PREDICTED VALUE
5.
Figure A-4. Residual Values Versus Predicted Values After Log Transformation for 120° Annulus
CONCLUSIONS AND COMPARISONS
Based on the 120° annulus, and using the logarithmically transformed data, the following parameters were shown to have the greatest impact on fire extinguishment.
1. 2. 3. 4. 5. 6.
Extinguishant (EXTNGT) - 24.4% Air Pressure (APRS) -13.7% Preburn Time (PREB) - 8.0% Surface Temperature (STMP) - 6.7% Configuration (CONF) - 5.6% Air Temperature (ATMP) - 5.3%
The importance of obtaining the full 360° annulus and running the test matrix on it is demonstrated when the results of the two test series are compared. For the 360 nacelle, using transformed data, the following parameters were shown to be most significant:
1 Surface Temperature (STMP) -33.8% 2. Extinguishant (EXTNGT) -14.4% 3. Clearance (CLEAR) -11.9%
Utilizing the 360° annulus has also introduced the parameter Clearance as significant. This ™eter could not be varied in the 120° nacelle fixture. Inclusion of this parameter will allow the test program to more closely reflect the operational world. Using the full annulus also reordered the remaining two parameters.
The 120° test fixture was a moderately old piece of equipment. As a result, the seams of the 120° test fixture had a tendency to leak, pulling air in at atmospheric conditions, and blowing air out at higher pressures. This could have been a factor in explaining the significance in APRS for ±1 120° fixture and lack of APRS significance in the 360° fixture. The^surface^mperature simulation of the 120° fixture was much cruder and had limited controlled heating to the region airectly under the fuel spray. The heaters had to radiate heat to the underside of the fixture and some losses and dissipation of heat would occur. The direct heating on the exterior of the engine casing at the site of the fire resulted in a larger contribution to the results in the new fixture.
A-12

APPENDIX B
POWDER EXTINGUISHANT TESTING
B-l

1. INTRODUCTION
Aircraft engine nacelle powder extinguishant testing occured from 7-28 September 1993. Originally it was intended to repeat a 32-run matrix for powder extinguishants to determine if additional factors were important in the effectiveness of powder extinguishants. From the originally designed L-32 test matrix developed for the engine nacelle application, only three test runs were completed, due to time constraints and concerns raised by the initial test results. These shots strongly validated the comments of aircraft maintenance specialists who recommended against the use of powder extinguishants in the engine nacelle because of cleanup considerations. Their reasoning was that the post-incident cleanup would be an overwhelming task. This would be crucial if the incident occurred when aircraft availability was critical, such as during the quick turn-around necessary for repeated aircraft sortie operations. In addition, false alarm discharges would require the same overwhelming cleanup.
2. APPROACH
An effort was made to keep the parameters in the powder extinguishant matrix as much like those in the gaseous extinguishant matrix as possible. However, due to differences in the delivery of the extinguishant, some changes were necessary. Again, extensive testing was performed to ensure that a sustainable fire could be achieved under every set of conditions and that the fire could be extinguished. Table B-l lists the parameters chosen for the powder extinguishant phase and the settings for each level.
Table B-l. Powder Extinguishant Test Parameters and Levels for 120° Annulus
^PARAMETER Extinguishant Extinguishant Distribution Extinguishant Pressure, (psia) Air Pressure, (psia) Air Temperature, (°F) Dessicant Concentration (% by wt) Clutter Fire Location Fixture Length Fuel Fuel Temperature (°F), 83282 Fuel Temperature (°F), JP-8 Internal Ventilation Airflow (lb/sec) Particle Size, (microns). Desi-Karb Particle Size, ("microns), MgO Preburn Time (seconds) Surface Temperature (°F)
1IABEL EXTNGT
DIST BPRS APRS ATMP CABO CLUT LOCA LGTH FUEL FTMP FTMP INTE
EOWSEHEING Magnesium Oxide
Dump 600 14.7 100
Low Bottom Short 83282
100
PSIZ PSIZ PREB STMP
100 0.6 20
HTGHSET31NG Desi-Karb
Tube 800 17
260
High Top Long JP-8 200 325 2.5 40
175
10 20
1300
The two extinguishants that were chosen for powder testing were sodium bicarbonate (Desi-Karb) and Magnesium Oxide (MgO). These powders were mixed with 1% or 2%(by mass) fumed silica dessicant (Cabo-Sil). The dessicant was necessary to ensure proper flow of the powder through the extinguisher and the nacelle. Large and small particle sizes (PSIZ) were chosen for each extinguishant (40 microns and 20 microns for Desi-Karb; 10 microns and 2 microns for MgO). Sodium bicarbonate and magnesium oxide were selected as powder extinguishant corollaries to Halon 1301 and Perfluorohexane; sodium bicarbonate has a chemical suppression contribution, while for magnesium oxide, the effectiveness is purely physical in nature.
B-2

3. PROCEDURES
Except for changes made in the extinguishant handling, the procedures for the powder test series were identical to those used in the gaseous extinguishant test series. In the gaseous extinguishant test series, extinguishant was simply forced into the extinguisher through a flexible line. However, this method was impractical for powder extinguishants. To prevent packing of the extinguishant in the delivery system, Cabo-Sil fumed silica was mixed with the extinguishant.
4. TOXICITY
Though neither Desi-Karb nor MgO are toxic, some special handling was necessary. Since both extinguishants are powder and since they are mixed with a fumed silica dessicant, some respiratory problems can result from repeated exposure. Respirator masks were used during prolonged exposure, such as during charging of the extinguisher and cleanup after an experiment.
5. RESULTS
Three test runs were accomplished with powder extinguishants. Table B-2 shows the original test matrix for the powder extinguishants. As with the gaseous extinguishants, a bracketing procedure was used to arrive at the amount of powder extinguishant required to extinguish the fire. Each test run consisted of four individual tests in accordance with the established bracketing procedure. Table B-3 shows the resulting extinguishant amounts which were required to extinguish the fire under each set of test conditions. As before, the error in the final amount is ±6.5%. Due to the minimal amount of data generated from this test series, little can be discerned about the effect of each parameter on the effectiveness of the extinguishant.
Table B-2. Powder Test Matrix for 120° Annulus
fcXTNGT PS1Z; lN'lK -SPBT RUIN
1 2
CABO 1% 1%
XGTH Short Short
Bottom Bottom
Low Low
175 175
Dump Dump
83282 JP-8
100 325
MgO DSC
2 20 40
600 800 800
5 20 20
0.6 0.6 0.6
100 260 100
14.5 17.0 17.0
3 4 5
1% 1% 1%
Short Short Short
Bottom Bottom
Top
High High High
1300 1300
Tube Dump
JP-8 JP-8
325 1O0
MgO DSC
10 20
600 600 800
5 5 20
0.6 2.5 25
260 260 100
14.7 17.0 14.5
6 7
1% Short Short
Top Top Top
High Low
1300 175 175
Tube Tube
JP-8 83282
100 200
MgO DSC
10 40
800 600
20 5
2.5 2.5
260 100
14.5 17.0
9 10 11 12 13 14 15 16 17 18 19 20 21 22 23 24 25 26 27 28 29 30 31 32
Wo 1% 1% 1% 1% 1% 1% 1% 2% 2% 2% 2% 2% 2% 2% 2% 2% 2% 2% 2% 2% 2% 2% 2%
Long Long Long Long Long Long Long Long Long Long Long Long Long Long Long Long Short Short Short Short Short Short Short Short
Bottom Bottom Bottom Bottom
Top Top Top Top
Bottom Bottom Bottom Bottom
Top Top Top Top
Bottom Bottom Bottom Bottom
Top Top Top
1 Top
Low Low High High High High Low Low Low Low High High High High Low Low Low Low High High High High Low Low
1300 1300 175 175 175 175
1300 1300 175 175
1300 1300 1300 1300 175 175
1300 1300 175 175 175 175
1300 1300
Tube Tube
Dump Dump Tube Tube Dump Dump Tube Tube Dump Dump Tube Tube Dump Dump Dump Dump Tube Tube Dump Dump Tube Tube
JP-8 83282 JP-8
83282 83282 JP-8
83282 JP-8 JP-8
83282 JP-8
83282 83282 JP-8
83282 JP-8
83282 JP-8
83282 JP-8 JP-8
83282 JP-8
83282
325 100 325 100 200 100 200 100 100 200 100 200 100 325 100 325 200 100 200 100 325 100 325 100
MgO DSC DSC MgO DSC MgO MgO DSC DSC MgO MgO DSC MgO DSC DSC MgO DSC MgO MgO DSC MgO DSC DSC MgO
2 20 40 10 20 2 10 40 40 10 2
20 10 40 20 2
40 10 2
20 10 40 20 2
800 600 600 800 800 600 600 800 600 800 800 600 600 800 800 600 800 600 600 800 800 600 600 800
5 20 20 5 5 20 20 5 5 20 20 5 5 20 20 5 5 20 20 5 5 20 20 5
2.5 2.5 2.5 2.5 0.6 0.6 0.6 0.6 0.6 0.6 0.6 0.6 2.5 2.5 2.5 2.5 2.5 2.5 2.5 25 0.6 0.6 0.6 0.6
100 260 100 260 260 100 260 100 260 100 260 100 100 260 100 260 260 100 260 100 100 260 100 260
17.0 14.5 14.5 17.0 14.5 17.0 17.0 14.5 17.0 14.5 14.5 17.0 14.5 17.0 17.0 14.5 14.5 17.0 17.0 14.5 17.0 14.5 14.5 1 17.0 1
B-3

Table B-3. 120° Annulus Powder Test Results
■tBxm ■ .'"Extingmsfaant Part. Size (microns)
xi j (lbs)
X2 (lbs)
X3 1 (lbs)
X4 (lbs)
Amt (lbs)
1 MgO 2 j'- i^hää^^^M:0^^ml^^^iki^,, -. :i:iii:iÖ*=-".i.'':r=5*??^Si
2 DSC 20 ' '
3 DSC 40 4 MgO 10 -
5 DSC 20 j iHMi^igüii 6 MgO 2 -' _j, .
7 MgO 10 i 1 _ — - 8 DSC 40
9 MgÖ 2 ■ - ■'•> ""."-■ \:
10 DSC 20 '- 'Ä;ä.;*- Bi^te^^Ä
11 DSC 40 Mlliil __ __ _
12 MgO 10 fc flltiillliÄJii^llltif' l§^^»i|^^S
13 DSC 20 .1 0.05 0.08 0.09 1 0.085
14 MgO 2 1 11SI1I «•;.„,. lfllill><^*Sii _..
15 MeO 10 i l|:iittM?J:®^^ ? *"~w-'. • -;;-_ .; - ;
16 DSC 40 «fl^^^^^^B ''
17 DSC 40 1 ' ' Mi^W !liilte#lll
18 MgO 10 -.' •■>«.*
19 MgO 2 20 DSC 20 ••-"- ' Isfi^l^^^^^^' •-. ;-:--f,-. '
21 MgO 10 "■ •:•'''.*■'-'•
:
22 DSC 40 ? ;. -::.: '--
23 DSC 20 'Sl^il^jS^BI
24 MgO 2 1.6 0.8 1.2 1.0 0.9
25 DSC 40 26 MgO 10 1 ■" ^ ', " ' '
27 MgO 2 ■ „ lililll 28 DSC 20
29 MgO 10 BS'iiiiiii?*iÄiilPi-y'
30 DSC 40 0.8 1 1.2 1.0 l.i 1.15
31 DSC 20 1 '*' j ; ••!'-' ' _ .
32 I MsjQ 2 ;. :;i:i|fe^^^^^:: ^lllli^r^ ^fllilS^ '■■"'"l ^|P^!W«ilife , i
8-4