wk2 decision analysis
TRANSCRIPT

7/31/2019 WK2 Decision Analysis
http://slidepdf.com/reader/full/wk2-decision-analysis 1/42
A-1
OperationsOperations
ManagementManagement
Decision-Making ToolsDecision-Making Tools
7/31/2019 WK2 Decision Analysis
http://slidepdf.com/reader/full/wk2-decision-analysis 2/42
A-2
OutlineOutline
♦Decision Making & Models.
♦Decision Tables.
♦ Decision making under uncertainty.♦ Decision making under risk.
♦ Expected value of perfect
information (EVPI).
♦Decision Trees.
7/31/2019 WK2 Decision Analysis
http://slidepdf.com/reader/full/wk2-decision-analysis 3/42
A-3
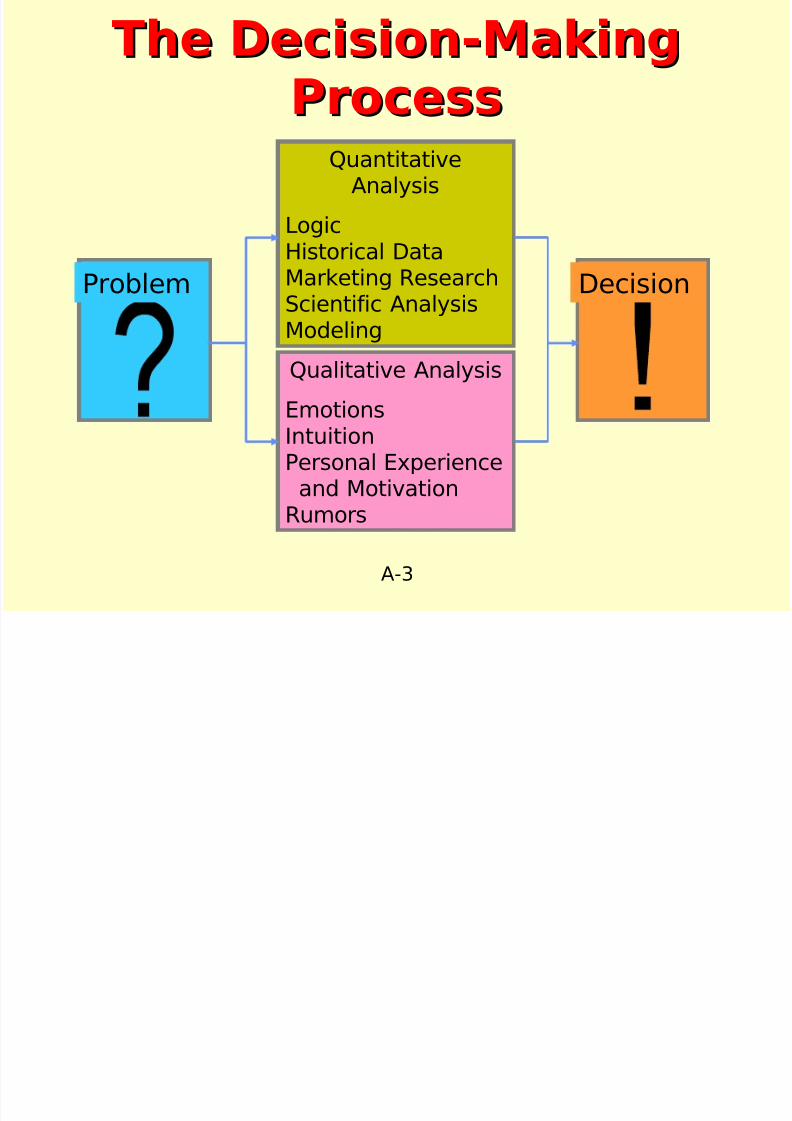
The Decision-MakingThe Decision-Making
ProcessProcess
Problem Decision
QuantitativeAnalysis
LogicHistorical Data
Marketing ResearchScientific AnalysisModeling
Qualitative Analysis
EmotionsIntuitionPersonal Experienceand Motivation
Rumors
7/31/2019 WK2 Decision Analysis
http://slidepdf.com/reader/full/wk2-decision-analysis 4/42
A-4
Models and ScientificModels and Scientific
ManagementManagement
♦ Can Help Managers toCan Help Managers to:
♦Gain deeper insights into the
business.♦Make better decisions!
♦Better assess alternative plans
and actions.
♦Quantify, reduce andunderstand the uncertainty
surrounding business plansand actions.
7/31/2019 WK2 Decision Analysis
http://slidepdf.com/reader/full/wk2-decision-analysis 5/42
A-5
Steps to GoodSteps to Good
DecisionsDecisions♦Define problem and influencing
factors.
♦ Establish decision criteria.
♦Select decision-making tool(model).
♦ Identify and evaluatealternatives using decision-making tool (model).
♦Select best alternative.
♦ Implement decision.
7/31/2019 WK2 Decision Analysis
http://slidepdf.com/reader/full/wk2-decision-analysis 6/42
A-6
Benefits of ModelsBenefits of Models
♦Allow better and fasterdecisions.
♦ Less expensive and disruptive
than experimenting with the realworld system.
♦Allow managers to ask “What
if…?” questions.♦ Force a consistent and
systematic approach to the
analysis of problems.♦
7/31/2019 WK2 Decision Analysis
http://slidepdf.com/reader/full/wk2-decision-analysis 7/42
A-7
Limitations of ModelsLimitations of Models
♦May be expensive and time-consuming to develop and test.
♦May be unused, misused ormisunderstood (and feared!).
♦ Due to mathematical and logicalcomplexity.
♦May downplay the value of qualitative information.
♦May use assumptions that
oversimplify the real world.
7/31/2019 WK2 Decision Analysis
http://slidepdf.com/reader/full/wk2-decision-analysis 8/42
A-8
Decision TheoryDecision Theory
Terms:
Alternative: Course of action orchoice.
Decision-maker chooses amongalternatives.
State of nature: An occurrenceover which the decision maker
has no control .
7/31/2019 WK2 Decision Analysis
http://slidepdf.com/reader/full/wk2-decision-analysis 9/42
A-9
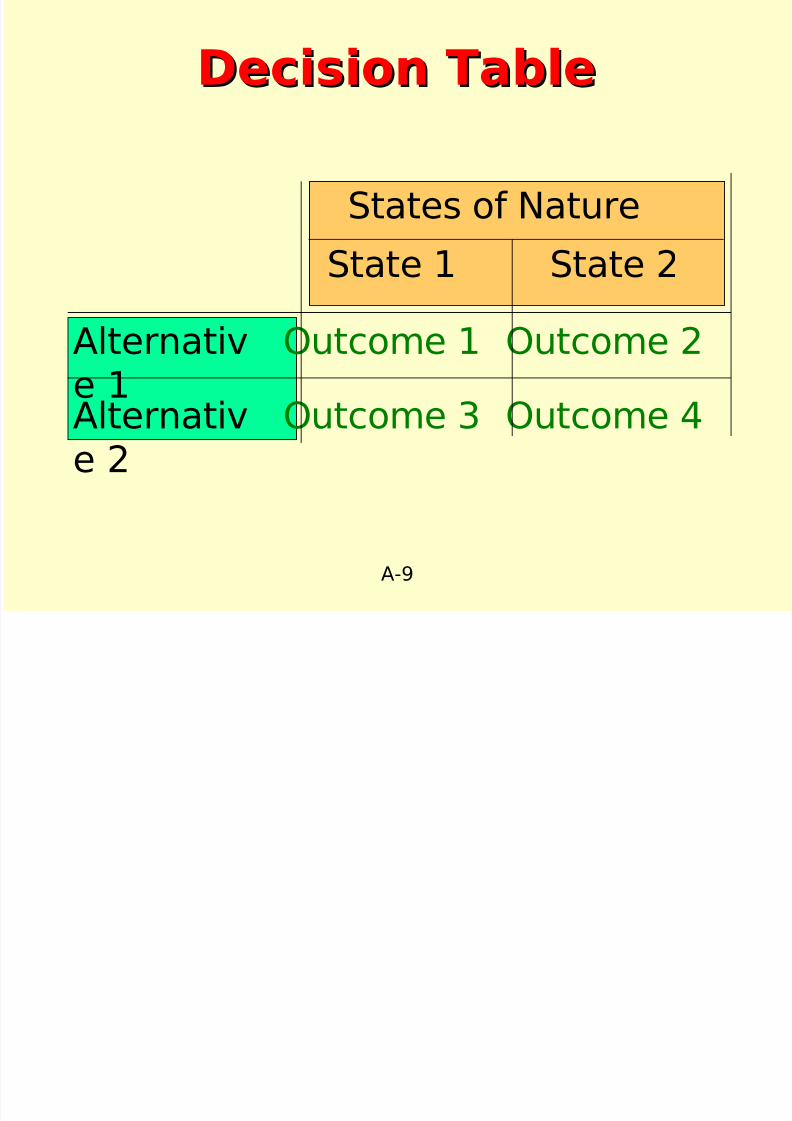
Decision TableDecision Table
States of Nature
State 1 State 2
Alternative 1
Outcome 1 Outcome 2
Alternative 2
Outcome 3 Outcome 4
7/31/2019 WK2 Decision Analysis
http://slidepdf.com/reader/full/wk2-decision-analysis 10/42
A-10
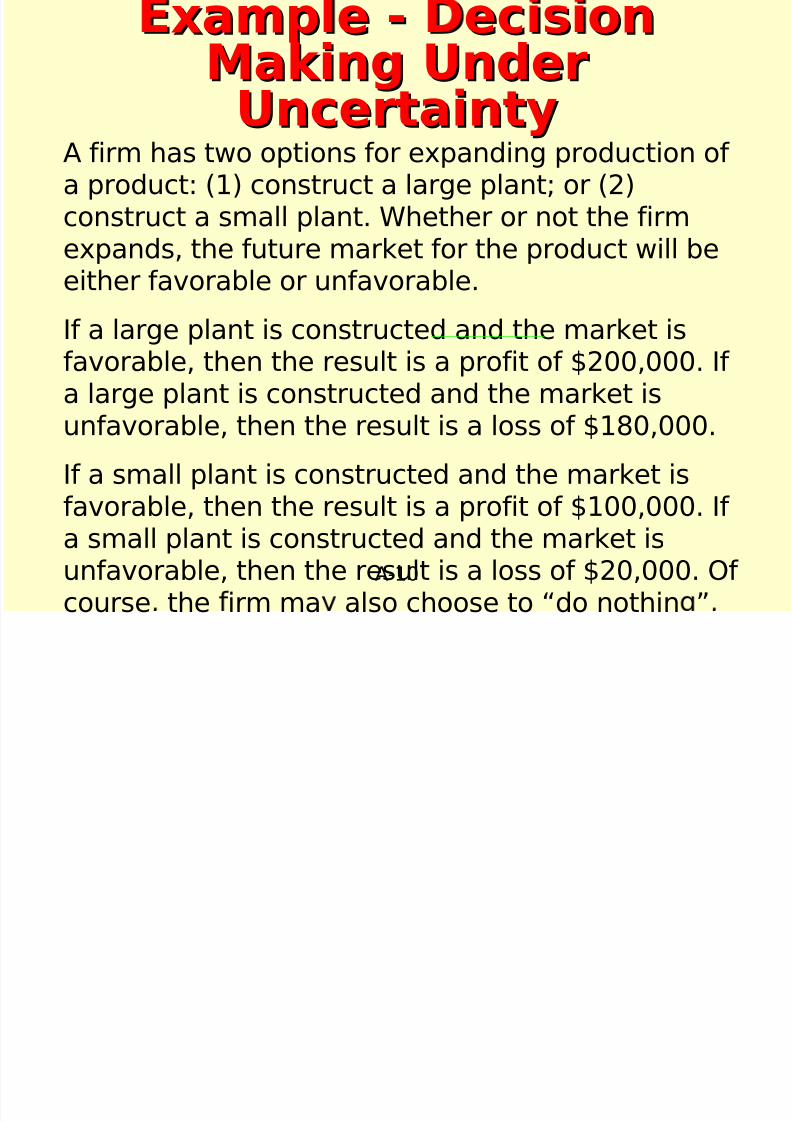
A firm has two options for expanding production of a product: (1) construct a large plant; or (2)construct a small plant. Whether or not the firmexpands, the future market for the product will be
either favorable or unfavorable.
If a large plant is constructed and the market isfavorable, then the result is a profit of $200,000. If a large plant is constructed and the market is
unfavorable, then the result is a loss of $180,000.
If a small plant is constructed and the market isfavorable, then the result is a profit of $100,000. If a small plant is constructed and the market isunfavorable, then the result is a loss of $20,000. Of course the irm ma also choose to “do nothin ”
xamp e - ec s onxamp e - ec s onMaking UnderMaking UnderUncertaintyUncertainty
xamp e ec s onxamp e ec s on
7/31/2019 WK2 Decision Analysis
http://slidepdf.com/reader/full/wk2-decision-analysis 11/42
A-11
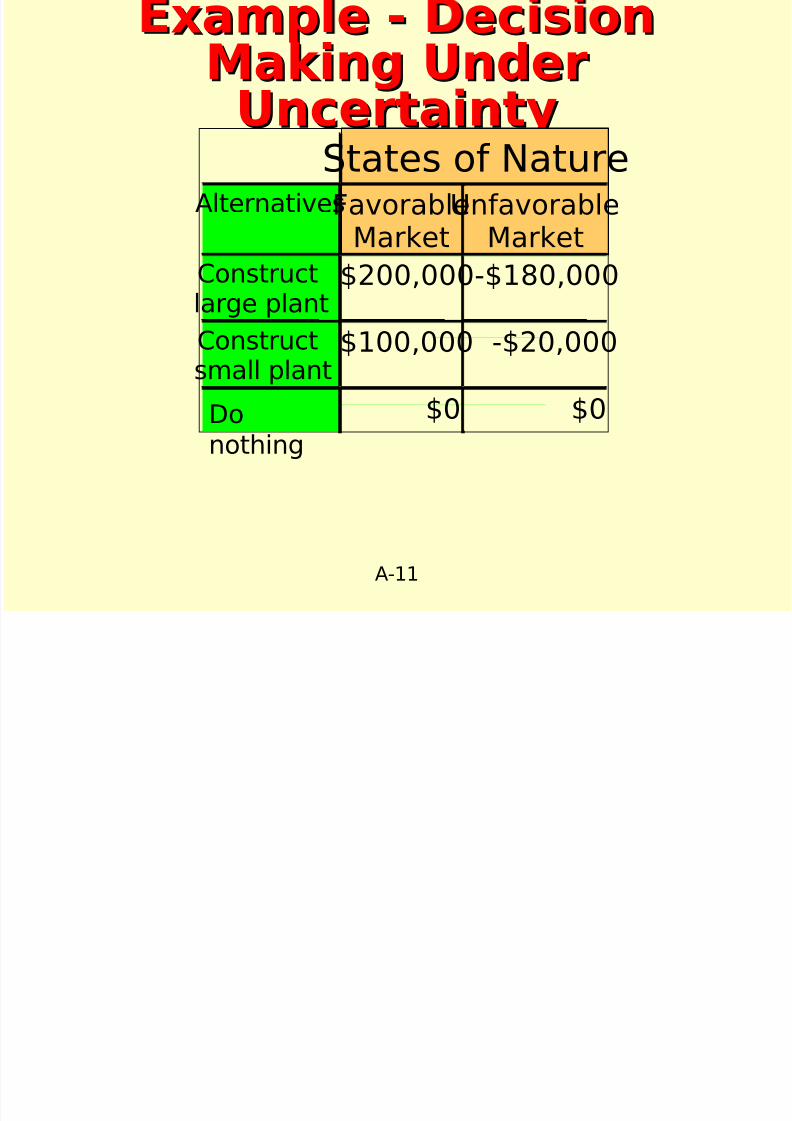
xamp e - ec s onxamp e - ec s onMaking UnderMaking UnderUncertaintyUncertainty
States of NatureAlternativesFavorable
MarketUnfavorable
Market
Constructlarge plant $200,000-$180,000
Constructsmall plant
$100,000 -$20,000
$0 $0Donothing
7/31/2019 WK2 Decision Analysis
http://slidepdf.com/reader/full/wk2-decision-analysis 12/42
A-12
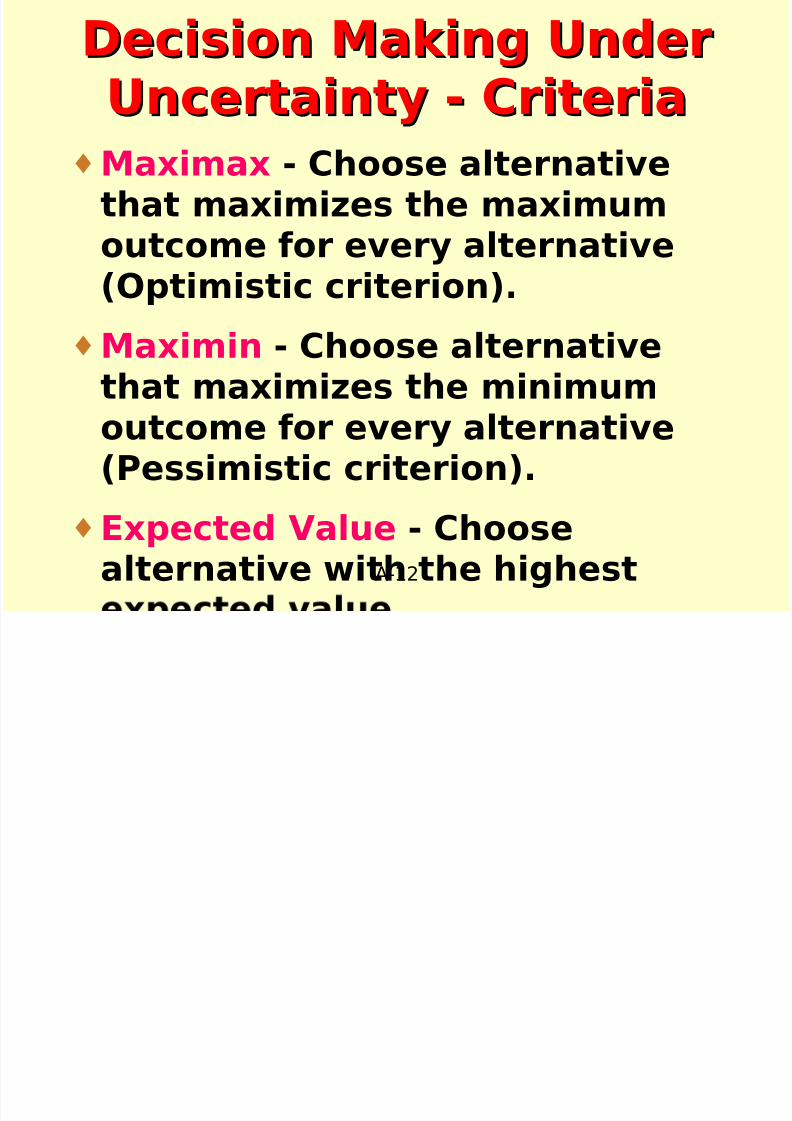
Decision Making UnderDecision Making Under
Uncertainty - CriteriaUncertainty - Criteria♦Maximax - Choose alternative
that maximizes the maximumoutcome for every alternative
(Optimistic criterion).
♦Maximin - Choose alternativethat maximizes the minimum
outcome for every alternative(Pessimistic criterion).
♦Expected Value - Choose
alternative with the highest
7/31/2019 WK2 Decision Analysis
http://slidepdf.com/reader/full/wk2-decision-analysis 13/42
A-13
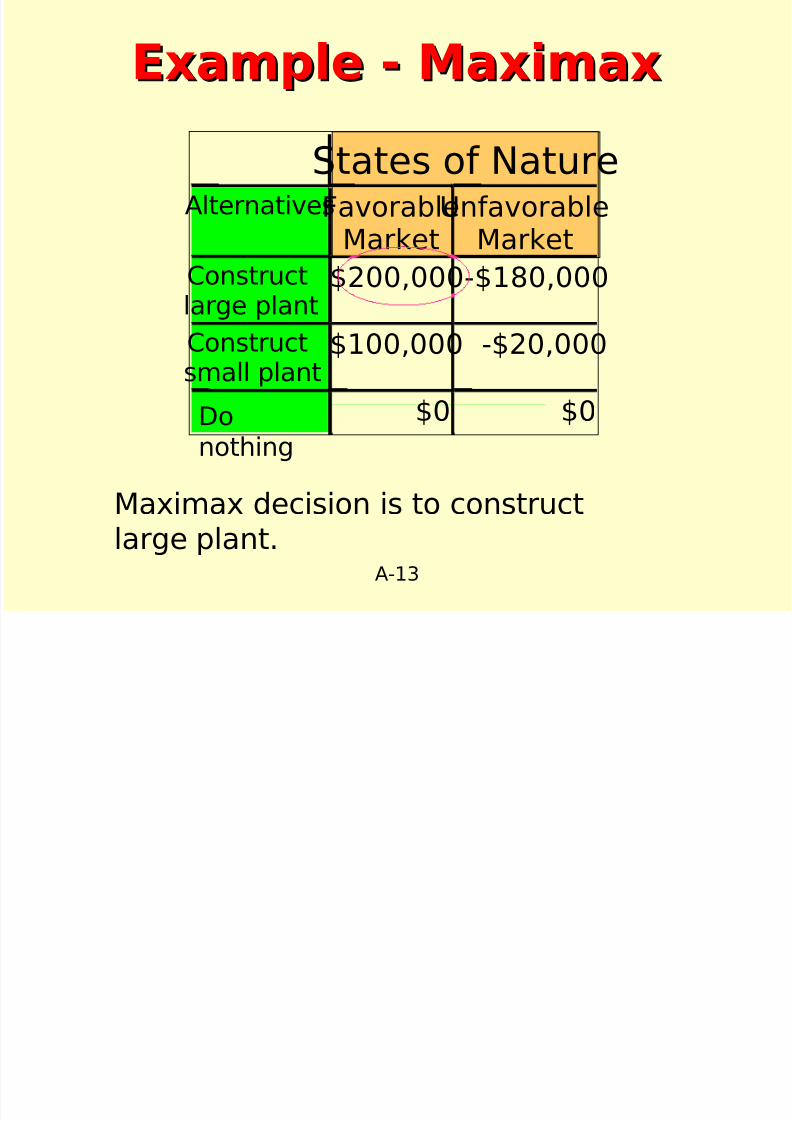
Example - MaximaxExample - Maximax
States of NatureAlternativesFavorable
MarketUnfavorable
Market
Constructlarge plant
$200,000-$180,000
Constructsmall plant
$100,000 -$20,000
$0 $0Donothing
Maximax decision is to constructlarge plant.
7/31/2019 WK2 Decision Analysis
http://slidepdf.com/reader/full/wk2-decision-analysis 14/42
A-14
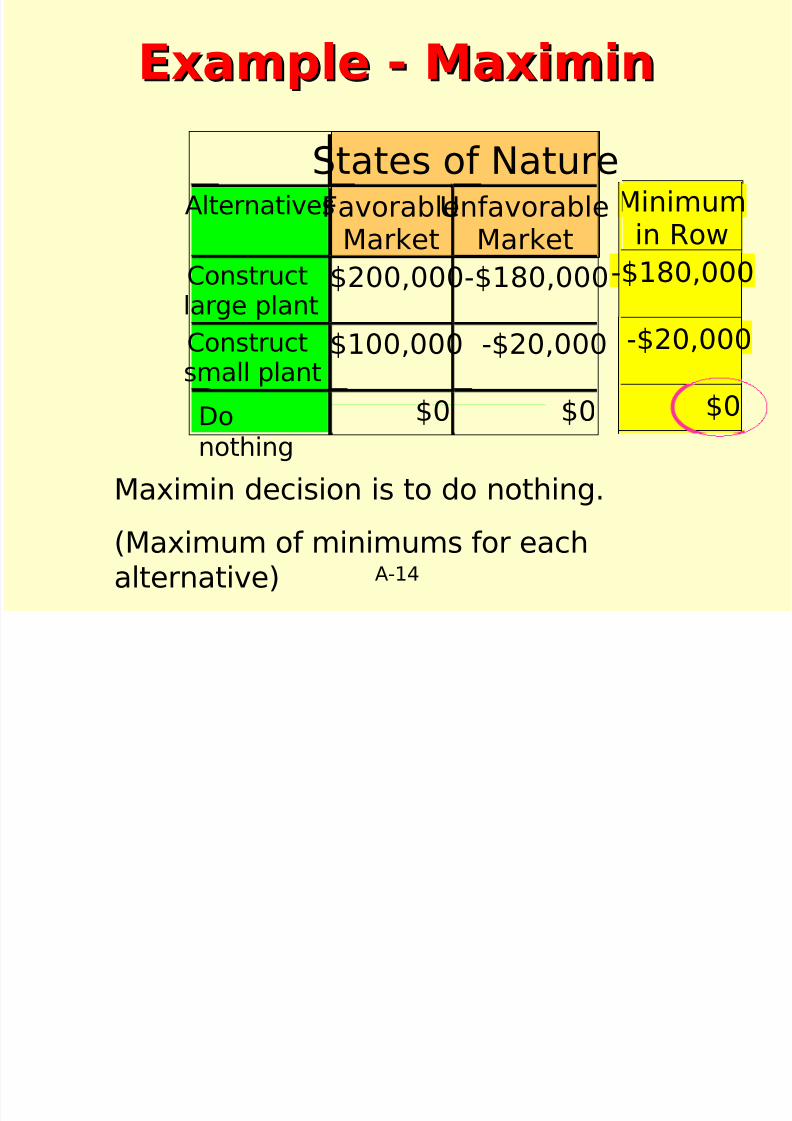
Example - MaximinExample - Maximin
Minimumin Row
-$180,000
-$20,000
$0
Maximin decision is to do nothing.
(Maximum of minimums for eachalternative)
States of NatureAlternativesFavorable
MarketUnfavorable
Market
Constructlarge plant
$200,000-$180,000
Constructsmall plant
$100,000 -$20,000
$0 $0Donothing
i i ki d
7/31/2019 WK2 Decision Analysis
http://slidepdf.com/reader/full/wk2-decision-analysis 15/42
A-15
♦Probabilistic decisionsituation.
♦States of nature have
probabilities of occurrence.
♦Select alternative with largestexpected value (EV).
♦ EV = Average return for alternativeif decision were repeated manytimes.
Decision Making UnderDecision Making Under
Risk Risk
7/31/2019 WK2 Decision Analysis
http://slidepdf.com/reader/full/wk2-decision-analysis 16/42
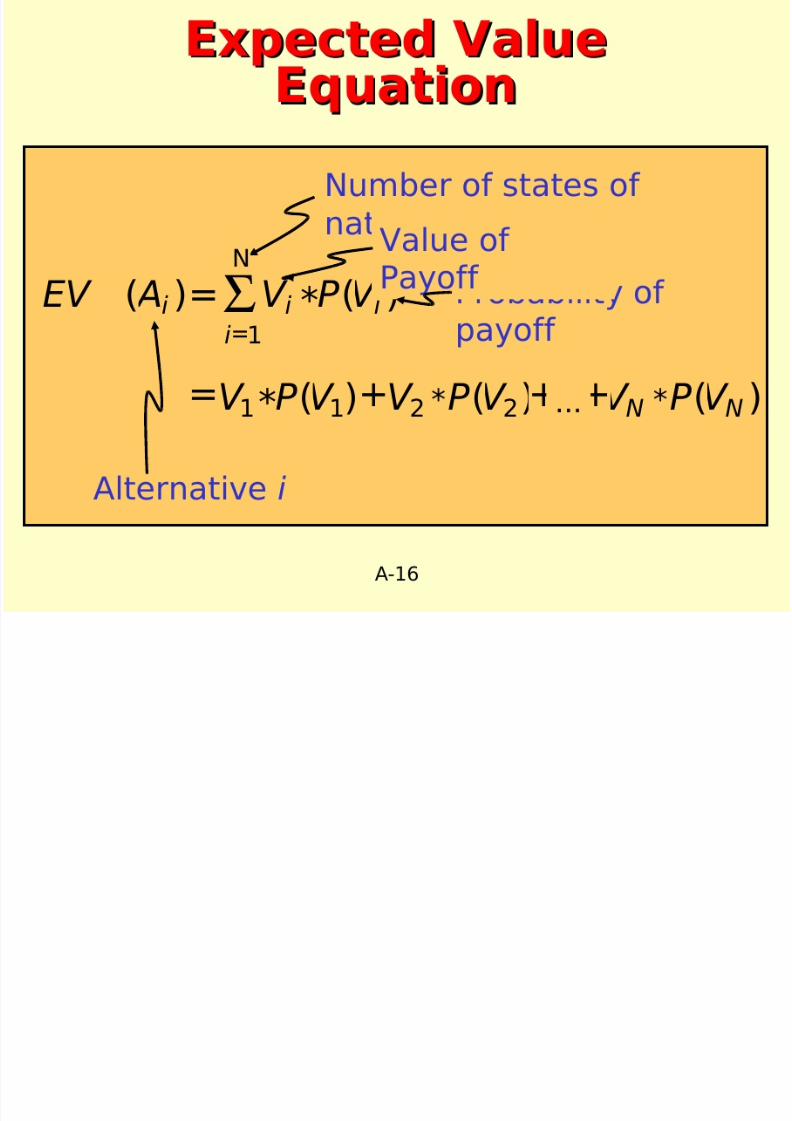
E l E t dExample Expected
7/31/2019 WK2 Decision Analysis
http://slidepdf.com/reader/full/wk2-decision-analysis 17/42
A-17
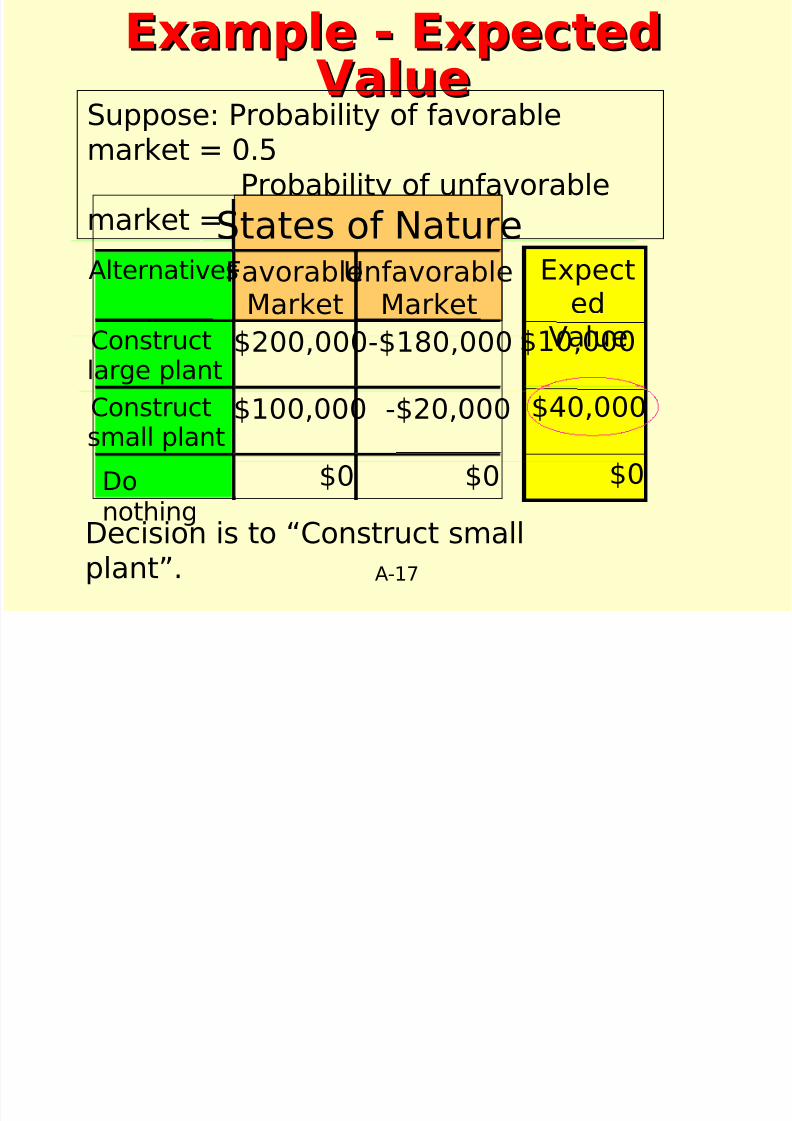
Example - ExpectedExample - ExpectedValueValue
Suppose: Probability of favorable
market = 0.5Probability of unfavorable
market = 0.5States of Nature
AlternativesFavorableMarketUnfavorableMarket
Constructlarge plant
$200,000-$180,000
Constructsmall plant $100,000 -$20,000
$0 $0Donothing
ExpectedValue$10,000
$40,000
$0
Decision is to “Construct small
plant”.
Example ExpectedExample Expected

7/31/2019 WK2 Decision Analysis
http://slidepdf.com/reader/full/wk2-decision-analysis 18/42
A-18
Example - ExpectedExample - ExpectedValueValue
Suppose: Probability of favorable
market = 0.7Probability of unfavorable
market = 0.3States of Nature
AlternativesFavorableMarketUnfavorableMarket
Constructlarge plant
$200,000-$180,000
Constructsmall plant $100,000 -$20,000
$0 $0Donothing
ExpectedValue$86,000
$64,000
$0
Now, decision is to “Construct largeplant”.
Example ExpectedExample Expected

7/31/2019 WK2 Decision Analysis
http://slidepdf.com/reader/full/wk2-decision-analysis 19/42
A-19
Example - ExpectedExample - ExpectedValueValue
Over what range of values for probability
of favorable market is “Construct largeplant” preferred?
Solve for x: 380000x-180000 >
120000x-20000
States of Nature
AlternativesFavorableMarketUnfavorableMarket
Constructlarge plant
$200,000-$180,000
Constructsmall plant $100,000 -$20,000
$0 $0Donothing
ExpectedValue
380,000x - 180,000
120,000x - 20,000
Example ExpectedExample Expected
7/31/2019 WK2 Decision Analysis
http://slidepdf.com/reader/full/wk2-decision-analysis 20/42
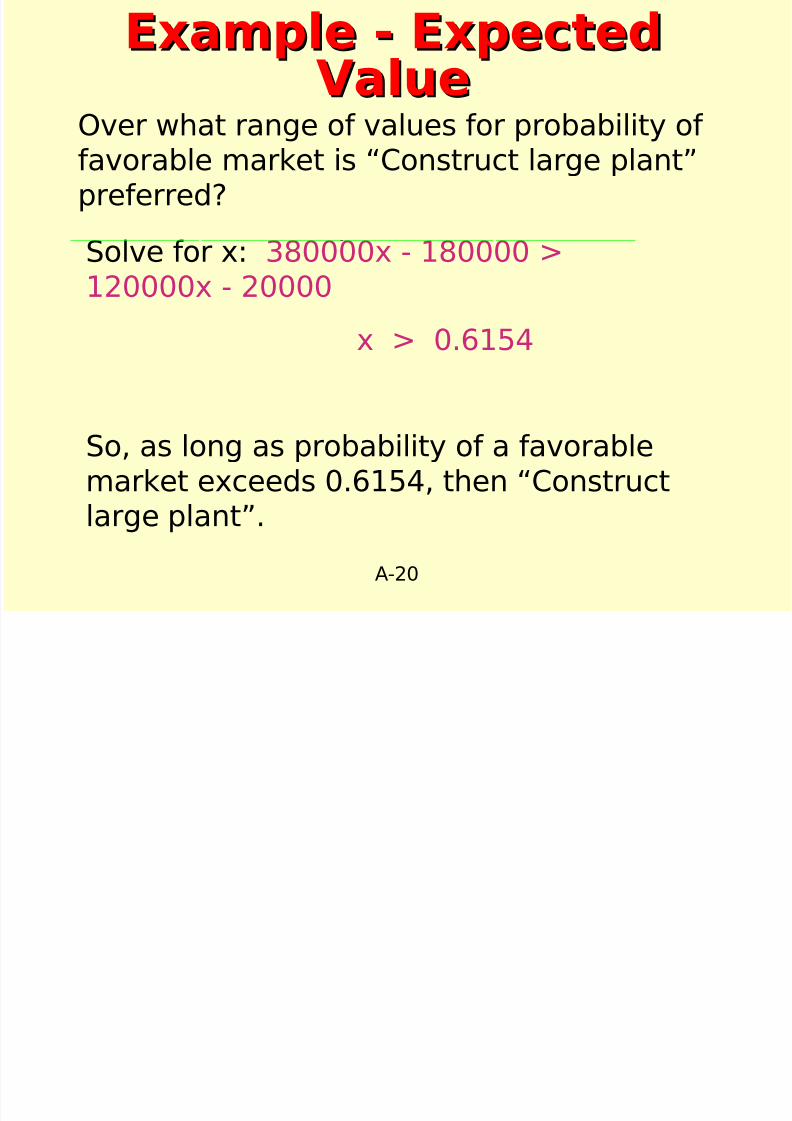
A-20
Solve for x: 380000x - 180000 >
120000x - 20000
x > 0.6154
So, as long as probability of a favorablemarket exceeds 0.6154, then “Constructlarge plant”.
Example - ExpectedExample - ExpectedValueValue
Over what range of values for probability of favorable market is “Construct large plant”preferred?
7/31/2019 WK2 Decision Analysis
http://slidepdf.com/reader/full/wk2-decision-analysis 21/42
A-21
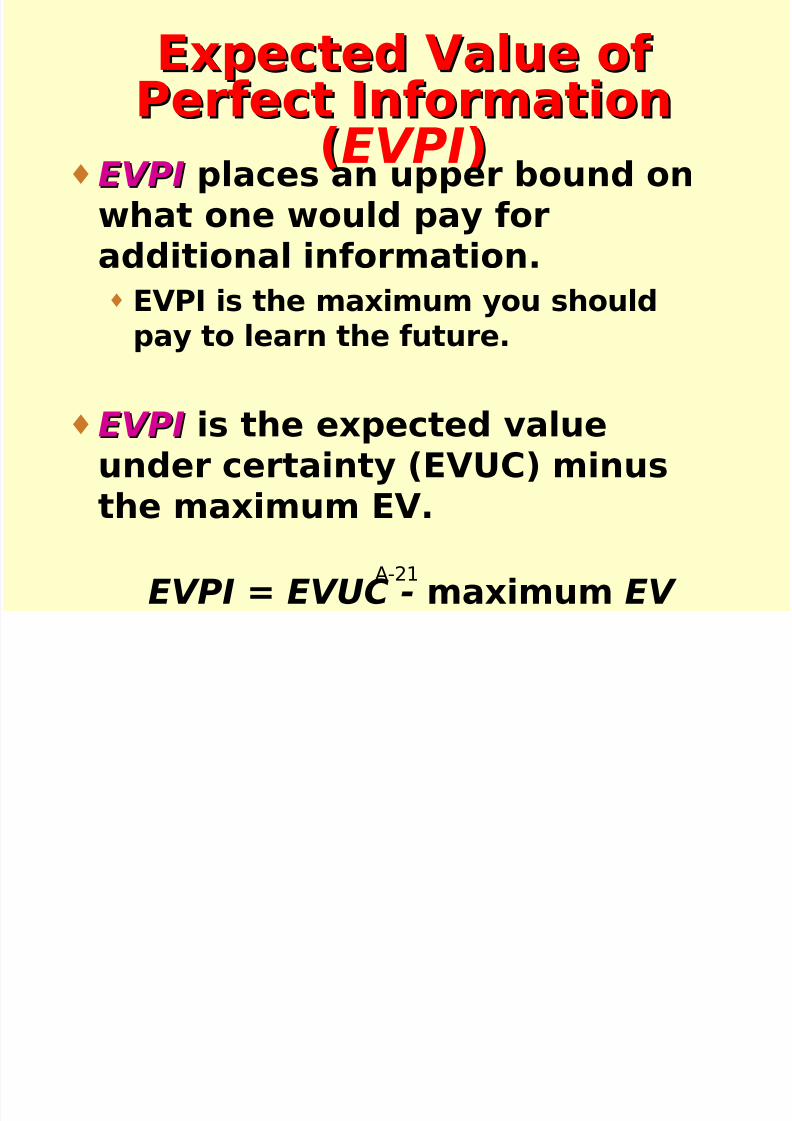
Expected Value of Expected Value of Perfect InformationPerfect Information
((EVPI))♦EVPIEVPI places an upper bound onwhat one would pay foradditional information.♦ EVPI is the maximum you should
pay to learn the future.
♦EVPIEVPI is the expected valueunder certainty (EVUC) minusthe maximum EV.
EVPI = EVUC - maximum EV
7/31/2019 WK2 Decision Analysis
http://slidepdf.com/reader/full/wk2-decision-analysis 22/42
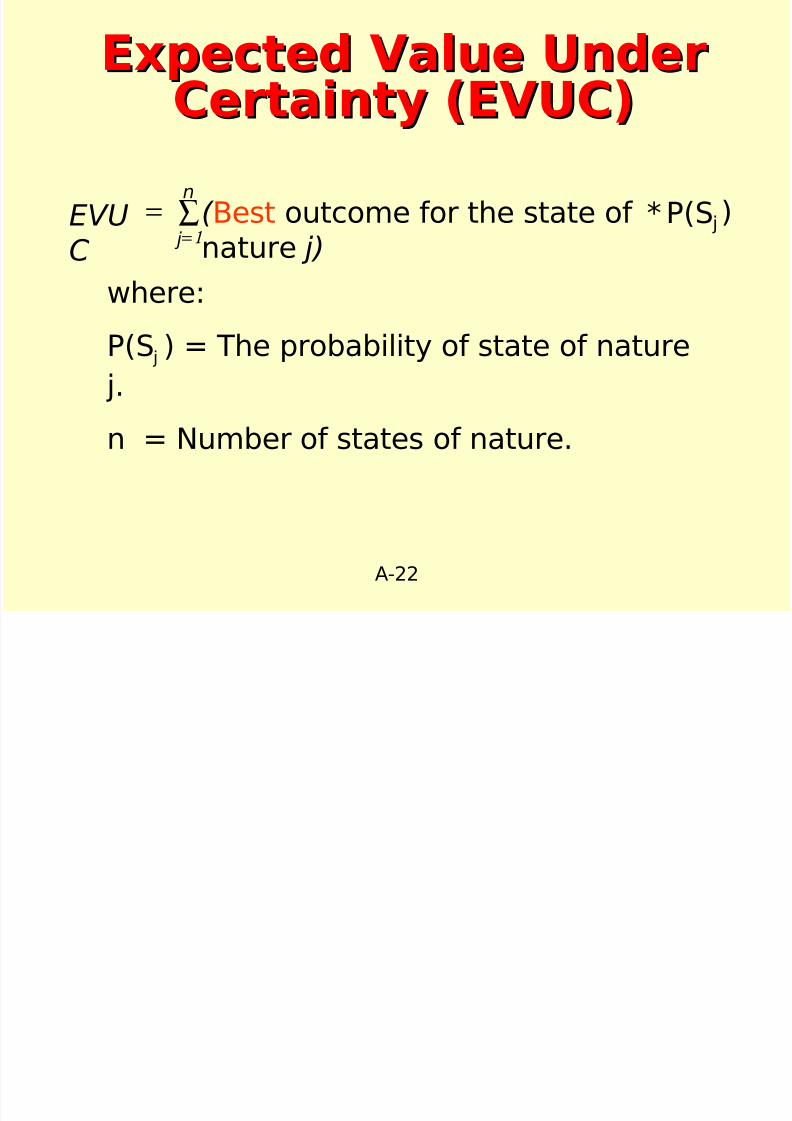
A-22
Expected Value UnderExpected Value UnderCertainty (EVUC)Certainty (EVUC)
)P(S* j∑==
EVUC
n
j 1
where:
P(S j ) = The probability of state of nature
j.
n = Number of states of nature.
( Best outcome for the state of nature j)
7/31/2019 WK2 Decision Analysis
http://slidepdf.com/reader/full/wk2-decision-analysis 23/42
A-23
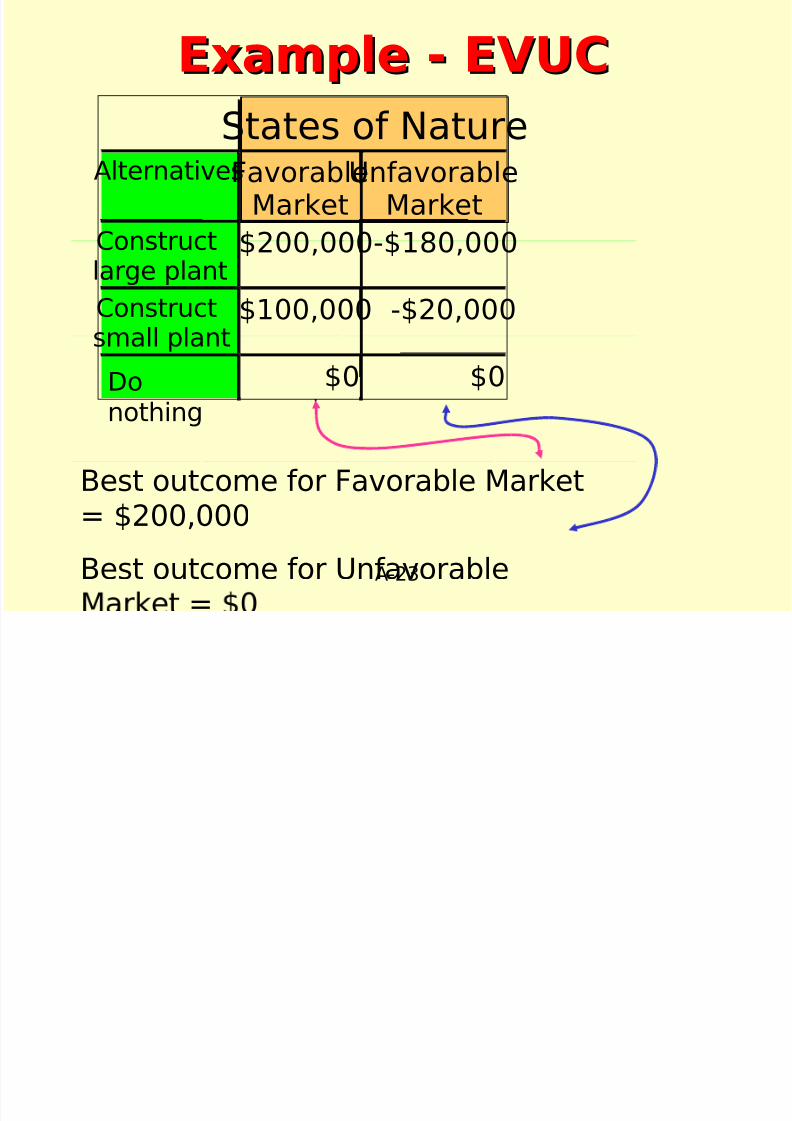
Example - EVUCExample - EVUC
Best outcome for Favorable Market= $200,000
Best outcome for Unfavorable=
States of NatureAlternativesFavorableMarket
UnfavorableMarket
Construct
large plant
$200,000-$180,000
Constructsmall plant
$100,000 -$20,000
$0 $0Do
nothing
d l f
7/31/2019 WK2 Decision Analysis
http://slidepdf.com/reader/full/wk2-decision-analysis 24/42
A-24
Expected Value of Expected Value of Perfect InformationPerfect Information
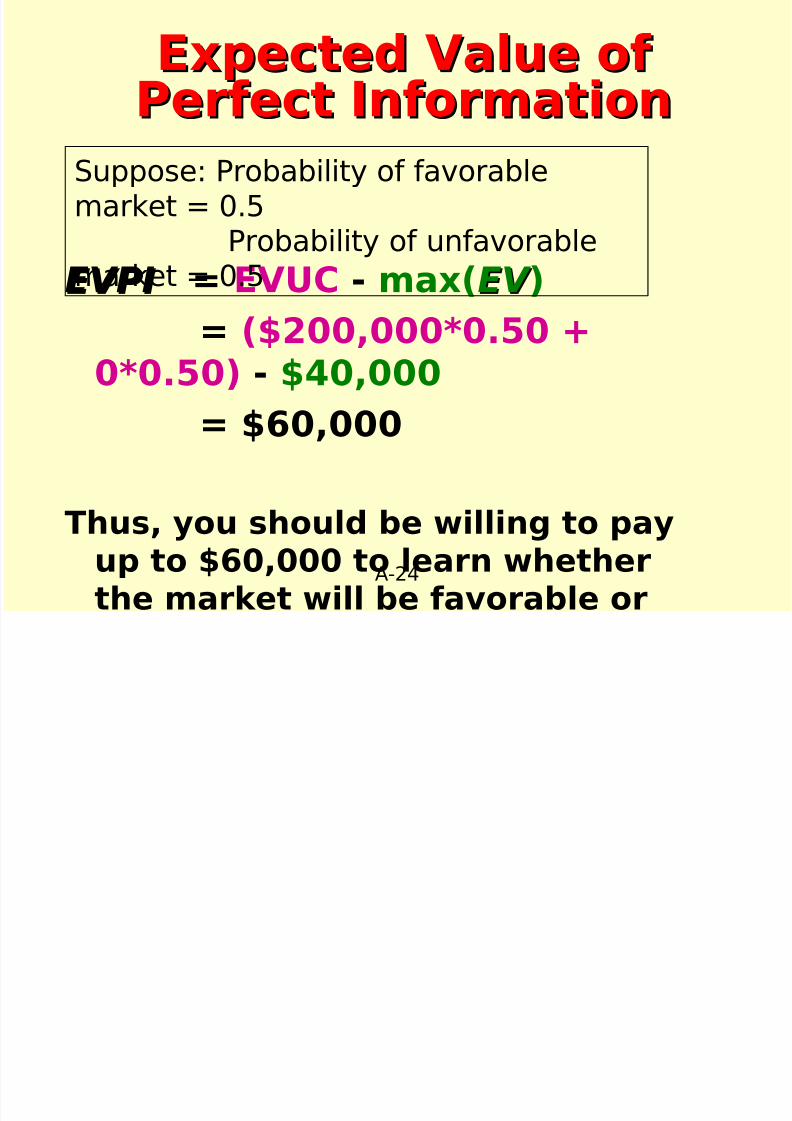
EVPIEVPI = EVUC - max(EV EV )= ($200,000*0.50 +
0*0.50) - $40,000
= $60,000
Thus, you should be willing to pay
up to $60,000 to learn whetherthe market will be favorable or
Suppose: Probability of favorablemarket = 0.5
Probability of unfavorable
market = 0.5
d l fE d V l f
7/31/2019 WK2 Decision Analysis
http://slidepdf.com/reader/full/wk2-decision-analysis 25/42
A-25
Expected Value of Expected Value of Perfect InformationPerfect Information
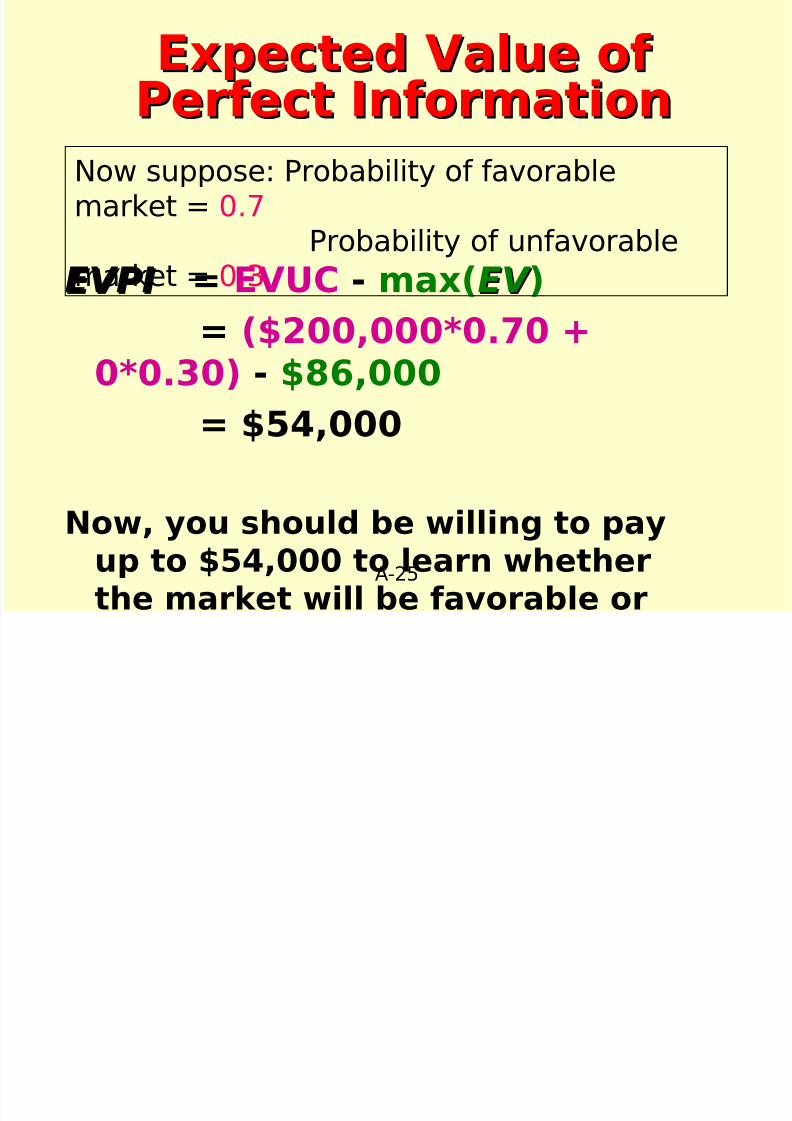
EVPIEVPI = EVUC - max(EV EV )= ($200,000*0.70 +
0*0.30) - $86,000
= $54,000
Now, you should be willing to pay
up to $54,000 to learn whetherthe market will be favorable or
Now suppose: Probability of favorablemarket = 0.7
Probability of unfavorable
market = 0.3
7/31/2019 WK2 Decision Analysis
http://slidepdf.com/reader/full/wk2-decision-analysis 26/42
A-26
♦Graphical display of decisionprocess.
♦Used for solving problems withseveral sets of alternatives andstates of nature (sequential
decisions).♦ Decision tables can not be used for
more than one decision.
♦ Expected Value criterion is used.
Decision TreesDecision Trees
7/31/2019 WK2 Decision Analysis
http://slidepdf.com/reader/full/wk2-decision-analysis 27/42
A-27
Using Decision TreesUsing Decision Trees
♦Define the problem.♦Draw the decision tree.
♦Assign probabilities to all statesof nature.
♦Estimate payoffs for eachcombination of alternatives and
states of nature.
♦Solve the problem:
♦ Compute expected values for each
state-of-nature node moving right
7/31/2019 WK2 Decision Analysis
http://slidepdf.com/reader/full/wk2-decision-analysis 28/42
A-28
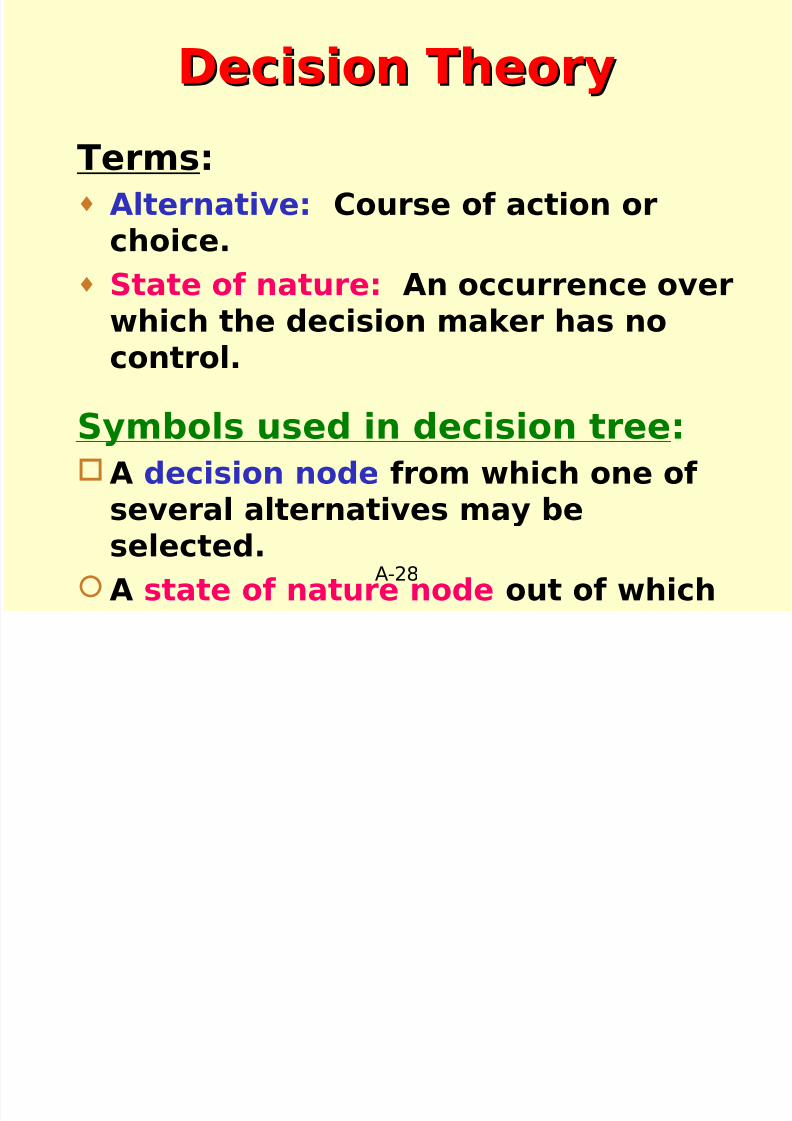
Decision TheoryDecision Theory
Terms:♦ Alternative: Course of action or
choice.
♦ State of nature: An occurrence overwhich the decision maker has nocontrol.
Symbols used in decision tree:A decision node from which one of
several alternatives may be
selected.A state of nature node out of which
7/31/2019 WK2 Decision Analysis
http://slidepdf.com/reader/full/wk2-decision-analysis 29/42
A-29
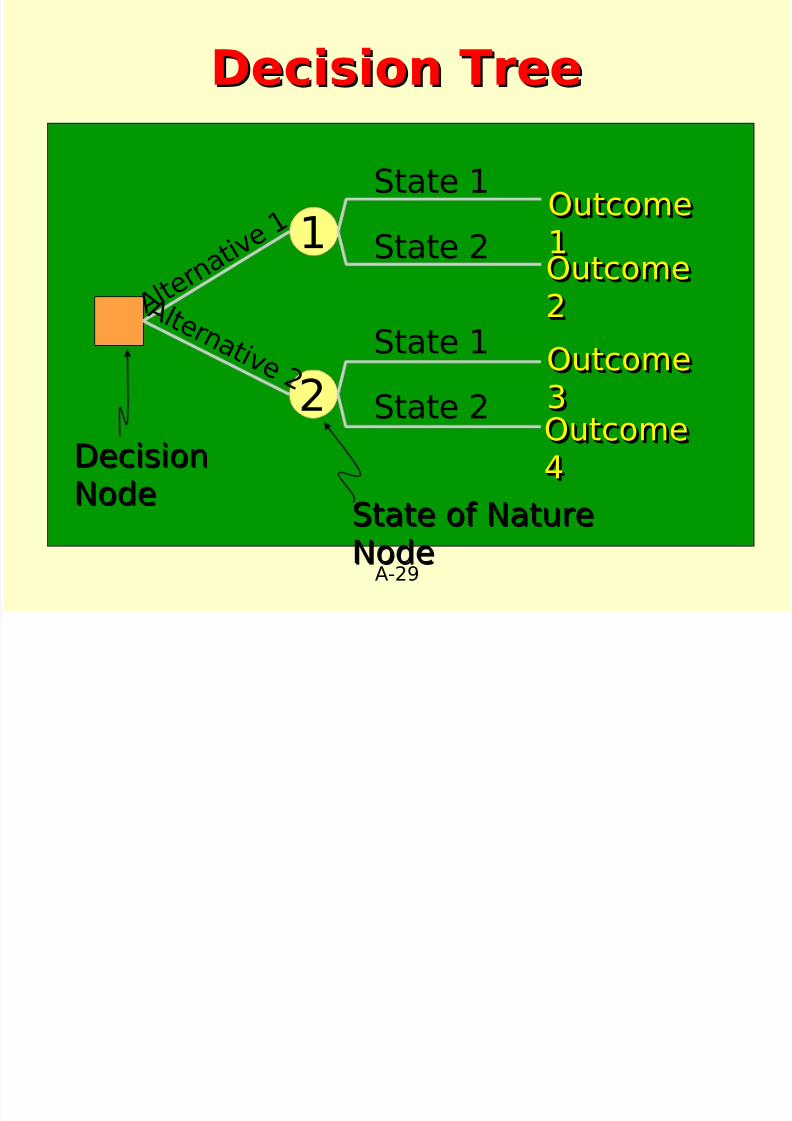
Decision TreeDecision Tree
1
2
State 1
State 2
State 1
State 2
A l t e r n a t i v
e 1
A l t e r n a t i v e 2
DecisionDecision
NodeNode
OutcomeOutcome
11OutcomeOutcome
11
OutcomeOutcome22OutcomeOutcome22
OutcomeOutcome
33OutcomeOutcome
33
OutcomeOutcome44OutcomeOutcome44
State of NatureState of Nature
NodeNode
Decision Tree forDecision Tree for
7/31/2019 WK2 Decision Analysis
http://slidepdf.com/reader/full/wk2-decision-analysis 30/42
A-30
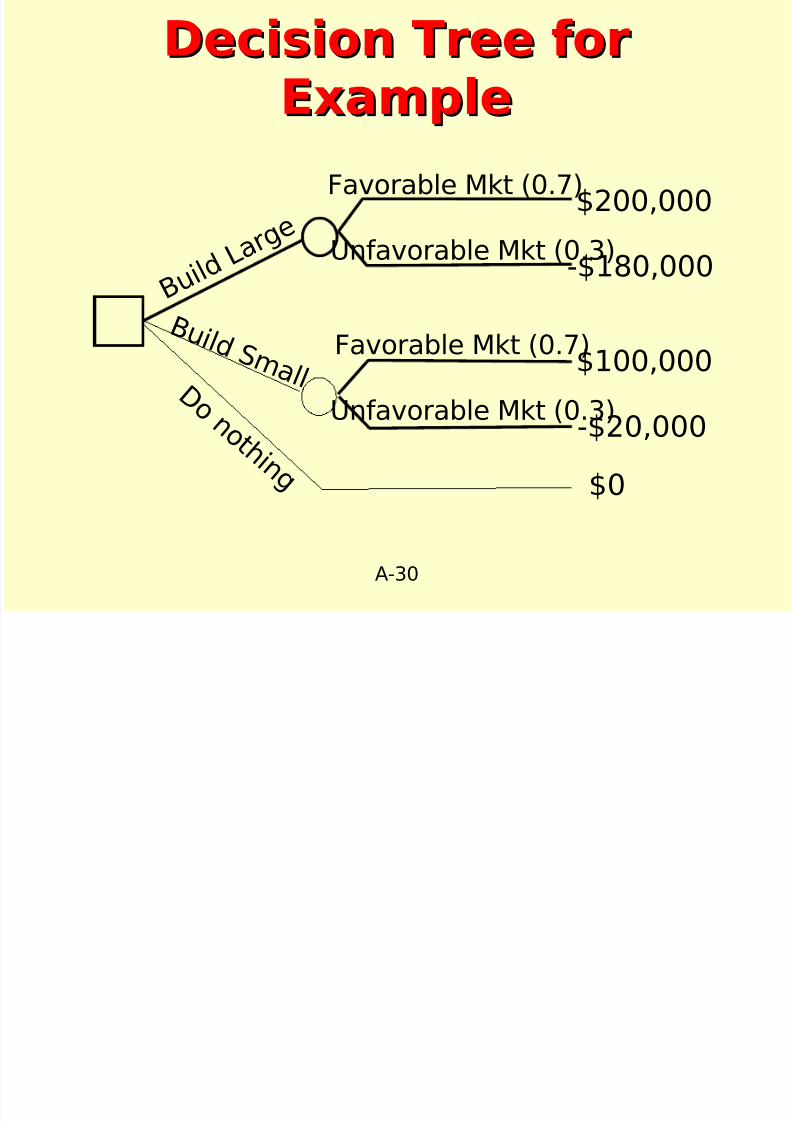
Decision Tree forDecision Tree for
ExampleExample
Favorable Mkt (0.7)
B u i l d
L a r g e
B u i l d S m a l l
Unfavorable Mkt (0.3)
$200,000
Favorable Mkt (0.7)
Unfavorable Mkt (0.3)
-$180,000
$100,000
-$20,000
$0
D o n o t h i n g
Decision Tree forDecision Tree for
7/31/2019 WK2 Decision Analysis
http://slidepdf.com/reader/full/wk2-decision-analysis 31/42
A-31
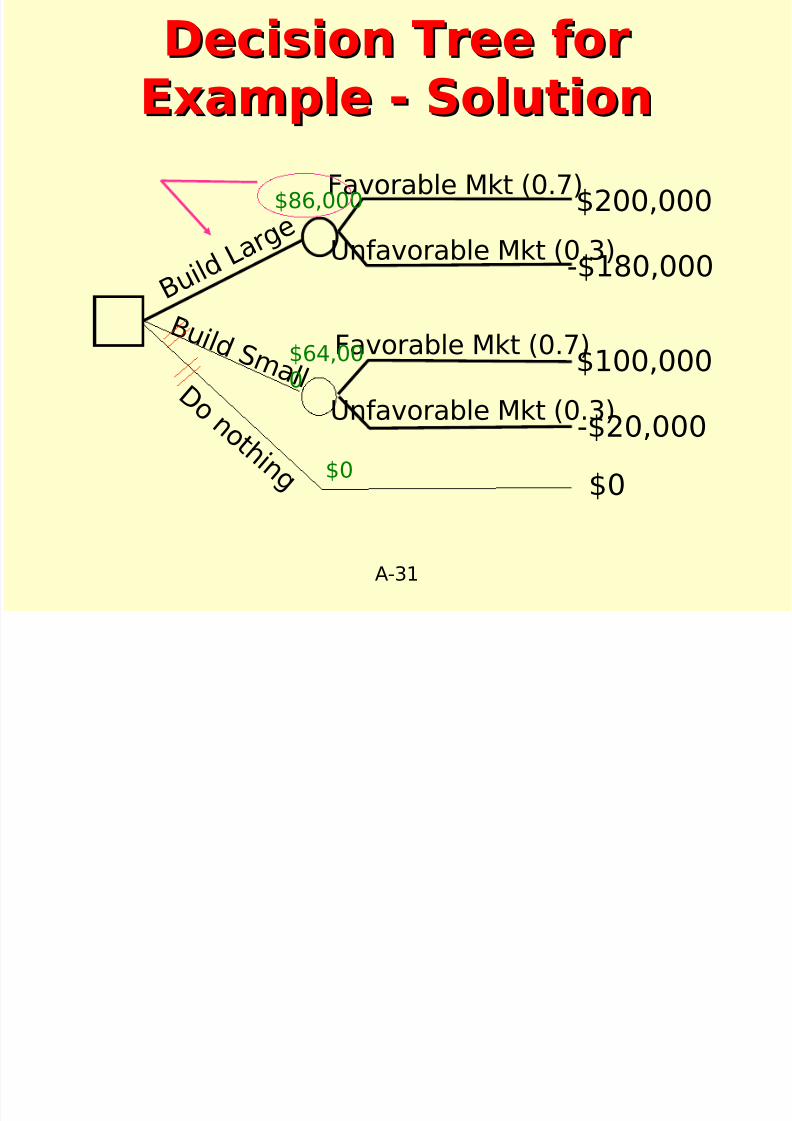
Decision Tree forDecision Tree for
Example - SolutionExample - Solution
Favorable Mkt (0.7)
B u i l d
L a r g e
B u i l d S m a l l
Unfavorable Mkt (0.3)
$200,000
Favorable Mkt (0.7)
Unfavorable Mkt (0.3)
-$180,000
$100,000
-$20,000
$0
D o n o t h i n g
$86,000
$64,000
$0
7/31/2019 WK2 Decision Analysis
http://slidepdf.com/reader/full/wk2-decision-analysis 32/42
A-32
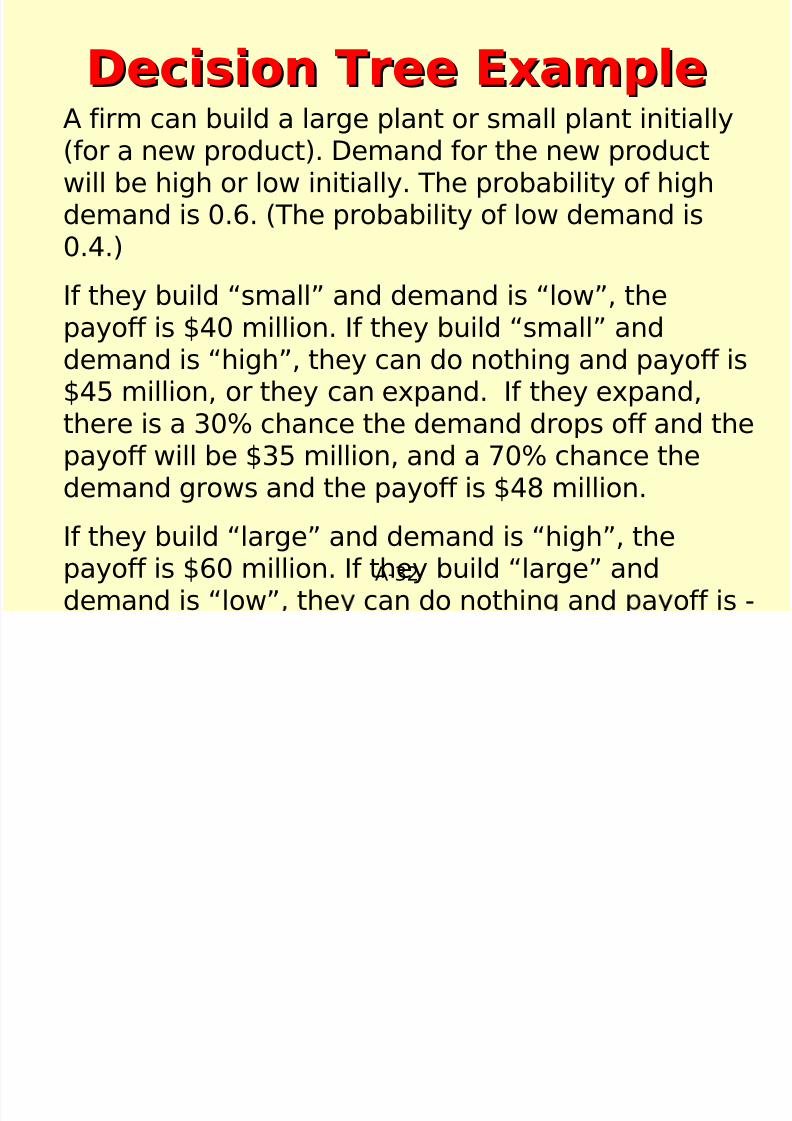
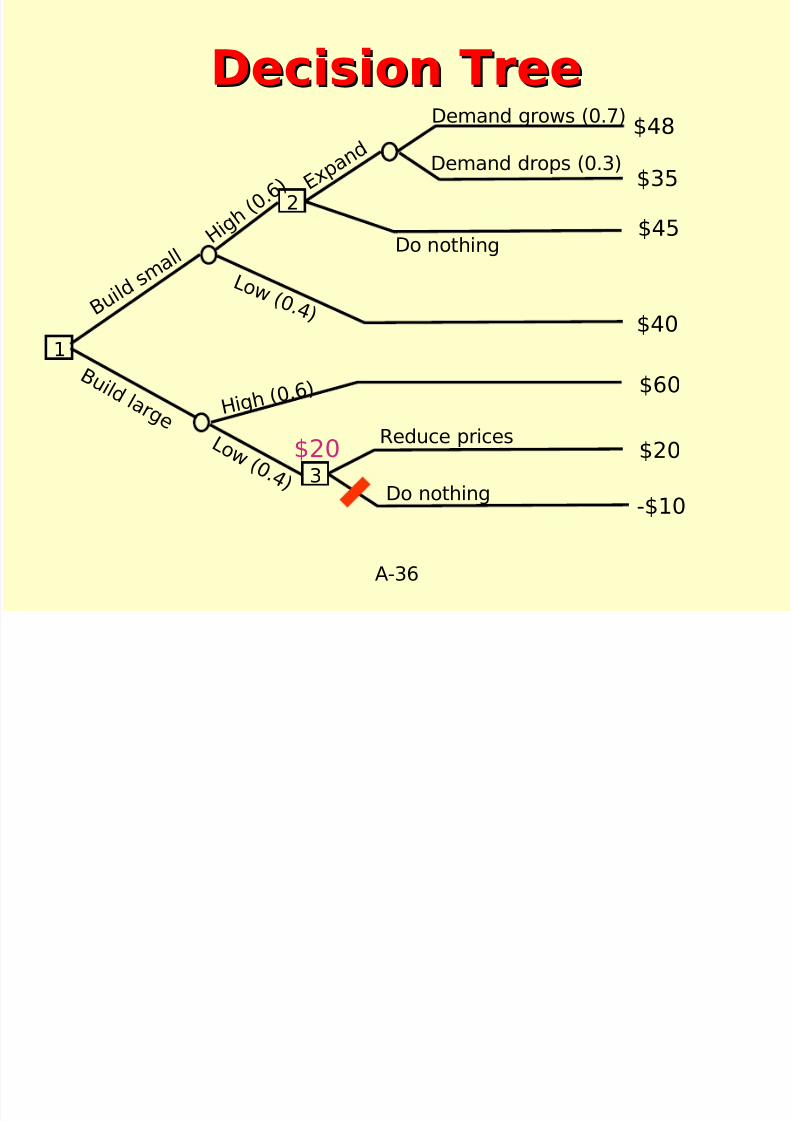
Decision Tree ExampleDecision Tree ExampleA firm can build a large plant or small plant initially
(for a new product). Demand for the new productwill be high or low initially. The probability of highdemand is 0.6. (The probability of low demand is0.4.)
If they build “small” and demand is “low”, thepayoff is $40 million. If they build “small” anddemand is “high”, they can do nothing and payoff is$45 million, or they can expand. If they expand,
there is a 30% chance the demand drops off and thepayoff will be $35 million, and a 70% chance thedemand grows and the payoff is $48 million.
If they build “large” and demand is “high”, the
payoff is $60 million. If they build “large” anddemand is “low” the can do nothin and a off is -
i i l
7/31/2019 WK2 Decision Analysis
http://slidepdf.com/reader/full/wk2-decision-analysis 33/42
A-33
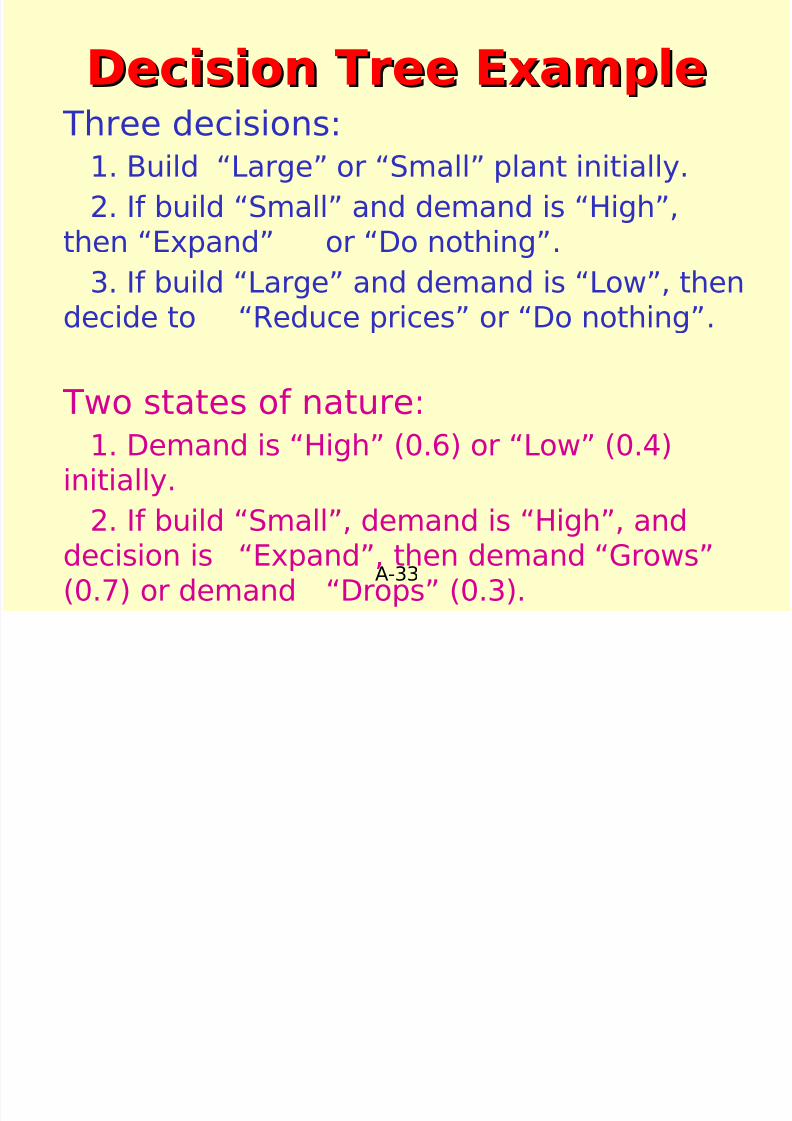
Decision Tree ExampleDecision Tree Example Three decisions:
1. Build “Large” or “Small” plant initially.
2. If build “Small” and demand is “High”,then “Expand” or “Do nothing”.
3. If build “Large” and demand is “Low”, thendecide to “Reduce prices” or “Do nothing”.
Two states of nature:
1. Demand is “High” (0.6) or “Low” (0.4)initially.
2. If build “Small”, demand is “High”, and
decision is “Expand”, then demand “Grows”(0.7) or demand “Drops” (0.3).
D i i T
7/31/2019 WK2 Decision Analysis
http://slidepdf.com/reader/full/wk2-decision-analysis 34/42
A-34
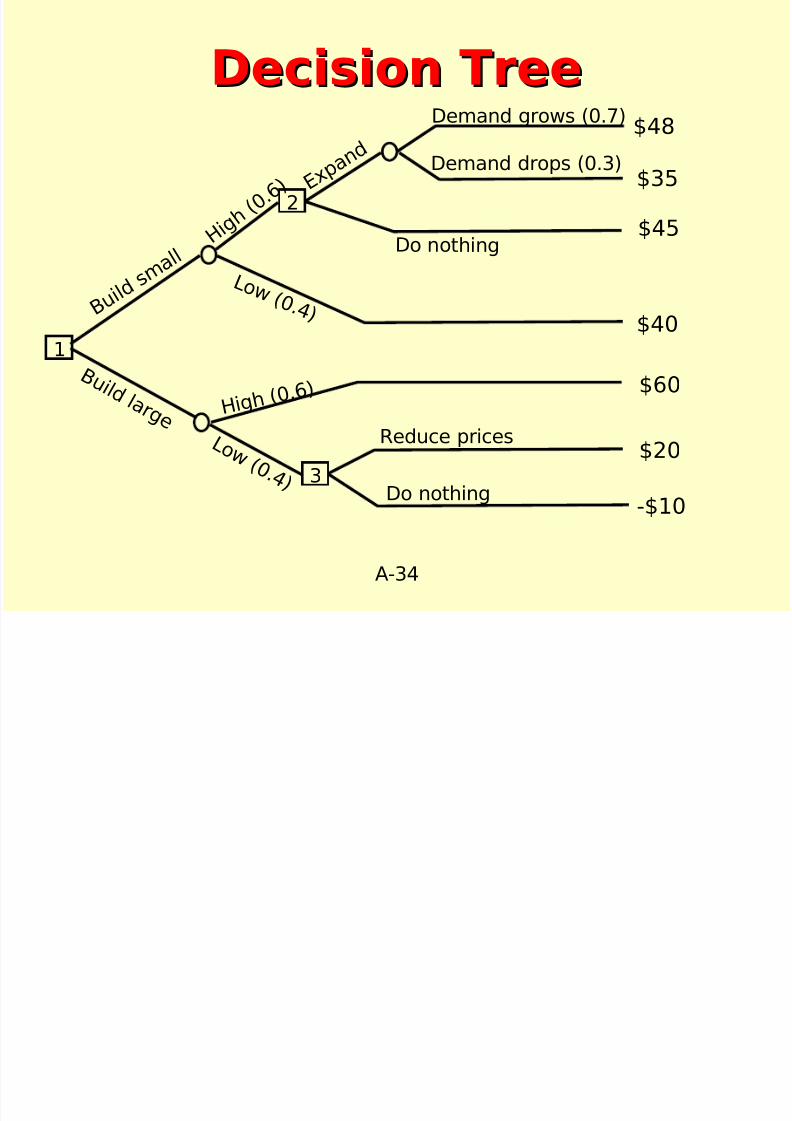
Decision TreeDecision Tree
B u i l d s m a
l l
B u i l d l a r g e
H i g h ( 0. 6 )
L o w ( 0 .4 )
H i g h
( 0. 6 )
L o w ( 0 .4 )
E x p a n d
Do nothing
Do nothing
Reduce prices
Demand grows (0.7)
Demand drops (0.3)
$48
$35
$45
$40
$60
$20
-$10
1
3
2
i i S l iD i i T S l ti
7/31/2019 WK2 Decision Analysis
http://slidepdf.com/reader/full/wk2-decision-analysis 35/42
A-35
Decision Tree SolutionDecision Tree Solution
Work right to left (from end back tobeginning).
Start with Decision 3:“Reduce prices” or “Do nothing”.
Choose “Reduce prices” (20 >
-10).
D i i TD i i T
7/31/2019 WK2 Decision Analysis
http://slidepdf.com/reader/full/wk2-decision-analysis 36/42
A-36
Decision TreeDecision Tree
B u i l d s m a
l l
B u i l d l a r g e
H i g h ( 0. 6 )
L o w ( 0 .4 )
H i g h
( 0. 6 )
L o w ( 0 .4 )
E x p a n d
Do nothing
Do nothing
Reduce prices
Demand grows (0.7)
Demand drops (0.3)
$48
$35
$45
$40
$60
$20
-$10
1
3
2
$20
D i i T S l tiD i i T S l ti

7/31/2019 WK2 Decision Analysis
http://slidepdf.com/reader/full/wk2-decision-analysis 37/42
A-37
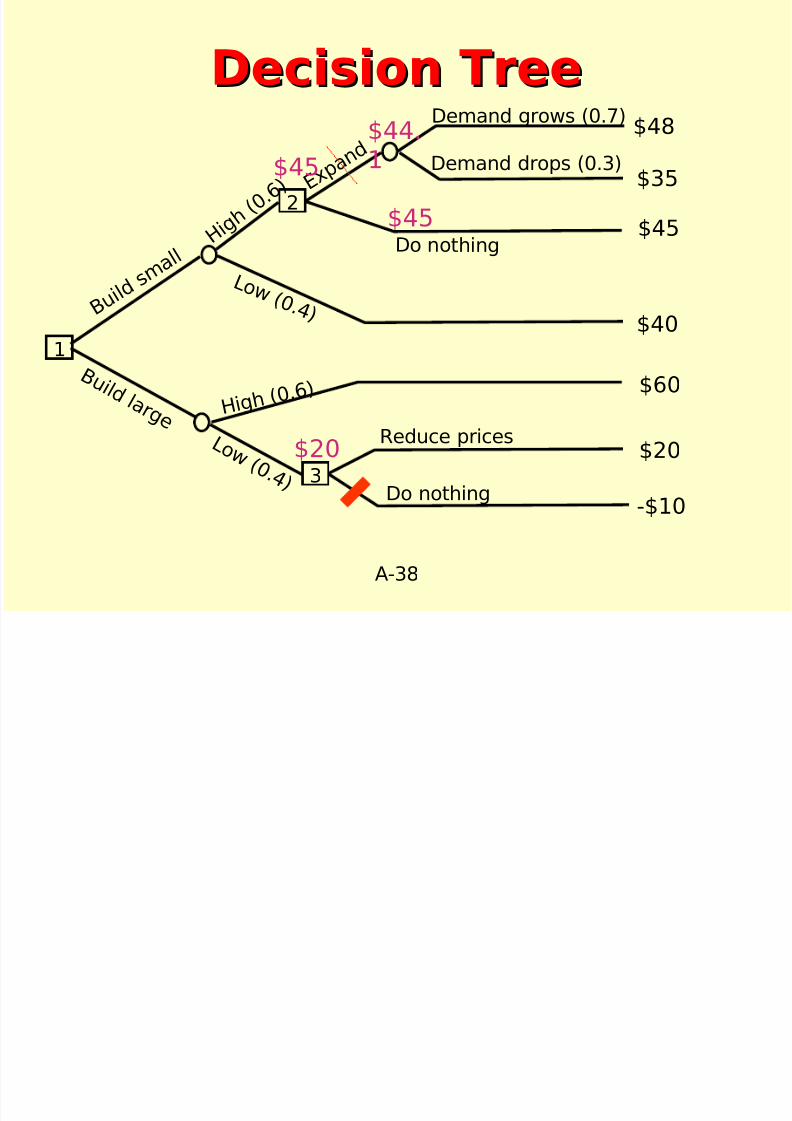
Decision Tree SolutionDecision Tree Solution
Consider Decision 2: “Expand” or “Donothing”.
To compare outcomes we needexpected value if we “Expand”:(48*0.7) + (35*0.3) = 44.1
Choose “Do nothing” (45 > 44.1).
D i i TD i i T
7/31/2019 WK2 Decision Analysis
http://slidepdf.com/reader/full/wk2-decision-analysis 38/42
A-38
Decision TreeDecision Tree
B u i l d s m a
l l
B u i l d l a r g e
H i g h ( 0. 6 )
L o w ( 0 .4 )
H i g h
( 0. 6 )
L o w ( 0 .4 )
E x p a n d
Do nothing
Do nothing
Reduce prices
Demand grows (0.7)
Demand drops (0.3)
$48
$35
$45
$40
$60
$20
-$10
1
3
2
$44.
1
$45
$20
$45
D i i TD i i T
7/31/2019 WK2 Decision Analysis
http://slidepdf.com/reader/full/wk2-decision-analysis 39/42
A-39
Decision TreeDecision Tree
B u i l d s
m a l l
B u i l d l a r g e
H i g h ( 0. 6 )
L o w ( 0 .4 )
H i g h
( 0. 6 )
L o w ( 0 .4 )
E x p a n d
Do nothing
Do nothing
Reduce prices
Demand grows (0.7)
Demand drops (0.3)
$48
$35
$45
$40
$60
$20
-$10
1
3
2
$44.
1
$45
$20
$45
$44
$43
Decision Tree FinalDecision Tree Final
7/31/2019 WK2 Decision Analysis
http://slidepdf.com/reader/full/wk2-decision-analysis 40/42
A-40
SolutionSolution
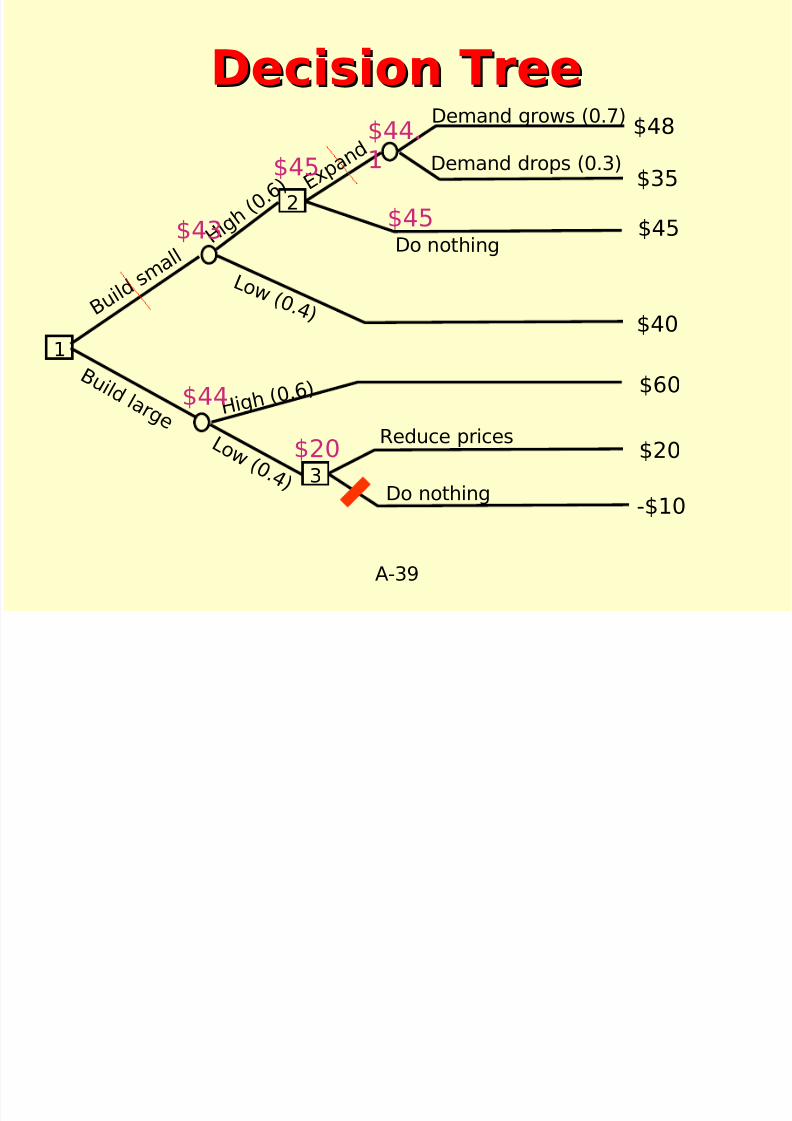
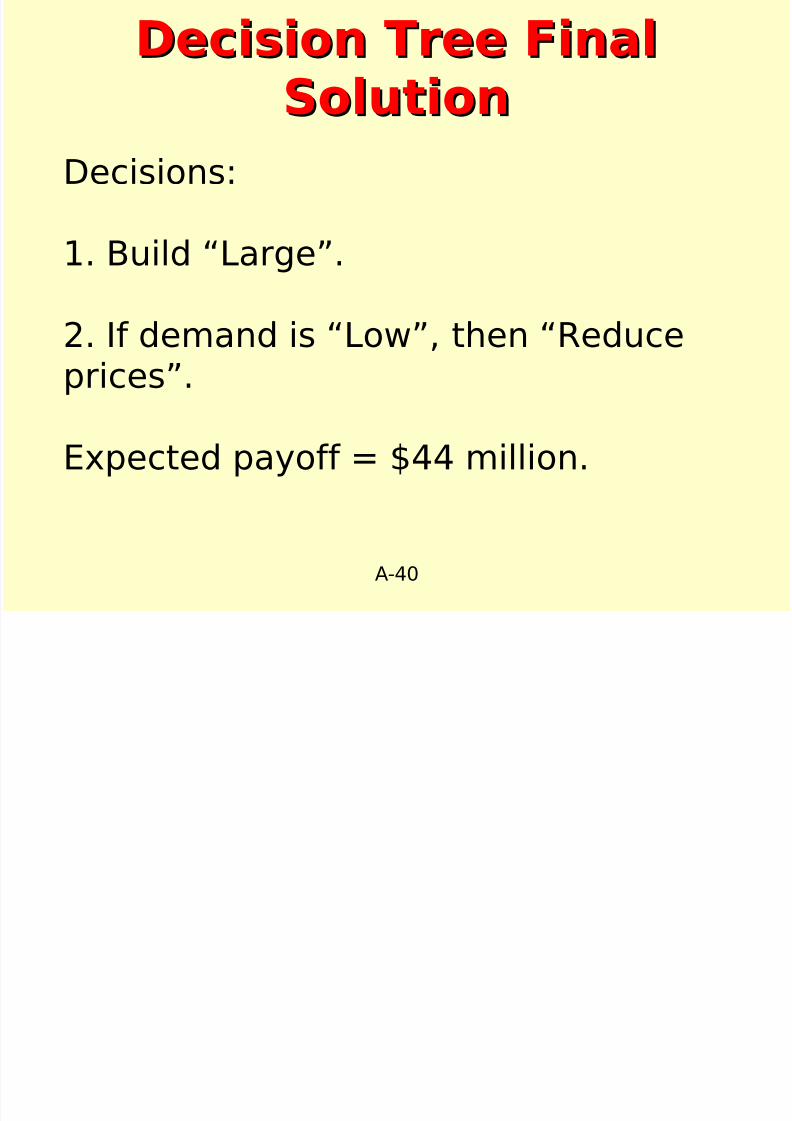
Decisions:
1. Build “Large”.
2. If demand is “Low”, then “Reduceprices”.
Expected payoff = $44 million.
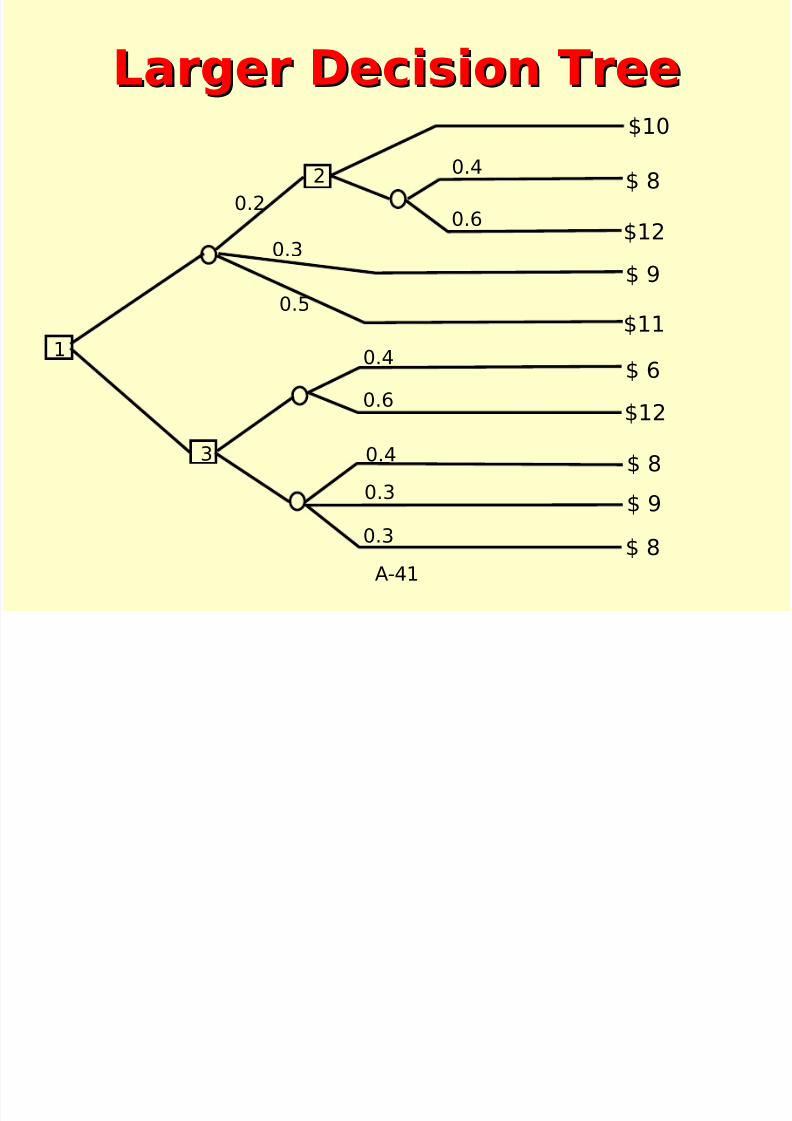
Larger Decision TreeLarger Decision Tree
7/31/2019 WK2 Decision Analysis
http://slidepdf.com/reader/full/wk2-decision-analysis 41/42
A-41
Larger Decision TreeLarger Decision Tree
0.4
$10
$ 8
$12
$11
$ 6
$ 8
$ 9
1
3
2
0.3
0.3
0.6
0.4
0.5
0.3
0.20.6
0.4
$ 9
$12
$ 8
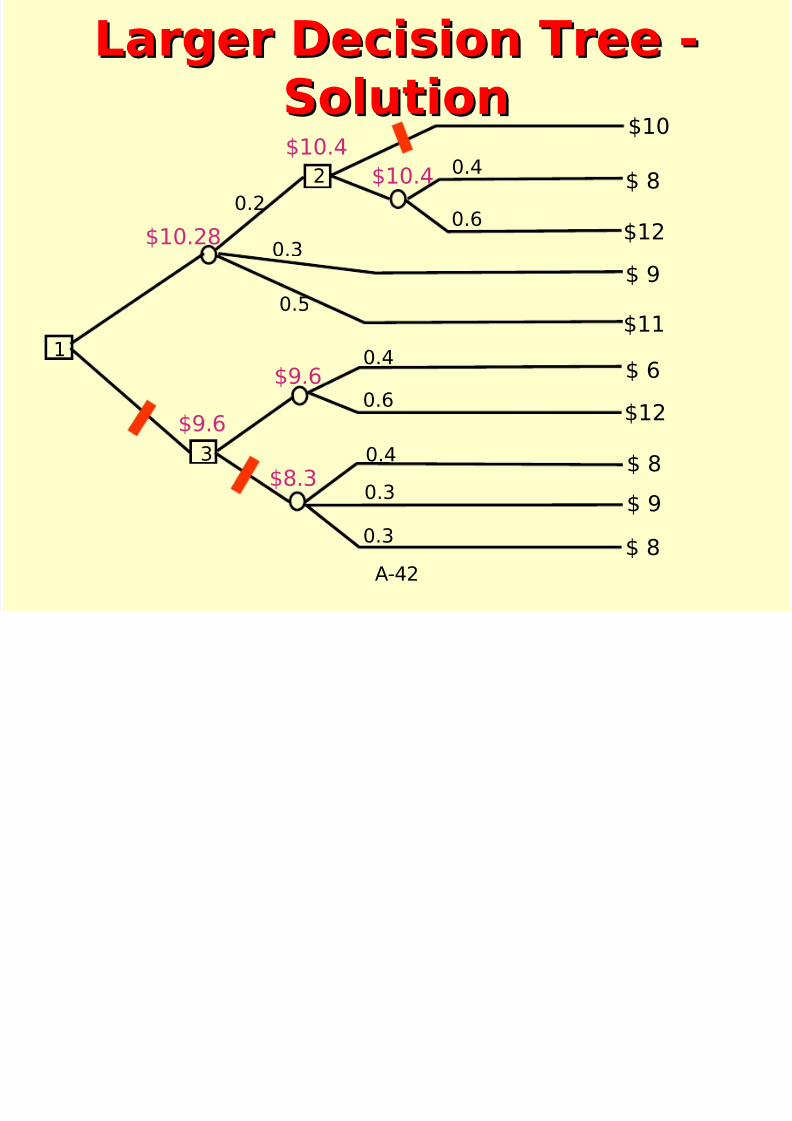
Larger Decision Tree -Larger Decision Tree -
7/31/2019 WK2 Decision Analysis
http://slidepdf.com/reader/full/wk2-decision-analysis 42/42
A-42
gg
SolutionSolution
0.4
$10
$ 8
$12
$11
$ 6
$ 8
$ 9
1
3
2
0.3
0.3
0.6
0.4
0.5
0.3
0.20.6
0.4
$ 9
$12
$ 8
$10.28
$9.6
$9.6
$8.3
$10.4$10.4