with llvm instrumentation finding races and memory errors...
TRANSCRIPT

Finding races and memory errorswith LLVM instrumentationAddressSanitizer, ThreadSanitizer
Timur Iskhodzhanov, Alexander Potapenko,
Alexey Samsonov, Kostya Serebryany,Evgeniy Stepanov, Dmitriy Vyukov
LLVM Dev MeetingNovember 18, 2011

Agenda
● AddressSanitizer (memory error detector)● ThreadSantizer (race detector)● Challenges

● Out-of-bounds accesses (OOB, buffer overflow/underflow)○ Heap○ Stack○ Globals
● Use-after-free (UAF, dangling pointer)● Use-after-return (UAR)● Uninitialized memory reads (UMR)● Leaks● Double free● Invalid free● Overapping memcpy parameters● ...
Memory bugs in C++

AddressSanitizer vs Valgrind (Memcheck)
Valgrind AddressSanitizer
Heap out-of-bounds YES YES
Stack out-of-bounds NO YES
Global out-of-bounds NO YES
Use-after-free YES YES
Use-after-return NO Sometimes/YES
Uninitialized reads YES NO
Overhead 10x-30x 1.5x-3x
Platforms Linux, Mac Same as GCC/LLVM *
AddressSanitizer overview
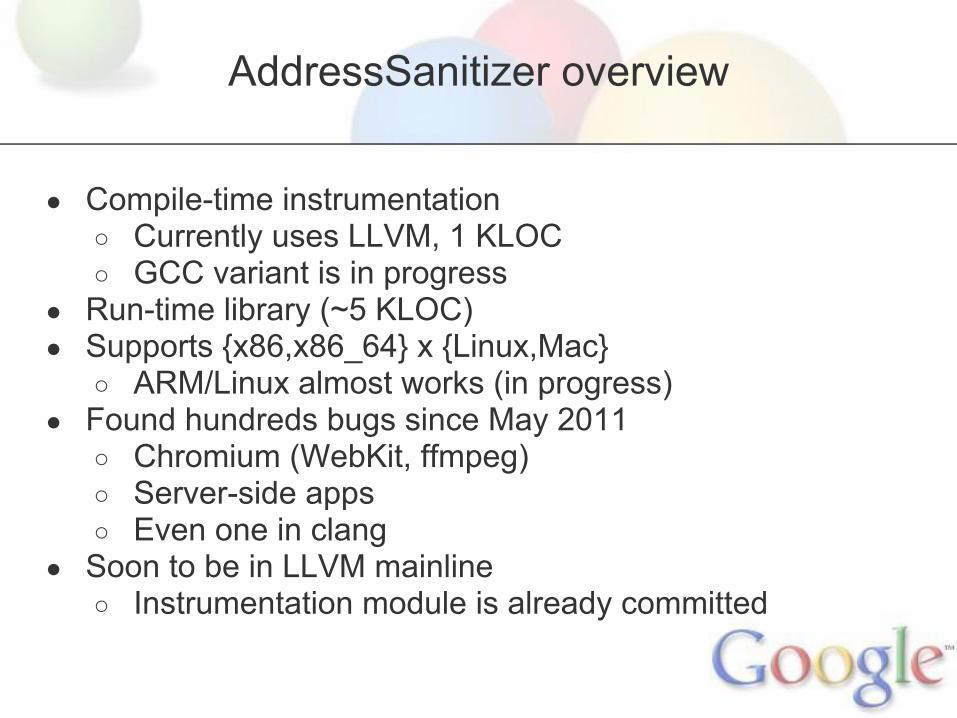
● Compile-time instrumentation○ Currently uses LLVM, 1 KLOC○ GCC variant is in progress
● Run-time library (~5 KLOC)● Supports {x86,x86_64} x {Linux,Mac}
○ ARM/Linux almost works (in progress)● Found hundreds bugs since May 2011
○ Chromium (WebKit, ffmpeg)○ Server-side apps○ Even one in clang
● Soon to be in LLVM mainline ○ Instrumentation module is already committed
Shadow bytes
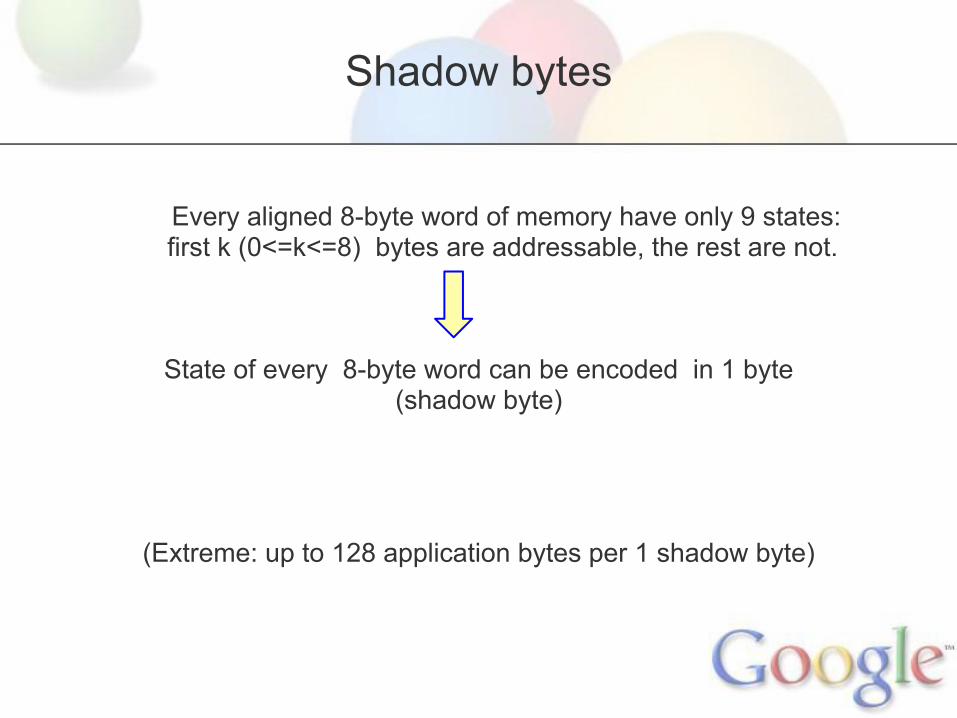
Every aligned 8-byte word of memory have only 9 states:first k (0<=k<=8) bytes are addressable, the rest are not.
State of every 8-byte word can be encoded in 1 byte(shadow byte)
(Extreme: up to 128 application bytes per 1 shadow byte)
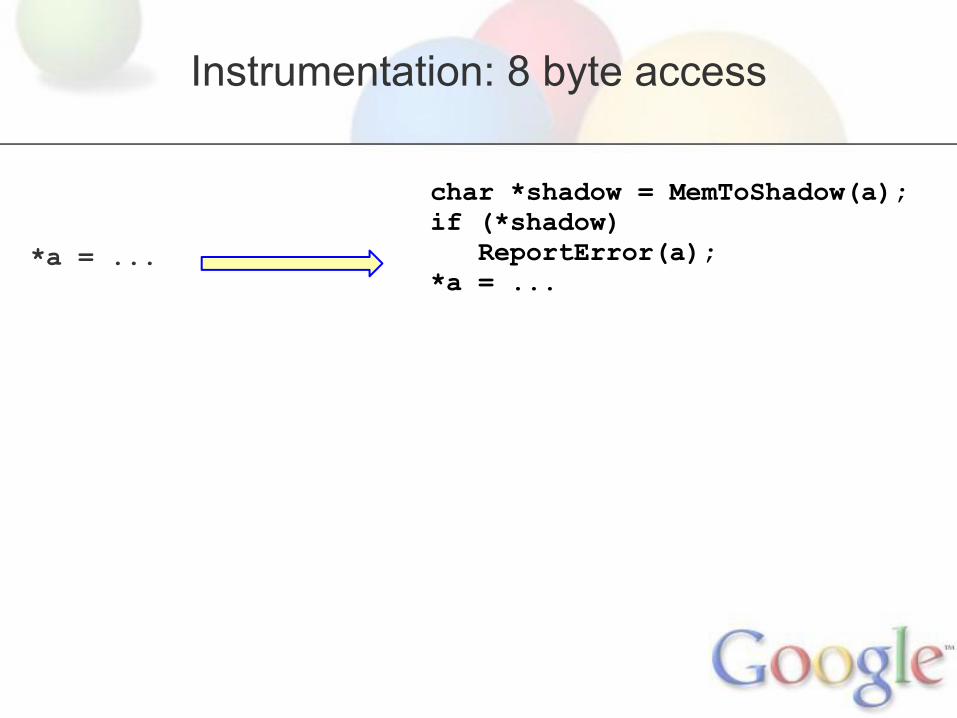
*a = ...
Instrumentation: 8 byte access
char *shadow = MemToShadow(a);if (*shadow) ReportError(a);*a = ...

*a = ...
Instrumentation: N byte access (N=1, 2, 4)
char *shadow = MemToShadow(a);if (*shadow && *shadow <= ((a&7)+N-1)) { ReportError(a);}*a = ...

Mapping: Shadow = (Addr>>3) + Offset
0xffffffff0x40000000
0x3fffffff0x28000000
0x27ffffff0x24000000
0x23ffffff0x20000000
0x1fffffff0x00000000
0xffffffff0x40000000
ApplicationMemory
0x3fffffff0x28000000
Shadow
0x27ffffff0x24000000
Prohibited
0x23ffffff0x20000000
Shadow
0x1fffffff0x00000000
Application

Mapping: Shadow = (Addr>>3) + 0
0xffffffff0x20000000
0x1fffffff0x04000000
0x03ffffff0x00000000
0xffffffff0x20000000
Application
0x1fffffff0x04000000
Shadow
0x03ffffff0x00000000
Prohibited
● Requires -fPIE -pie● Gives ~6% speedup● Can this be made default for everyone?
Instrumentation example (x86_64)
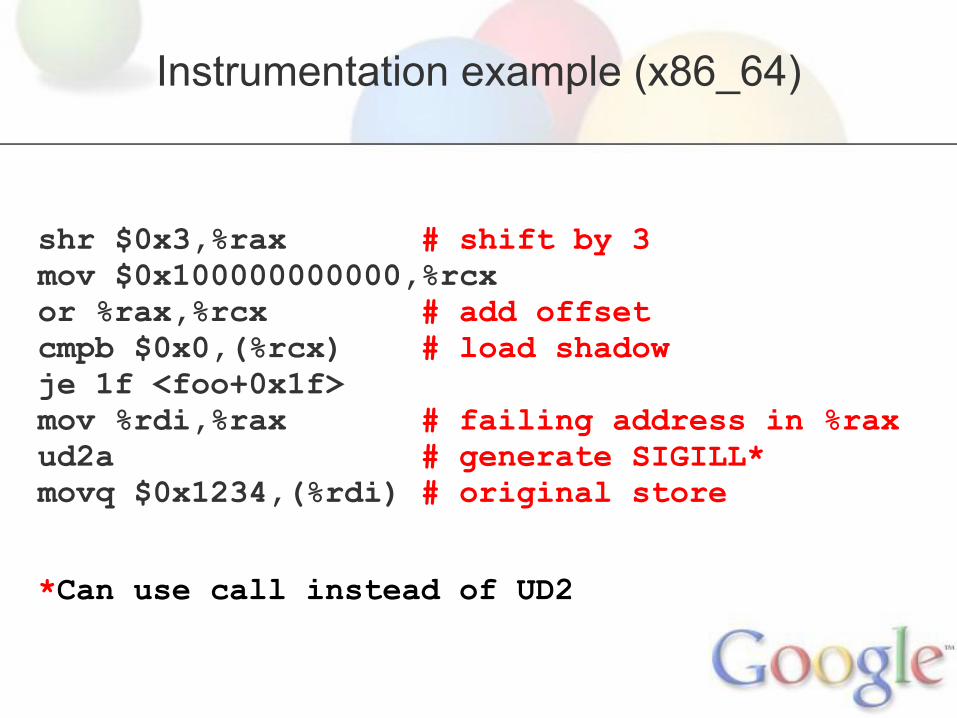
shr $0x3,%rax # shift by 3 mov $0x100000000000,%rcx or %rax,%rcx # add offsetcmpb $0x0,(%rcx) # load shadowje 1f <foo+0x1f>mov %rdi,%rax # failing address in %raxud2a # generate SIGILL*movq $0x1234,(%rdi) # original store *Can use call instead of UD2

Instrumenting stack
● Fast protocol○ Poison redzones at function entry○ Unpoison redzones at function exit (must happen)○ Assume the rest of the stack frame is unpoisoned ○ + Fast: O(number of locals) instructions○ - Tricky when exceptions or longjmp are present ○ - Small probability of finding use-after-return
● Slow protocol○ Poison redzones and unpoison locals at function entry ○ Poison the entire frame at function exit (optional)○ + Friendly to exceptions and longjmp○ + Better for use-after-return○ - Slower: O(size of the stack frame) instructions

void foo() { char a[328]; <------------- CODE -------------> }
Instrumenting stack

Instrumenting stack (fast protocol)
void foo() { char rz1[32]; // 32-byte aligned char a[328]; char rz2[24]; char rz3[32]; int *shadow = (&rz1 >> 3) + kOffset; shadow[0] = 0xffffffff; // poison rz1 shadow[11] = 0xffffff00; // poison rz2 shadow[12] = 0xffffffff; // poison rz3 <------------- CODE -------------> shadow[0] = shadow[11] = shadow[12] = 0; }

Instrumenting stack (slow protocol)
void foo() { char rz1[32]; // 32-byte aligned char a[328]; char rz2[24]; char rz3[32]; int *shadow = (&rz1 >> 3) + kOffset; shadow[0] = 0xffffffff; // poison rz1 shadow[1:10] = 0; // unpoison a shadow[11] = 0xffffff00; // poison rz2 shadow[12] = 0xffffffff; // poison rz3 <------------- CODE -------------> shadow[0:13] = 0xffffffff; }

Instrumenting globals
int a; double b;
struct { int original; char redzone[60];} a; // 32-aligned struct { double original; char redzone[56];} b; // 32-aligned
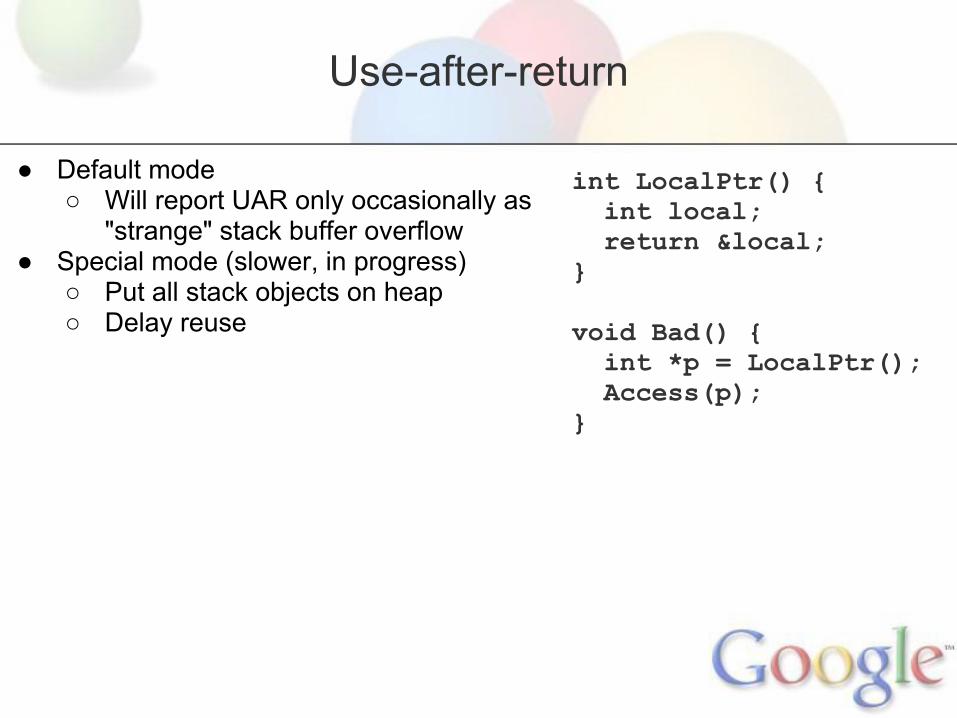
Use-after-return
int LocalPtr() { int local; return &local;} void Bad() { int *p = LocalPtr(); Access(p);}
● Default mode ○ Will report UAR only occasionally as
"strange" stack buffer overflow● Special mode (slower, in progress)
○ Put all stack objects on heap○ Delay reuse

Run-time library
● Initializes shadow memory at startup● Provides full malloc replacement
○ Insert poisoned redzones around allocated memory○ Quarantine for free-ed memory○ Collect stack traces for every malloc/free
● Provides interceptors for functions like strlen● Prints error messages
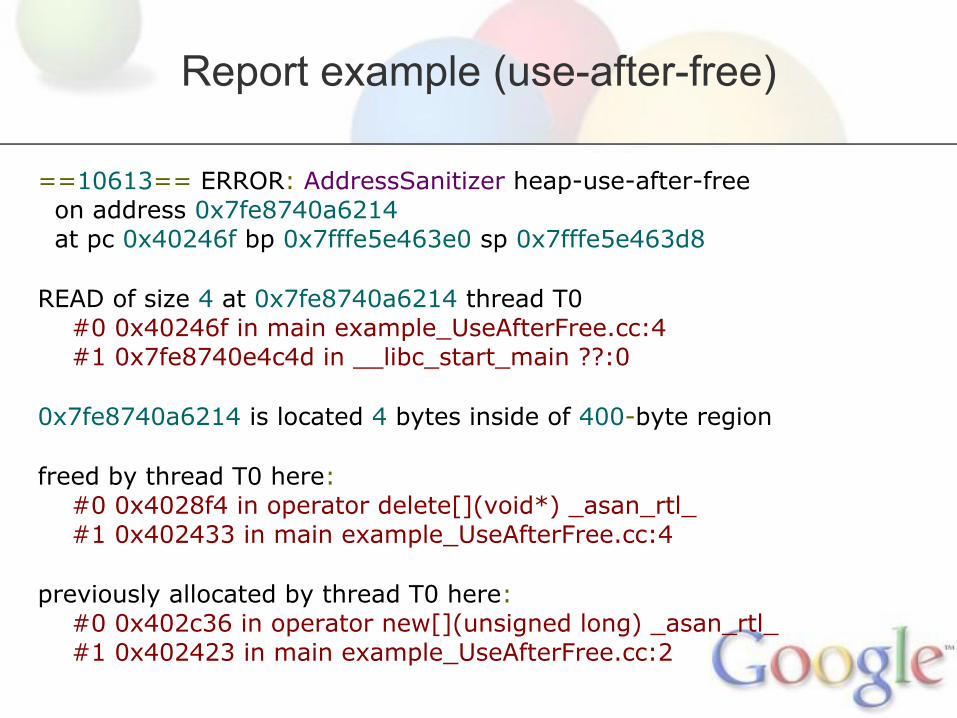
Report example (use-after-free)
==10613== ERROR: AddressSanitizer heap-use-after-free on address 0x7fe8740a6214 at pc 0x40246f bp 0x7fffe5e463e0 sp 0x7fffe5e463d8 READ of size 4 at 0x7fe8740a6214 thread T0 #0 0x40246f in main example_UseAfterFree.cc:4 #1 0x7fe8740e4c4d in __libc_start_main ??:0 0x7fe8740a6214 is located 4 bytes inside of 400-byte region freed by thread T0 here: #0 0x4028f4 in operator delete[](void*) _asan_rtl_ #1 0x402433 in main example_UseAfterFree.cc:4 previously allocated by thread T0 here: #0 0x402c36 in operator new[](unsigned long) _asan_rtl_ #1 0x402423 in main example_UseAfterFree.cc:2

Performance: 1.73x slowdown on cpu2006
Reads&Writes Only Writes
Real-life performance
● Almost no slowdown for GUI programs○ They don't consume all of CPU anyway
● 1.5x - 4x slowdown for server side apps○ The larger the slower (instruction cache?)○ Up to 8x with -O1 (inlining? instruction cache?)

Memory overhead
● Heap redzones ○ default is 128-255 bytes per allocation○ minimal is 32-63 bytes per allocation
● Stack redzones: 32-63 bytes per address-taken local variable● Global redzones: 32-63 bytes per global● Fixed size Quarantine (250M)● (Heap + Globals + Stack + Quarantine) / 8 for shadow
● Typical overal memory overhead is 2x - 4x
○ Seen between 1.1x and 20x● Stack size increase
○ Seen up to 3x● Maps (but not reserves) 1/8-th of all address space
○ 16T on 64-bit○ 0.5G on 32-bit

ThreadSanitizer
● Dynamic detector of data races○ Uses both lock-set and happens-before○ Algorithm: WBIA'09○ Similar tools: Helgrind, DRD, Intel Parallel Inspector
● Based on run-time instrumentation○ Valgrind for Linux and Mac○ PIN for Windows
● Found 1000+ races in Google code since 2008● VERY slow (30x is not unusual)● Decided to use compiler instrumentation
○ A bit similar to LiteRace and Sun Studio (both proprietary)○ AddressSanitizer is a by-product

● High level: very similar to AddressSanitizer● Compiler:
○ Instrument every memory access (call run-time)○ Instrument function call/entry/exit
■ Unwind is slow, need shadow call stack● The rest happens in run-time
○ Same state machine as used with Valgrind○ Intercept various libc/pthread functions
● ~4x faster than with Valgrind (3x-10x)○ Also parallel
● Status: can build and run Chrome (GCC and LLVM)● State machine under redesign, expect to be even faster
ThreadSanitizer + compiler instrumentation

Challenge: detect UMRs
● Uninitialized Memory Read? Use Valgrind :( ● False positives if some stores are not instrumented● Need to instrument every store instruction in libraries● Hybrid tool?
○ Compiler instrumentation for user code○ Dynamic instrumentation (DynamoRIO?) for libraries

Challenge: statically avoid redundant checks
// Instrument only the first access*a = …if (…) *a = … // Instrument only the second access (?)if (…) … = *a*a = … // Instrument only a[0] and a[n-1]for (int i = 0; i < n; i++) a[i] = i; // Combine two accesses into onestruct { double align; int a, b; } x; …x.a = …; x.b = …

Q&A
http://code.google.com/p/address-sanitizer/
http://code.google.com/p/data-race-test/