with a permanent magnet synchronous generator using pscad · abstract-the aim of this work is to...
TRANSCRIPT

Abstract- The aim of this work is to analyze a typical
configuration of a Wind Turbine Generator System (WTGS)
equipped with a Distribution Grid. Now a days, doubly fed
induction generators are being widely used on WTGS, although
synchronous generators are being extensively utilized too. There
are different types of synchronous generators, but the multi-pole
Permanent Magnet Synchronous Generator (PMSG) is chosen in
order to obtain its model. It offers better performance due to
higher efficiency and less maintenance since it does not have
rotor current and can be used without a gearbox, which also
implies a reduction of the weight of the nacelle and a reduction of
costs. Apart from the generator, the analyzed WTGS consists of
another three parts: wind speed, wind turbine and drive train.
These elements have been modeled and the equations that
explain their behaviour have been introduced. What is more, the
whole WTGS has been implemented in PSCAD.
Index Terms—PSCAD/EMTDC, PMSG, Distribution Grid
Fault analysis
I. INTRODUCTION
The utilization of wind energy has a very long tradition.
Some historians suggest that wind turbines (windmills) were
known over 3000 years ago [1]. Until the early twentieth
century wind power was used to provide mechanical power to
pump water or to grind grain.
The first wind turbines appeared at the beginning of the
last century and technology was improved step by step from
the early 1970s. By the end of the 1990s, wind energy has
reemerged as one of the most important sustainable energy
resources, partly because of the increasing price of the oil,
security concerns of nuclear power and its environmental
issues. Moreover, as wind energy is abundant and it has an
inexhaustible potential, it is one of the best technologies today
to provide a sustainable electrical energy supply to the world
development.
Actually, during the last decade of the twentieth century,
World wide wind capacity doubled approximately every three
years. Currently, five countries (Germany, USA, Denmark,
India and Spain) concentrate more than 83% of world wide
Wind energy capacity in their countries [2]. Studies have
shown that by the end of2003, the total installed capacity of
the wind turbines reached 39.234 GW and will exceed 110
GW by the year of 2012[3].
The need for increased power production from the wind
and economic reasons, when the rated power of
today's wind
turbines is still relatively
small (2MW units are now typical),
makes it necessary to group wind turbines into so-called wind
farms.
Wind farms are built on land, but in recent years there has
been (and will probably be in the future) a strong trend
towards locating them offshore. The lack of suitable wind
turbine sites on land (it is particularly the case of densely
populated countries) and the highest wind speeds located near
the sea (and consequently higher energy can be extracted from
the wind) are the two main reasons for locating wind farms
offshore. Horns Rev in Denmark [4] is an example of a current
Off
shore wind farm, which is capable of producing 160 MW.
Both induction and synchronous generators can be used for
wind turbine systems [5]. Mainly, three types of induction
generators are used in wind power conversion systems: cage
rotor, wound rotor with slip control and doubly fed induction
rotors.
The last one is the most utilized in wind speed
generation because it provides a wide range of speed variation.
However, the variable-speed directly-driven multi-pole
permanent magnet synchronous generator (PMSG) wind
architecture is chosen for this purpose and it is going to be
modeled: it offers better performance due to higher efficiency
and less maintenance because it does not have
rotor current.
What is more, PMSG can be used without a gearbox, which
implies a reduction of the weight of the nacelle and reduction
of costs.
This paper makes the choice to define a wind turbine
connected to a permanent Magnet Synchronous Generator
with 100 pole pairs. The connection to the grid is then
performed through a full AC/DC/AC converter and a step up
transformer. The main advantage of this strategy is to allow to
remove the gear box in the wind turbine.
Modeling and fault analysis of wind turbine
with a Permanent Magnet Synchronous
Generator using PSCAD
Swagat Dash, Prof (Dr.)Bibhuti Bhusan Pati
Department of
Electrical Engineering, VSSUT, Burla Department of Electrical Engineering, VSSUT, Burla
292
Vol. 3 Issue 4, April - 2014
International Journal of Engineering Research & Technology (IJERT)
IJERT
IJERT
ISSN: 2278-0181
www.ijert.orgIJERTV3IS040379

e1r
STe
Tm
Tmw
Ef If
W
1.0
TmVw
Beta
W P
Wind TurbineMOD 2 Type
Wind TurbineGovernor
Wm
Beta
PgMOD 2 Type
N
D
N/D
100
0
*
314.16
W
Vw
Wind SourceMean
0.0
00
1 [o
hm
] #1 #2
P+
jQ
P+jQ
V
A
node1
0.016 [H] 1.0 [ohm] V
Anode1
Node2
P+jQ
Node20.016 [H] 1.0 [ohm] V
ANode3
P+jQ
II. SYSTEM DESCRIPTION
The system analyzed is a variable speed wind turbine
based on a multi-pole PMSG. Due to the low generator speed,
the rotor shaft is coupled directly to the generator, which
means that no gearbox is needed. The generator is connected
to the grid via an AC/DC/AC converter, which consists of an
uncontrolled diode rectifier, an internal DC-Link modeled as a
capacitor and a PWM voltage-source inverter.
A transformer is located between the inverter and the Point Of
Common Connection(PCC) in order to raise the voltage by
avoiding losses in the transport of the current. The layout of
the electrical part is depicted in Fig. I.
Fig.I. Electrical Scheme of a wind turbine equipped with
direct-driven
III. SUBSYTEM MODELS
A. Wind Turbine Model
The kinetic energy of the air through the rotor blades is:
Ec = ½ mWs2
(1)
The theoretical power we can obtain from a wind turbine
is:
Pth = ½ ρS Ws3
(2)
with ρ= air density (1.22 kg/m3)
S = rotor surface (m2 )
Ws= Wind speed (m/s)
In practice, the power is smaller because the wind speed
behind the hub is not Zero . This efficiency is characterized by
the Betz coefficient (given by Bernouilli’s equations), also
called the Power Coefficient Cp:
Cp= Preal/Pth (3)
Cp = ½ (1-a2) (1+a)
a = Wind speed behind the rotor / wind speed in front of the
rotor
The amount of aerodynamic torque (τw) in (N-m) is given by
the ratio between the power extracted from the wind (Pth) , in
W, and the turbine rotor speed (ωw), in rad/s, as follows
τ𝑤 =𝑃𝑡ℎ
𝜔𝑚 (4)
It should be noted that the mechanical torque transmitted to
the generator (τwg) is the same as the aerodynamic torque,since
there is no gearbox. It implies that the gear box ratio is
ng= 1.Therefore τw = τwg. The power coefficient Cp reaches a
maximum value equal to Cp= 0.593, which means that the
power extracted from the wind is always less than 59.3%
(Betz's limit), because various aerodynamic losses depend on
the rotor construction (number and shape of blades, weight,
stiffness, etc.). This is the well known low efficiency to
produce electricity from the wind. The turbine subsystem
model is depicted in Fig.II.
Fig.II. Wind turbine Subsystem build in PSCAD
B. Distribution Grid
A distribution grid is a radial grid managed as an open
loop. The power always flows in the same direction. The grid
study is modeled as Fig.III.
Fig.III. Distribution Grid
C. AC/DC/AC: Power and Frequency Conversion
The speed of the wind source being variable, a converter
stage AC-DC-AC must be implemented in order to connect
the output of the synchronous generator (variable frequency
and voltage) to the grid, where a constant frequency and a
constant voltage is needed. In the following parts, the power
conversion stage will be described and parameterized.
It is composed of a :
o A diode rectifier
o A dc bus with a storage capacitance voltage
o A six pulse bridge thyristor inverter
293
Vol. 3 Issue 4, April - 2014
International Journal of Engineering Research & Technology (IJERT)
IJERT
IJERT
ISSN: 2278-0181
www.ijert.orgIJERTV3IS040379

Main : Graphs
0.00 0.25 0.50 0.75 1.00 1.25 1.50 1.75 2.00 ...
...
...
0.0
1.0
2.0
3.0
4.0
5.0
6.0
7.0
8.0
y
Qsource Q1 Q2 Q3
KB
AO
GM
AM
Com.Bus
Bridge6 Pulse
0
V_Dcbus
1.1 [ohm]
Idc1
2.3
[F]
Cap_BRK
e1r
V_Dcbus
SStart
Sequence
OpenBreaker
Cap_BRK
S
BreakerCap_BRK
S Close
7.5 [s]
Wait UntilS
RMSV_Dcbus
RMSIdc1
Main : Graphs
0.00 0.25 0.50 0.75 1.00 1.25 1.50 1.75 2.00 ...
...
...
0.00
0.10
0.20
0.30
0.40
0.50
0.60
I
I1 I2 I3
Main : Graphs
0.00 0.25 0.50 0.75 1.00 1.25 1.50 1.75 2.00 ...
...
...
0.0
1.0
2.0
3.0
4.0
5.0
6.0
7.0
8.0
9.0
P
Psource P1 P2 P3
Main : Graphs
5.0 10.0 15.0 20.0 25.0 30.0 35.0 ...
...
...
-0.50
0.00
0.50
1.00
1.50
2.00
2.50
3.00
3.50
4.00
y
Pgene Qgene Pm
The output voltage of a generator is proportional to its
speed. The speed of the generator not being controlled, the DC
bus must be protected from over-voltage. With a secure
margin of 10%.
To secure the bus, it is possible to block the rectifier in case
of over-voltage. This is done with the Single Input Level
Comparator. The Dc bus model used in system depicted in
Fig.IV
Fig.IV. Dc Bus
IV. SIMULATION RESULTS
A. Turbine –Generator
The PMSG has been considered as a system which
makes possible to produce electricity from the mechanical
energy obtained from the wind. The dynamic model of the
PMSG is derived from the two phase synchronous
reference frame, which the q-axis is 90°ahead of the d-
axis with respect to the direction of rotation.
Table.I. shows the parameter of turbine- generator
that has been considered
Table.I.Computation Parameter
Parameter Symbol Values & Unit
No.of pole pair P 100
Rated speed ωm 3.1416 rad/sec
Rated power Sn 3 MVA
Rated Voltage E 0.69Kv
d-axis reactance Xd 0.4p.u
Rated current In 1450A
Fig.V. shows simulation result of turbine-generator model
Fig.V simulation of WTGS in PSCAD
B. Distribution grid
A distribution grid is a radial grid connected with the
turbine-generator system through AC-DC-AC converter. The
power always flows in the same direction.Fig.VI. shows
simulation result of Distribution Grid
(a) Active Power of Grid at Various Node
(b)Reactive Power of Grid at Various Node
Main : Graphs
0.0 5.0 10.0 15.0 20.0 25.0 30.0 35.0 40.0 ...
...
...
0.0
0.2M
0.4M
0.6M
0.8M
1.0M
1.2M
y
T_elect_gene Tm
294
Vol. 3 Issue 4, April - 2014
International Journal of Engineering Research & Technology (IJERT)
IJERT
IJERT
ISSN: 2278-0181
www.ijert.orgIJERTV3IS040379

Analog Graph
13.00 13.50 14.00 14.50 15.00 15.50 16.00 16.50 17.00 ...
...
...
0.20
0.30
0.40
0.50
0.60
0.70
0.80
0.90
1.00
1.10
1.20
I
Ia1 w ithout DG Ia1 w ith DG
Main : Graphs
0.0 2.5 5.0 7.5 10.0 12.5 15.0 17.5 20.0 ...
...
...
0.00
0.50
1.00
1.50
2.00
2.50
3.00
3.50
y
f iring angle
Main : Graphs
0.0 2.5 5.0 7.5 10.0 12.5 15.0 17.5 20.0 ...
...
...
-0.25
0.00
0.25
0.50
0.75
1.00
1.25
1.50
1.75
2.00
po
we
r
Pgrid Qgrid
Main : Graphs
0.00 0.25 0.50 0.75 1.00 1.25 1.50 1.75 2.00 ...
...
...
0.00
0.20
0.40
0.60
0.80
1.00
1.20
y
Vsource E1 E2 E3
Fig.VI. Simulation of Distribution Grid in PSCAD
At t=2s,We have the following values:
Node1 Node2 Node3
P(MW) 8.9 2.41 0.78
Q(MVAR) 7.0 1.80 0.55
V(pu) 1.0 0.91 0.90
I(KA) 0.52 0.15 0.05
C. Fault Analysis
The connection of a distributed generator to a radial
distribution system leads to situations not normally supported
by the network in case of faults. The distribution network is a
radial network and the protections are based on the current
measurement.
This simulation consists of connecting the distributed
generator at one node and the fault component at another
node. Then, the current and the active power are measured in
order to determine the protection level necessary and
compared to the values measured without the wind turbine
generator.
This simulation comprises of two cases. In the First case,
fault is connected at Node 3 and distributed generator is
connected at Node 1.the simulation is formed in both mode.i. e
with and without DG and the results are compared.
CASE 1 Fault at Node 3
First perform a simulation with distribution grid
alone and add the grid to the distribution generator .Fig.VII.
shows simulation result and comparison between the two
mode.
(a) Simulation result current at Node 1
(b)Fault current at Node 3
(c) Thyristor firing angle
(d) Real and Reactive power of grid
Fig.VIII. Simulation Results of Fault occurred at Node 3
Table.III. shows the comparison of fault analysis of two mode.
Table.III. Result of fault analysis
Default node 3 Peak without using
DG
Peak values with
DG node1
I1(KA) 1.04 1.00
Ifault(KA) 0.68 0.68
The peak values at Node 1 is lower with DG than without DG.
CASE 2 Fault at Node 2
In this case the fault is connected at Node 2 and distribution
grid is connected at Node 3. Fig.IX. show the results of fault
accured at Node 2
Analog Graph
0.0 2.5 5.0 7.5 10.0 12.5 15.0 17.5 20.0 ...
...
...
0.00
0.10
0.20
0.30
0.40
0.50
0.60
0.70
y
Ifault w ithout DG Ifault
295
Vol. 3 Issue 4, April - 2014
International Journal of Engineering Research & Technology (IJERT)
IJERT
IJERT
ISSN: 2278-0181
www.ijert.orgIJERTV3IS040379
D_grid,D_GRID3 : Graphs
0.0 2.5 5.0 7.5 10.0 12.5 15.0 17.5 20.0 ...
...
...
-1.50
-1.00
-0.50
0.00
0.50
1.00
1.50
2.00
y
P3 w ithout DG P3
D_grid : Graphs
0.0 2.5 5.0 7.5 10.0 12.5 15.0 17.5 20.0 ...
...
...
0.00
0.20
0.40
0.60
0.80
1.00
1.20
1.40
1.60
y
Ifault
D_grid,D_GRID3 : Graphs
13.00 13.50 14.00 14.50 15.00 15.50 16.00 16.50 17.00 17.50 18.00 18.50 19.00 ...
...
...
0.010
0.020
0.030
0.040
0.050
0.060
0.070
0.080
0.090
y
Ia3w ithout DG I3
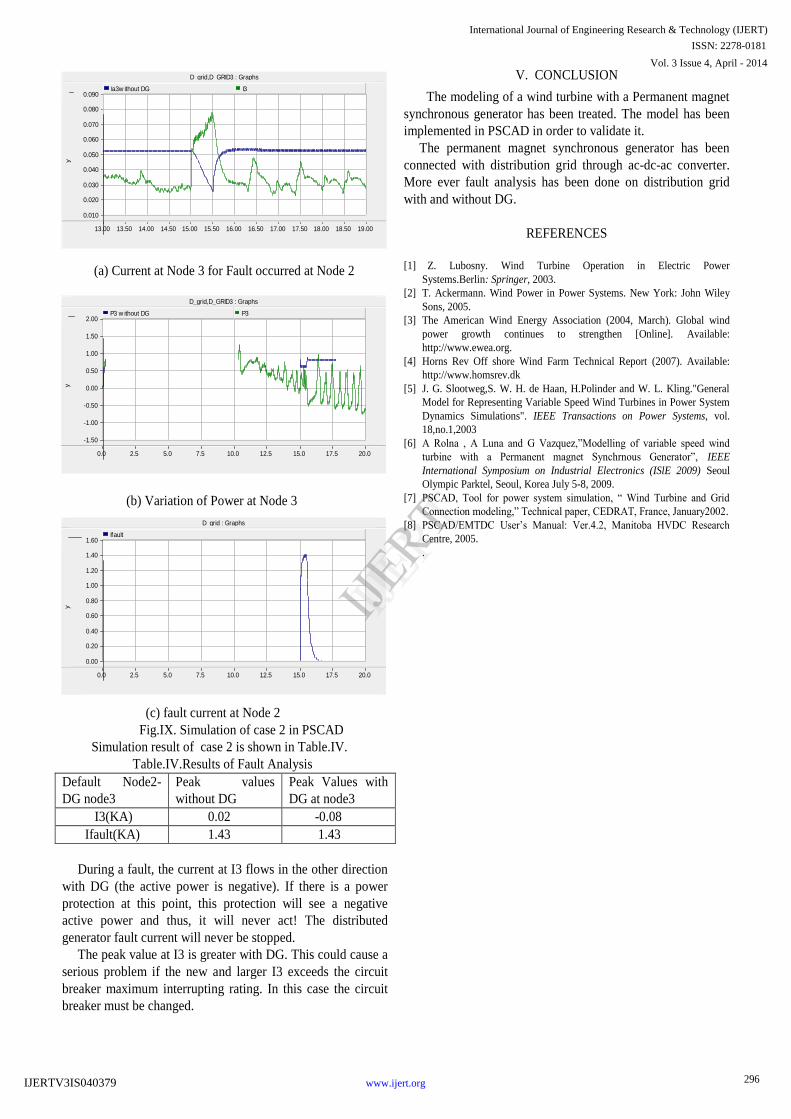
(a) Current at Node 3 for Fault occurred at Node 2
(b) Variation of Power at Node 3
(c) fault current at Node 2
Fig.IX. Simulation of case 2 in PSCAD
Simulation result of case 2 is shown in Table.IV.
Table.IV.Results of Fault Analysis
Default Node2-
DG node3
Peak values
without DG
Peak Values with
DG at node3
I3(KA) 0.02 -0.08
Ifault(KA) 1.43 1.43
During a fault, the current at I3 flows in the other direction
with DG (the active power is negative). If there is a power
protection at this point, this protection will see a negative
active power and thus, it will never act! The distributed
generator fault current will never be stopped.
The peak value at I3 is greater with DG. This could cause a
serious problem if the new and larger I3 exceeds the circuit
breaker maximum interrupting rating. In this case the circuit
breaker must be changed.
V. CONCLUSION
The modeling of a wind turbine with a Permanent magnet
synchronous generator has been treated. The model has been
implemented in PSCAD in order to validate it.
The permanent magnet synchronous generator has been
connected with distribution grid through ac-dc-ac converter.
More ever fault analysis has been done on distribution grid
with and without DG.
REFERENCES
[1] Z. Lubosny. Wind Turbine Operation in Electric Power
Systems.Berlin: Springer, 2003.
[2] T. Ackermann. Wind Power in Power Systems. New York: John Wiley
Sons, 2005.
[3] The American Wind Energy Association (2004, March). Global wind
power growth continues to strengthen [Online]. Available:
http://www.ewea.org.
[4] Horns Rev Off shore Wind Farm Technical Report (2007). Available:
http://www.homsrev.dk
[5] J. G. Slootweg,S. W. H. de Haan, H.Polinder and W. L. Kling."General
Model for Representing Variable Speed Wind Turbines in Power System
Dynamics Simulations". IEEE Transactions on Power Systems, vol.
18,no.1,2003
[6] A Rolna , A Luna and G Vazquez,”Modelling of variable speed wind
turbine with a Permanent magnet Synchrnous Generator”, IEEE
International Symposium on Industrial Electronics (ISlE 2009) Seoul
Olympic Parktel, Seoul, Korea July 5-8, 2009.
[7] PSCAD, Tool for power system simulation, “ Wind Turbine and Grid
Connection modeling,” Technical paper, CEDRAT, France, January2002.
[8] PSCAD/EMTDC User’s Manual: Ver.4.2, Manitoba HVDC Research
Centre, 2005.
.
296
Vol. 3 Issue 4, April - 2014
International Journal of Engineering Research & Technology (IJERT)
IJERT
IJERT
ISSN: 2278-0181
www.ijert.orgIJERTV3IS040379
