witan investment trust plc 2009 annual general meeting 28 april 2009
DESCRIPTION
Witan Investment Trust plc 2009 Annual General Meeting 28 April 2009. Witan Investment Trust plc Harry Henderson Chairman. 2008: An Eventful Year for Witan. 100 th Anniversary global financial crisis new management team fourth anniversary of move to multi-manager. - PowerPoint PPT PresentationTRANSCRIPT

Witan Investment Trust plc
2009 Annual General Meeting
28 April 2009
Witan Investment Trust plc
Harry HendersonChairman

3
2008: An Eventful Year for Witan
100th Anniversary
global financial crisis
new management team
fourth anniversary of move to multi-manager
4
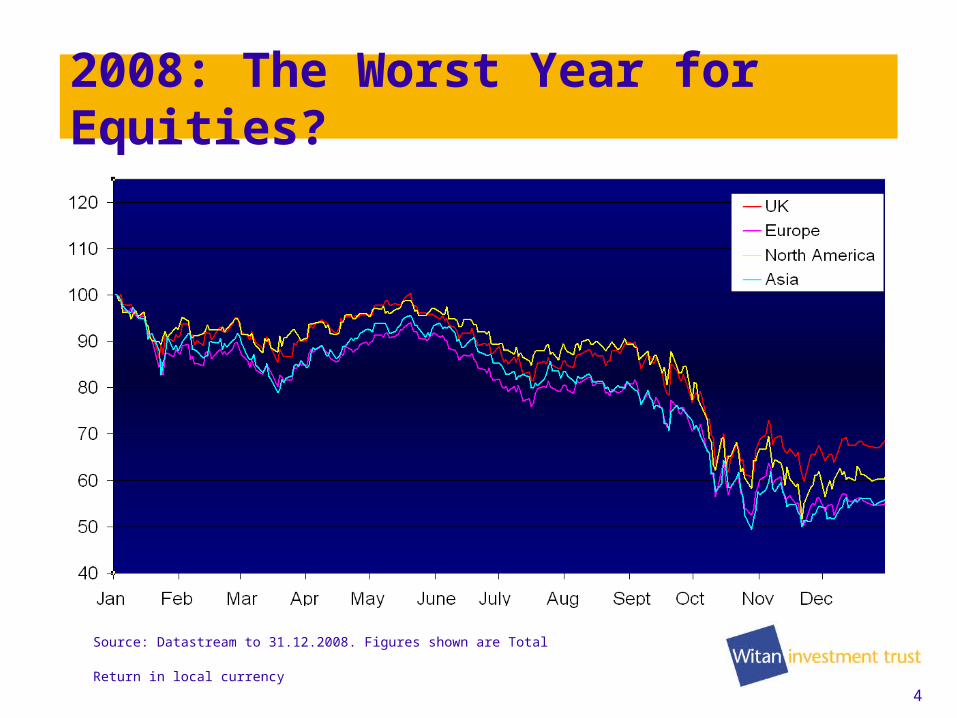
2008: The Worst Year for Equities?
Source: Datastream to 31.12.2008. Figures shown are Total Return in local currency
5
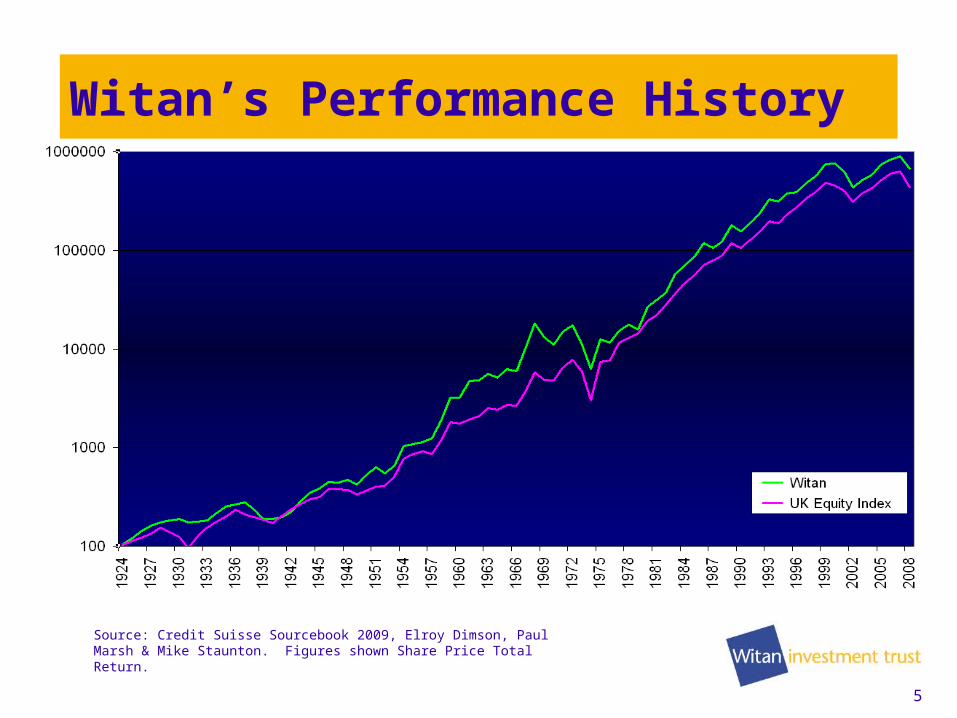
Witan’s Performance History
Source: Credit Suisse Sourcebook 2009, Elroy Dimson, Paul Marsh & Mike Staunton. Figures shown Share Price Total Return.

6
Witan since start of Multi-Manager
Source: Datastream to 31.12.08. Figures shown Share Price Total Return
7
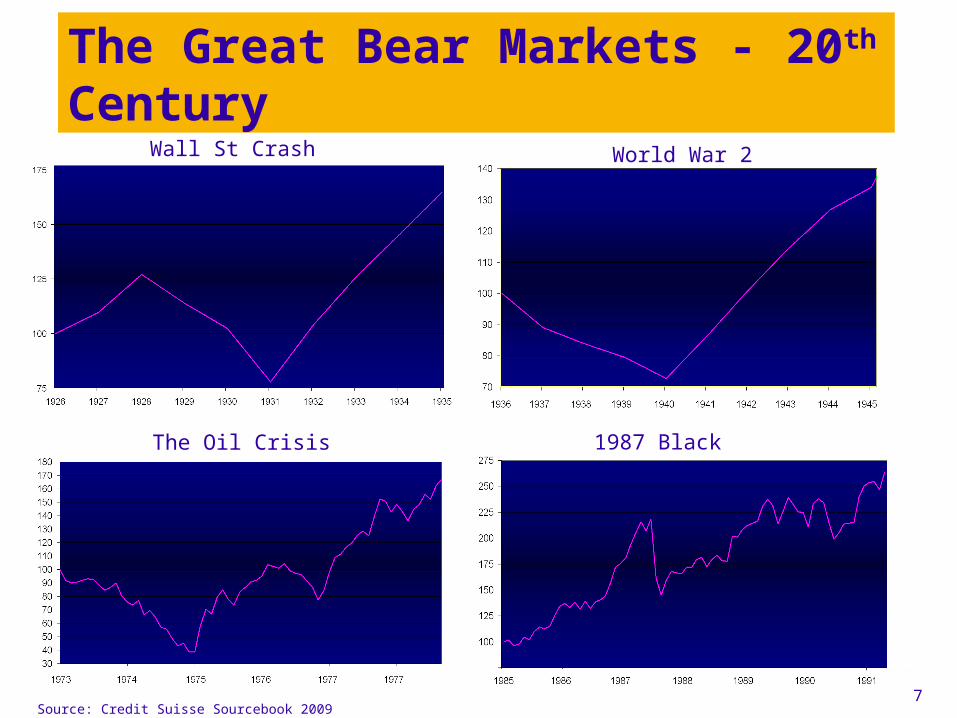
The Great Bear Markets - 20th Century
Source:
Wall St Crash World War 2
The Oil Crisis 1987 Black Thursday
Source: Credit Suisse Sourcebook 2009

8
£1 Invested in 1924
Source: Credit Suisse Sourcebook 2009

9
Reasons for (some) optimism
banking system saved
world working together
global stimulus yet to be felt
easier to deflate than inflate

Witan Investment Trust plc
Robert ClarkeChief Executive Officer

11
First Impressions
Financials– Performance– Dividend– Discount– Debt Repurchase– Total Expense Ratio
Business Development– Witan Investment Services– New Business Development
2009 AGM

12
First Impressions
innovation: 1st multi-manager investment trust
strong brands:
opportunity: portfolio & business development

13
First Impressions
Financials– Performance– Dividend– Discount– Debt Repurchase– Total Expense Ratio
Business Development– Witan Investment Services– New Business Development
2009 AGM
14
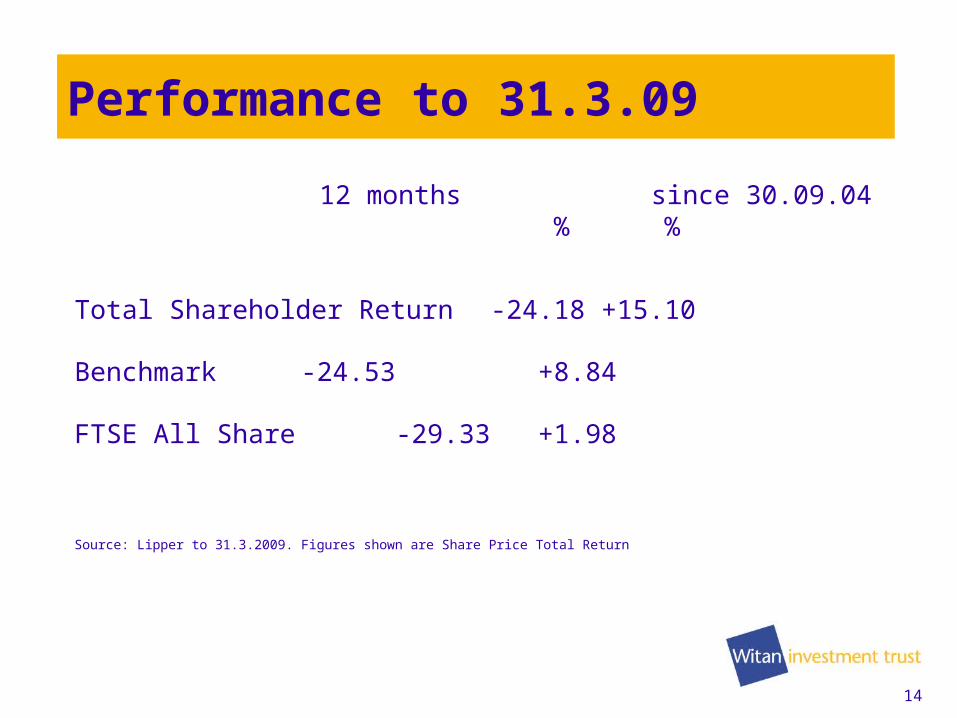
Performance to 31.3.09
12 months since 30.09.04 % %
Total Shareholder Return -24.18 +15.10
Benchmark -24.53 +8.84
FTSE All Share -29.33 +1.98
Source: Lipper to 31.3.2009. Figures shown are Share Price Total Return

15
Dividend
revenue reserves of £52.3m
2.4x covered
34th successive year of increase
Source: Witan to 31.12.2008. Rebased to 7.4p (Witan’s dividend in 1998)
16
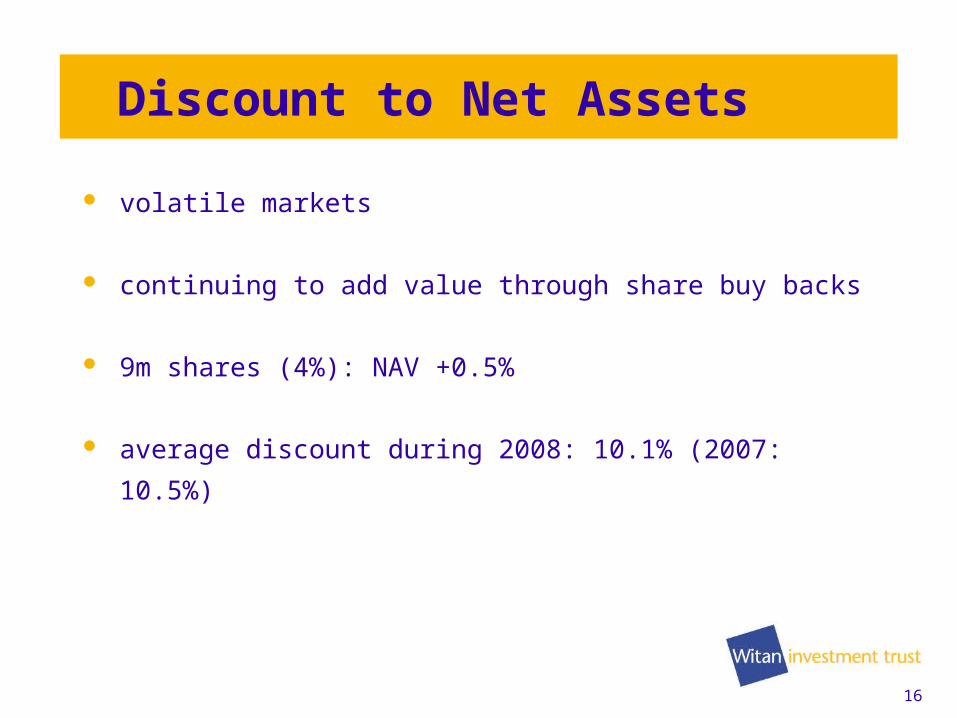
Discount to Net Assets
volatile markets
continuing to add value through share buy backs
9m shares (4%): NAV +0.5%
average discount during 2008: 10.1% (2007: 10.5%)
17
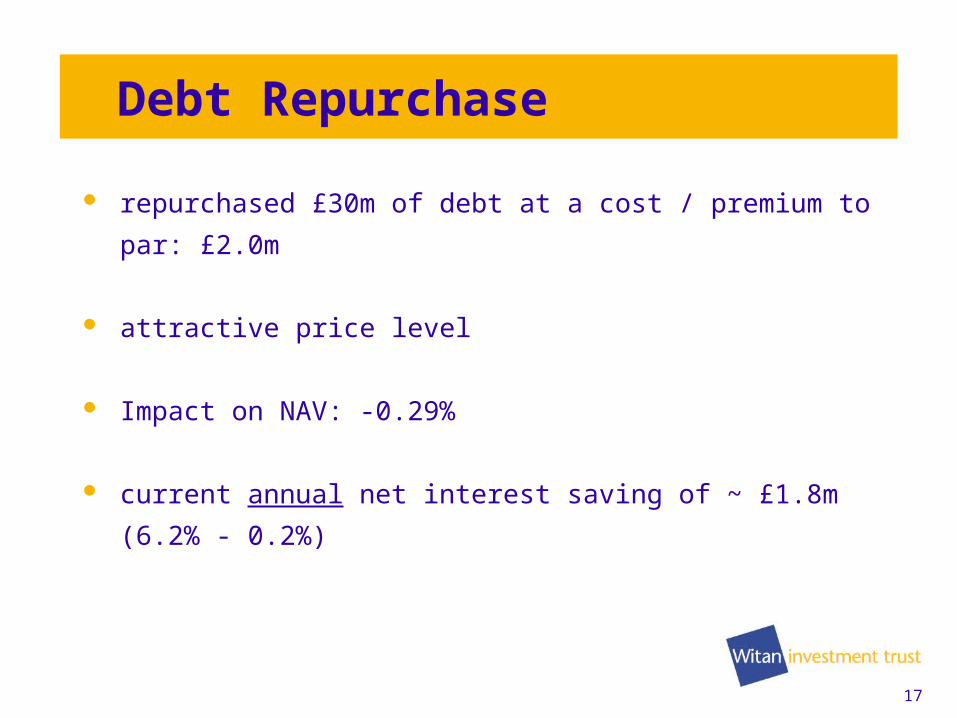
Debt Repurchase
repurchased £30m of debt at a cost / premium to par: £2.0m
attractive price level
Impact on NAV: -0.29%
current annual net interest saving of ~ £1.8m (6.2% - 0.2%)

18
Total Expense Ratio
2008
2007
TER 0.71%
0.53%
Performance Fees £1.4m £0.5m
Other Costs £6.0m
£6.3m
Av. Shareholders’ Funds £1.05bn £1.28bn

19
First Impressions
Financials
Business Development– Witan Investment Services– New Business Development
2009 AGM
20
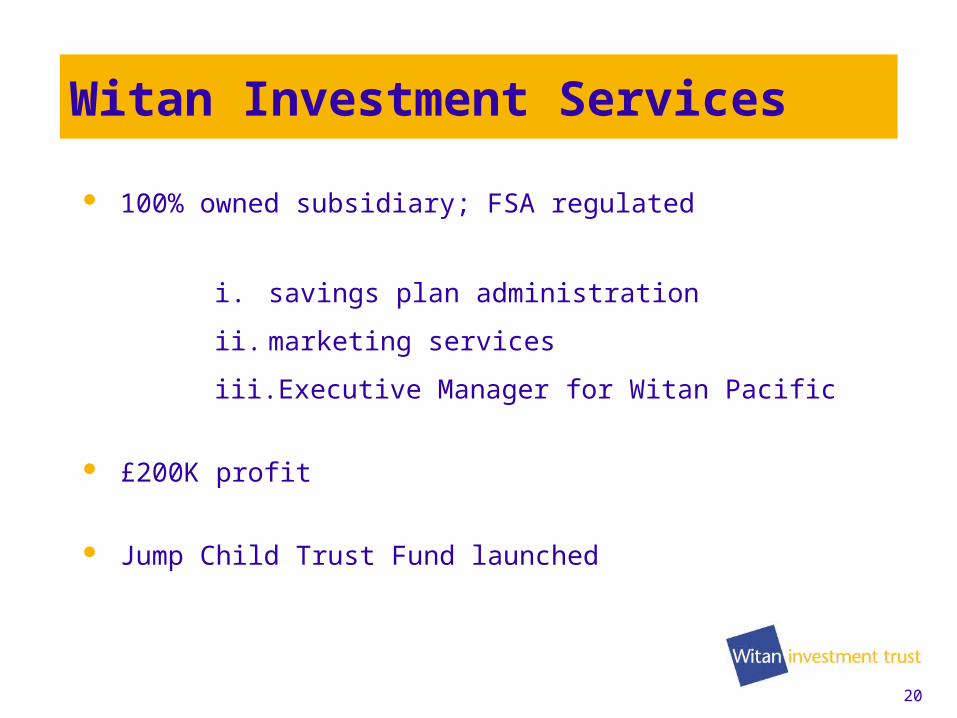
Witan Investment Services
100% owned subsidiary; FSA regulated
i. savings plan administration
ii. marketing services
iii. Executive Manager for Witan Pacific
£200K profit
Jump Child Trust Fund launched
21
Business Development: Why?
to generate additional value:
– income stream
– capital value
– discount
to enhance core business resources
to increase demand for shares
22
Business Development: How?
capitalise on key skills and abilities:
1. manager selection & multi-manager portfolio
construction
2. investment trust administration
new executive management mandates
seek relevant investment opportunities

23
First Impressions
Financials
Business Development
2009 AGM

Witan Investment Trust plc
Mark LynamChief Investment Officer

25
Investment Managers
Multi-manager process
Manager changes in 2008
Update on 2009

26
Witan Manager Selection Process
Questionnaire
Witan database
Qualitative
Appointment
Ongoing Monitoring
Extensive universe of managers
Face to face interviews
Basis to enable comparisons
Agree mandate and negotiate fees
Written reports, performance analysis

27
Manager Changes – Why?
Investment driven increase / decrease a new region
diversification
Manager driven
poor performance
style drift
corporate / manager change
28
Managers in 2008
currency fund redeemed
three new managers:
- Artemis
- Marathon
- Varenne
UK Enhanced Index reduced to 16% from 32%
9 out of 13 managers outperformed their benchmarks in
2008

29
Manager Quartile Rankings 2008 Manager 2008 Since Inception
Quartile Quartile
Thomas White 1st 1st
MFS 1st 1st
Southeastern 2nd 4th
Artemis 1st 1st
Marathon 1st 1st
Henderson UK Enhanced 2nd 1st
Henderson Small Cap 3rd 2nd
Wellington Management 2nd 4th
Varenne 3 rd 3rd
Henderson North America 1st 1st
Brandes 1st 1st
Comgest 1st 1st
Orbis 4th 4th
Source: Witan / Lipper as at 31.12.08
30
– overvaluation comes to an endBOK BOO\KER ORD GBX
Apr-08May-08 Jun-08 Jul-08 Aug-08 Sep-08 Oct-08 Nov-08 Dec-08 Jan-09 Feb-09 Mar-0916
18
20
22
24
26
28
30
32
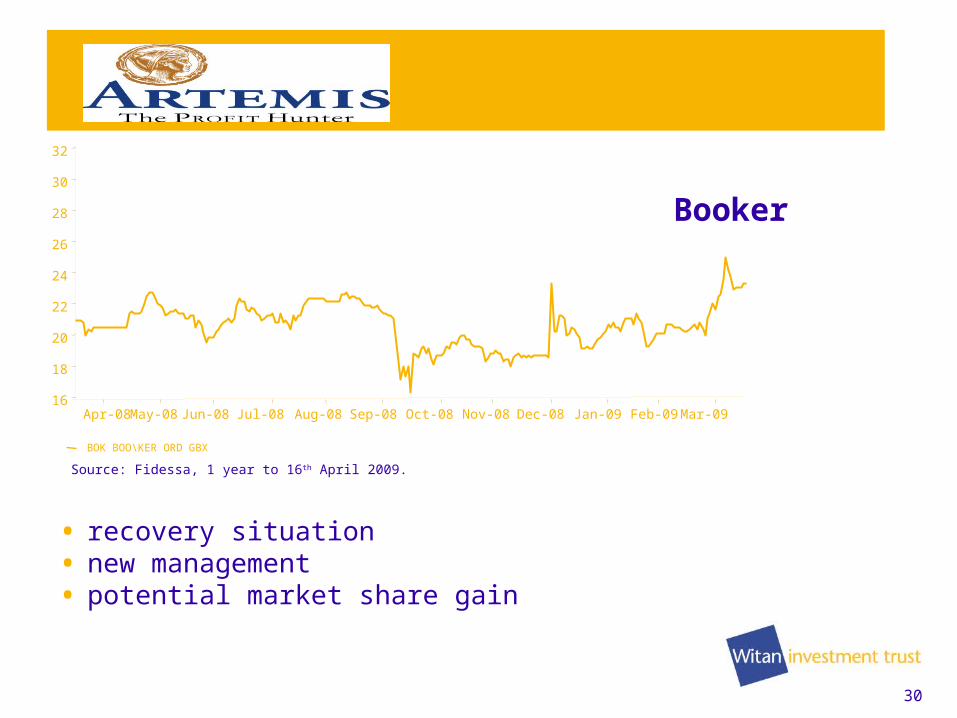
Source: Fidessa, 1 year to 16th April 2009.
• recovery situation • new management • potential market share gain
Booker

31
0
150
300
450
600
750
Dec-99 Apr-01 Aug-02 Dec-03 Apr-05 J ul-06 Nov-07 Mar-09
● dynamic management● double number of new
products● consistently outperformed
Share price relative to MSCI Europe
Reckitt Benckiser
32
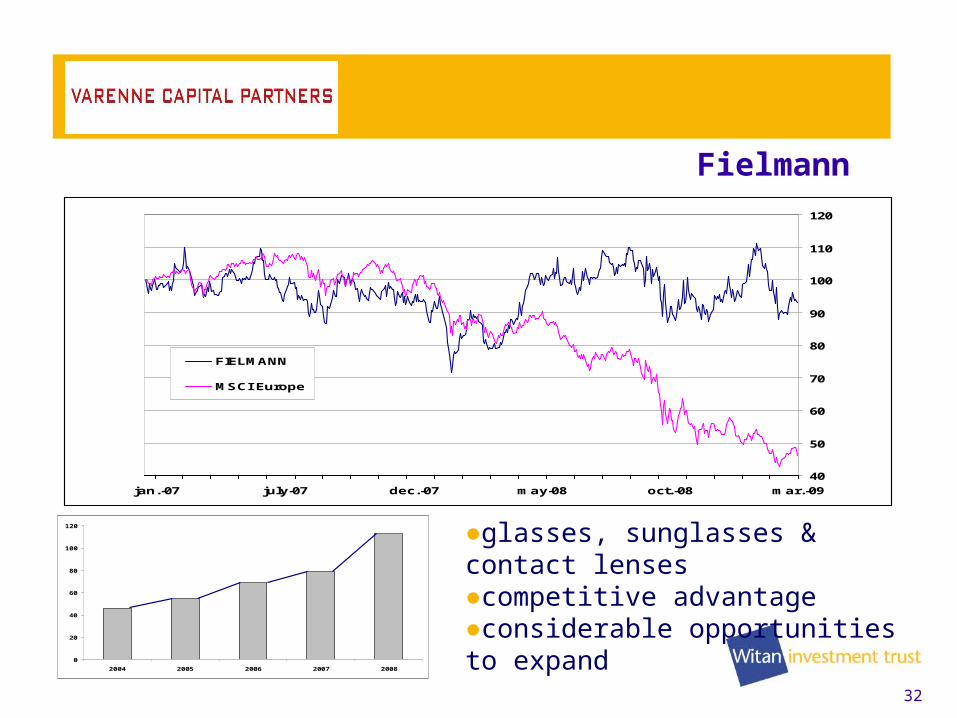
.
40
50
60
70
80
90
100
110
120
mar.-09oct.-08may-08dec.-07july-07jan.-07
FIELMANN
MSCI Europe
0
20
40
60
80
100
120
2004 2005 2006 2007 2008
+18.80%
+25.45%
+14.51%
+42.89%
●glasses, sunglasses & contact lenses●competitive advantage●considerable opportunities to expand
Fielmann

33
Progress in Q1 2009
8 out of 13 managers outperformed their benchmarks
prudent use of gearing
● added to Artemis and Marathon
● tactical investment in corporate bonds
● PIMCO

34
Witan Investment Services 201 Bishopsgate
London EC2M 3AE Tel: 020 7227 9770
Fax: 020 7227 9771
This document may not be reproduced in any form without the express permission of Witan Investment Services Limited and to the extent that it is passed on care must be taken to ensure that this reproduction is in a form which accurately reflects the information presented here. Whilst Witan Investment Services Limited believe that the information is correct at the date of production, no representation, warranty or undertaking, express or implied, is given as to the accuracy or completeness of the information or opinions in this document by any of Witan Investment Services Limited or their respective directors and no responsibility or liability is accepted by such persons for the accuracy or completeness of any such information or opinions or for any action taken on the basis of the contents of this document. No reliance may be placed for any purpose on the information and opinions contained in this document or their accuracy or completeness.
This document has been produced based on Witan Investment Services’ research and analysis and represents our house view. The information is made available to clients only incidentally. Unless otherwise indicated, the source for all data is Witan Investment Services. Any reference to individual companies is purely for the purpose of illustration and should not be construed as a recommendation to buy or sell or advice in relation to investment, legal or tax matters. Witan Investment Services (201 Bishopsgate, London EC2M 3AE) is authorised and regulated by the Financial Services Authority to provide investment products and services. We may record telephone calls for our mutual protection and to improve customer service.
This document does not constitute or form part of any offer or solicitation to issue, sell, subscribe or purchase any investment, nor shall it or the fact of its distribution form the basis of, or be relied on in connection with, any contract for the same.
Please remember that past performance is not a guide to future performance. The value of an investment and the income from it can fall as well as rise as a result of market and currency fluctuations and you may not get back the amount originally invested. Tax assumptions may change if the law changes and the value of tax relief will depend on individual circumstances.