wisem ney - smc trade online€¦ · representatives gave final approval last week to the biggest...
TRANSCRIPT

WISE M NEY
MAY SANTA BRING A BAG FULL OFHAPPINESS AND PROSPERITY FOR YOU.
Merry Christmas
2017: Issue 611, Week: 25th - 28th DecemberA Weekly Update from SMC
(For private circulation only)
Bra
nd s
mc
435


From The Desk Of Editor
(Saurabh Jain)
SMC Global Securities Ltd. (hereinafter referred to as “SMC”) is a registered Member of National Stock Exchange of India Limited, Bombay Stock Exchange Limited and its associate is member of MCX stock Exchange Limited. It is also registered as a Depository Participant with CDSL and NSDL. Its associates merchant banker and Portfolio Manager are registered with SEBI and NBFC registered with RBI. It also has registration with AMFI as a Mutual Fund Distributor.
SMC is a SEBI registered Research Analyst having registration number INH100001849. SMC or its associates has not been debarred/ suspended by SEBI or any other regulatory authority for accessing /dealing in securities market.
SMC or its associates including its relatives/analyst do not hold any financial interest/beneficial ownership of more than 1% in the company covered by Analyst. SMC or its associates and relatives does not have any material conflict of interest. SMC or its associates/analyst has not received any compensation from the company covered by Analyst during the past twelve months. The subject company has not been a client of SMC during the past twelve months. SMC or its associates has not received any compensation or other benefits from the company covered by analyst or third party in connection with the research report. The Analyst has not served as an officer, director or employee of company covered by Analyst and SMC has not been engaged in market making activity of the company covered by Analyst.
The views expressed are based solely on information available publicly available/internal data/ other reliable sources believed to be true.
SMC does not represent/ provide any warranty express or implied to the accuracy, contents or views expressed herein and investors are advised to independently evaluate the market conditions/risks involved before making any investment decision.
lobal stock markets gained in penultimate week of the year with diminishing
Gvolatility, strong global growth and optimism around the globe. U.S. markets rose
after the sweeping tax cut bill got passed in congress bringing cheer to the
market that it would further give the impetus to the economy. In the monetary policy
review meeting, Bank of Japan (BoJ) maintained monetary stimulus and kept interest rates
unchanged in view of the healthy economic growth and inflation moving in desired
direction. Japanese trade data showed firm external demand as exports rose in November
for a twelfth straight month by 16.2 percent and imports rose by 17.2 percent.
Back at home, Indian markets saw steep selling in the initial hour on Monday when the vote
counting of Gujarat state election begun but later gained ground when the tally of seats
tilted towards the win for Bharitya Janta Party (BJP). The win was not that easy for BJP as
earlier perceived and now it is expected the government will respond with some populist
measures ahead of some state elections and general election in 2019. Meanwhile, the
Minutes of the December 6 policy meeting show that Reserve Bank of India (RBI) MPC
minutes has raised concerns over rising global oil prices and inflation in the country. The
proceedings of the ongoing winter session of the Parliament will be closely watched. The
government has a slew of important Bills on its agenda in this session. Macroeconomic data,
trend in global markets, investment by foreign portfolio investors (FPIs) and domestic
institutional investors (DIIs), the movement of rupee against the dollar and crude oil price
movement will dictate trend on the bourses in the truncated week ahead. The stock
markets remain closed on Monday, 25 December 2017, on account of Christmas holiday.
On the commodity market front, recovery in bullion counter at lower level can be seen on
weaker greenback. However, low volume across the financial markets will be seen amid
upcoming Christmas and New Year holidays. The Republican controlled U.S. House of
Representatives gave final approval last week to the biggest overhaul of the U.S. tax code in
30 years. Back at home, upside in gold should be limited on appreciation in rupee. In the
energy counter, crude appears to be well supported by supply side disruptions and falling
inventories. Base metal counter is expected to witness further upside on supply side
constraints. Seasonally strong demand, mines closures along with decreasing inventories at
LME tracked warehouses are likely to support the prices. This week US pending home sales,
Chicago PMI, consumer confidence data are expected to give further direction to the
prices.
Contents
Equity 4-7
Derivatives 8-9
Commodity 10-13
Currency 14
IPO 15
FD Monitor 16
Mutual Fund 17-18
SMC GLOBAL SECURITIES LTD.
REGISTERED OFFICES:
11 / 6B, Shanti Chamber, Pusa Road, New Delhi 110005.
Tel: 91-11-30111000, Fax: 91-11-25754365
MUMBAI OFFICE:
Lotus Corporate Park, A Wing 401 / 402 , 4th Floor ,
Graham Firth Steel Compound, Off Western Express Highway,
Jay Coach Signal, Goreagon (East) Mumbai - 400063
Tel: 91-22-67341600, Fax: 91-22-67341697
KOLKATA OFFICE:
18, Rabindra Sarani, Poddar Court, Gate No-4,5th Floor, Kolkata-700001
Tel.: 033 6612 7000/033 4058 7000, Fax: 033 6612 7004/033 4058 7004
AHMEDABAD OFFICE :
10/A, 4th Floor, Kalapurnam Building, Near Municipal Market,
C G Road, Ahmedabad-380009, Gujarat
Tel : 91-79-26424801 - 05, 40049801 - 03
CHENNAI OFFICE:
Salzburg Square, Flat No.1, III rd Floor, Door No.107, Harrington Road,
Chetpet, Chennai - 600031.
Tel: 044-39109100, Fax -044- 39109111
SECUNDERABAD OFFICE:
315, 4th Floor Above CMR Exclusive, BhuvanaTower,
S D Road, Secunderabad, Telangana-500003
Tel : 040-30031007/8/9
DUBAI OFFICE:
2404, 1 Lake Plaza Tower, Cluster T, Jumeriah Lake Towers,
PO Box 117210, Dubai, UAE
Tel: 97145139780 Fax : 97145139781
Email ID : [email protected]
NEW YORK OFFICE:
Alliance Bernstein Building
1345 Avenue of the Americas
Second Floor, New York, NY 10105
Phone: (212) 878-3684
Toll-Free: (855) 589-1915
Fax: (866) 852-4236
Printed and Published on behalf of
Mr. Saurabh Jain @ Publication Address
11/6B, Shanti Chamber, Pusa Road, New Delhi-110005
Website: www.smcindiaonline.com
Investor Grievance : [email protected]
Printed at: S&S MARKETING102, Mahavirji Complex LSC-3, Rishabh Vihar, New Delhi - 110092 (India)
Ph.: +91-11- 43035012, 43035014, Email: [email protected]

NEWS
DOMESTIC NEWSCapital Goods• ABB India has won an order worth Rs 134 crore to supply state-of-the-art
traction equipment for electric locomotives, manufactured by Chittaranjan Locomotive works (CLW). ABB will deliver traction converters, standalone auxiliary converters and vehicle control units for 64 electric locomotives which will be used for passenger and freight operations.
• Havells India launched unique water purifiers that maintains the pH balance in water and adds a wide range of naturally occurring essential minerals and trace elements that are lost during the reverse osmosis (RO) process. With this launch, the company entered the not so penetrated water purifier segment with six product variants that are priced between Rs. 10,499 and Rs. 23,999.
• KEC International has won new orders worth Rs 2,424 crore across all business verticals. The company has got orders worth Rs 1,636 crore across India, SAARC, Africa and the Americas for its transmission and distribution business. The cable business won various orders worth Rs 115 crore. Railway and civil businesses received job contracts worth of Rs 595 crore and Rs 78 crore, respectively.
Power • Reliance Infrastructure announced the signing of Definitive Binding
Agreement with Adani Transmission Limited (ATL) for 100% stake sale of its Mumbai Power Business which includes integrated business of generation, transmission and distribution of power for Mumbai. Total Deal value is at Rs. 13,251 crore. This comprises of business valued at Rs. 12,101 crore and regulatory assets approved so far of Rs. 1,150 crore.
Realty/ Construction• Gayatri Projects has secured a Rs 1339 crore contract in joint venture with
public joint stock company 'Kyivmetrobud' i.e. Gayatri-KMB (JV) from National Highways Authority of India for construction of stand along ring road/ bypass around Jammu City in the state of Jammu and Kashmir.
• Dilip Buildcon has been awarded two new EPC projects valued at Rs. 517.81 crore by Ircon International. The first project is worth Rs 148.28 crore against bid price of Rs 157.23 crore and second is Rs 378.56 crore against bid price of Rs 360.58 crore. Both projects will be completed in 24 months.
Pharmaceuticals• Suven Life Sciences has secured the product patents from Canada and
India for the New Chemical Entities (NCEs) for the treatment of disorders associated with Neurodegenerative diseases and these Patents are valid through 2034 and 2028 respectively.
Chemical• NOCIL board has approved an in-principle CAPEX proposal of Rs 168 crore -
Phase 2 for expansion of its production facilities for rubber chemicals at Dahej / Navi Mumbai. The said investment is expected to be maintain the asset turnover ration of 2:1. The said capex is expected to be completed during Q1 FY 2019-20.
Auto Ancillaries• Amara Raja Batteries has commissioned its two wheeler battery plant at
the Amara Raja Growth Corridor in Chittoor, Andhra Pradesh. The first phase of the plant which was commissioned will have a capacity of 5 million units. The plant will have an ultimate capacity of 17 million units with an estimated investment of Rs 700 crore taking the total capacity for two wheeler batteries to 29 million.
Finance• HDFC has approved the sale of 100% of its equity share capital of HDFC
Developers and HDFC Realty to Quikr India for a total consideration of Rs 101.99 crore and Rs 254.98 crore respectively.
Metals• Tata Steel board had approved a Rs 23,500-crore capital expenditure plan
to expand the capacity of its Kalinganagar facility by 5 million tonnes per annum (MTPA) to 8 MTPA.
INTERNATIONAL NEWS US leading economic index climbed by 0.4 percent in November after
jumping by 1.2 percent in October. Economists had expected the index to rise by 0.3 percent.
US real gross domestic product surged up by 3.2 percent in the third quarter compared to the previously estimated 3.3 percent jump. Economists had expected the pace of growth to be unrevised.
US initial jobless claims climbed to 245,000, an increase of 20,000 from the previous week's unrevised level of 225,000. Economists had expected jobless claims to rise to 234,000.
US existing home sales soared by 5.6 percent to an annual rate of 5.81 million in November from an upwardly revised 5.50 million in October. Economists had expected existing home sales to rise to a rate of 5.52 million from the 5.48 million originally reported to the previous month.
US industrial production edged up by 0.2 percent in November after jumping by an upwardly revised 1.2 percent in October. Economists had expected production to climb by 0.3 percent compared to the 0.9 percent increase originally reported for the previous month.
Ex-Date Company Purpose
26-Dec-17 Jindal Worldwide Face Value Split (Sub-Division) - From
Rs 10/- Per Share To Rs 5/- Per Share
28-Dec-17 Shalimar Paints Rights 6:32 @ Premium Rs 138/-
Meeting Date Company Purpose
26-Dec-18 Canara Bank Raising funds through Debt Instr.,
Issue of Equity Shares, Qualified
Institutions Placements
26-Dec-18 Pidilite Inds. Buy Back
26-Dec-18 Pun. & Sind Bank Raising of Capital
27-Dec-18 Sandur Manganese Interim Dividend
28-Dec-18 CHD Chemicals Preferential Issue
29-Dec-18 Ruchika Inds. Stock Split
3-Jan-18 Sanwaria Consumer Results/Others
04-Jan-18 G M Breweries Quarterly Results
06-Jan-18 Goa Carbon Quarterly Results
12-Jan-18 3i Infotech Quarterly Results
12-Jan-18 Infosys Quarterly Results,Others
16-Jan-18 ICICI Lombard Quarterly Results
19-Jan-18 Kansai Nerolac Quarterly Results
20-Jan-18 Gruh Finance Results
22-Jan-18 Axis Bank Quarterly Results
23-Jan-18 WABCO India Quarterly Results
27-Jan-18 Persistent Sys Quarterly Results
29-Jan-18 H D F C Quarterly Results
30-Jan-18 Mahindra Life. Quarterly Results
FORTHCOMING EVENTS
NOTES:1) These levels should not be confused with the daily trend sheet, which is sent every morning by e-mail in the name
of "Morning Mantra ".2) Sometimes you will find the stop loss to be too far but if we change the stop loss once, we will find more strength
coming into the stock. At the moment, the stop loss will be far as we are seeing the graphs on weekly basis and taking a long-term view and not a short-term view.
TREND SHEET
Stocks *Closing Trend Date Rate SUPPORT RESISTANCE Closing
Price Trend Trend S/l
Changed Changed
S&P BSE SENSEX 33940 UP 18.11.16 25627 32350 31850
NIFTY50 10493 UP 27.01.17 8641 10000 9850
NIFTY IT 11501 UP 21.07.17 10712 11000 10800
NIFTY BANK 25649 UP 27.01.17 19708 24600 24100
ACC 1722 DOWN 01.12.17 1677 1750 1780
BHARTIAIRTEL 529 UP 13.10.17 431 480 460
BPCL 535 UP 18.10.17 514 480 470
CIPLA 601 DOWN 15.12.17 576 610 620
SBIN 320 UP 27.10.17 311 310 300
HINDALCO 268 UP 22.12.17 268 245 235
ICICI BANK 317 UP 27.10.17 301 305 295
INFOSYS 1039 UP 13.04.17 1010 980 960
ITC 263 DOWN 21.07.17 289 270 275
L&T 1266 UP 13.01.17 959 1200 1170
MARUTI 9700 UP 06.01.17 5616 9000 8700
NTPC 180 UP 04.08.17 177 173 170
ONGC 193 UP 27.10.17 184 180 176
RELIANCE 920 UP 23.06.17 718 880 850
TATASTEEL 711 UP 19.05.17 490 660 640
4
Closing as on 22-12-2017
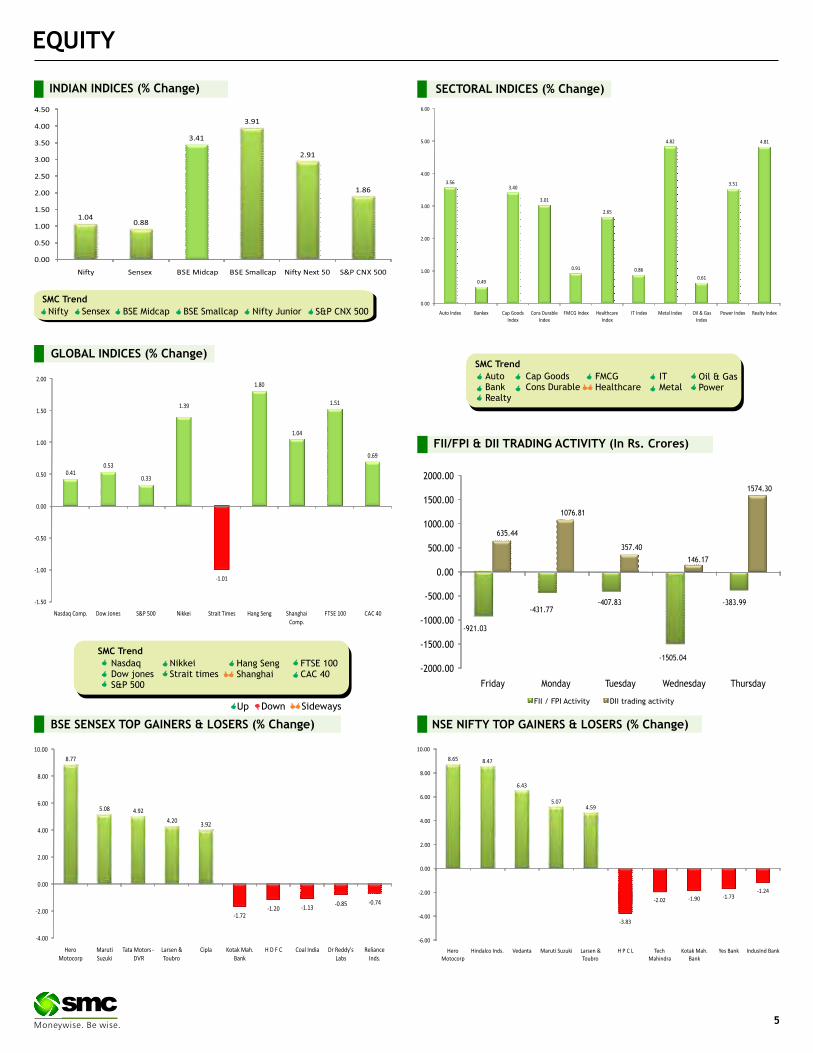
BSE SENSEX TOP GAINERS & LOSERS (% Change) NSE NIFTY TOP GAINERS & LOSERS (% Change)
SECTORAL INDICES (% Change)
SMC Trend
FMCGHealthcare
Auto BankRealty
Cap GoodsCons Durable
Oil & GasPower
ITMetal
Down SidewaysUp
GLOBAL INDICES (% Change)
INDIAN INDICES (% Change)
SMC Trend
Nifty Sensex BSE Midcap BSE Smallcap Nifty Junior S&P CNX 500
SMC Trend
FTSE 100CAC 40
NasdaqDow jonesS&P 500
NikkeiStrait times
Hang SengShanghai
FII/FPI & DII TRADING ACTIVITY (In Rs. Crores)
5
FII / FPI Activity DII trading activity
-1505.04

Beat the street - Fundamental Analysis
Source: Company Website Reuters CapitalineAbove calls are recommended with a time horizon of 8 to 10 months.
Investment Rationale Marico's principal products include edible oils and
value added hair oils. The Company's geographic segments include India and International, which includes primarily the Middle East, The South Asian Association for Regional Cooperation (SAARC) countries, Egypt, Myanmar, Malaysia, South Africa and Vietnam. It offers various brands in the categories of hair care, skin care, health foods, male grooming and fabric care.
Marico plans to develop a range of brands which would be available for online sales over the next few years. The company believes that the digitisation in the consumer packaged space is a huge opportunity for long term growth and to tap the same, it has created a new team, the Engine 2, focussed on creating and incubating new categories.
It recently test-launched a meal replacement beverage, Saffola Nutri-Shake, a digital-only product, currently being tested internally. The company has invested significantly into this initiative and has also integrated the supply chain.
Marico is a market leader in the coconut hair oil and premium edible oil categories with market share of 59% and 67% respectively. Leveraging its strong brand equity, Marico has entered the high growth categories, i.e. value added hair oils (VAHO), body lotions, deodorant, hair serum & colours and breakfast cereals through brand extension and acquisitions.
The management expects that the company would benefit from the deduction of Good and
Service Tax (GST) from 28% to 18% as it would spur demand and provide opportunities for the company to grow.
Marico is expanding its food product portfolio by entering the Rs 450-crore soups segment under the Saffola brand. The move is part of its strategy to launch healthy, in-between snacks and at the same time, add premium products to its portfolio as it targets a 70% increase in revenue to Rs 10,000 crore by 2020.
ValuationFactors such as strong brand equity in its flagship brands, extension into higher growth and underpenetrated categories, revival in discretionary demand and improving economic scenario and unorganized market are likely to benefit the company. Thus, it is expected that the company would see good growth going forward and the stock will see a price target of Rs.390 in 8 to 10 months time frame on a target P/E of 22.65x and FY19 (E) earnings of Rs.7.8.
P/B Chart
Face Value (`) 1.00
52 Week High/Low 347.80/238.55
M.Cap (` in Cr.) 40807.73
EPS (`) 6.07
P/E Ratio (times) 52.08
P/B Ratio (times) 14.88
Dividend Yield (%) 1.11
Stock Exchange BSE
` in cr
% OF SHARE HOLDING
VALUE PARAMETERS
ACTUAL ESTIMATE
FY MAR-17 FY MAR-18 FY MAR-19REVENUE 5,918.00 6,480.50 7,401.10EBITDA 1,159.30 1,214.90 1,438.30EBIT 1,069.00 1,095.80 1,305.20NET INCOME 798.60 844.50 1,007.70EPS 6.20 6.55 7.80BVPS 18.03 20.17 22.52ROE 36.78 34.23 36.45
MARICO LIMITED CMP: 316.15 Upside:23%Target Price: 390.00
6
ESSEL PROPACK LIMITED CMP: 292.20 Upside:23%Target Price: 361.00
Investment Rationale Essel Propack Limited (EPL) is a leading
manufacturer globally of Laminated Plastic Tubes and Laminates. Its products are extensively used in the packaging of products across categories such as Beauty & Cosmetics, Pharma & Health, Foods, Home and Oral care. The FMCG and Pharma industry which consume the Company’s products continue to offer sustained growth opportunity for the Company.
The company has plans for expansions in Assam due to the prevailing tax benefits. Expansion will be more on a tolling model.
In the quarter ended September 2017, the company has seen some recovery in India and healthy growth in the American region. Also Egypt and EAP (East Asia. Pacific) continued to do well.
The company is in the process of developing digital technology to seamlessly integrate the customers’ artwork with its production lines. This will reduce the lead time for new product launch. In future, the same technology can be extended in providing full visibility, quality validation by customers and first time right capability.
The company’s recent acquisition of Essel Deutschland Germany (EDG) will help EPL unlock synergies such as enhanced cross-selling opportunity in the German market, sourcing flexibility and better capacity utilisation at all of its Europe plants.
The management is confident of converting opportunities into orders and hence would add to value growth. It is expected that the restructuring in different geographies, plus robust demand
from the FMCG sector, coupled with company’s dominant position with limited competitors will lead healthy growth.
The company has AA rating for long-term debt and top rating for short-term debt were both reaffirmed by Care and India Rating during the quarter ended September 2017. The company has been active in raising funds on its top-rated commercial paper to benefit from attractive market interest rates.
ValuationDriven by innovation and technology, the company continues to grow offering smart packaging solutions to replace traditional packaging forms like bottles, metal and plastic tubes both in existing categories and in newly emerging categories and applications from food to pharmaceuticals to lifestyle. Thus, it is expected that the company would see good growth going forward and the stock will see a price target of Rs.361 in 8 to 10 months time frame on a target P/E of 22x and FY19 (E) earnings of Rs.16.4.
Face Value (`) 2.00
52 Week High/Low 317.00/226.00
M.Cap (` in Cr.) 4594.52
EPS (`) 11.30
P/E Ratio (times) 25.87
P/B Ratio (times) 4.08
Dividend Yield (%) 0.82
Stock Exchange BSE
% OF SHARE HOLDING
P/E Chart
` in cr
Actual Estimate FY Mar-17 FY Mar-18 FY Mar-19Revenue 2,302.30 2,528.80 2,838.30Ebitda 441.60 493.40 574.70Ebit 300.20 337.70 419.70Net Income 190.30 207.60 261.40EPS 12.05 13.14 16.40BVPS 66.11 77.82 90.11RoE 17.43 17.74 19.19
VALUE PARAMETERS
Foreign
Institutions
Non Promoter Corporate Holding
Promoters
Public & Others
Foreign
Institutions
Non Promoter Corporate Holding
Promoters
Public & Others
Charts by Spider Software India Ltd
EQUITY
Above calls are recommended with a time horizon of 1-2 months
Disclaimer : The analyst and its affiliates companies make no representation or warranty in relation to the accuracy, completeness or reliability of the information contained in its research. The analysis contained in the analyst research is based on numerous assumptions. Different assumptions could result in materially different results.The analyst not any of its affiliated companies not any of their, members, directors, employees or agents accepts any liability for any loss or damage arising out of the use of all or any part of the analysis research.
SOURCE: CAPITAL LINE
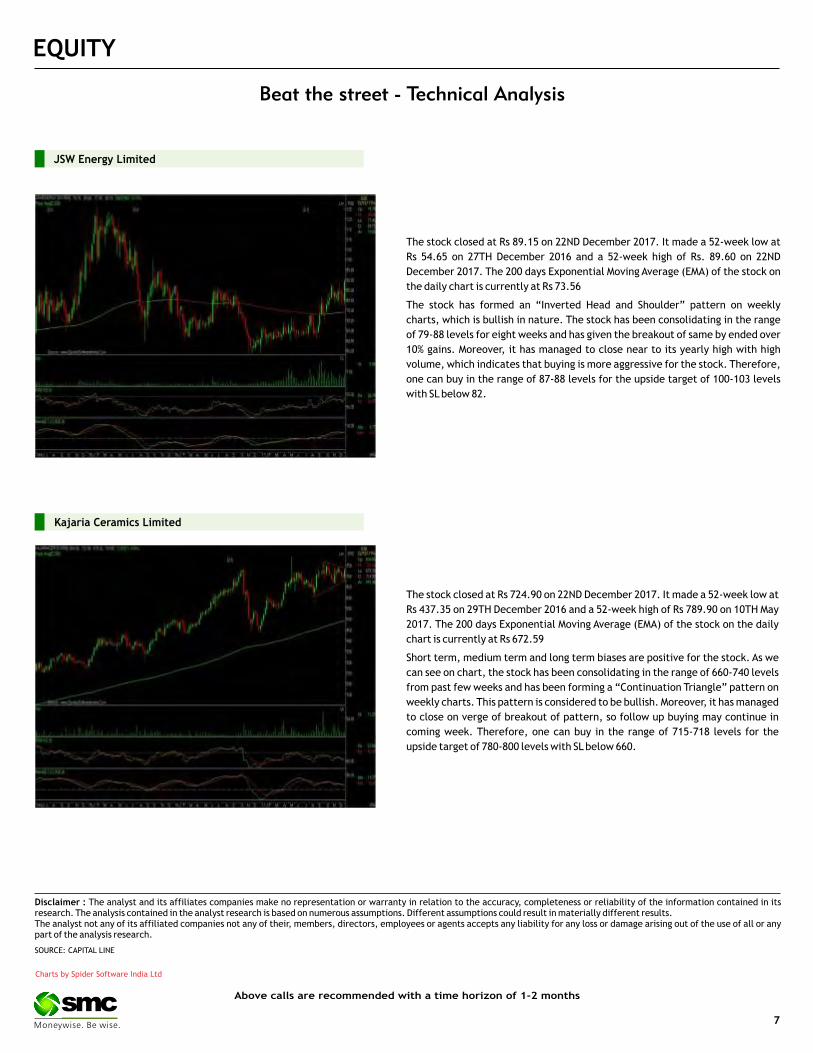
The stock closed at Rs 89.15 on 22ND December 2017. It made a 52-week low at
Rs 54.65 on 27TH December 2016 and a 52-week high of Rs. 89.60 on 22ND
December 2017. The 200 days Exponential Moving Average (EMA) of the stock on
the daily chart is currently at Rs 73.56
The stock has formed an “Inverted Head and Shoulder” pattern on weekly
charts, which is bullish in nature. The stock has been consolidating in the range
of 79-88 levels for eight weeks and has given the breakout of same by ended over
10% gains. Moreover, it has managed to close near to its yearly high with high
volume, which indicates that buying is more aggressive for the stock. Therefore,
one can buy in the range of 87-88 levels for the upside target of 100-103 levels
with SL below 82.
JSW Energy Limited
The stock closed at Rs 724.90 on 22ND December 2017. It made a 52-week low at
Rs 437.35 on 29TH December 2016 and a 52-week high of Rs 789.90 on 10TH May
2017. The 200 days Exponential Moving Average (EMA) of the stock on the daily
chart is currently at Rs 672.59
Short term, medium term and long term biases are positive for the stock. As we
can see on chart, the stock has been consolidating in the range of 660-740 levels
from past few weeks and has been forming a “Continuation Triangle” pattern on
weekly charts. This pattern is considered to be bullish. Moreover, it has managed
to close on verge of breakout of pattern, so follow up buying may continue in
coming week. Therefore, one can buy in the range of 715-718 levels for the
upside target of 780-800 levels with SL below 660.
Kajaria Ceramics Limited
7

DERIVATIVES
CHANGE IN NIFTY OPTION OI (IN QTY)
WEEKLY VIEW OF THE MARKET
NIFTY OPTION OI CONCENTRATION (IN QTY)
CHANGE IN BANKNIFTY OPTION OI (IN QTY) (MONTHLY)BANKNIFTY OPTION OI CONCENTRATION (IN QY) (MONTHLY)
The Market undertone remained bullish with support of consistent short covering and long buildup. Derivative data indicate bullish scenario to continue.
Nifty has multiple strong supports at lower levels. Various supports are 10420, 10450 & 10400 spot levels. We will see short covering on every dip. Put
writers were active in recent rally. We have seen put writing in 10300 & 10400 puts and unwinding in calls. Among Nifty Call options, the 10500-strike call
has the highest open interest of more than 55 lakh shares, however we have seen unwinding in recent rally indicating upside to continue. The Implied
Volatility (IV) of calls was down and closed at 10.72% while that for put options closed at 10.12%. The Nifty VIX for the week closed at 12.09% and is
expected to remain sideways. In put side 10400-strike put has the highest open interest of over 60 lakh shares in open interest respectively. The PCR OI
for the week closed up at 1.28 which indicates OTM put writing. On the technical front, 10420-10450 spot levels is strong support zone and current trend
is likely to continue towards 10580-10600 levels.
In lakhs
In 10000 In 10000
GRANULES (DEC FUTURE)
Buy: Above `135
Target: `142
Stop loss: `131
COALINDIA
BUY DEC 265. PUT 2.05SELL DEC 260. PUT 0.60
LOT SIZE: 1700BEP: 263.55
MAX. PROFIT: 6035.00 (3.55*1700)MAX. LOSS: 2465.00 (1.45*1700)
OPTIONSTRATEGY
FUTURE
CENTURYTEX
BUY DEC 1450. CALL 13.20SELL DEC 1500. CALL 4.20
Lot size: 550BEP: 1459.00
Max. Profit: 22550.00 (41.00*550)Max. Loss: 4950.00 (9.00*550)
DERIVATIVE STRATEGIES
MCX (DEC FUTURE)
Sell: Below `945
Target: `915
Stop loss: `965
BULLISH STRATEGY
DABUR
BUY DEC 355. CALL 3.85SELL DEC 360. CALL 1.95
LOT SIZE: 2500BEP: 356.90
MAX. PROFIT: 7750.00 (3.10*2500)MAX. LOSS: 4750.00 (1.90*2500)
CASTROLIND (DEC FUTURE)
Sell: Below `201
Target: `194
Stop loss: `205
BEARISH STRATEGY
Call Put Call Put
Call Put Call Put
8
In lakhs

DERIVATIVES
FII’s ACTIVITY IN DERIVATIVE SEGMENT
SENTIMENT INDICATOR (NIFTY)
21-Dec 20-Dec 19-Dec 18-Dec 15-Dec
NIFTY Discount/Premium 22.15 25.95 7.75 15.60 26.25
COST OF CARRY% 0.91 0.89 0.87 0.86 0.83
PCR(OI) 1.28 1.28 1.20 1.03 1.03
PCR(VOL) 1.22 1.30 1.38 1.06 1.17
A/D RATIO(Nifty 50) 0.96 0.70 4.10 1.83 2.40
A/D RATIO(All FO Stock)* 1.70 1.31 6.65 1.98 3.28
Implied Volatility 10.72 10.80 10.87 12.51 13.02
VIX 12.09 12.19 12.19 13.12 13.12
HISTORY. VOL 11.88 12.25 12.61 12.54 12.67
*All Future Stock
SENTIMENT INDICATOR (BANKNIFTY)
FII’S ACTIVITY IN NIFTY FUTURE
**The highest call open interest acts as resistance and highest put open interest acts as support.# Price rise with rise in open interest suggests long buildup | Price fall with rise in open interest suggests short buildup # Price fall with fall in open interest suggests long unwinding | Price rise with fall in open interest suggests short covering
#All Future Stock
21-Dec 20-Dec 19-Dec 18-Dec 15-Dec
NIFTY Discount/Premium 67.05 71.25 -8.35 16.15 69.95
COST OF CARRY% 0.91 0.89 0.87 0.86 0.83
PCR(OI) 1.42 1.49 1.44 1.38 1.45
PCR(VOL) 1.04 1.13 1.09 0.87 1.05
A/D RATIO(Nifty 50) 0.71 0.33 2.00 2.00 2.00
A/D RATIO(All FO Stock)* 1.00 0.29 2.14 4.50 3.40
Implied Volatality 12.12 13.38 14.21 13.67 14.26
VIX 12.09 12.19 12.19 13.12 13.12
HISTORY. VOL 14.28 14.71 15.00 15.30 15.50
9
In Cr. In Cr.
LTP % Price Change Open interest %OI Chng
RAMCOCEM 795.55 12.52% 820000 77.64%
PAGEIND 24790.05 9.27% 47700 56.91%
OFSS 4076.95 4.26% 92400 40.32%
DCBBANK 193.00 1.02% 6570000 30.71%
RELINFRA 504.90 11.96% 10580700 24.81%
PNB 173.85 1.16% 50337000 15.76%
VGUARD 233.45 1.06% 2892000 11.45%
CHENNPETRO 430.45 1.52% 2553000 8.89%
ARVIND 458.10 5.74% 7318000 8.64%
NHPC 29.65 4.04% 40797000 8.01%
LTP % Price Change Open interest %OI Chng
GODREJCP 991.50 -0.01% 2035200 21.37%
MOTHERSUMI 375.00 -0.28% 14756250 17.36%
JUSTDIAL 496.40 -0.48% 3381600 16.16%
MCX 962.30 -1.89% 2419000 12.20%
TATAPOWER 91.30 -0.16% 53181000 11.72%
GODFRYPHLP 991.30 -1.20% 686500 8.11%
BALRAMCHIN 142.45 -1.79% 18249000 7.86%
TECHM 493.00 -1.30% 12305700 6.46%
BANKINDIA 173.15 -2.64% 16740000 4.65%
HDFC 1702.70 -1.31% 12431500 2.07%
Top 10 short build upTop 10 long build up

10
SPICES
Soybean futures (Jan) may witness a consolidation in the range of 3030-3130 levels. As far as export of soy meal is concerned the pace of soy meal exports in January will give further direction to the counter. Presently, the Indian soy meal is now in disparity as compared to Argentine soy meal, which indicates that export demand for Indian soymeal may decline in coming months. Indian soy meal is tentatively priced at $389 per ton CIF Rotterdam as compared to $368 Argentina CIF Rotterdam (December) as on December 21, 2017. Refined soy oil futures (Jan) is expected to witness a correction towards 710-705 levels. The sentiments are bearish for this cooking oil in the benchmark Indore market amid poor demand. Further weak global cues and higher port stock of edible oils are also weighing on soy oil market. The monthly port and pipeline stock of soy oil is around 2 lakh tonnes and local supply from domestic soybean crushing is around 1.50 lakh tonnes whereas demand is 3 lakh tones, which means that supply is exceeding demand. CPO futures (Jan) may continue to decline to test 540 levels taking negative cues from the international markets. Malaysian palm oil futures is plunging on the Bursa Malaysia Derivatives as the inventory levels has risen to their highest in nearly two years, amid soft demand, while weakness in rival oils compounded the bleak picture. Mustard futures (Jan) is expected to trade sideways in the range of 3930-4010 levels. The upside may remain capped as millers are reluctant to procure this oilseed since they are facing disparity in crushing and also the sales of mustard oil and mustard cake is slow.
OIL AND OILSEEDS
OTHER COMMODITIES
Kapas futures (April) is expected to continue its one sided rally & test 1100-1150 levels. The sentiments are bullish amid good demand for quality cotton from buyers. Most buyers are actively covering their requirements on fear of shortage in quality lint and higher than anticipated rates later in the 2017/18 season. Secondly, both the production and productivity of cotton is affected this year with the incidence of pink boll-worm attack in cotton crop reaching the economic threshold level mostly in Gujarat, Karnataka, Maharashtra this year & the respective Agriculture Department has asking the farmers to destroy the crop. Chana futures (Mar) is likely to trade with an upside bias in the range of 3900-4100 levels. The sentiments of the market participants have again turned optimistic after the Centre decided to impose a 30% import duty on chana (chickpeas) and masur (lentils), with immediate effect. At this juncture, cautiousness is also advised as the counter will also face the selling pressure of fresh arrivals that has started in some parts of Maharashtra. The arrivals reaching at the market are from early sown verities, whereas peak season for Chana crop is Jan-Feb. Farmers in the country have sown chana over 9.62 million ha, 13.7% higher than the same period last year, according to data released by the agriculture ministry. Cotton oil seed cake futures (Jan) is likely to trade higher towards 1900-1920 levels. Spot cotton oil cake prices are on a gaining path on persisting demand from stockiest. Further the pink boll-worm attack in major growing areas of cotton is said to have downgraded the total cotton crop substantially from prior estimate & this has boosted the sentiments of the market participants.
Bullion counter is expected to witness lower level buying and weaker greenback and geopolitical tensions along with movement of greenback are likely to give further direction to the prices. Local currency rupee can move in the range of 63.6-64.5 levels. Gold can face resistance near $1300 levels in COMEX and 29100 levels in MCX while it has support near $1230 in COMEX and 27800 levels in MCX. Silver has key support near 36000 levels in MCX and $15.30 in COMEX; it has resistance near 39000 in MCX and $16.60 in COMEX. Trump's threat to withdraw aid for the countries, which have voted against his Jerusalem decision also clearly states that geopolitical tensions aren't going away anytime soon and they could support the metal price in the long-term. A rise in U.S. bond yields from optimism after lawmakers in the United States approved the biggest overhaul of the country's tax code in 30 years, also offered support to the greenback. The U.S. Congress averted a government shutdown just one day before federal funding was due to expire, sending Trump a bill to provide just enough money to keep agencies operating through Jan. 19. The U.S. economy grew at its fastest pace in more than two years in the third quarter, powered by robust business spending, and is poised for what could be a modest lift next year. This year saw physical silver demand fall to multi-year lows, despite strong industrial demand. According to the Silver Institute, industrial silver demand grew by 3.4% to 581.4 million ounces, but bars and coins slumped by more than a third to 130.1 million ounces in 2017.
BULLIONS
Crude oil prices may trade with upside bias as US inventory data and OPEC countries compliance regarding production cut to give support to the prices. Overall it can move in the range of 3500-3900 levels in MCX. Recently EIA reported a decline of 6.5 million barrels in oil inventories even as gasoline and distillate stocks increased slightly. Meanwhile rising U.S. output and expected January re-opening of the Forties pipeline of the 450,000 bdp in the North Sea in January can cap the gains to some extent. Oil prices were supported by falling crude inventories in the United States but capped by rising output that is fast approaching 10 million bpd, a level only surpassed by Saudi Arabia and Russia. Natural gas may remain on a volatile path as it may remain in the range of 160-185 levels in MCX. U.S. natural gas futures fell to their lowest level in almost 10 months with production at a record high and forecasts for less cold and lower heating demand over the next two weeks than previously expected. Prices have been trending toward new lows for most of December on moderating winter weather forecasts, record production and storage near normal levels. Natural gas prices were so low that it was almost less expensive for some generators to burn gas instead of Western coal, which has always been cheaper than gas. Production in the lower 48 U.S. states averaged an all time high of 76.5 bcfd over the past 30 days. Chinese natural gas consumption surged through the first 11 months of 2017, up 19 percent year-on-year.
ENERGY COMPLEX
Base metal counter may witness some short covering at lower levels as US home sales, housing starts data and Chinese demand can give further direction to the prices. Copper may move in the range of 423-446 levels. Chilean miner Antofagasta last week reached a new wage agreement with unionized workers at its Centinela mine, defusing the risk of a strike amid a volatile labor landscape in the world's top copper-producing nation. Aluminium may move in the range of 125-136 levels in MCX. China's war on pollution has involved clamping down on unauthorized aluminium capacity and carrying out inspections to ensure facilities meet the required standards. China produced 16.7 million tonnes in the first half of 2017, up 1% from the second half of last year. Nickel can trade in the range of 705-740 levels in near term. Nickel prices traded higher resulted by China’s boosted expectations of higher demand by pledging to cut export taxes on some steel products, but bulging inventories at global warehouses limited the gains in prices. Zinc can move in the range of 195-215 levels. As per ILZSG, Global zinc market deficit widened to 36,900 tonnes in October from a revised deficit of 35,900 tonnes in September. ILZSG also said that total refined zinc stocks, including those held by consumers, producers and in exchange warehouses rose to 1,093,400 tonnes at the end of October from 1,086,700 tonnes at the end of September. Lead can move in the range of 153-165 levels in MCX. Lead prices can get further support from low stocks, a global market deficit, and seasonally strong demand from the battery sector and supply tightness.
Turmeric futures (Apr) may trade sideways in the range of 7600-7900 levels. Domestic demand at present is hand to mouth amid weak fundamentals due to sufficient stock availability and supplies from AP Markfed through E-Auctions. Moreover, the standing crop position is reported well in Andhra Pradesh, Telangana and Maharashtra. In Tamil Nadu, the position is not so good due to water scarcity. Jeera futures (Jan) is likely to witness a consolidation in the range of 21000-22000 levels. The market participants are cautious as the overseas demand has been sluggish in the past three weeks, but still the domestic demand is quite robust even now. The current stock of Jeera in Gujarat is pegged around 5 lakh bags (55 kg each) and the domestic and export demand is estimated around 2-2.5 lakh bags until new crop arrives in February. Till then there are chances that these stocks may get exhausted, if the export demand increases. Coriander futures (Jan) may take an attempt to break the resistance near 5800 levels & go further higher to test 6000-6200 levels. The stockists are accumulating at the prevailing prices as they are anticipating that prices will rise up further in the coming season due to lower sowing reports from producing belts. Coriander sowing in Gujarat as on December 18 was recorded at 67,500 ha as against 118,000 ha during the same period last year, as per Gujarat Agriculture Department. Cardamom futures (Jan) will possibly trade sideways in the range of 1045-1100 levels with downside getting capped. The harvesting is in the fag end of the season with one main round of picking remaining. This phenomenon has changed the market sentiments with the buyers covering more of these aromatic capsules.
BASE METALS
11
TECHNICAL RECOMMENDATIONS
COMMODITY
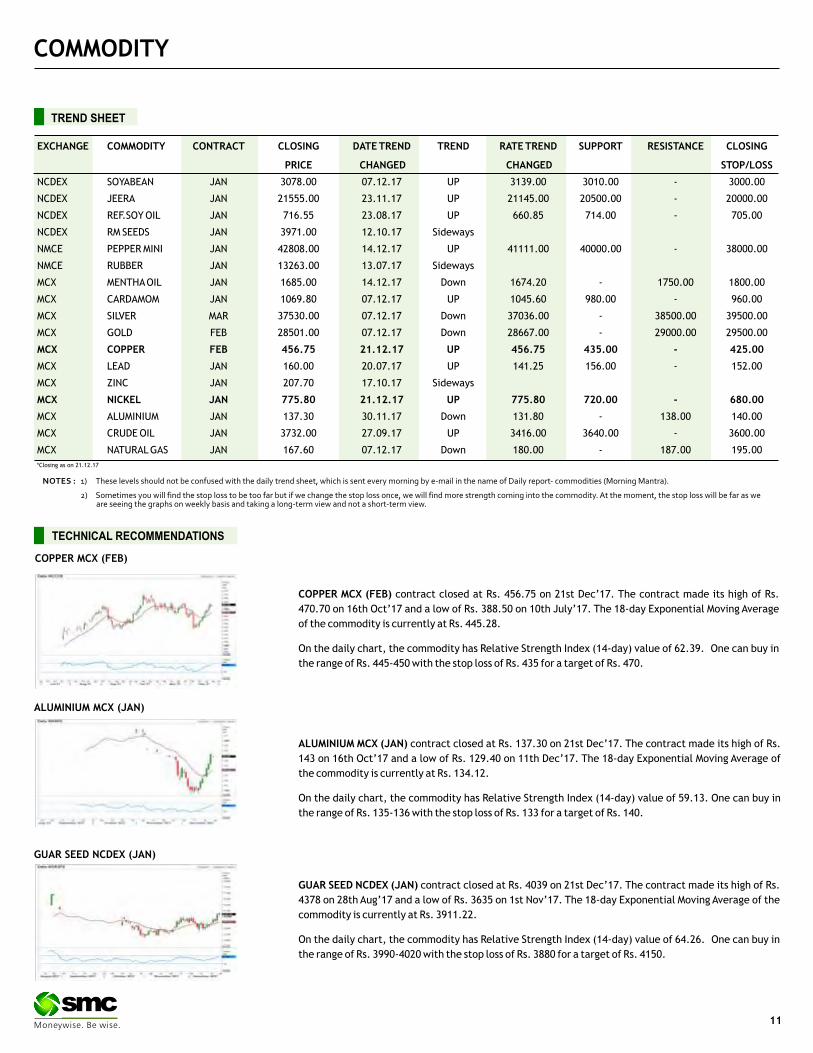
COPPER MCX (FEB) contract closed at Rs. 456.75 on 21st Dec’17. The contract made its high of Rs.
470.70 on 16th Oct’17 and a low of Rs. 388.50 on 10th July’17. The 18-day Exponential Moving Average
of the commodity is currently at Rs. 445.28.
On the daily chart, the commodity has Relative Strength Index (14-day) value of 62.39. One can buy in
the range of Rs. 445-450 with the stop loss of Rs. 435 for a target of Rs. 470.
ALUMINIUM MCX (JAN) contract closed at Rs. 137.30 on 21st Dec’17. The contract made its high of Rs.
143 on 16th Oct’17 and a low of Rs. 129.40 on 11th Dec’17. The 18-day Exponential Moving Average of
the commodity is currently at Rs. 134.12.
On the daily chart, the commodity has Relative Strength Index (14-day) value of 59.13. One can buy in
the range of Rs. 135-136 with the stop loss of Rs. 133 for a target of Rs. 140.
GUAR SEED NCDEX (JAN) contract closed at Rs. 4039 on 21st Dec’17. The contract made its high of Rs.
4378 on 28th Aug’17 and a low of Rs. 3635 on 1st Nov’17. The 18-day Exponential Moving Average of the
commodity is currently at Rs. 3911.22.
On the daily chart, the commodity has Relative Strength Index (14-day) value of 64.26. One can buy in
the range of Rs. 3990-4020 with the stop loss of Rs. 3880 for a target of Rs. 4150.
COPPER MCX (FEB)
ALUMINIUM MCX (JAN)
GUAR SEED NCDEX (JAN)
NOTES : 1) These levels should not be confused with the daily trend sheet, which is sent every morning by e-mail in the name of Daily report- commodities (Morning Mantra).
2) Sometimes you will find the stop loss to be too far but if we change the stop loss once, we will find more strength coming into the commodity. At the moment, the stop loss will be far as we are seeing the graphs on weekly basis and taking a long-term view and not a short-term view.
EXCHANGE COMMODITY CONTRACT CLOSING DATE TREND TREND RATE TREND SUPPORT RESISTANCE CLOSING
PRICE CHANGED CHANGED STOP/LOSS
NCDEX SOYABEAN JAN 3078.00 07.12.17 UP 3139.00 3010.00 - 3000.00
NCDEX JEERA JAN 21555.00 23.11.17 UP 21145.00 20500.00 - 20000.00
NCDEX REF.SOY OIL JAN 716.55 23.08.17 UP 660.85 714.00 - 705.00
NCDEX RM SEEDS JAN 3971.00 12.10.17 Sideways
NMCE PEPPER MINI JAN 42808.00 14.12.17 UP 41111.00 40000.00 - 38000.00
NMCE RUBBER JAN 13263.00 13.07.17 Sideways
MCX MENTHA OIL JAN 1685.00 14.12.17 Down 1674.20 - 1750.00 1800.00
MCX CARDAMOM JAN 1069.80 07.12.17 UP 1045.60 980.00 - 960.00
MCX SILVER MAR 37530.00 07.12.17 Down 37036.00 - 38500.00 39500.00
MCX GOLD FEB 28501.00 07.12.17 Down 28667.00 - 29000.00 29500.00
MCX COPPER FEB 456.75 21.12.17 UP 456.75 435.00 - 425.00
MCX LEAD JAN 160.00 20.07.17 UP 141.25 156.00 - 152.00
MCX ZINC JAN 207.70 17.10.17 Sideways
MCX NICKEL JAN 775.80 21.12.17 UP 775.80 720.00 - 680.00
MCX ALUMINIUM JAN 137.30 30.11.17 Down 131.80 - 138.00 140.00
MCX CRUDE OIL JAN 3732.00 27.09.17 UP 3416.00 3640.00 - 3600.00
MCX NATURAL GAS JAN 167.60 07.12.17 Down 180.00 - 187.00 195.00
TREND SHEET
*Closing as on 21.12.17
COMMODITY
NEWS DIGEST
In the week gone by, recovery was seen in the bullion counter as weaker greenback and safe haven buying supported the sentiments higher. Meanwhile, stronger local currency capped the upside on the domestic market. The Republican controlled U.S. House of Representatives gave final approval last week to the biggest overhaul of the U.S. tax code in 30 years, sending a sweeping $1.5 trillion tax bill to President Donald Trump for his signature. Crude oil prices traded with bearish bias on concern over rising U.S. shale production persisted despite ongoing supply cut efforts by global oil producers. As per EIA official inventory data, US crude stocks to decline by 6.5 million bbl beating the market expectation of decrease of 3.8 million bbl. US production once again rebounded in penultimate week reaching a level of 9.79 million bpd, highest since 1970. Whereas US. Exports bounced in the most recent week, rising to 1.86 million bpd and imports decreased in last week by 301,000 bpd. Oil ticked up after reports that a missile was fired at the Saudi Arabian capital Riyadh from Yemen, but Saudi Arabia said it intercepted the missile and no casualties were reported. Natural gas prices remained on weaker note amid feeble demand. Base metal surged upside as aluminium and nickel lead the rally higher on good demand. Data from the International Aluminium Institute showed that China produced 16.7 million tonnes of aluminium in the first half of 2017, a rise of 1 percent from the second half of last year. Copper prices got support from the stringent scrap import ban from China as issued in statement by Chinese Ministry of Environmental Protection last week.Last week, the king of spices – pepper was the top performer among the agro commodities. Good domestic demand has lifted the pepper prices amid squeezed availability. Sellers continued to stay away from the market anticipating rise in the prices given the likely increase in demand amid Indian Government fixed the MSP of spice at Rs.500/kg ($7575/tonne). Mentha oil again propped up as the supplies in the spot market turned lower because the farmers and stockists were not willing to offload due to expectations of recovery in prices sooner or later amid thin stocks in the country. Chana futures witnessed a decent recovery from its lows after the Government increased the import duty by 30% with immediate effect. Guar complex posted robust gains supported by lower arrivals. On the contrary, the edible oils went slippery due to lack of demand from the retailers & stockiest amid sufficient availability in the ports.
WEEKLY COMMENTARY
COMMODITY UNIT 14.12.17 21.12.17 DIFFERENCE QTY. QTY.
BARLEY MT 150 150 0CASTOR SEED MT 23565 25252 1687CHANA MT 2617 2765 148CORIANDER NEW MT 9642 11651 2009COTTON SEED OIL CAKE MT 6535 11864 5329GUARGUM MT 23168 23707 539GUARSEED MT 27566 28743 1177JEERA NEW MT 7578 7288 -290MAIZE KHARIF MT 40 60 20PEPPER MT 21 10 -11RM SEED MT 7600 6214 -1386SOYBEAN MT 163773 168249 4476TURMERIC MT 672 652 -20WHEAT MT 5953 5953 0
COMMODITY UNIT 14.12.17 20.12.17 DIFFERENCE
QTY. QTY.
BLACK PEPPER MT 4.01 4.10 0.09
CARDAMOM MT 3.80 4.10 0.30
COTTON BALES 29300.00 33700.00 4400.00
GOLD KGS 20.00 20.00 0.00
GOLD MINI KGS 5.30 5.30 0.00
GOLD GUINEA KGS 7.66 7.66 0.00
MENTHA OIL KGS 1439676.55 1521887.75 82211.20
SILVER (30 KG Bar) KGS 12185.34 11650.78 -534.56
The government has withdrawn stockholding and
turnover limits on sugar traders as output is seen
higher in the ongoing season.
The Centre decided to impose a 30% import duty on
chana (chickpeas) and masur (lentils), with
immediate effect.
The NCDEX Institute of Commodity Markets and
Research (NICR) has signed an agreement with
Kredent Academy to launch an online training
portal for commodity futures trading.
The Maharashtra government has issued an advisory
to farmers, asking them to destroy pink bollworm-
hit cotton plants in January.
U.S. homebuilding unexpectedly rose in November,
with the construction of single-family housing units
surging to a 10-year high.
The Bank of Japan left its key short-term interest
rate unchanged at -0.1% at its December 2017
meeting, as expected.
Chilean miner Antofagasta reached a new wage
agreement with unionized workers at its Centinela
mine, defusing the risk of a strike amid a volatile
labor landscape in the world's top copper-producing
nation.
The Moscow Exchange will launch deliverable
futures for gold in 2018 in a move to further prop up
bullion market liquidity.
WEEKLY STOCK POSITIONS IN WAREHOUSE (MCX)WEEKLY STOCK POSITIONS IN WAREHOUSE (NCDEX)
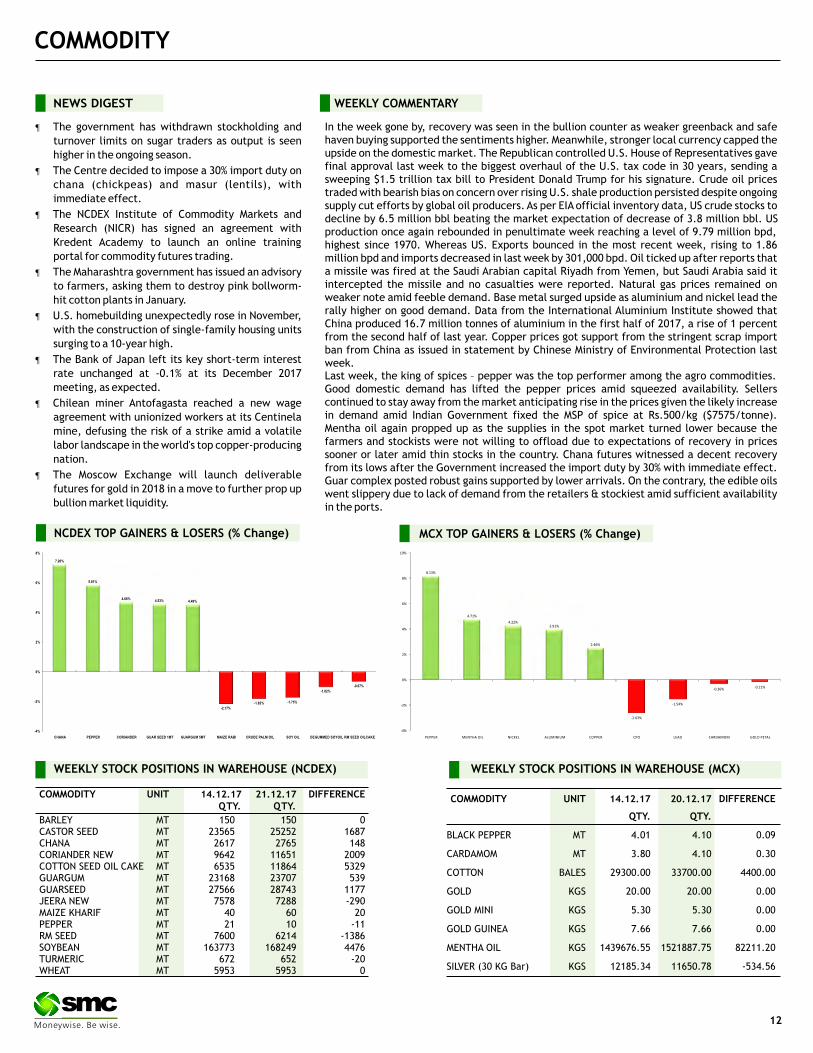
NCDEX TOP GAINERS & LOSERS (% Change) MCX TOP GAINERS & LOSERS (% Change)
12
COMMODITY
COMMODITY EXCHANGE CONTRACT 15.12.17 21.12.17 CHANGE%
ALUMINIUM LME CASH 2036.00 2108.50 3.56
COPPER LME CASH 6735.50 6977.00 3.59
LEAD LME CASH 2511.00 2491.00 -0.80
NICKEL LME CASH 11170.00 12000.00 7.43
ZINC LME CASH 3183.00 3223.00 1.26
GOLD COMEX FEB 1257.50 1270.60 1.04
SILVER COMEX MAR 16.06 16.24 1.12
LIGHT CRUDE OIL NYMEX FEB 57.33 58.36 1.80
NATURAL GAS NYMEX JAN 2.61 2.60 -0.38
PRICES OF METALS IN LME/ COMEX/ NYMEX (in US $)
WEEKLY STOCK POSITIONS IN LME (IN TONNES)
COMMODITY STOCK POSITION STOCK POSITION DIFFERENCE
14.12.17 21.12.17
ALUMINIUM 1109725 1107975 -1750
COPPER 191600 201150 9550
NICKEL 377166 374934 -2232
LEAD 144600 142000 -2600
ZINC 196850 189725 -7125
INTERNATIONAL COMMODITY PRICES
COMMODITY EXCHANGE CONTRACT UNIT 15.12.17 21.12.17 CHANGE(%)
Soybean CBOT JAN Dollars Per Bushel 9.67 9.49 -1.91
Soy oil CBOT JAN Cents per Pound 33.34 32.83 -1.53
CPO BMD MAR MYR per MT 2518.00 2449.00 -2.74
Sugar LIFFE MAR 10 cents per MT 360.50 386.90 7.32
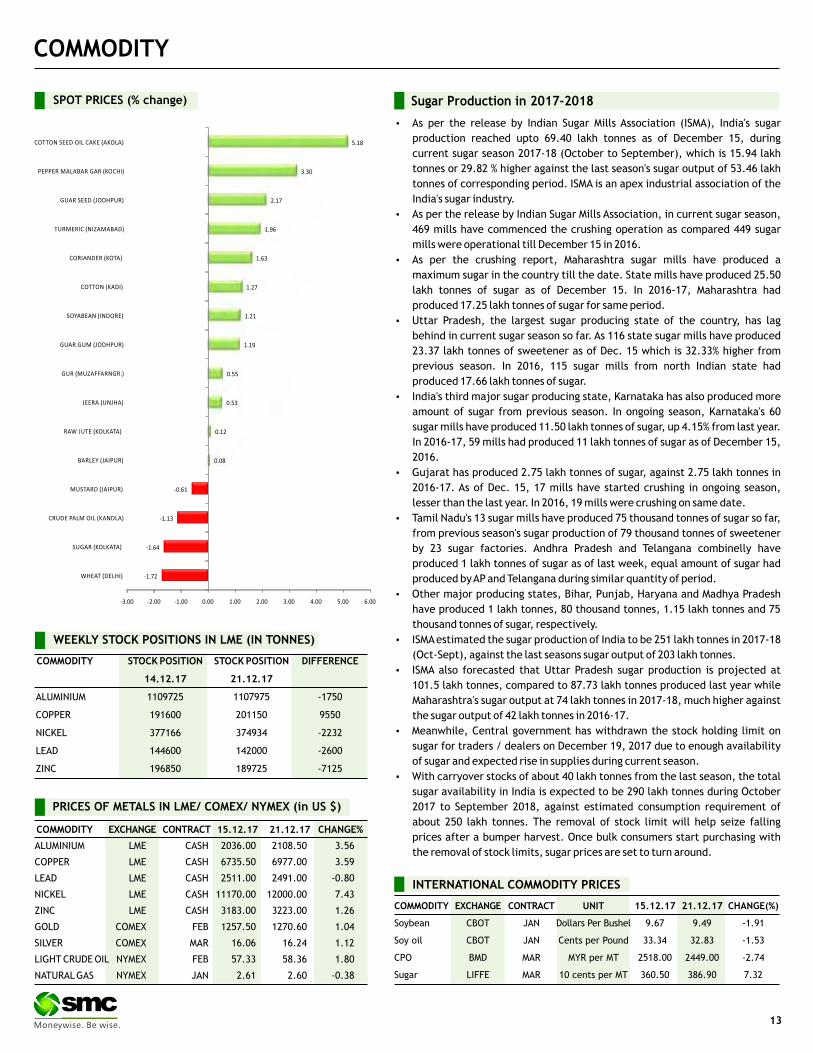
SPOT PRICES (% change) Sugar Production in 2017-2018
As per the release by Indian Sugar Mills Association (ISMA), India's sugar
production reached upto 69.40 lakh tonnes as of December 15, during
current sugar season 2017-18 (October to September), which is 15.94 lakh
tonnes or 29.82 % higher against the last season's sugar output of 53.46 lakh
tonnes of corresponding period. ISMA is an apex industrial association of the
India's sugar industry.
As per the release by Indian Sugar Mills Association, in current sugar season,
469 mills have commenced the crushing operation as compared 449 sugar
mills were operational till December 15 in 2016.
As per the crushing report, Maharashtra sugar mills have produced a
maximum sugar in the country till the date. State mills have produced 25.50
lakh tonnes of sugar as of December 15. In 2016-17, Maharashtra had
produced 17.25 lakh tonnes of sugar for same period.
Uttar Pradesh, the largest sugar producing state of the country, has lag
behind in current sugar season so far. As 116 state sugar mills have produced
23.37 lakh tonnes of sweetener as of Dec. 15 which is 32.33% higher from
previous season. In 2016, 115 sugar mills from north Indian state had
produced 17.66 lakh tonnes of sugar.
India's third major sugar producing state, Karnataka has also produced more
amount of sugar from previous season. In ongoing season, Karnataka's 60
sugar mills have produced 11.50 lakh tonnes of sugar, up 4.15% from last year.
In 2016-17, 59 mills had produced 11 lakh tonnes of sugar as of December 15,
2016.
Gujarat has produced 2.75 lakh tonnes of sugar, against 2.75 lakh tonnes in
2016-17. As of Dec. 15, 17 mills have started crushing in ongoing season,
lesser than the last year. In 2016, 19 mills were crushing on same date.
Tamil Nadu's 13 sugar mills have produced 75 thousand tonnes of sugar so far,
from previous season's sugar production of 79 thousand tonnes of sweetener
by 23 sugar factories. Andhra Pradesh and Telangana combinelly have
produced 1 lakh tonnes of sugar as of last week, equal amount of sugar had
produced by AP and Telangana during similar quantity of period.
Other major producing states, Bihar, Punjab, Haryana and Madhya Pradesh
have produced 1 lakh tonnes, 80 thousand tonnes, 1.15 lakh tonnes and 75
thousand tonnes of sugar, respectively.
ISMA estimated the sugar production of India to be 251 lakh tonnes in 2017-18
(Oct-Sept), against the last seasons sugar output of 203 lakh tonnes.
ISMA also forecasted that Uttar Pradesh sugar production is projected at
101.5 lakh tonnes, compared to 87.73 lakh tonnes produced last year while
Maharashtra's sugar output at 74 lakh tonnes in 2017-18, much higher against
the sugar output of 42 lakh tonnes in 2016-17.
Meanwhile, Central government has withdrawn the stock holding limit on
sugar for traders / dealers on December 19, 2017 due to enough availability
of sugar and expected rise in supplies during current season.
With carryover stocks of about 40 lakh tonnes from the last season, the total
sugar availability in India is expected to be 290 lakh tonnes during October
2017 to September 2018, against estimated consumption requirement of
about 250 lakh tonnes. The removal of stock limit will help seize falling
prices after a bumper harvest. Once bulk consumers start purchasing with
the removal of stock limits, sugar prices are set to turn around.
13

CURRENCY
Currency Table
Currency Pair Open High Low Close
USD/INR 64.21 64.79 63.99 64.07
EUR/INR 75.65 76.28 75.54 76.09
GBP/INR 85.81 86.48 85.56 85.71
JPY/INR 57.10 57.57 56.44 56.48
News Flows of last week
20th Dec U.S. Existing Home Sales Jump To Nearly 11-Year High In
November
20th Dec BoJ Kept Monetary policy unchanged
21st Dec UK November budget deficit lowest since 2007
21st Dec U.S. weekly jobless claims climb more than expected to 245,000
21st Dec U.S. GDP Growth unexpectedly downwardly revised to 3.2% in Q3
22nd Dec Germany's import price Inflation rises in November
EUR/INR (JAN) contract closed at 76.51 on 21st December’17. The contract made its high of 76.70 on 18th December’17 and a low of 75.98 on 18th December’17 (Weekly Basis). The 14-day Exponential Moving Average of the EUR/INR is currently at 76.52.
On the daily chart, EUR/INR has Relative Strength Index (14-day) value of 48.06.One can sell below 76.20 for a target of 75.20 with the stop loss of 76.70.
(* NSE Currency future, Source: Spider, Open: Monday 9.00 AM IST, Close: Thursday (5.00 PM IST)
Market Stance
After a volatile week, the Indian rupee strengthen sharply as against the dollar
and tested three month high on local bourses as Indian benchmark indices sky
rocketed toward all time high after the BJP's win in Gujarat and Himachal
Pradesh assembly polls. The heavy dollar unwinding by speculative traders
and exporters further supported the rupee up move. On the global front, the
dollar held steady against other major currencies in quiet trade as investors
remained cautious regarding progress on the US tax reform front and the
Christmas holiday. In other currencies Hong Kong's dollar tumbled to the
weakest in almost two years against the greenback after the Hong Kong
Monetary Authority indicated that it wasn't planning to sell extra debt in
response to the US Federal Reserve's interest-rate increase.
EUR/INR
USD/INR (JAN) contract closed at 64.27 on 21st December’17. The contract made its high of 65.00 on 18th December’17 and a low of 64.19 on 19th December’17 (Weekly Basis). The 14-day Exponential Moving Average of the USD/INR is currently at 64.58.
On the daily chart, the USD/INR has Relative Strength Index (14-day) value of 33.90. One can sell below 64.20 for the target of 63.50 with the stop loss of 64.55.
GBP/INR (JAN) contract closed at 86.14 on 21st December’17. The contract made its high of 86.92 on 18th December’17 and a low of 85.99 on 21st December’17 (Weekly Basis). The 14-day Exponential Moving Average of the GBP/INR is currently at 86.55.
On the daily chart, GBP/INR has Relative Strength Index (14-day) value of 44.57. One can sell below 86.10 for a target of 85.10 with the stop loss of 86.60.
JPY/INR (JAN) contract closed at 56.80 on 21st December’17. The contract made its high of 57.88 on 18th December’17 and a low of 56.78 on 21st December’17 (Weekly Basis). The 14-day Exponential Moving Average of the JPY/INR is currently at 57.39.
On the daily chart, JPY/INR has Relative Strength Index (14-day) value of 33.37. One can sell around 56.75 for a target of 55.75 with the stop loss of 57.25.
USD/INRTechnical Recommendation
Economic gauge for the next week
Date Currency Event Previous
26th Dec USD S&P/Case-Shiller Home Price Indices (YoY) 6.2
26th Dec USD Dallas Fed Manufacturing Business Index 19.4
27th Dec USD Pending Home Sales (YoY) 1.2
27th Dec USD Pending Home Sales (MoM) 3.5
28th Dec EUR Economic Bulletin
28th Dec USD Continuing Jobless Claims 1.932
28th Dec USD Initial Jobless Claims 245
GBP/INR JPY/INR
14

IPO
15
IPO NEWS
ICICI Securities plans up to Rs 4,000-crore IPO, files papers with Sebi
ICICI Securities, a subsidiary of private sector lender ICICI Bank, on Friday filed draft papers with markets regulator Sebi to raise an estimated Rs 3,000- 4,000 crore through an initial public offering.The public issue comprises sale of 64,428,280 equity shares, amounting to 20 per cent stake, by ICICI Bank, according to the draft red herring prospectus (DRHP). The offer includes a reservation of up to 32.21 lakh shares for individual and Hindu Undivided Family (HUF) shareholders of ICICI Bank. According to merchant banking sources, the initial public offer (IPO) is expected to garner Rs 3,000-4,000 crore. "The objects of the offer for the company are to achieve the benefit of listing the equity shares on the stock exchanges. Further, the company expects that the listing of equity shares will enhance its visibility and brand image and provide liquidity to its existing shareholders," the preliminary papers noted. DSP Merrill Lynch, IIFL Holdings, SBI Capital Markets, Citigroup Global Markets India, Edelweiss Financial Services and CLSA India will manage the company's public issue
Amber Enterprises Gets Sebi Approval For IPO
Appliance maker Amber Enterprises has received Sebi's approval to raise an estimated Rs. 555 crore through an initial share-sale offering, latest update with the markets regulator showed. The firm had filed draft prospectus with Securities and Exchange Board of India (Sebi) on September 29 and received its "observations" on December 5, which is necessary for any company to launch public offer. The Gurugram-based Amber Enterprises manufactures air-conditioners. Besides, it makes refrigerator components, water purifiers and washing machines. Going by the draft papers, Amber Enterprises' IPO comprises fresh issue of equity shares worth Rs. 450 crore and sale of scrips to the tune of Rs. 105 crore by promoters Jasbir Singh and Daljit Singh. The company plans to use the proceeds for repayment and advance payment of certain loans and for other general corporate purposes. Edelweiss Financial Services, IDFC Bank, SBI Capital Markets and BNP Paribas will manage the company's initial public offer (IPO).
ACME Solar Holdings, HG Infra get Sebi's nod for IPO
Two companies -- ACME Solar Holdings and HG Infra Engineering -- have received Sebi's approval to launch initial public offerings, as per the latest update with markets regulator. Together, these companies are expected to garner Rs 2,700 crore through initial share-sales. The two firms had filed their respective draft red herring prospectus (DRHP) with the regulator on September 28. ACME Solar Holdings and HG Infra Engineering received "observations" from Securities and Exchange Board of India (Sebi) on December 15 and December 13, respectively, which is necessary for any company to launch public offers. Going by the preliminary papers, renewable energy firm ACME Solar Holdings plans to raise Rs 2,200 crore through its initial public offer (IPO). Funds raised through the issue will be used to pay debt and to finance the company's 200 MW solar power project in Rajasthan and for other general corporate purposes.
India's energy saving champion delays IPO to next fiscal year
India's state-backed Energy Efficiency Services Ltd. is delaying its initial share sale on expectations that an increase in its revenue will make the offering more attractive to investors. EESL, which is tasked with helping the nation reduce emissions, initially planned to launch its initial public offering as soon as the fourth quarter. It has now pushed back the IPO to the year starting April 2018 as it expects revenue to more than double to 30 billion rupees ($467 million), EESL Managing Director Saurabh Kumar said.
Indiamart plans IPO, process to begin next fiscal
E-commerce firm Indiamart is planning to launch its initial public offer (IPO) for which it will start the process next fiscal. Existing investors of Indiamart include Intel Capital, Amadeus Capital, WestBridge Capital and Quona Capital.
*Closing price as on 21-12-2017
Company Sector M.Cap (In Rs Cr.) Issue Size (in Rs Cr.) List Date Issue Price List Price Last Price %Gain/Loss (from Issue price)*
Future Supply Chain Solutions Logistics 2715.21 650.00 18-Dec-17 664.00 674.00 677.85 2.09
Shalby Limited Hopsital 2381.62 504.00 15-Dec-17 248.00 237.00 220.50 -11.09
HDFC Standard Life Insurance Insurance 75637.84 8695.00 17-Nov-17 290.00 311.00 376.50 29.83
Khadim India Ltd Footwear 1198.01 544.00 14-Nov-17 750.00 727.00 666.85 -11.09
New India Assurance Co. Ltd. Insurance 50795.48 9600.00 13-Nov-17 800.00 748.90 616.45 -22.94
Mahindra Logistics Limited Logistics 3219.17 830.00 10-Nov-17 429.00 432.00 452.50 5.48
Reliance Nippon Life Insurance 17181.90 1542.00 6-Nov-17 252.00 294.00 280.75 11.41
General Insurance General Insurance 68474.23 11373.00 25-Oct-17 912.00 850.00 780.60 -14.41
Indian Energy Exchange Power Trading 4803.90 1000.00 23-Oct-17 1650.00 1500.00 1583.95 -4.00
MAS Financial Services Financial Services 3441.25 460.00 18-Oct-17 459.00 660.00 629.55 37.16
Godrej Agrovet Agri Business 11026.29 1157.00 16-Oct-17 460.00 621.00 574.2 24.83
Prataap Snacks Limited FMCG 3023.92 482.00 5-Oct-17 938.00 1250.00 1289.35 37.46
SBI Life Insurance Insurance 70025.00 8400.00 3-Oct-17 700.00 733.30 700.25 0.04
ICICI Lombard Insurance 35196.88 5701.00 27-Sep-17 661.00 650.00 775.35 17.30
Capacit'e Infraprojects Infrastructure 2757.41 400.00 25-Sep-17 250.00 399.00 406.15 62.46
Matrimony.com Limited Online Matchmaking 2074.76 501.00 21-Sep-17 985.00 985.00 918.25 -6.78
Dixon Technologies Consumer Durable 4357.16 600.00 18-Sep-17 1766.00 2725.00 3847.35 146.72
Bharat Road Network Infrastructure 1634.51 600.00 18-Sep-17 205.00 204.90 194.70 -5.02
IPO TRACKER

FIXED DEPOSIT MONITOR
16
* Interest Rate may be revised by company from time to time. Please confirm Interest rates before submitting the application.
* For Application of Rs.50 Lac & above, Contact to Head Office.
* Email us at [email protected]
FIXED DEPOSIT COMPANIES
PERIOD MIN.ADDITIONAL RATE OF INTEREST (%)
S.NO (NBFC COMPANY -NAME) 12M 18M 24M 36M 45M 48M 60M 84M INVESTMENT
1 BAJAJ FINANCE LTD.(UPTO RS. 5 CR.) 7.60 7.60 7.80 7.85 - 7.85 7.85 - 0.25% FOR SR. CITIZEN, 0.10% FOR 25000/-
EXISTING LOAN CUSTOMER AND ON RENEWAL
UPTO RS. 5CRORE
2 DEWAN HOUSING FINANCE CORPORATION LTD 13M=7.75% 14M=7.75% 18M=7.80% 13M=50000; 40M=7.90%
14M=10000; 0.25% EXTRA FOR SR CITIZEN, WIDOW, ARMED,
40M=2000 PERSONNEL, EXISTING DHFL HOME BORROWERS
3 DEWAN HOUSING FINANCE CORPORATION LTD (AASHRAY) 7.70 - 7.80 7.85 - 8.00 - 8.00 10,000/-
4 GRUH FINANCE LTD. 7.25 13M=7.25 7.25 7.25 - 7.25 7.00 7.00 96-120M=7.00%; 0.25% FOR FEMALE, 1000/-
SENIOR CITIZEN & TRUST
5 HDFC PREMIUM DEPOSIT FOR INDIVIUAL (UPTO RS. 2 CR.) 15M=7.40 22M= 7.45 30M=7.40 44M= 7.55 0.25% FOR SENIOR CITIZEN UPTO RS. 1 CR
- -6 HDFC PREMIUM DEPOSIT FOR TRUST & INSTITUTION 22M=7. 30 44M= 7.40 - - - (UPTO RS. 5 CR.)
7 HDFC LTD FOR INDIVIDUAL & TRUST (UPTO RS.3 CR.) 7.30 - 7.30 7.40 - 7.40 7.40 - 0.25% FOR SENIOR CITIZEN UPTO RS. 1 CR.
8 HUDCO LTD.(IND & HUF) 7.00 - 7.00 7.00 - 6.75 6.75 6.75 0.25% FOR SR. CITIZEN 10000/-
9 HUDCO LTD.(TRUST/CO/INSTITUTION) 6.75 - 6.75 6.75 - 6.50 6.50 6.50 - 10000/-
10 J K LAKSHMI CEMENT LTD. 8.00 - 8.25 8.35 - - - - 0.50% ADD. INTEREST TO SR. CITIZEN, 25000/-
EMPLOYEES, SHAREHOLDERS AND PERSON
INVESTING RS. 5 LACS AND ABOVE - MAX. 0.50%
11 J K TYRE INDUSTIRES LTD. 8.00 - 8.25 8.35 - - - - 0.50% ADD. INTEREST TO SR. CITIZEN, 25000/-
EMPLOYEES, SHAREHOLDERS AND PERSON
INVESTING RS. 5 LACS AND ABOVE - MAX. 0.50%
12 KTDFC (Kerela Transport) 8.25 - 8.25 8.25 - 8.00 8.00 - 0.25% EXTRA FOR SR. CITIZEN, 10000/-
13 LIC HOUSING FINANCE LTD. (UPTO RS. 5 CR.) 7.30 7.35 7.40 7.45 - - 7.45 - 0.25% FOR SENIOR CITIZEN IF APP ABOVE 10000/-
Rs. 50,000/- & 0.10% IF APP UPTO Rs. 50,000/-
14 M&M FINANCIAL SERVICES LTD (FOR BELOW RS. 1 CRORE) 7.50 7.50 7.50 7.55 - 7.55 7.55 - 0.25% FOR SENIOR CITIZEN 10000/-
15 OMAXE LTD. 10.50 - 11.00 11.50 - - - - 50000/-
16 PNB HOUSING FINANCE LTD.(UPTO RS. 5 CR.) 7.30 - 7.40 7.40 - 7.40 7.40 7.40 0.25% EXTRA FOR SR. CITIZEN UPTO RS.1 CRORE 20000/-
17 PNB HOUSING FINANCE LTD.(UPTO RS. 5 CR.) 15M=7.4 0 22M=7 .50 4 4M= 7.55 0.25% FOR SENIOR CITIZEN 30M=7.50
18 SHRIRAM TRANSPORT FINANCE-UNNATI SCHEME 7.50 - 7.50 7.85 - 7.90 8.00 - 0.25% FOR SENIOR CITIZEN 5000/-
19 SHRIRAM CITY UNION SCHEME 7.50 - 7.50 7.85 - 7.90 8.00 - 0.25% FOR SENIOR CITIZEN 5000/-
(FOR TRUST ONLY) (FOR WOMEN ONLY)
20000/- BUT
40000/-
IN MONTHLY

INDUSTRY & FUND UPDATE
MUTUAL FUND
Mutual fund folio count rises 9.5 mn in 8 months to all-time high of 65 mn
Enthused by strong participation from retail investors, the number of mutual fund folios has grown by over 9.5 million in the first eight months of the
current financial year to an all-time high of 65 million at November-end 2017. According to data from the Securities and Exchange Board of India (Sebi)
on total investor accounts with 42 active fund houses, the number of folios rose to a record 64,921,686 at the end of November from 55,399,631 at
March-end -- a jump of 9.522 million.
Edelweiss Mutual Fund announces change in the fund management responsibility
Edelweiss Mutual Fund has announced change in the fund management responsibility of number of funds with effect from Dec 11. Among the changes
announced, Mr. Rahul Kedia and Mr. Gautam Kaul will be jointly managing Edelweiss Liquid Fund, Edelweiss Ultra Short Term Fund, Edelweiss ASEAN
Equity Offshore Fund, Edelweiss Emerging Markets Opportunities Equity Offshore Fund, Edelweiss Europe Dynamic Equity Offshore Fund, Edelweiss US
Value Equity Offshore Fund, Edelweiss Greater China Equity Off-Shore Fund, Edelweiss Fixed Maturity Plan - Series 14, 20, 35, 38 and 41.
DHFL Pramerica MF allows unit holders to get unclaimed funds via phone
DHFL Pramerica Mutual Fund has enabled unit holders of DHFL Pramerica Insta Cash Plus Fund to get their due funds under unclaimed redemptions and
dividend using their mobile phones with effect from December 18, the fund house said. Unit holders can claim the amount by availing the 'anywhere
transact facility' provided by the fund house wherein the unclaimed amount can be credited through a call or short-message service. All other features
of the scheme remain unchanged.
SEBI plans discussion paper on MF expense ratio
Capital market regulator SEBI plans to bring out a discussion paper on mutual funds expense ratio with the focus on ways to bring it down even as the
inflows been growing leaps and bounds in last few months. The market regulator is also examining the Uday Kotak Committee report on Corporate
Governance for relevant recommendations that can be implemented in mutual fund industry.
Scheme Name UTI Fixed Term Income Fund - Series XXVIII - III (1203 Days) (G)
Fund Type Close-Ended
Fund Class Growth
Opens on 14-Dec-2017
Closes on 28-Dec-2017
Investment Objective The scheme aims to generate returns by investing in portfolio of fixed income securities maturing on or before the date of
maturity of the scheme.
Min. Investment Rs. 5000
Fund Manager Sunil Patil
17
NEW FUND OFFER
Scheme Name UTI Long Term Advantage Fund - Series VI - Regular Plan (G)
Fund Type Close-Ended
Fund Class Growth
Opens on 05-Oct-2017
Closes on 12-Jan-2018
Investment Objective The investment objective of the scheme is to provide medium to long term capital appreciation along with income tax benefit.
Min. Investment Rs. 500
Fund Manager Lalit Nambiar
Note: Indicative corpus are including Growth & Dividend option . The above mentioned data is on the basis of 21/12/2017Beta, Sharpe and Standard Deviation are calculated on the basis of period: 1 year, frequency: Weekly Friday, RF: 7%
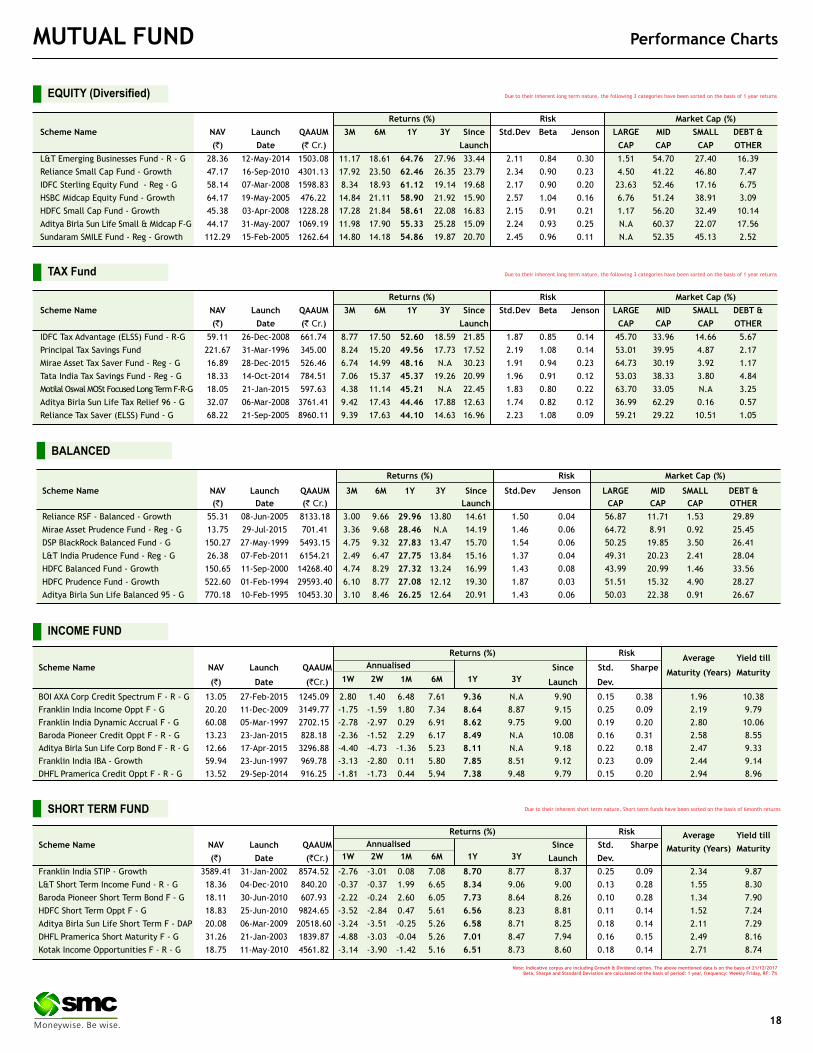
MUTUAL FUND Performance Charts
Returns (%) Risk Market Cap (%)
Scheme Name NAV Launch QAAUM 3M 6M 1Y 3Y Since Std.Dev Beta Jenson LARGE MID SMALL DEBT &
(`) Date (` Cr.) Launch CAP CAP CAP OTHER
IDFC Tax Advantage (ELSS) Fund - R-G 59.11 26-Dec-2008 661.74 8.77 17.50 52.60 18.59 21.85 1.87 0.85 0.14 45.70 33.96 14.66 5.67
Principal Tax Savings Fund 221.67 31-Mar-1996 345.00 8.24 15.20 49.56 17.73 17.52 2.19 1.08 0.14 53.01 39.95 4.87 2.17
Mirae Asset Tax Saver Fund - Reg - G 16.89 28-Dec-2015 526.46 6.74 14.99 48.16 N.A 30.23 1.91 0.94 0.23 64.73 30.19 3.92 1.17
Tata India Tax Savings Fund - Reg - G 18.33 14-Oct-2014 784.51 7.06 15.37 45.37 19.26 20.99 1.96 0.91 0.12 53.03 38.33 3.80 4.84
Motilal Oswal MOSt Focused Long Term F-R-G 18.05 21-Jan-2015 597.63 4.38 11.14 45.21 N.A 22.45 1.83 0.80 0.22 63.70 33.05 N.A 3.25
Aditya Birla Sun Life Tax Relief 96 - G 32.07 06-Mar-2008 3761.41 9.42 17.43 44.46 17.88 12.63 1.74 0.82 0.12 36.99 62.29 0.16 0.57
Reliance Tax Saver (ELSS) Fund - G 68.22 21-Sep-2005 8960.11 9.39 17.63 44.10 14.63 16.96 2.23 1.08 0.09 59.21 29.22 10.51 1.05
TAX Fund Due to their inherent long term nature, the following 3 categories have been sorted on the basis of 1 year returns
Returns (%) Risk Market Cap (%)
Scheme Name NAV Launch QAAUM 3M 6M 1Y 3Y Since Std.Dev Beta Jenson LARGE MID SMALL DEBT &
(`) Date (` Cr.) Launch CAP CAP CAP OTHER
L&T Emerging Businesses Fund - R - G 28.36 12-May-2014 1503.08 11.17 18.61 64.76 27.96 33.44 2.11 0.84 0.30 1.51 54.70 27.40 16.39
Reliance Small Cap Fund - Growth 47.17 16-Sep-2010 4301.13 17.92 23.50 62.46 26.35 23.79 2.34 0.90 0.23 4.50 41.22 46.80 7.47
IDFC Sterling Equity Fund - Reg - G 58.14 07-Mar-2008 1598.83 8.34 18.93 61.12 19.14 19.68 2.17 0.90 0.20 23.63 52.46 17.16 6.75
HSBC Midcap Equity Fund - Growth 64.17 19-May-2005 476.22 14.84 21.11 58.90 21.92 15.90 2.57 1.04 0.16 6.76 51.24 38.91 3.09
HDFC Small Cap Fund - Growth 45.38 03-Apr-2008 1228.28 17.28 21.84 58.61 22.08 16.83 2.15 0.91 0.21 1.17 56.20 32.49 10.14
Aditya Birla Sun Life Small & Midcap F-G 44.17 31-May-2007 1069.19 11.98 17.90 55.33 25.28 15.09 2.24 0.93 0.25 N.A 60.37 22.07 17.56
Sundaram SMILE Fund - Reg - Growth 112.29 15-Feb-2005 1262.64 14.80 14.18 54.86 19.87 20.70 2.45 0.96 0.11 N.A 52.35 45.13 2.52
EQUITY (Diversified) Due to their inherent long term nature, the following 3 categories have been sorted on the basis of 1 year returns
Annualised
Returns (%) RiskAverage Yield till
Scheme Name NAV Launch QAAUM Since Std. Sharpe
1W 2W 1M 6M 1Y 3YMaturity (Years) Maturity
(`) Date (`Cr.) Launch Dev.
BOI AXA Corp Credit Spectrum F - R - G 13.05 27-Feb-2015 1245.09 2.80 1.40 6.48 7.61 9.36 N.A 9.90 0.15 0.38 1.96 10.38
Franklin India Income Oppt F - G 20.20 11-Dec-2009 3149.77 -1.75 -1.59 1.80 7.34 8.64 8.87 9.15 0.25 0.09 2.19 9.79
Franklin India Dynamic Accrual F - G 60.08 05-Mar-1997 2702.15 -2.78 -2.97 0.29 6.91 8.62 9.75 9.00 0.19 0.20 2.80 10.06
Baroda Pioneer Credit Oppt F - R - G 13.23 23-Jan-2015 828.18 -2.36 -1.52 2.29 6.17 8.49 N.A 10.08 0.16 0.31 2.58 8.55
Aditya Birla Sun Life Corp Bond F - R - G 12.66 17-Apr-2015 3296.88 -4.40 -4.73 -1.36 5.23 8.11 N.A 9.18 0.22 0.18 2.47 9.33
Franklin India IBA - Growth 59.94 23-Jun-1997 969.78 -3.13 -2.80 0.11 5.80 7.85 8.51 9.12 0.23 0.09 2.44 9.14
DHFL Pramerica Credit Oppt F - R - G 13.52 29-Sep-2014 916.25 -1.81 -1.73 0.44 5.94 7.38 9.48 9.79 0.15 0.20 2.94 8.96
INCOME FUND
Returns (%) Risk Average Yield tillScheme Name NAV Launch QAAUM Since Std. Sharpe
1W 2W 1M 6M 1Y 3YMaturity (Years) Maturity
(`) Date (`Cr.) Launch Dev.
Franklin India STIP - Growth 3589.41 31-Jan-2002 8574.52 -2.76 -3.01 0.08 7.08 8.70 8.77 8.37 0.25 0.09 2.34 9.87
L&T Short Term Income Fund - R - G 18.36 04-Dec-2010 840.20 -0.37 -0.37 1.99 6.65 8.34 9.06 9.00 0.13 0.28 1.55 8.30
Baroda Pioneer Short Term Bond F - G 18.11 30-Jun-2010 607.93 -2.22 -0.24 2.60 6.05 7.73 8.64 8.26 0.10 0.28 1.34 7.90
HDFC Short Term Oppt F - G 18.83 25-Jun-2010 9824.65 -3.52 -2.84 0.47 5.61 6.56 8.23 8.81 0.11 0.14 1.52 7.24
Aditya Birla Sun Life Short Term F - DAP 20.08 06-Mar-2009 20518.60 -3.24 -3.51 -0.25 5.26 6.58 8.71 8.25 0.18 0.14 2.11 7.29
DHFL Pramerica Short Maturity F - G 31.26 21-Jan-2003 1839.87 -4.88 -3.03 -0.04 5.26 7.01 8.47 7.94 0.16 0.15 2.49 8.16
Kotak Income Opportunities F - R - G 18.75 11-May-2010 4561.82 -3.14 -3.90 -1.42 5.16 6.51 8.73 8.60 0.18 0.14 2.71 8.74
SHORT TERM FUND Due to their inherent short term nature, Short term funds have been sorted on the basis of 6month returns
Annualised
Returns (%) Risk Market Cap (%)
Scheme Name NAV Launch QAAUM 3M 6M 1Y 3Y Since Std.Dev Jenson LARGE MID SMALL DEBT &
(`) Date (` Cr.) Launch CAP CAP CAP OTHER
Reliance RSF - Balanced - Growth 55.31 08-Jun-2005 8133.18 3.00 9.66 29.96 13.80 14.61 1.50 0.04 56.87 11.71 1.53 29.89
Mirae Asset Prudence Fund - Reg - G 13.75 29-Jul-2015 701.41 3.36 9.68 28.46 N.A 14.19 1.46 0.06 64.72 8.91 0.92 25.45
DSP BlackRock Balanced Fund - G 150.27 27-May-1999 5493.15 4.75 9.32 27.83 13.47 15.70 1.54 0.06 50.25 19.85 3.50 26.41
L&T India Prudence Fund - Reg - G 26.38 07-Feb-2011 6154.21 2.49 6.47 27.75 13.84 15.16 1.37 0.04 49.31 20.23 2.41 28.04
HDFC Balanced Fund - Growth 150.65 11-Sep-2000 14268.40 4.74 8.29 27.32 13.24 16.99 1.43 0.08 43.99 20.99 1.46 33.56
HDFC Prudence Fund - Growth 522.60 01-Feb-1994 29593.40 6.10 8.77 27.08 12.12 19.30 1.87 0.03 51.51 15.32 4.90 28.27
Aditya Birla Sun Life Balanced 95 - G 770.18 10-Feb-1995 10453.30 3.10 8.46 26.25 12.64 20.91 1.43 0.06 50.03 22.38 0.91 26.67
BALANCED
18

Mr. S C Aggarwal (CMD, SMC Group) and Mr. Mahesh C Gupta (Vice CMD, SMC Group) during the inauguration ofSMC Finance’s new office at Pusa Road, New Delhi along with Christmas Celebration held at SMC Premises
on 22nd November 2017.
Mr. D K Aggarwal (CMD, SMC Investments & Advisors Ltd. & Vice President, PHD Chamber of Commerce & Industry)with Shri Venkaiah Naidu, Hon’ble Vice President of India during the inauguration of 2nd ‘AERO EXPO INDIA’ -2017
on 2nd November 2017, Near New ATC Tower, IGI Airport, New Delhi.

NSE INB/INF/INE 230771431, BSE INB/INF/INE 011343937, MCX- SX INB/INF 260771432 INE 260771431, USEL INE 271343936, CDSL IN-DP-CDSL-583-2010, NSDL IN-DP-NSDL-333-2010 (SMC Global Securities Ltd.) NCDEX: NCDEX/TCM/CORP/0131, MCX: MCX/TCM/CORP/0385, MCX MEMBER ID: 8200, NMCE: NMCE/TCM/CORP/0215, ICEX: ICEX/TCM/CORP/009, ACE: ACEL/CM/CORP/0267, UCX: 210001 (SMC Comtrade Ltd.), PMS INP000003435 (SMC Investments and Advisors Ltd.), IRDAI Regi: No: DB 272/04 License No. 289 (SMC Insurance Brokers Pvt. Ltd.) Valid upto 27/01/2020
D e l h i | M u m b a i | K o l k a t a | A h m e d a b a d | C h e n n a i | N e w Y o r k | D u b a i