wisconsin’s focus on energy program update and best practices john nicol, pe industrial program...
TRANSCRIPT

Wisconsin’s Focus on EnergyProgram Update and Best
Practices
John Nicol, PE
Industrial Program Manager
November 8th, 2007
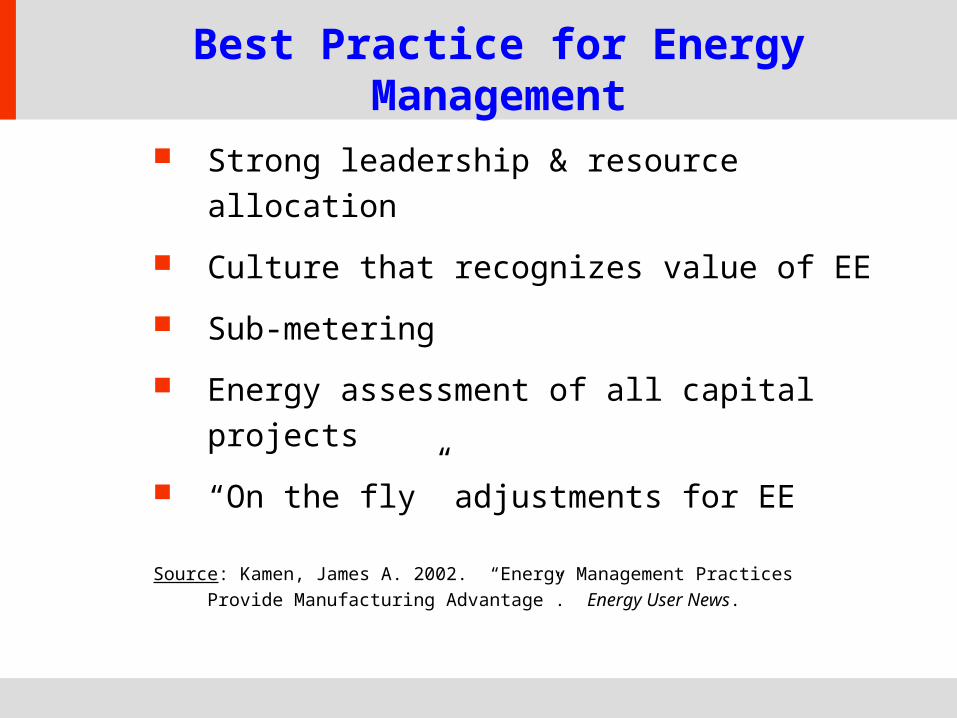
Best Practice for Energy Management
Strong leadership & resource allocation
Culture that recognizes value of EE
Sub-metering
Energy assessment of all capital
projects
“On the fly” adjustments for EE
Source: Kamen, James A. 2002. “Energy Management Practices Provide
Manufacturing Advantage”. Energy User News.
0
20
40
60
80
100
120
140
2002 2010 2015 2020 2025
Quadrillion BTU
Mature Market Economies
Transitional Economies
Emerging Economies
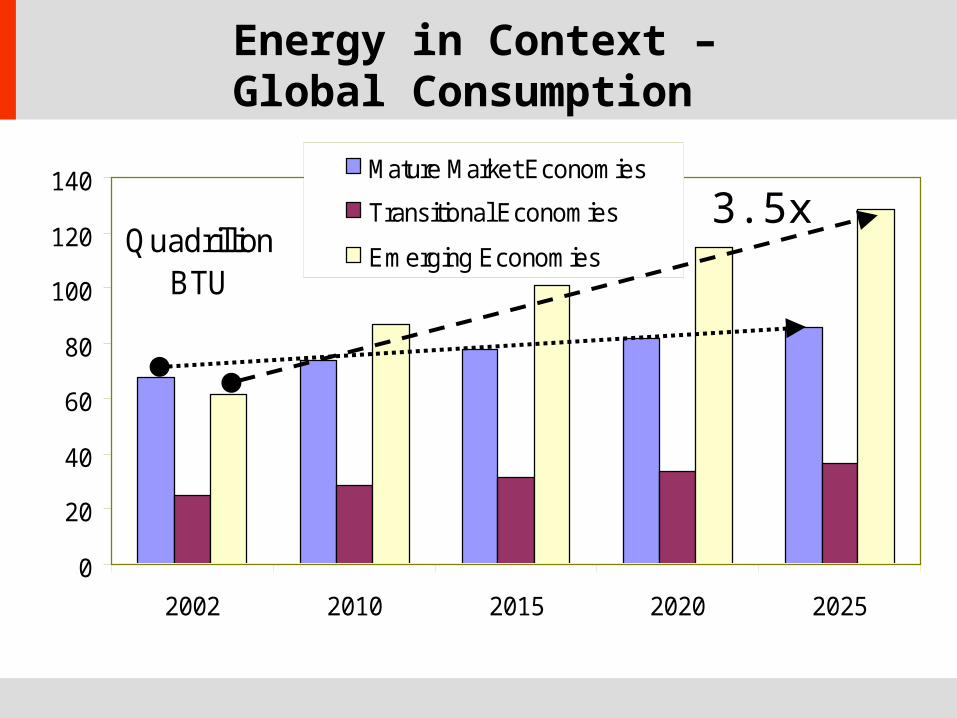
Energy in Context – Global Consumption
3.5x

US Energy Consumption (EIA)(quadrillion Btu)

US Energy Production by Fuel (EIA)
(quadrillion Btu)

US Electricity Production (EIA)(quadrillion Btu)

US Electricity Production (EIA)

Increased Energy Prices and Volatility
Source: ACEEE from EIA 2007
Energy Prices
-
2
4
6
8
10
12
14
16
18
20
Jan-0
0
Jul-0
0
Jan-0
1
Jul-0
1
Jan-0
2
Jul-0
2
Jan-0
3
Jul-0
3
Jan-0
4
Jul-0
4
Jan-0
5
Jul-0
5
Jan-0
6
Jul-0
6
Jan-0
7
En
erg
y P
ric
e (
$/M
Btu
)
Electricity Fuel Oil Natural Gas Coal
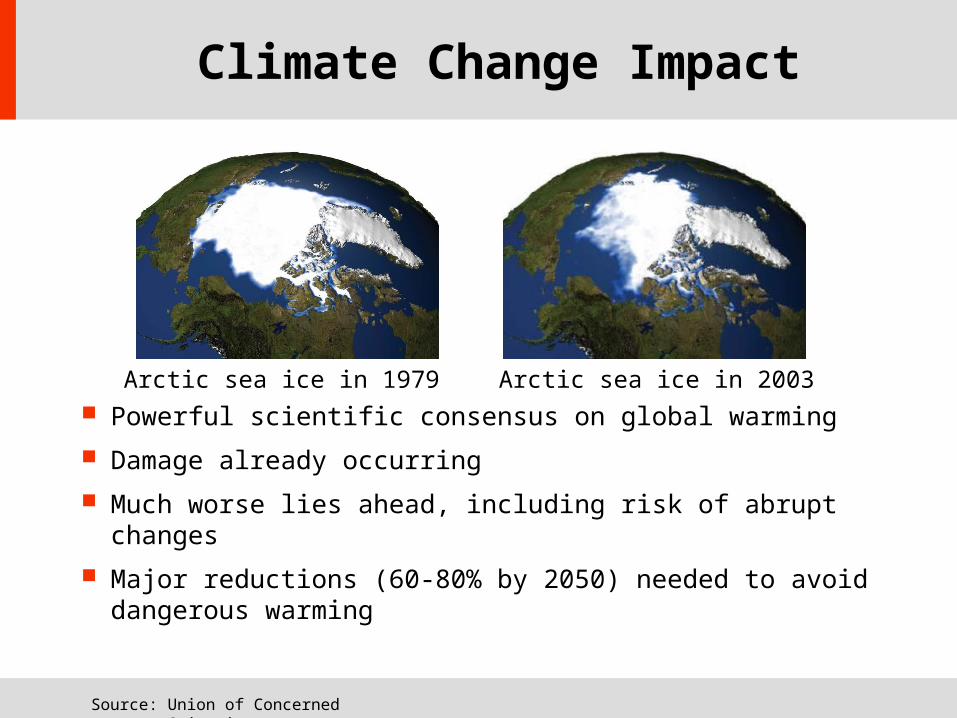
Climate Change Impact
Powerful scientific consensus on global warming
Damage already occurring
Much worse lies ahead, including risk of abrupt changes
Major reductions (60-80% by 2050) needed to avoid dangerous warming
Arctic sea ice in 1979 Arctic sea ice in 2003
Source: Union of Concerned Scientists

States with Global Warming Targets
Source: Pew Center on Global Climate Change.

Multiple Energy Use Problems
1. Increasing costs for new power plants and fuel driving rates up
2. Facility energy operating budgets increasing
3. Global climate change with electric and gas energy use responsible for two thirds of greenhouse gases

Multiple Benefits of Efficiency
1. Reducing future utility rate increases - Energy Efficiency < $500 per kW
while it costs >$2,000 per kW for new power plants
2. Energy operating budget increases - Facilities have saved 20%+ of energy
costs through increased efficiency
3. Global climate change - Increasing efficiency is the most cost
effective solution by far
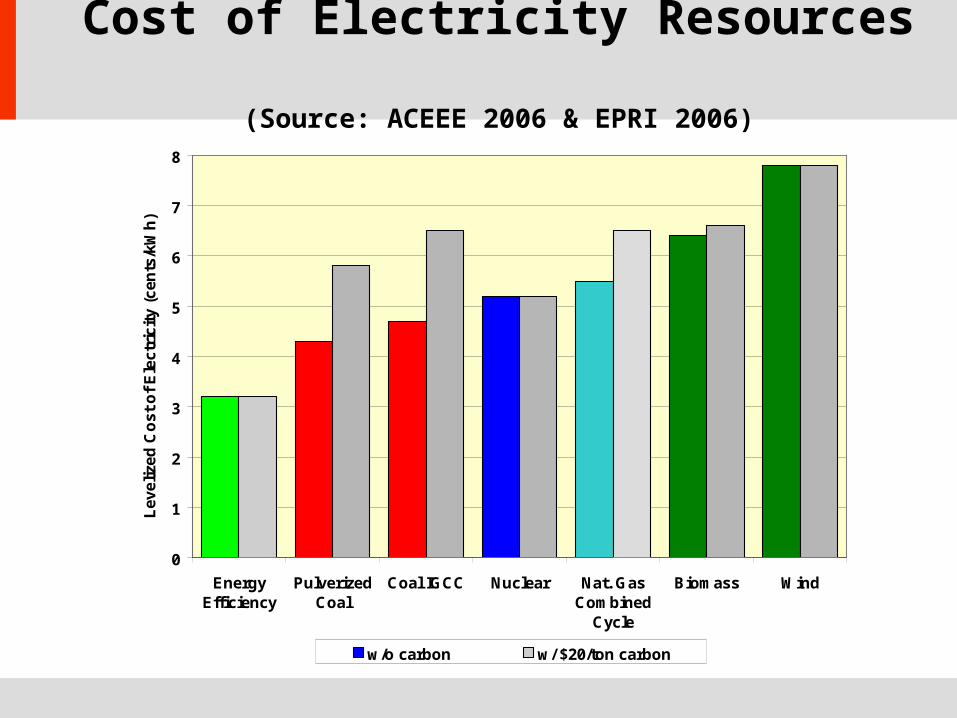
Cost of Electricity Resources (Source: ACEEE 2006 & EPRI 2006)
0
1
2
3
4
5
6
7
8
EnergyEfficiency
PulverizedCoal
Coal IGCC Nuclear Nat. GasCombined
Cycle
Biomass Wind
Lev
eliz
ed C
ost
of
Ele
ctri
city
(ce
nts
/kW
h)
w/o carbon w/ $20/ton carbon
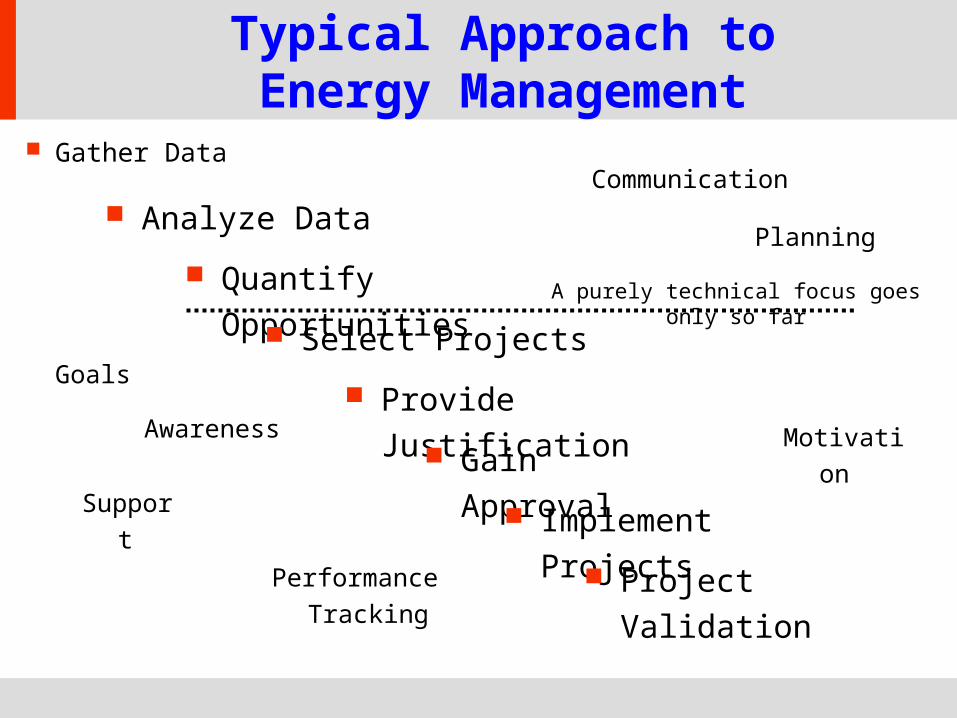
Gather Data
Quantify Opportunities
Select Projects
Provide Justification
Gain Approval
Implement Projects
Analyze Data
Awareness
Planning
Communication
Goals
Support
Motivation
Project ValidationPerformance Tracking
Typical Approach toEnergy Management
A purely technical focus goes only so far

Energy Management ….
…in Theory Management Commitment… Energy Champion… Measure & Monitor… Report & Communicate… Set Energy Savings Goal… Implement Projects…
…in Practice
…Management Concern
…Another “Hat” for Someone
…No Payback on Sub-Meters
…Monthly Actual vs. Budget
…Based on What?
…No Support

Practical Energy Management
8 Sections
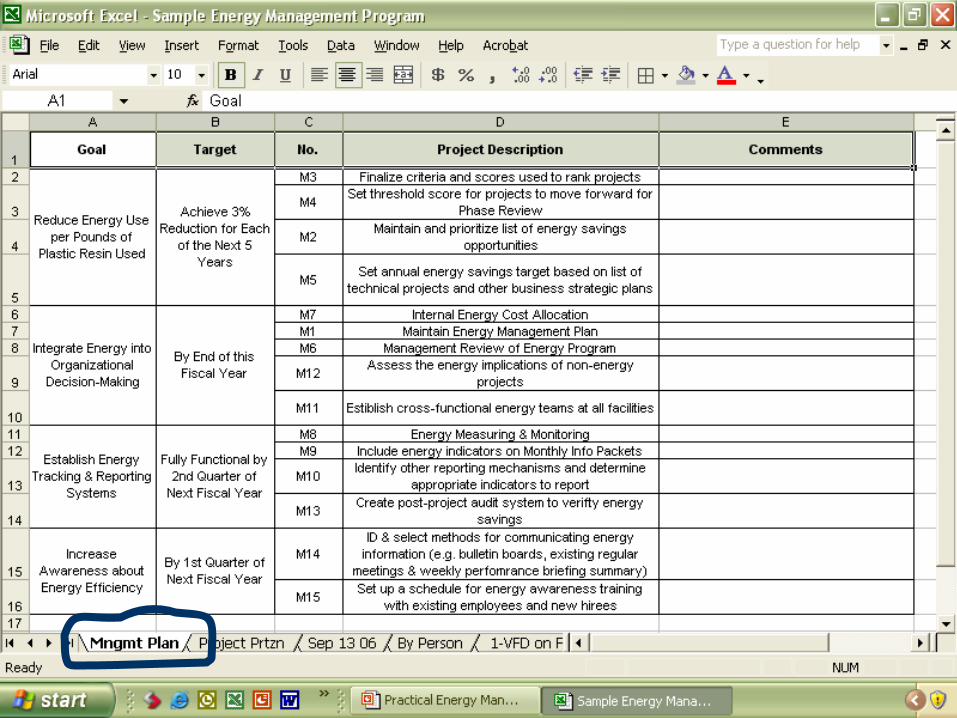
1. Management Plan
2. Facility Profile
3. Energy Use Profile
4. Best Practices
5. Project Prioritization
6. Project Management
7. Key Performance Indicators
8. Continual Improvement
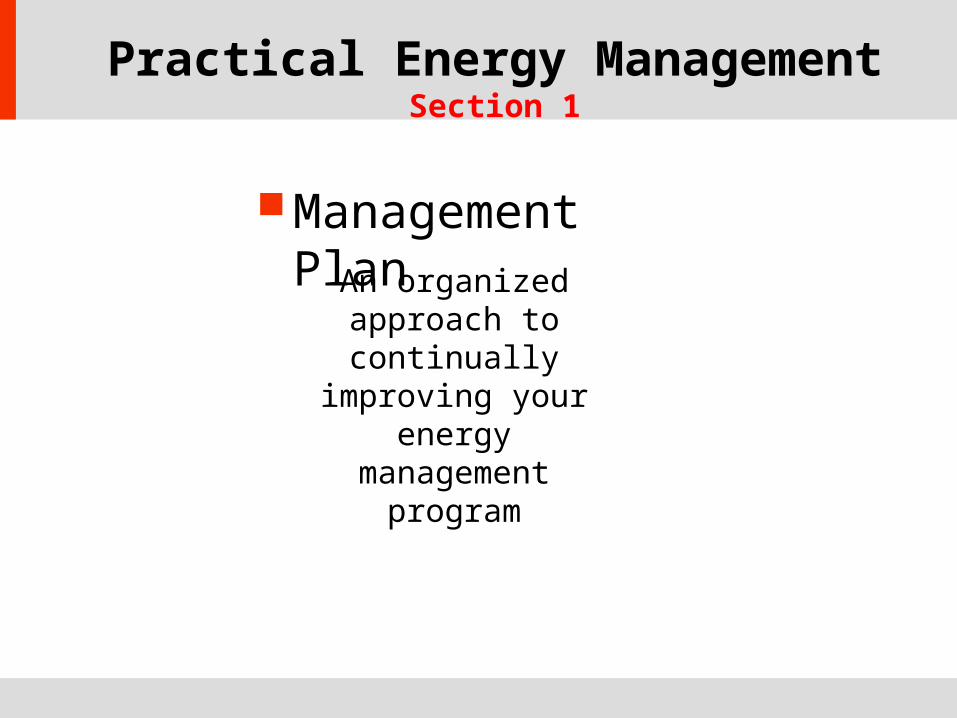
Practical Energy Management
Section 1
Management PlanAn organized
approach to continually
improving your energy
management program

Practical Energy Management
Section 2
Facility ProfileA summary of the energy data for
your facility relative to other costs and years

Practical Energy Management
Section 3
Energy Use Profile
Estimates and shows the relative
energy consumption for
equipment
ElectricalMMBtu
39
18
30
30
7
8
15 Chiller #1Chiller #2Chiller #3LightingComp AirOfficeOther

Practical Energy Management
Section 4
Best PracticesDescription of Energy Best
Practices for 16 common systems
and first cut estimate of energy
savings
16 Systems:
• Compressed air
• Lighting
• Space heating
• Ventilation
• Pumps
• Fans
• etc….
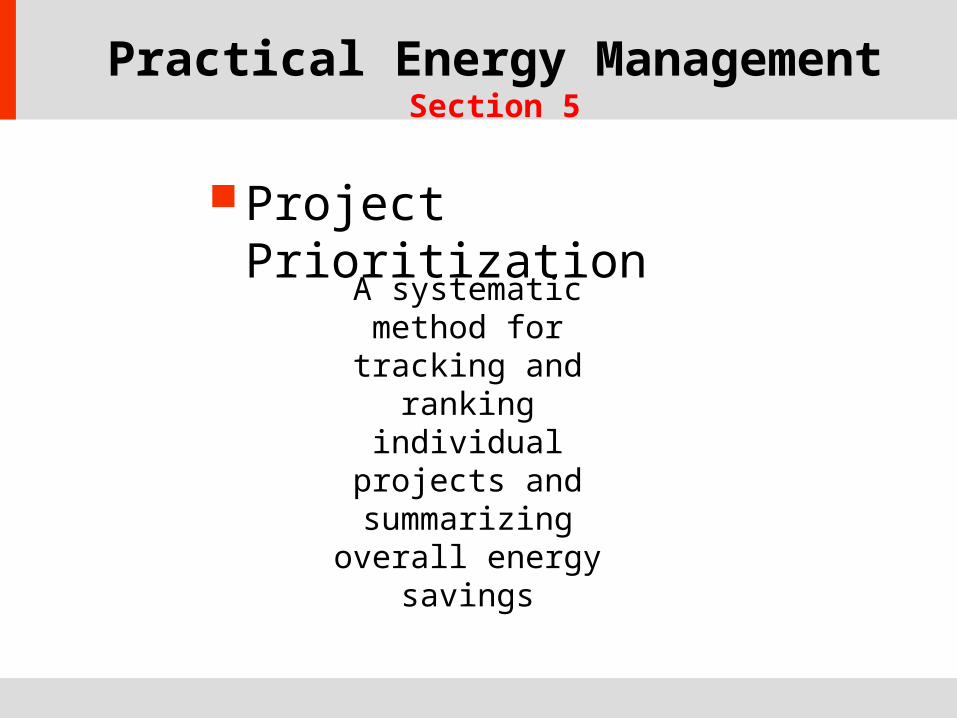
Practical Energy Management
Section 5
Project Prioritization
A systematic method for tracking and
ranking individual projects and
summarizing overall energy savings

“Left Side”
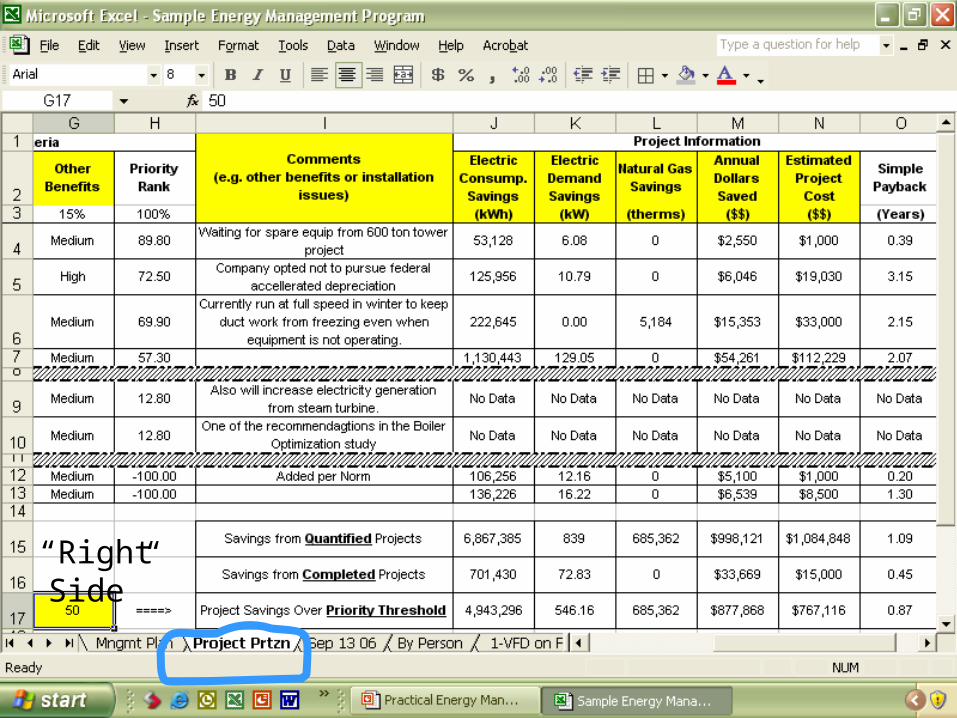
“Right Side”

Practical Energy Management
Section 6
Project Management
A systematic method for managing tasks
and projects


Practical Energy Management
Section 7
Key Performance Indicators
Measures energy use per KPI such as
MWh per Million Gallons
Practical Energy Management
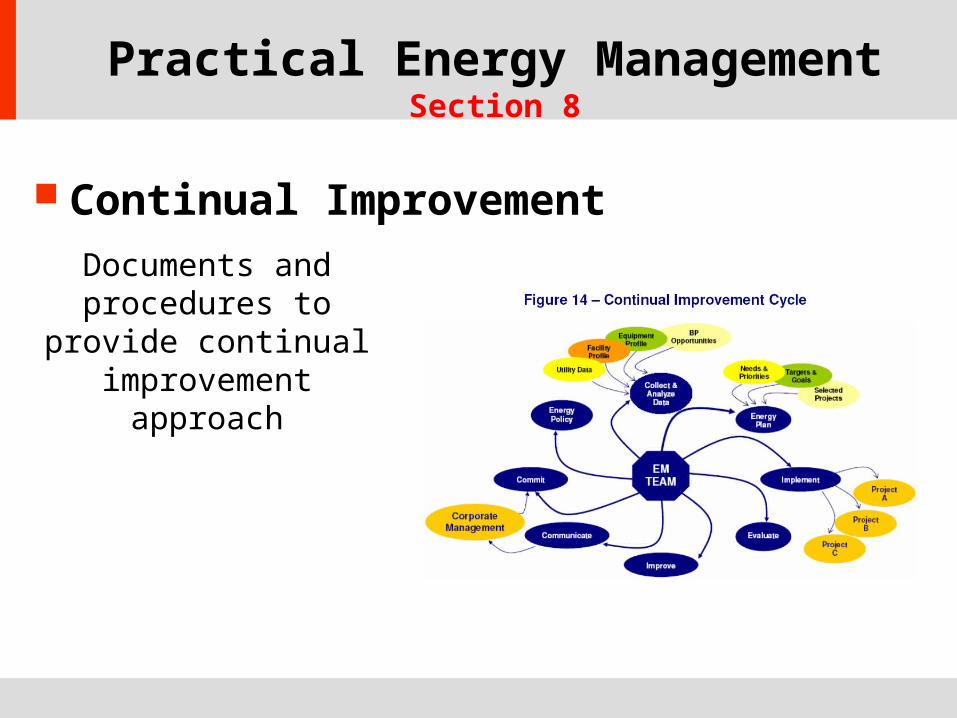
Section 8
Continual ImprovementDocuments and procedures to
provide continual improvement
approach

Briefing & Reports for
Senior Manageme
nt
Briefing & Reports for
Senior Manageme
nt
Energy Manageme
ntPlan
Energy Manageme
ntPlan
Prioritized List of Energy Projects
Prioritized List of Energy Projects
Energy Team or Advocate Task List
Energy Team or Advocate Task List
It All Starts Here
PEM© Process for Energy Teams

Key Common Projects
Steam Systems (>80% of Gas Use) - 10 to 20% savings from failed steam traps, blowdown heat recovery, linkage-less burner controls, stack economizers, ventilation controls
Compressed Air Systems (10% kWh) - 10 to 50% savings from repairing leaks, centralized control, reduce pressure, variable speed controls
Pumping Systems (15% of kWh) – up to 40% savings from using variable speed controls instead of valves
Lighting Systems (8% of kWh) – 40 to 60% savings from using high bay fluorescent fixtures
Process Heating – up to 80% savings from recovering waste heat. This is a significant opportunity in some industries.

Key Emerging Opportunities
Drying/Separation - up to 55% savings from membrane technology
Process Heating/Melting - up to 40% savings from stack melters
Bio Gasification - up to 100% savings especially in Pulp and Paper
New Motor/Control Technologies - up to 60% savings
Combined Heat and Power (CHP) - very large potential savings

Focus Mission
Accelerate the rate of energy efficiency improvement in Wisconsin by supporting energy efficiency projects that otherwise would not get completed.

Similar Programs
Source: Pew Center on Global Climate Change.

Focus Program Basics
1. Project incentives Prescriptive/Direct Custom (up to 30% of project
costs)
2. Study Incentives (50%)
3. Technical Support
4. Information & Education

Current Focus on Energy Budget
18 Month Focus Budgets
$94.7 million Total Programs
$51.6 million Business Programs $20 million Industrial Programs
$34.8 million Residential Programs
$8.3 million Renewable Program
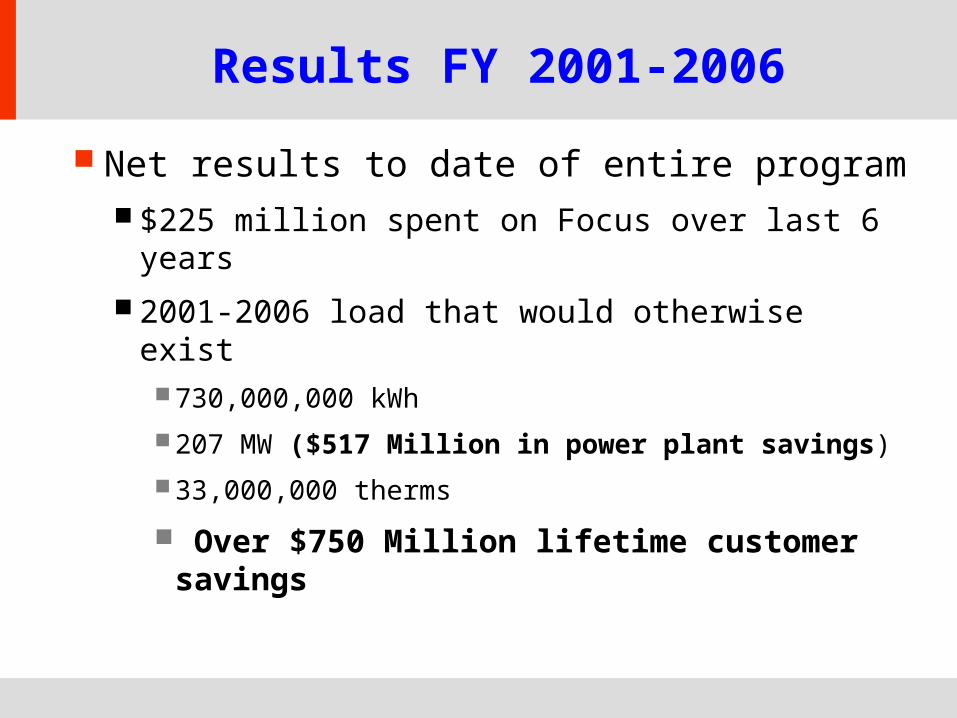
Results FY 2001-2006
Net results to date of entire program $225 million spent on Focus over last 6 years
2001-2006 load that would otherwise exist730,000,000 kWh
207 MW ($517 Million in power plant savings)
33,000,000 therms
Over $750 Million lifetime customer savings

Industrial Program Results First Quarter FY 2007
Units
Unverified Gross
Sept 2007
Unverified GrossYTD
Estimated UnverifiedNet YTD*
Target throughDecember 31,
2008 % of Target
Kw 1,031 3,417 2,529 18,750 13.5%
kWh 8,086,370 23,549,347 17,441,518 127,500,000 13.7%
Therms 78,239 1,484,549 907,838 6,000,000 15.1%

CA
CT MA
ME
NH
NJ
NY
ORRI
TX
VT
WI
0
200
400
600
800
1000
0 50 100 150 200 250
Wisconsin Potential
Annual Budget ($ millions)
An
nu
al S
avi
ng
s (m
illio
ns
of
kWh
)
CA
CT MA
ME
NH
NJ
NY
ORRI
TX
VT
WI
0
200
400
600
800
1000
0 50 100 150 200 250
Wisconsin Potential
Annual Budget ($ millions)
An
nu
al S
avi
ng
s (m
illio
ns
of
kWh
)
From ECW Potential Study – 0.7% Max

Industrial EE Barriers
Energy is small part of overall costs and not seen as core business
No commitment from upper management Company culture does not support efficiency investments Limited time to focus on energy
ROI is sometimes too small (> 1 year or >2 years) May not trust energy savings will actually occur
Energy costs are paid out of operation budget, not linked to capital budget

Feedback and Program Improvement
WIEG as a steering group for Focus Industrial Sector
What ways can Focus provide a better service to help you reduce your energy costs?

Focus on Energy
Industrial Technical Support and
Project Incentives
John Nicol
Industrial Sector Manager
608-277-2941
800-762-7077
www.focusonenergy.com