wisconsin — department of health services
TRANSCRIPT
W I S C O N S I N — D E P A R T M E N T O F H E A L T H S E R V I C E S
2014 – Wisconsin Healthy Smiles Survey
The Oral Health of Wisconsin’s Head Start Children
Current Status, Trends and Disparities

AuthorsMelissa Olson, MS Mark Moss, DDS, MS, PHD Marisa Voelker, MPH
Survey Planning and DesignJeffrey Chaffin, DDS, MPH, MBA, MHARobbyn Kuester, RDH, BSDHMelissa Olson, MS
Technical SupportKathy Phipps, EpidemiologistAssociation of State and Territorial Dental Directors
ScreenersJeffrey Chaffin, DDS, MPH, MBA, MHAMatt Crespin, RDH, MPHRobbyn Kuester, RDH, BSDHDiane Flanagan, RDHChristopher Okunseri, BDS, MSc
Suggested CitationOlson MA, Moss ME and Voelker MK. Healthy Smiles Survey: Wisconsin’s Head Start Children, 2014. Wisconsin Oral Health Program, Wisconsin Department of Health Services. P-01702 (Rev. 01/2017).
FundingThis publication was made possible by Grant Number T12HP26285 from the United States Department of Health and Human Services Health Resources and Services Administration. Its contents are solely the responsibility of the authors and do not necessarily represent the official views of the United States Department of Health and Human Services.
The Wisconsin Department of Health Services Oral Health Program would like to thank the Wisconsin Head Start Association and the Wisconsin Head Start Collaborative Office, and all of the Head Start agencies and children who participated in the 2014 Healthy Smiles Survey.
AC
KN
OW
LED
GE
ME
NTS
THE ORAL HEALTH OF WISCONSIN’S HEAD START CHILDREN – 2014
PAGE ONE

Executive Summary . . . . . . . . . . . . . . . . . . . . . . . . . . . . . . . . . . . . . . . . . . . . . . . . . . . . . . . . . . . . . .3
Introduction . . . . . . . . . . . . . . . . . . . . . . . . . . . . . . . . . . . . . . . . . . . . . . . . . . . . . . . . . . . . . . . . . . . .4
Methods . . . . . . . . . . . . . . . . . . . . . . . . . . . . . . . . . . . . . . . . . . . . . . . . . . . . . . . . . . . . . . . . . . . . . .6
Results . . . . . . . . . . . . . . . . . . . . . . . . . . . . . . . . . . . . . . . . . . . . . . . . . . . . . . . . . . . . . . . . . . . . . . . .7
Conclusion . . . . . . . . . . . . . . . . . . . . . . . . . . . . . . . . . . . . . . . . . . . . . . . . . . . . . . . . . . . . . . . . . . .14
Data Tables . . . . . . . . . . . . . . . . . . . . . . . . . . . . . . . . . . . . . . . . . . . . . . . . . . . . . . . . . . . . . . . . . . .15
References . . . . . . . . . . . . . . . . . . . . . . . . . . . . . . . . . . . . . . . . . . . . . . . . . . . . . . . . . . . . . . . . . . . .16
Appendix A: Head Start and Early Head Start Program Names and Locations . . . . . . . . . . . . . .17
Appendix B: Division of Public Health Regions . . . . . . . . . . . . . . . . . . . . . . . . . . . . . . . . . . . . . . .19
TAB
LE O
F C
ON
TEN
TS
PAGE TWO
THE ORAL HEALTH OF WISCONSIN’S HEAD START CHILDREN – 2014

Executive SummaryHead Start programs play an important role in promoting school readiness for children from low-income families. Tooth decay can have a major impact on a child’s ability to eat, speak, and learn. Children from low-income populations tend to experience a greater amount of tooth decay than children with higher socioeconomic status. It is important to monitor oral health status so that resources can be targeted to address areas of need. This survey of children in Head Start centers in Wisconsin provides valuable information on oral health status that can be useful for future policy and program development.
For this survey, a representative sample of Head Start centers was selected with 751 children at these centers screened. Approximately 17 percent were age three, 51 percent were age four, and 32 percent were age five years. The findings indicated that 23 percent of the children had untreated tooth decay, which was similar across the age groups. The proportion of children with treated decay increased with age:15 percent of three-year-olds, 23 percent of four-year-olds, and 31 percent of five-year-olds had fillings, crowns, or extractions due to decay. Among the race/ethnicity groups in the sample, a relatively large proportion of children classified as Asian had experienced early childhood caries and treatment for tooth decay.
The findings demonstrate a gap in efforts to reach national goals as outlined in Healthy People 2020 for this age range. Surveys conducted on Wisconsin Head Start children in 2002-03 and 2008-09 showed outcomes without change toward improved oral health. There is a need to identify high-risk children before age three so effective preventive interventions can be provided. Solutions for addressing this need will require coordinated efforts across multiple community groups, medical providers, and public health agencies that work with families and children from birth to age three.
EX
EC
UTI
VE
SU
MM
AR
Y
PAGE THREE
THE ORAL HEALTH OF WISCONSIN’S HEAD START CHILDREN – 2014
IntroductionAccording to the Surgeon General’s report, Oral Health in America: A Report of the Surgeon General, tooth decay is the single most common chronic childhood disease (U.S. Department of Health and Human Services, 2000). While tooth decay has been declining among most age groups, there was an increase in the percentage of children aged two to five years with dental caries, from 24 percent in 1988-1994 to 28 percent in 1994-2004 (Dye et al., 2007). However, new data from the 2011-2012 National Health and Nutrition Examination Survey show that the rate of untreated tooth decay has declined among children between the ages of two and five to approximately 23 percent (Dye, Thornton-Evans, Li, & Iafolla, 2015).
As with general health, oral health status tends to vary based on socioeconomic factors such as income and education. Children enrolled in Head Start, like other children from low-income families, experience more tooth decay than children from families with higher incomes. The impact of oral disease on children is significant. Early tooth loss caused by tooth decay can result in delays in growth and development. Untreated oral disease can result in problems with eating, speaking, and learning. Children experiencing chronic dental pain are unable to focus, may have more difficulty learning, and are more likely to miss school. Elementary school children from families with low incomes are three times more likely to miss school because of oral health problems (Holt & Barzel, 2013).
INTR
OD
UC
TIO
N
PAGE FOUR
THE ORAL HEALTH OF WISCONSIN’S HEAD START CHILDREN – 2014

Wisconsin conducts the Healthy Smiles Survey in collaboration with Head Start because we share priorities for improving health in vulnerable children. Head Start is a federal comprehensive child development program that works with low-income families to help children develop socially, cognitively, emotionally, and physically to succeed in school and throughout life. The program serves children from birth to age five, pregnant women, and their families. Children in Wisconsin Head Start programs come from diverse backgrounds. Approximately 19 percent have a primary language other than English in their family homes. Children enrolled in Head Start take part in a variety of educational activities, eat healthy meals and snacks, receive medical and oral health care, and play in safe indoor and outdoor environments. In Wisconsin, there are 37 Head Start and 20 Early Head Start programs managed by 20 unique organizations. See Appendix A for a table of the Head Start programs in Wisconsin.
PAGE FIVE
THE ORAL HEALTH OF WISCONSIN’S HEAD START CHILDREN — 2014

MethodsThe Healthy Smiles Survey included a representative sample of Wisconsin’s 13,254 Head Start children. The sampling frame for the survey consisted of all Head Start programs in Wisconsin, including tribal and migrant/seasonal programs with at least 20 children enrolled. The sampling frame was stratified by the five Division of Public Health regions (Appendix B) and then probability proportional to size sampling was used to randomly select programs within each region. Passive consent was used for the survey with a participation rate of 79 percent.
Dental hygienists completed the screenings using gloves, headlamps, and disposable mouth mirrors. The diagnostic criteria outlined in the Association of State and Territorial Dental Director’s (2008) publication Basic Screening Surveys: An Approach to Monitoring Community Oral Health were used. The screeners attended a training session, which included a didactic review of the diagnostic criteria along with a hands-on calibration session (Table 1).
PAGE SIX
THE ORAL HEALTH OF WISCONSIN’S HEAD START CHILDREN – 2014
Table 1: Basic Screening Survey Indicator Definitions
Basic Screening Survey Indicator Definition
The presence of a dental cavity (caries) in which the screener Untreated Decay can readily observe breakdown of the enamel surface. This protocol only includes cavitated lesions as untreated decay.
The presence of any type of filling, including temporary Treated Decay fillings. Treated decay also includes teeth that were extracted due to decay and crowns that cover the whole tooth or most of the tooth.
This is a calculated indicator from untreated decay and treated Caries Experience decay. All children with either treated or untreated decay or both have caries experience.
Any child with one of his or her six upper front teeth either Early Childhood Caries (ECC) decayed, filled, or missing due to caries was considered to have early childhood caries (ECC).
Children with no obvious problems were coded as having no treatment needs. Children with untreated decay without Urgency of Need for Dental Care accompanying signs or symptoms of pain, infection, or swelling were coded as having early treatment needs, while those with accompanying signs or symptoms were coded as having urgent treatment needs.
Demographic indicators including date of birth, gender, and race/ethnicity were obtained from Head Start staff. Due to small numbers among American Indian/Alaska Native, Native Hawaiian/Pacific Islander, and multi-racial groups these responses were combined with those who were missing race/ethnicity into an Other category for analysis and reporting.
The data were adjusted to account for the complex sampling scheme and non-response. Data analysis, which included frequencies, cross tabs, and 95 percent confidence intervals was completed using SAS version 9.3.
ME
THO
DS

ResultsA total of 751 Head Start children at 17 sites had an oral health screening. Table 2 shows the demographics of the children included in the sample. The age range was three to five years old, where 51 percent of children at the time of the screening were four years old. The largest racial/ethnic group was white (37%), followed by Hispanic (23%), and African American (21%). Thirty-six percent of Head Start children screened lived in the Southeastern region, the region of the state with the greatest population density and the largest number of children enrolled in Head Start.
PAGE SEVEN
THE ORAL HEALTH OF WISCONSIN’S HEAD START CHILDREN – 2014
Table 2: Age, Gender, and Race/Ethnicity of Head Start Children with an Oral Health Screening
Indicator Number of Children Percentage of Children
Total 751 100
Age
3 years 128 17.0
4 years 386 51.4
5 years 237 31.6
Gender
Female 349 46.5
Male 402 53.5
Race/Ethnicity
White 277 36.9
Hispanic 169 22.5
African American 158 21.0
Asian 80 10.7
Other* 67 8.9
Region
Northeast 122 16.2
North 141 18.8
Southeast 272 36.2
South 96 12.8
West 120 16.0
* Other includes: American Indian/Alaska Native, Native Hawaiian/Pacific Islander, multi-racial, and unknown.
RE
SULT
S

PAGE EIGHT
THE ORAL HEALTH OF WISCONSIN’S HEAD START CHILDREN – 2014
Perc
enta
ge
of C
hild
ren
Treated Decay0%
Figure 1: Percentage of Head Start Children with Treated Decay,Untreated Decay, Caries Experience, and Early Childhood Caries,
2013-14
10%
20%
30%
40%
50%
60%
70%
80%
24%Untreated Decay
23%Caries Experience
41%Early Childhood
Caries
20%
Nearly one out of every four Head Start children screened had untreated tooth decay. In addition, approximately 20 percent had Early Childhood Caries, 24 percent had treated decay, and 41 percent had caries experience (Figure 1).

PAGE NINE
THE ORAL HEALTH OF WISCONSIN’S HEAD START CHILDREN – 2014
Nearly one out of every four children screened needed dental care. About 21 percent of the children had early treatment needs, meaning they had untreated decay without accompanying signs or symptoms of pain, infection, or swelling. Two percent of the children had urgent treatment needs, meaning they needed care within 24 to 48 hours due to decay with accompanying signs and symptoms (Figure 2).
Perc
enta
ge
of C
hild
ren
Total Needing Care0%
Figure 2: Percentage of Head Start Children Needing Early and Urgent Dental Care, 2013-14
10%
20%
30%
40%
50%
60%
70%
80%
23%Early Care
21%Urgent Care
2%

PAGE TEN
THE ORAL HEALTH OF WISCONSIN’S HEAD START CHILDREN – 2014
As expected, the older children in the sample had more treated decay, caries experience, and early childhood caries compared to the younger children. Forty-eight percent of five-year-olds had caries experience compared to 36 percent of three-year-olds. However, the level of untreated decay was similar among the three age groups (Figure 3).
Perc
enta
ge
of C
hild
ren
0%
10%
20%
30%
40%
50%
60%
70%
80%
Treated Decay
� 3 Years of Age � 4 Years of Age � 5 Years of Age
Figure 3: Percentage of Head Start Children with Treated Decay, Untreated Decay, Caries Experience, and Early Childhood Caries by Age,
2013-14
15% 23%
Untreated Decay Caries Experience Early ChildhoodCaries
31% 25% 21% 24% 36% 38% 48% 17% 18% 24%
PAGE ELEVEN
THE ORAL HEALTH OF WISCONSIN’S HEAD START CHILDREN – 2014
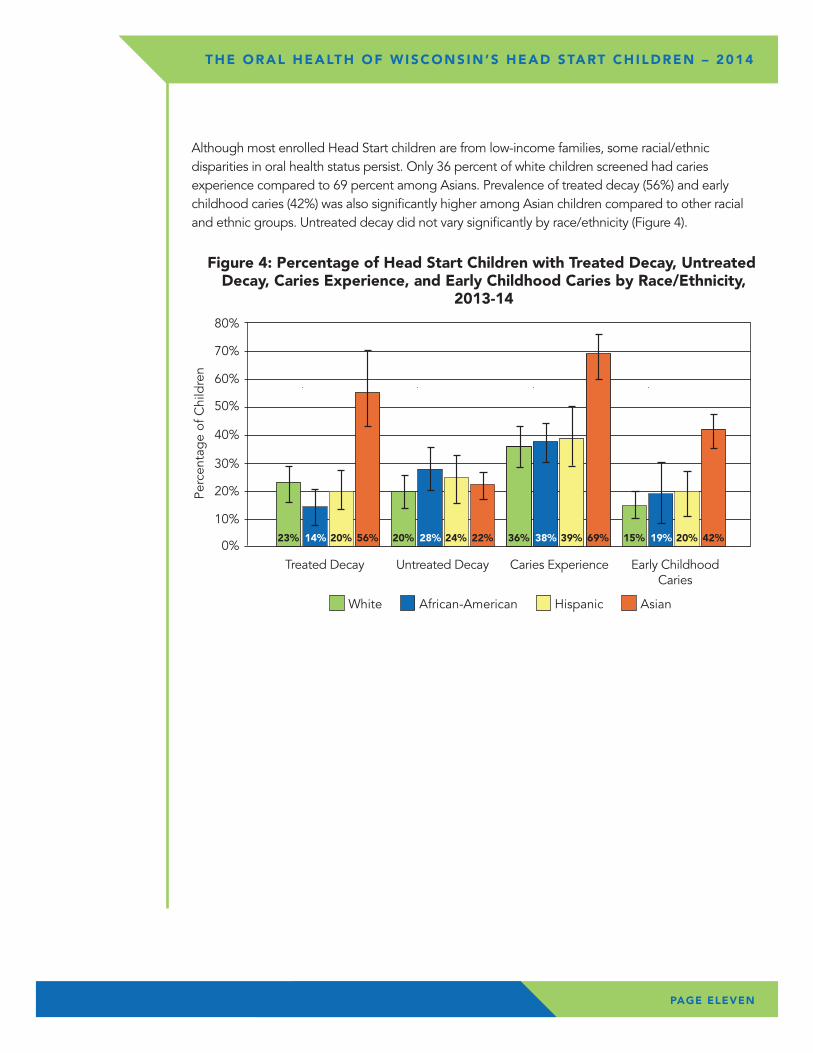
Although most enrolled Head Start children are from low-income families, some racial/ethnic disparities in oral health status persist. Only 36 percent of white children screened had caries experience compared to 69 percent among Asians. Prevalence of treated decay (56%) and early childhood caries (42%) was also significantly higher among Asian children compared to other racial and ethnic groups. Untreated decay did not vary significantly by race/ethnicity (Figure 4).
Perc
enta
ge
of C
hild
ren
0%
10%
20%
30%
40%
50%
60%
70%
80%
Treated Decay
� White � African-American � Hispanic � Asian
Figure 4: Percentage of Head Start Children with Treated Decay, Untreated Decay, Caries Experience, and Early Childhood Caries by Race/Ethnicity,
2013-14
23% 14%
Untreated Decay Caries Experience Early ChildhoodCaries
20% 56% 20% 28% 24% 22% 36% 38% 39% 69% 15% 19% 20% 42%

PAGE TWELVE
THE ORAL HEALTH OF WISCONSIN’S HEAD START CHILDREN – 2014
Healthy People 2020 includes two objectives focused on the oral health status of children between the ages of three and five (U.S. Department of Health and Human Services, 2015). One objective is aimed at reducing untreated decay and the other objective is aimed at reducing all caries experience. Progress toward these objectives is displayed in Figure 5. For untreated decay, the Healthy People 2020 target is 21 percent and 23 percent of children screened had untreated decay in Wisconsin. This demonstrates that Wisconsin is close to meeting the recommended level for this objective for the Head Start population. For caries experience, there is a gap of 11 percent between the target and the observed level in Wisconsin Head Start children. While the Head Start population are a higher risk group, we want all populations to achieve the Healthy People 2020 targets. Wisconsin’s oral health community must collaborate to identify strategies to reduce caries experience for Wisconsin children.
0%
UntreatedDecay
� Healthy People 2020 � Wisconsin
Figure 5:Oral Health of Head Start Children Comparedto Healthy People 2020 Objectives
20% 40% 60% 80%10% 30% 50% 70%Percentage of Children
CariesExperience Progress Needed
Progress Needed23%
21%
41%
30%

PAGE THIRTEEN
THE ORAL HEALTH OF WISCONSIN’S HEAD START CHILDREN – 2014
Wisconsin has completed the Healthy Smiles Survey with Head Start participants three times since the 2002-03 school year. In those 11 years, the oral health status of Head Start children has not changed. For example, untreated decay remained unchanged from 24 percent in the 2002-03 school year to 23 percent in the 2013-14 school year. And, while the survey revealed some improvements between the 2002-03 school year to the 2008-09 school year, the rates went back up between the 2008-09 school year and the 2013-14 school year. It is important to note that the 2002-03 survey had a much smaller sample size, used active consent, and included children between the ages of three and six instead of three and five. These factors may have contributed to some of the changes observed between the first and second iterations of the survey.
Perc
enta
ge
of C
hild
ren
0%
10%
20%
30%
40%
50%
60%
70%
80%
� 2002-03 � 2008-09 � 2013-14
Figure 6: Percentage of Head Start Children with Untreated Decay, Caries Experience, and Early Childhood Caries
2002-03, 2008-09, and 2013-14
Untreated Decay
24% 26% 23%
Early Childhood Caries
22% 10% 20%
Caries Experience
48% 36% 41%
PAGE FOURTEEN
� Dental Sealants � No Dental Sealants
Percentage of Wisconsin’s Third Grade Childrenwith Dental Sealants
2007-2008
51% 49%
THE ORAL HEALTH OF WISCONSIN’S HEAD START CHILDREN – 2014
ConclusionResults from the Healthy Smiles Survey, conducted in collaboration with the Wisconsin Head Start program, provide the opportunity for Wisconsin’s oral health community to formulate strategies to achieve the outcomes identified by Healthy People 2020 objectives. As indicated in the survey results, levels of tooth decay remain unchanged in each of the last three surveys (2002-03, 2008-09, and 2013-14). Among children ages three to five in Head Start, four of 10 have already experienced tooth decay in at least one tooth and one out of four children need treatment for tooth decay.
We know that tooth decay in young children is preventable; the results of the last three surveys provide us with more than adequate information to collaborate and formulate action plan recommendations to promote and support improved oral health in not only Wisconsin Head Start participants, but for all of Wisconsin’s children. The findings of this report provide data for use by dental professionals, public health, and others to champion and test community-based disease prevention and health promotion approaches.
CO
NC
LUSI
ON

DA
TA T
AB
LES
PAGE FIFTEEN
THE ORAL HEALTH OF WISCONSIN’S HEAD START CHILDREN – 2014
Table 3: Oral Health of Head Start Children (N= 751)
Variable Percent Standard Error 95% Confidence Interval
Treated Decay 23.8 3.39 16.4 - 31.2
Untreated Decay 22.5 2.22 17.7 - 27.3
Caries Experience 40.8 3.52 33.1 - 48.5
Early Childhood Caries 19.6 2.25 14.7 - 24.5
Early Dental Care 21.2 2.17 16.4 - 25.9
Urgent Dental Care 1.8 0.40 0.9 - 2.6
Total Needing Care 22.9 2.31 17.9 - 28.0
Table 4: Oral Health of Head Start Children, by Age Percent (95% Confidence Interval)
Age
Variable 3 Years 4 Years 5 Years (n=128) (n=386) (n=237)
Treated Decay 15.2 22.5 30.7 (7.0 – 23.5) (15.1 – 30.0) (20.3 – 41.1)
Untreated Decay 24.9 20.9 23.9 (15.3 – 34.5) (17.1 – 24.6) (15.3 – 32.4)
Caries Experience 35.7 38.0 48.4 (28.9 – 42.5) (30.5 – 45.5) (37.2 – 59.5)
Early Childhood Caries 16.5 17.8 24.3 (11.8 – 21.1) (14.4 – 21.3) (13.6 – 35.1)
Total Needing Care 25.8 21.1 24.4 (15.2 – 36.3) (17.1 – 25.1) (16.2 – 32.5)
Table 5: Oral Health of Wisconsin Head Start Children, by Race/Ethnicity Percent (95% Confidence Interval)
Note: Due to small numbers and unreliable estimates, the results for children in the Other race/ethnicity group are unable to be displayed.
Variable White African American Hispanic Asian (n=277) (n=158) (n=169) (n=80)
Treated Decay 22.5 14.1 20.21 56.2 (15.4 – 29.5) (7.0 – 21.1) (12.1 – 28.2) (41.9 – 70.5)
Untreated Decay 19.6 28.0 24.2 21.7 (13.1 – 26.0) (19.4 – 36.6) (14.6 – 33.9) (16.3 – 27.1)
Caries Experience 36.2 37.7 39.3 68.6 (28.2 – 44.2) (30.2 – 45.1) (27.8 – 50.8) (59.5 – 77.8)
Early Childhood Caries 15.0 18.8 19.5 41.6 (10.3 – 19.7) (7.0 – 30.6) (11.0 – 28.0) (34.7 – 48.4)
Total Needing Care 20.0 28.6 24.8 21.7 (14.0 – 26.0) (19.4 – 37.7) (14.4 – 35.3) (16.3 – 27.1)
PAGE SIXTEEN
THE ORAL HEALTH OF WISCONSIN’S HEAD START CHILDREN – 2014
Association of State and Territorial Dental Directors. (2008). Basic Screening Surveys: An Approach to Monitoring Community Oral Health Preschool and School Children. Reno, NV: Association of State and Territorial Dental Directors.
Dye, B. A., Tan, S., Smith, V., Lewis, B. G., Barker, L. K., Thornton-Evans, G., Eke, P. I., Beltrán-Aguilar, E. D., Horowitz, A. M., & Li, C. H. (2007). Trends in oral health status: United States, 1988-1994 and 1999-2004. Vital Health Stat, 11(248), 1-92.
Dye, B. A., Thornton-Evans, G., Li, X., & Iafolla, T. J. (2015). Dental Caries and Sealant Prevalence in Children and Adolescents in the United States, 2011-2012. NCHS Data Brief, 191. Hyattsville, MD: National Center for Health Statistics.
Holt, K., & Barzel, R. (2013). Oral Health and Learning: When children’s health suffers, so does their ability to learn (3rd ed.). Washington, DC: National Maternal and Child Oral Health Resource Center.
U.S. Department of Health and Human Services. (2000). Oral health in America: A report of the surgeon general. Rockville, MD: U.S. Department of Health and Human Services, National Institute of Dental and Craniofacial Research, National Institutes of Health.
U.S. Department of Health and Human Services. (2015). Healthy People 2020 Oral Health Objectives. Retrieved from http://www.healthypeople.gov/2020/topics-objectives/topic/oral-health/objectives
RE
FER
EN
CE
S

PAGE SEVENTEEN
THE ORAL HEALTH OF WISCONSIN’S HEAD START CHILDREN – 2014
AP
PE
ND
IX A
Appendix A: Head Start and Early Head Start Program Names and Locations
Program Name County Location(s)
ACELERO Learning Head Start Milwaukee
ACELERO Learning Head Start Racine
ADVOCAP, Inc. Head Start Fond du Lac, Green Lake
Bad River Tribal Council Head Start Ashland (Tribe Only)
CAP Services, Inc. Head Start & Early Head Start Marquette, Portage, Waupaca, Waushara
CENTRO Hispano Head Start & Early Head Start Milwaukee
CESA 7 Head Start & Early Head Start Manitowoc, Brown
CESA 11 Head Start & Early Head Start Barron, Chippewa, Dunn, Pepin, Pierce, Polk, St. Croix
Dane County Parent Council, Inc. Head Start Dane, Green
& Early Head Start
Eau Claire Area School District Head Start Eau Claire
Family & Child Learning Centers of N.E.W. Door, Florence, Forest, Langlade, Lincoln, Head Start & Early Head Start Marinette, Oconto, Oneida, Vilas
Family Forum, Inc. Head Start & Early Head Start Ashland, Bayfield, Douglas, Iron, Price
Green Bay Public Schools Head Start Brown (School District Only)
Head Start Child & Family Development Centers, Inc. Crawford, La Crosse, Monroe, Vernon
Ho-Chunk Head Start Jackson, Juneau, Monroe, Sauk, Shawano, Wood (All Tribe Only)
Indianhead Community Action Agency Head Start Burnett, Clark, Rusk, Sawyer, Taylor, Washburn
Jefferson County/CESA 2 Head Start Jefferson, Kenosha (West Kenosha County Only)
Kenosha Achievement Center Early Head Start Kenosha
Kenosha Unified School District Kenosha (School District Only) Head Start Child Development Center
La Casa de Esperenza, Inc. Early Head Start Waukesha
Lac Courte Oreilles Head Start & Early Head Start Sawyer (Tribe Only)
Marathon County Child Development Agency, Inc. Marathon Head Start
Menominee Nation Early Childhood Head Start Menominee (Tribe Only) & Early Head Start
Merrill Area Public Schools/Little Learners’ Head Start Lincoln (School District Only)
Milwaukee Public Schools Head Start Milwaukee (School District Only)
National Centers for Learning Excellence, Inc. Waukesha (EHS), Washington (HS/EHS) Head Start & Early Head Start
Next Door Foundation, Inc. Head Start Milwaukee and Early Head Start

PAGE EIGHTEEN
THE ORAL HEALTH OF WISCONSIN’S HEAD START CHILDREN – 2014
Program Name County Location(s)
Oneida Head Start & Early Head Start Brown (Tribe Only), Outagamie (Tribe Only)
Red Cliff Head Start & Early Head Start Bayfield (Tribe Only)
Renewal Unlimited, Inc. Head Start & Early Head Start Adams, Columbia, Dodge, Juneau, Sauk
Rock-Walworth Comprehensive Family Services Rock, Walworth Head Start & Early Head Start
Sheboygan Human Rights Association, Inc. Head Start Sheboygan
Southwestern WI Community Action Program, Inc. Grant, Iowa, Lafayette, Richland (SWCAP) Head Start & Early Head Start
St. Croix Tribal Head Start Barron (Tribe Only), Washburn (Tribe Only)
Stockbridge - Munsee Head Start Shawano (Tribe Only)
Adams, Barron, Columbia, Dodge, Door, Fond du Lac, United Migrant Opportunity Services, Inc. (UMOS) Green Lake, Jefferson, Manitowoc, Marquette, Head Start & Early Head Start Oconto, Ozaukee, Portage, Rock, Sauk, Sheboygan, St. Croix, Walworth, Waushara, Wood (All Migrant/Seasonal Only)
UW – Oshkosh Head Start Calumet, Outagamie, Shawano, Winnebago
West Bend School District Head Start Washington (School District Only)
Western Dairyland EOC, Inc. Head Start Buffalo, Eau Claire, Jackson, Trempealeau
Wood County Head Start & Early Head Start Wood
Zaasijiwan/Lac du Flambeau Head Start Vilas (Tribe Only) & Early Head Start

AP
PE
ND
IX B
PAGE NINETEEN
THE ORAL HEALTH OF WISCONSIN’S HEAD START CHILDREN – 2014
Wisconsin Department of Health ServicesRegions by County
� Northeastern � Northern � Southeastern � Southern � Western
Appendix B: Wisconsin Division of Public Health Regions by County
Wisconsin Division of Public Health
1 West Wilson Street • Madison, WI 53701
P-01702 (REV. 01/2017)