wisconsin data project summary
TRANSCRIPT
1
�
Wisconsin Executive Summary Report
Arts Education Data Project State Education Agency Directors of Arts Education
Quadrant Research Wisconsin Department of Public Instruction
April 2018

AcknowledgementsTheArtsEduca.onDataProjectwouldliketoacknowledgeandthankthefollowingcollaboratorsandcontributors:
WisconsinDepartmentofPublicInstruc:onArtsEduca:onDataTeamKurtKiefer,AssistantSuperintendent,LibrariesandTechnologyJuliePalkowski,Educa.onConsultant,ContentandLearning,ProjectLead,StateEduca.onAgencyDirectorsofArtsEduca.onJefferyPerry,CustomerServices-LibrariesandTechnologyJefferyPost,CustomerServices-LibrariesandTechnologySusanRose-Adametz,CBAPApplica.on,DataandTechnicalSupportCustomerServicesMelissaStraw,DataWarehouse&DecisionSupport-LibrariesandTechnologyRebeccaVail,Director,ContentandLearning
Addi:onalContributors:AnneKatz,Director,ArtsWisconsinGeorgeTzougros,Execu.veDirector,WisconsinArtsBoard
ArtsEduca:onDataProjectRobertB.Morrison,ProjectDirector,QuadrantResearchJuliePalkowski,ProjectDirector,StateEduca.onAgencyDirectorsofArtsEduca.onDr.PatCirillo,ResearchDirector,QuadrantResearchPatrickMcCormick,ChiefDataOfficer,QuadrantResearchWilliamGrout,DatabaseDesignandDashboardIntegra.on,QuadrantResearchAmberYoung,Analyst,QuadrantResearchElizabethParsons,Analyst,QuadrantResearchJeffHasselberger,Editorial,HasselbergerAssociatesDugGillan,GraphicDesign,HasselbergerAssociates
2
�
This project would not have been possible without the generous support from:
National Support For the Arts Education Data ProjectTheWilliamandFloraHewleYFounda.on
NAMMFounda.onEduca.onalTheatreAssocia.on
Na.onalAssocia.onforMusicEduca.on

About the Arts Education Data Project The Arts Education Data Project is a partnership between the State Education Agency Directors of Arts Education and Quadrant Research. The nationwide project coordinates with participating state departments of education to collect and report arts education data from State Longitudinal Data Systems (SLDS) and other state department of education data sets on an annual basis.
The main partner for the Wisconsin Department of Public Instruction (WI DPI), Quadrant Research, has been an industry leader in displaying arts education data. They have partnered with the WI DPI in the past. In 2008, Quadrant Research and the WI DPI collaborated on the work Arts Education in Wisconsin Public Schools. This survey described the state of arts education in 2008 and predates the state’s Coursework Completion System, as well as the Statewide Longitudinal Data System (SLDS). The SLDS provides the data for the 2018 Wisconsin Arts Education Data Project. The current dashboard provides various grain sizes for the viewer to see — from state to district to school — utilizing arts course and enrollment data to paint a picture of arts education opportunities across Wisconsin.
There are additional key arts partners who have informed this work. They include the State Education Agency Directors of Arts Education, Wisconsin Arts Board, and Arts Wisconsin.
3
�
Recommended Citation: Morrison, R., Young, A., Parsons, E., Cirillo, P. 2018. Arts Education Data Project Wisconsin Executive Summary Report
16 Mount Bethel Road Warren, NJ 07059
© 2018 Quadrant Research

Wisconsin Executive Summary
About the Data
The Wisconsin Department of Public Instruction captures enrollment by grade level for arts courses delivered at Wisconsin traditional public and charter schools from schools with grades PreK through12. The source of data comes directly from information submitted by schools through the 2013-14, 2014-15, and 2015-16 ISES CWCS data collection. The data does not include any arts instruction provided by non-school entities. The data were provided to Quadrant Research for analysis. Each record contained the school, district, course name, teacher, grade level, and student enrollment. Additionally, unique enrollment by discipline and unique total arts enrollment data were provided. The unique enrollment used student-level records to determine unique counts of students within a discipline and across all disciplines to eliminate counting students who would be enrolled in more than one course within a discipline or enrolled in courses across multiple disciplines.
Demographic data is from the Common Core of Data file from the National Center for Education Statistics. Specific data element definitions for Free and Reduced Lunch, Locale Codes, and links to Course Codes and Course Code Descriptions may be found in the Appendix.
2015/2016 School Year
The table above establishes the universe of schools and students referred to throughout the report.
This summary provides a top line view of the data analysis. Please visit https://dpi.wi.gov/fine-arts/data for additional details and to view all the supporting documents. A companion interactive dashboard may be viewed by going to https://dpi.wi.gov/fine-arts/data/dashboard or http://artseddata.org.
School Configuration
Number of Schools
% of Schools Student Enrollment
% Student Enrollment
Elementary 973 49% 329,482 41%
Middle 373 19% 154,099 19%
HighSchool 376 19% 226,435 28%
Other 265 13% 93,052 12%
Totals 1,987 100% 803,068 100%
4
�

How to View the Data
When reviewing the data contained in both the summary report and through the dashboard it is critical to understand what the state policies or expectations are regarding arts education. This will provide important context in which to view the data.
Wisconsin Administrative Codes for the Arts Wisconsin administrative codes identify requirements for the inclusion of art and music content areas. When reviewing the data dashboard and this report, keep in mind that school districts arts programming choices are guided by federal, state, and local governing bodies. Administrative language for the content areas of dance and theatre education are not provided.
Wisconsin is a local control state and does not have a statewide mandated curriculum in any subject area. School districts have the flexibility to identify curriculum and resources to support the building of skills and knowledge in each of the content areas. (https://docs.legis.wisconsin.gov/code/admin_code/pi)
The state administrative codes are listed below for each of the grade bands below:
Based on current administrative code, both art and music are required for every public school student in grades kindergarten through sixth grade. Students must also have access to art and music content areas in grades seven through twelve.
Wisconsin defines core academic subjects as English, reading or language arts, mathematics, science, foreign languages, civics and government, economics, music, art, theatre, dance, history, and geography. (Wis. Admin. Code PI § 34.01 16m)
5
�

Wis. Admin. Code PI § 8.01(2)(j)) The school district board shall provide instruction in health, physical education, art and music as follows: (3) Art instruction shall be provided in accordance with a written comprehensive art curriculum which is based upon concepts developed through sensory awareness, aesthetic discrimination and skill development in the creation of art and the knowledge of human art heritage. Art instruction shall be provided for all pupils in grades kindergarten through 6 and shall be performed by or under the direction of a licensed art teacher. Art instruction shall be available to all pupils in grades 7 through 12 and shall be taught by a licensed art teacher. (4) Music instruction shall be provided in accordance with a written comprehensive music curriculum including developmental experiences involving singing, playing instruments, listening, movement, creative expression and music reading. Music instruction shall be provided for all pupils in grades kindergarten through 6 and shall be performed by or under the direction of a licensed music teacher. Music instruction including general music, vocal music and instrumental music shall be available to all pupils in grades 7 through 12 and shall be taught by a licensed music teacher.
6
�

Key Findings from the Arts Education Data Project for the 2015/2016 School Year
✤ Although most students (97.8%) have access to arts instruction, only 86% of students have access to both music and art as required by state education code.
✤ Seventy-seven percent of all students participated in arts education courses. This represents more than 600,000 students. Participation rates increase with the percentage of students receiving Free/Reduced Price Lunch (FRPL).
✤ Participation in Art (67%) and Music (57%) were highest among the five artistic disciplines. Music and Art are also the most widely available of the arts disciplines.
✤ There were 17,648 students, or 2.2%, who did not have access to any arts instruction. Between 2015 and 2016 there has been a 17% improvement in the number students without access to arts instruction.
✤ The proportion of students without access to any arts courses was greatest in schools where more than 75% of students receive Free/Reduced Price Lunch when compared to the distribution of the total student enrollment.
✤ The following chart highlights where participation in arts education is highest and lowest based on specific characteristics:
✤ Student access to the two required arts disciplines (Art and Music) is lowest in schools where more than 75% of students receive Free/Reduced Price Lunch.
✤ Access to music programs is significantly lower for students in schools where more than 75% of students receive Free/Reduced Price Lunch when compared with access to art (48% for Music and 98% for Art.
✤ Student participation varies greatly between Traditional schools and Charter schools. In traditional schools, 78% of students are enrolled in the arts as compared to 56% for Charter schools.
✤ The overall student-to-arts-teacher ratio is 159 to 1. For Art the ratio is 284:1; for Dance it is 585:1; for Music it is 398:1; for Theatre it is 637:1; and for Other it is 932:1.
7
�
Highest Arts Participation Rates Lowest Arts Participation Rates
High Poverty (Free Lunch Students >75%) Low Poverty (Free Lunch Students < 25%)
Rural Schools City Schools
Traditional Public Schools Charter Schools
Elementary Schools High Schools

SUMMARY Overall Access to Any Arts Instruction “Access” is the lowest threshold measure for arts education. It is used to determine if a school offers at least one arts discipline with any student enrollment. This only indicates presence of program, not breadth, and is used primarily to determine where schools may be operating without arts instruction. In 2016, 97.8% of the 803,068 students had access to one or more arts discipline in schools. This represents 94% of schools offering at least one art form. There were 17,648 students, or 2.2%, who did not have access to any arts instruction. Between 2015 and 2016 there has been a 17% decline (improvement) in the number students without access to arts instruction.
Overall Access to the Required Arts Disciplines In Wisconsin, education code states “all schools offer both music and art.” In 2016, 91% of students had access to both music and art in schools. This represents 86% of schools offering both music and art. There were nearly 72,276 students who did not have access to both music and art.
8
�
2.2%
97.8%
Access to Arts No Access
6%
94%
% of Students % of Schools
9%
91%
Access to 4 Arts Disciplines No Access
14%
86%
% of Students % of Schools
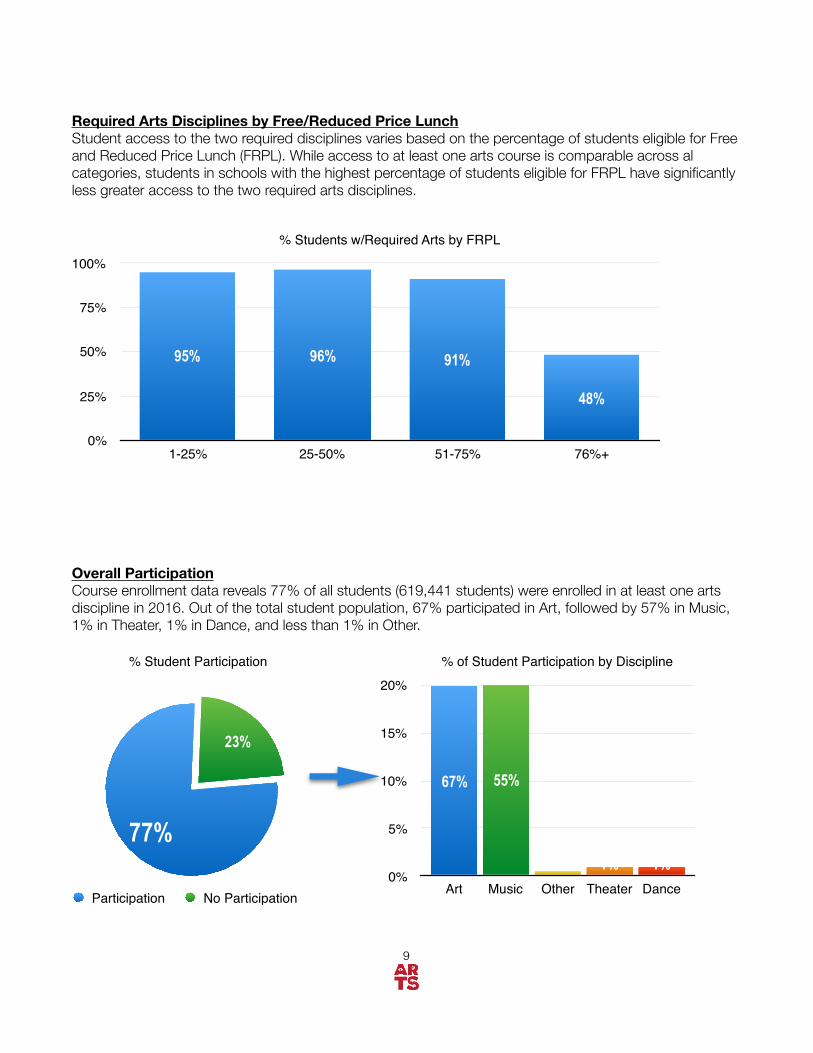
Required Arts Disciplines by Free/Reduced Price Lunch Student access to the two required disciplines varies based on the percentage of students eligible for Free and Reduced Price Lunch (FRPL). While access to at least one arts course is comparable across al categories, students in schools with the highest percentage of students eligible for FRPL have significantly less greater access to the two required arts disciplines.
Overall Participation Course enrollment data reveals 77% of all students (619,441 students) were enrolled in at least one arts discipline in 2016. Out of the total student population, 67% participated in Art, followed by 57% in Music, 1% in Theater, 1% in Dance, and less than 1% in Other.
9
�
% Student Participation
23%
77%
Participation No Participation
% of Student Participation by Discipline
0%
5%
10%
15%
20%
Art Music Other Theater Dance
1%1%0.5%
55%67%
% Students w/Required Arts by FRPL
0%
25%
50%
75%
100%
1-25% 25-50% 51-75% 76%+
48%
91%96%95%

Highest Participation by Variable Arts participation is highest for students attending elementary schools (89%), schools in the locale designation of “city-midsize” (80%), traditional (non-charter) public schools (78%) and schools where 75% or more students were eligible for free/reduced lunch (83%).
Lowest Participation by Variable Arts participation was at the lowest levels for students attending schools designated as high schools (53%), students in schools locale designation of “Suburb-Small” (75%), charter schools (56%), and schools where less than 25% of students are eligible for free/reduced lunch (75%).
10
�
% Student Arts Enrollment
0%
20%
40%
60%
80%
100%
Elemen
tary S
choo
ls
Loca
le:City-
Midsize
Trad.
Public
Schoo
ls
FRLP 75
+%
83%78%80%89%
% Student Arts Enrollment
0%
20%
40%
60%
80%
100%
High Sch
ool
Loca
le:Sub
urb-Small
Charte
r Sch
ools
FRLP <2
5%
75%56%
75%53%

No Arts Schools and Students There were 118 schools providing no arts courses. This impacts 17,648 students (representing 5.9% of schools and 2.2% of all students). This has improved since 2015 (declining from 6.2% of schools and 2.5% of students).
The largest concentration of “no arts” students is in elementary schools (79% or 13,871 students). This represents 4.2% of all elementary students.
No Arts Schools and Students by Locale The greatest percentage of “no arts” schools are in the locale designations of “city, small” and “town, distant” when compared to all schools. The proportion of “no arts” students is also highest in “city, small” and “town, distant” locale designations when compared to the total student enrollment.
11
�
0%
4.5%
9%
13.5%
18%
City
, Lar
geC
ity, M
id-s
ize
City
, Sm
all
Subu
rb, L
arge
Subu
rb, M
id-s
ize
Subu
rb, S
mal
lTo
wn,
Frin
geTo
wn,
Dis
tant
Tow
n, R
emot
eR
ural
, Frin
geR
ural
, Dis
tant
Rur
al, R
emot
e
% All Schools % No Arts Schools
0%
7.5%
15%
22.5%
30%
City
, Lar
geC
ity, M
id-s
ize
City
, Sm
all
Subu
rb, L
arge
Subu
rb, M
id-s
ize
Subu
rb, S
mal
lTo
wn,
Frin
geTo
wn,
Dis
tant
Tow
n, R
emot
eR
ural
, Frin
geR
ural
, Dis
tant
Rur
al, R
emot
e
% All Students % No Arts Students
0%
20%
40%
60%
80%
Distribution of “No Arts” Students % of “No Arts” Students
1%35%
5%
46%
14%
79%
Elementary Middle High Other
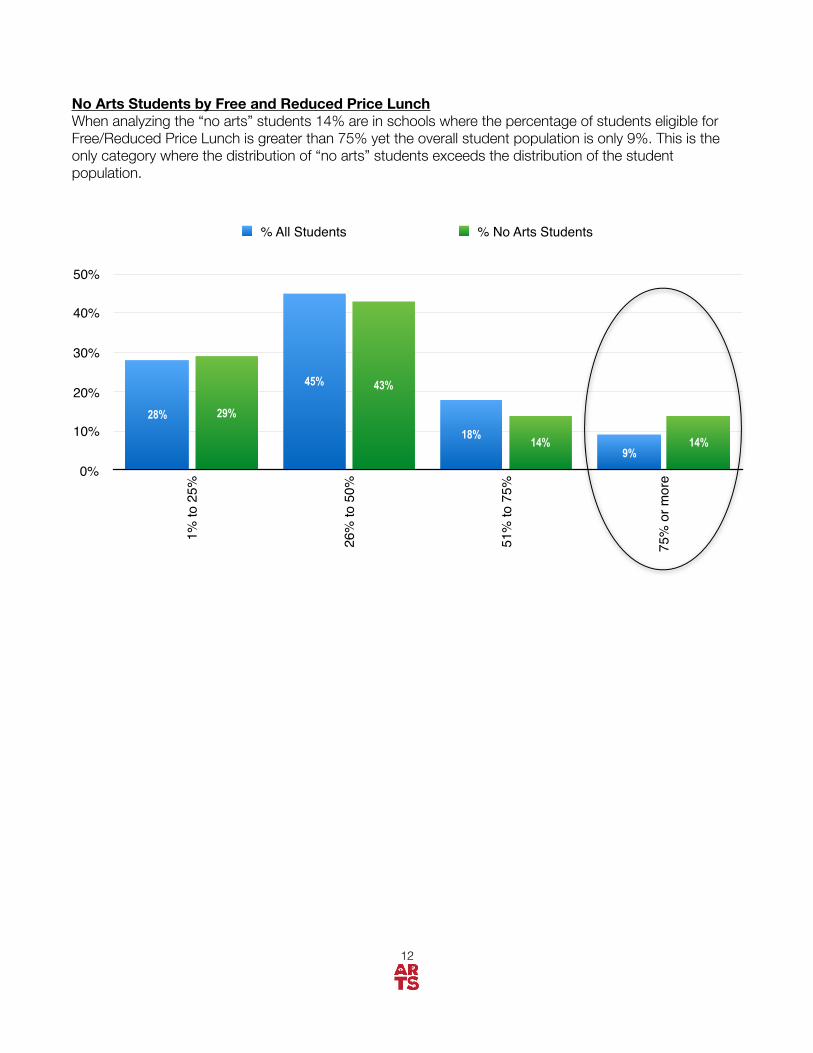
No Arts Students by Free and Reduced Price Lunch When analyzing the “no arts” students 14% are in schools where the percentage of students eligible for Free/Reduced Price Lunch is greater than 75% yet the overall student population is only 9%. This is the only category where the distribution of “no arts” students exceeds the distribution of the student population.
12
�
0%
10%
20%
30%
40%
50%
1% to
25%
26%
to 5
0%
51%
to 7
5%
75%
or m
ore
14%14%
43%
29%
9%18%
45%
28%
% All Students % No Arts Students
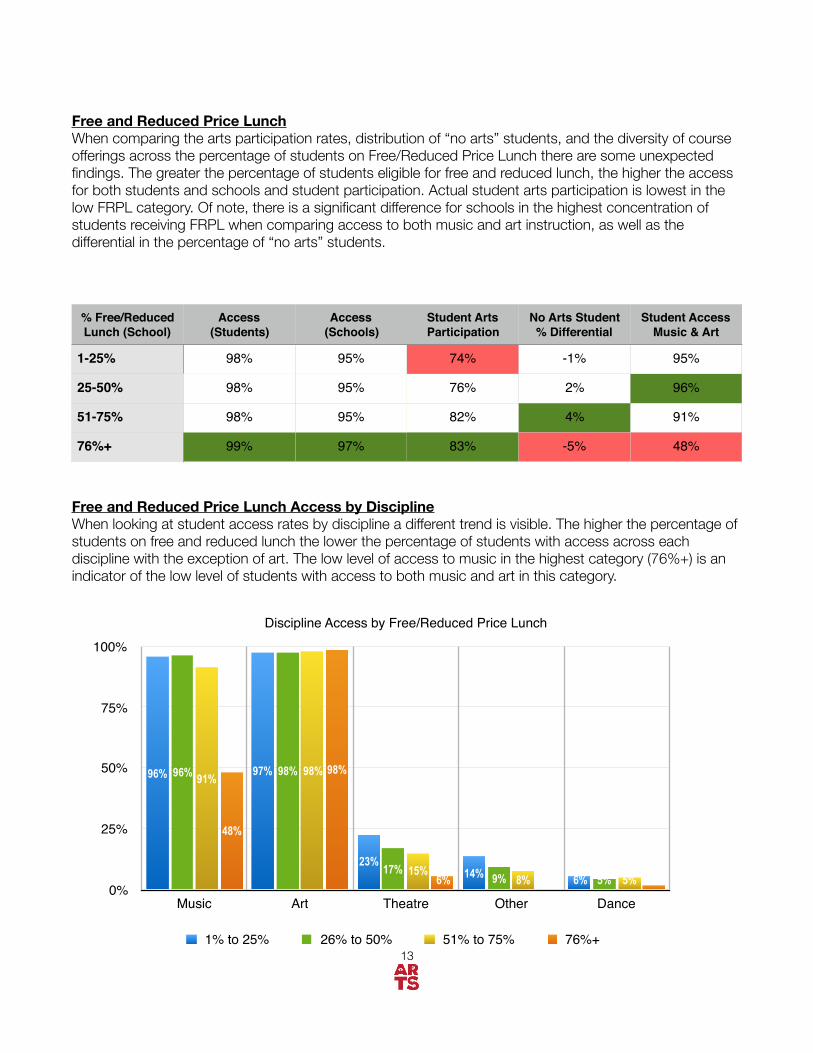
Free and Reduced Price Lunch When comparing the arts participation rates, distribution of “no arts” students, and the diversity of course offerings across the percentage of students on Free/Reduced Price Lunch there are some unexpected findings. The greater the percentage of students eligible for free and reduced lunch, the higher the access for both students and schools and student participation. Actual student arts participation is lowest in the low FRPL category. Of note, there is a significant difference for schools in the highest concentration of students receiving FRPL when comparing access to both music and art instruction, as well as the differential in the percentage of “no arts” students.
Free and Reduced Price Lunch Access by Discipline When looking at student access rates by discipline a different trend is visible. The higher the percentage of students on free and reduced lunch the lower the percentage of students with access across each discipline with the exception of art. The low level of access to music in the highest category (76%+) is an indicator of the low level of students with access to both music and art in this category.
% Free/Reduced Lunch (School)
Access(Students)
Access(Schools)
Student Arts Participation
No Arts Student % Differential
Student Access Music & Art
1-25% 98% 95% 74% -1% 95%
25-50% 98% 95% 76% 2% 96%
51-75% 98% 95% 82% 4% 91%
76%+ 99% 97% 83% -5% 48%
13
�
Discipline Access by Free/Reduced Price Lunch
0%
25%
50%
75%
100%
Music Art Theatre Other Dance
2%0%6%
98%
48%
5%8%15%
98%91%
5%9%17%
98%96%
6%14%23%
97%96%
1% to 25% 26% to 50% 51% to 75% 76%+

Free and Reduced Price Lunch Participation The percentage of student participation in one or more arts discipline increases as the percentage of students eligible for Free and Reduced Price Lunch increases.
Free and Reduced Price Lunch Participation by Discipline When looking at participation by arts discipline we see the participation decline is largely centered in Music as the percentage of Free and Reduced Price Lunch students increase while the opposite is true for art. The decline in participation in Music is mostly based on access to music programs in schools where the percentage of students receiving Free and Reduced Price Lunch is 76% or greater.
14
�
% Student Participation by Free/Reduced Lunch
0%
20%
40%
60%
80%
100%
1-25% 26-50% 51-75% 76%+
83%82%76%74%
% Student Discipline Participation by % Free/Reduced Lunch
0%
20%
40%
60%
80%
Music Art Theatre Other Dance1%0%0%
79%
34%
0%0%2%
73%63%
1%0%1%
65%59%
0%1%2%
62%57%
1-25% 26-50% 51-75% 76%+
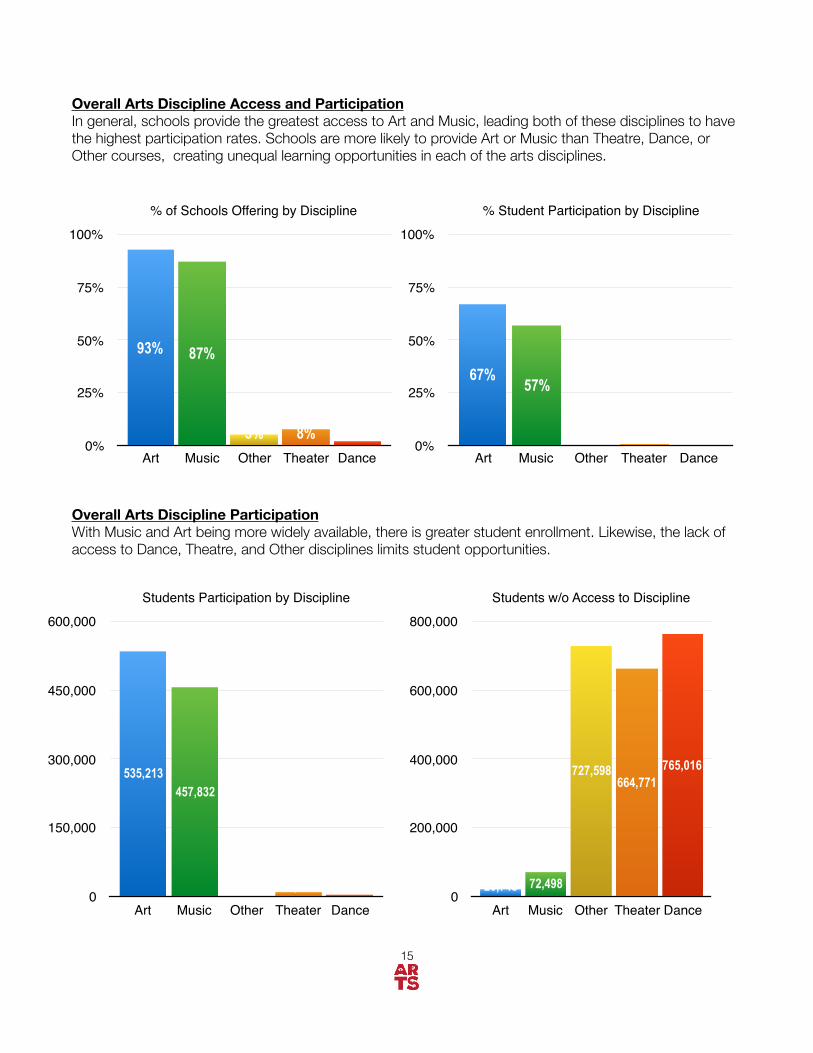
Overall Arts Discipline Access and Participation In general, schools provide the greatest access to Art and Music, leading both of these disciplines to have the highest participation rates. Schools are more likely to provide Art or Music than Theatre, Dance, or Other courses, creating unequal learning opportunities in each of the arts disciplines.
Overall Arts Discipline Participation With Music and Art being more widely available, there is greater student enrollment. Likewise, the lack of access to Dance, Theatre, and Other disciplines limits student opportunities.
15
�
% of Schools Offering by Discipline
0%
25%
50%
75%
100%
Art Music Other Theater Dance
2%8%5%
87%93%
Students w/o Access to Discipline
0
200,000
400,000
600,000
800,000
Art Music Other Theater Dance
765,016664,771
727,598
72,49820,748
% Student Participation by Discipline
0%
25%
50%
75%
100%
Art Music Other Theater Dance0.5%1%0.5%
57%67%
Students Participation by Discipline
0
150,000
300,000
450,000
600,000
Art Music Other Theater Dance
3,55210,6782,677
457,832535,213

Arts Discipline Access by School Type High schools provide greater access to all arts disciplines with the exception of Music. Ninety-five percent of middle schools provide access to Music as compared to 91% of high schools.
Arts Discipline Enrollment by School Type Elementary schools have the largest percentage of student arts enrollment, with music and art very close. Art has the highest percentage of enrollment in middle and high schools. Dance, Theater, and Other is not present until high school.
16
�
% of Schools Providing Access by Discipline Type
0%
25%
50%
75%
100%
Elementary Middle High Other
6%19%
3%0% 3%7%1%0% 8%
31%
7%1%
60%
91%95%89% 90%95%95%93%
Art Music Theatre Dance Other
% of Students Participating by Discipline and School Type
0%
20%
40%
60%
80%
100%
Elementary Middle High Others
0%1%1%0% 1%1%0%0% 2%3%1%0%
33%27%
57%
84%
67%
31%
73%
88%
Art Music Theatre Dance Other

Provision of Two Required Arts Disciplines (Music and Art) Wisconsin Education code states “requirements for the inclusion of art and music.” Eighty-six percent of schools meet this requirement (providing access to 91% of students). The chart below explores school type based on the percentage of student access to the two required arts disciplines. Students attending middle and high schools have greater access to the four required arts disciplines.
Two Required Arts Disciplines by School Category Students attending traditional public schools, as well as schools with a smaller percentage of students qualifying for Free and Reduced Price Lunch are more likely to have access to the required arts disciplines.
17
�
% of Student Access to Two Required Arts Discipline by Traditional/Charter Schools
0%
25%
50%
75%
100%
Traditional Public Charter
59%
95%
% Students w/Access to Music and Arts as Required by School Type
0%
25%
50%
75%
100%
Elementary Middle High Other
82%
97%97%93%
% Student Access to Four Required Arts Discipline by % Free/Reduced Lunch
0%
25%
50%
75%
100%
1-25% 26-50% 51-75% 75% +
75%94%96%96%

Top Courses by Discipline
The top arts courses by discipline based on: presence in schools where the discipline is offered, and the percentage of students participating based on the discipline enrollment (i.e. In schools where Art is offered - Creative Art is provided by 19% of the schools and 7% of all students enrolled in art are enrolled in this course)
Course % of Schools Offering Course
% of Students within Discipline
Art (93% of Schools, 67% Student Participation)
Art (Elementary) 58% 56%
Creative Art (Comprehensive) 19% 7%
Art 11% 5%
Music (87% of Schools, 57% of Students)
Music (Elementary) 57% 57%
Chorus 45% 14%
Band 33% 10%
Orchestra 9% 2%
Dance (2% of Schools, 0.5% of Students)
Dance (Elementary) 9% 37%
Dance Technique 47% 30%
Dance 9% 12%
Theatre (8% of Schools, 1% of Students)
Drama/Acting 38% 23%
Drama/Stagecraft 29% 16%
Other (5% of Schools, 0.5% of Students)
Integrated Fine Arts 14% 32%
18
�

Arts Educators There are 4,950 arts educators teaching in the public schools covered in this report. This is calculated by dividing the number of students in schools offering the discipline by the number of arts teachers. In the chart showing the teachers by discipline, note that a teacher may be counted in more than one discipline. The overall student/arts teacher ratio is 159 to 1. The chart on the right highlights the student/arts teacher ratio for each discipline. A lower ratio is preferable.
The number of teachers dedicated to arts education across all disciplines is greater at the high school level followed by elementary.
19
�
0
1200
2400
3600
Teachers by Discipline
6521781
1,8362,752
0
250
500
750
1000
Student Arts/Teacher Ratio by Discipline
585637
932
398284
Art Music Other Theatre Dance
Number of Teachers by Discipline and School Type
0
250
500
750
1,000
Elementary Middle High Other
1531515 361533210 136014
349
679464
738909977
423
942
Art Music Other Theatre Dance
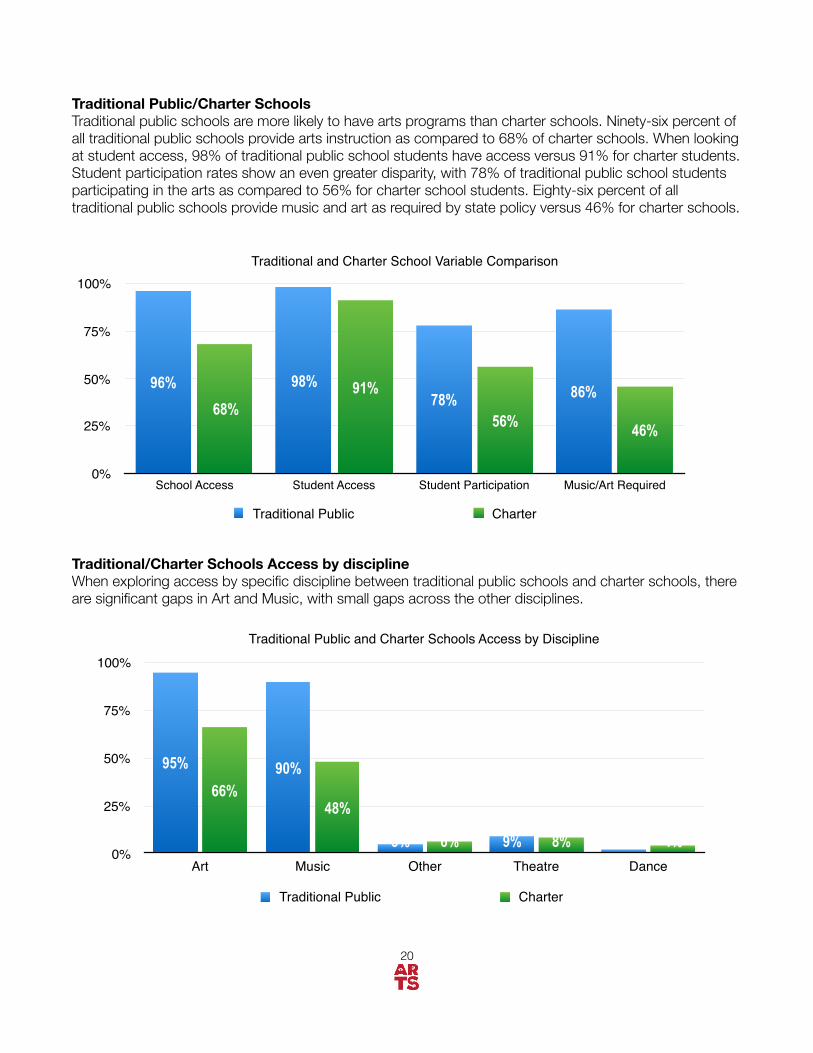
Traditional Public/Charter Schools Traditional public schools are more likely to have arts programs than charter schools. Ninety-six percent of all traditional public schools provide arts instruction as compared to 68% of charter schools. When looking at student access, 98% of traditional public school students have access versus 91% for charter students. Student participation rates show an even greater disparity, with 78% of traditional public school students participating in the arts as compared to 56% for charter school students. Eighty-six percent of all traditional public schools provide music and art as required by state policy versus 46% for charter schools.
Traditional/Charter Schools Access by discipline When exploring access by specific discipline between traditional public schools and charter schools, there are significant gaps in Art and Music, with small gaps across the other disciplines.
20
�
Traditional Public and Charter Schools Access by Discipline
0%
25%
50%
75%
100%
Art Music Other Theatre Dance
4%8%6%
48%66%
2%9%5%
90%95%
Traditional Public Charter
Traditional and Charter School Variable Comparison
0%
25%
50%
75%
100%
School Access Student Access Student Participation Music/Art Required
46%56%
91%68%
86%78%98%96%
Traditional Public Charter

Traditional/Charter Schools No Arts Although charter schools represent about 3% of the overall student population, 9% of all students without access to any arts attend charter schools.
Traditional/Charter Schools Participation Participation rates by discipline differ between traditional public and charter schools.
21
�
Comparison of Total Student Population with No Arts Population by Traditional/Charter Schools
0%
25%
50%
75%
100%
% Student Population % No Arts
9%3% 2%
97%
Traditional Public Charter
Student Participation by Discipline by Traditional/Charter Schools
0%
20%
40%
60%
80%
Art Music Other Theatre Dance
2%2%1%32%
50%
0.5%1%0.5%
57%67%
Traditional Public Charter

Major Locale Code Arts Access and Participation Locale codes provide a way to look at arts access and participation rates through a school’s location in reference to a geographic center. Schools in the Rural classification provide greater access than schools in the city classification. Student participation is stable across all major categories.
Locale Code Subcategories and Arts Access and Participation When exploring the subcategories of the locale codes, access level tracks with the major local codes although there are greater variations in the student participation. Participation rates are the highest in the City/Mid-size and Rural/Remote categories (80%).
22
�
% of Schools with Access
0%
25%
50%
75%
100%
City
, Lar
ge
City
, Mid
-siz
e
City
, Sm
all
Subu
rb, L
arge
Subu
rb, M
id-s
ize
Subu
rb, S
mal
l
Tow
n, F
ringe
Tow
n, D
ista
nt
Tow
n, R
emot
e
Rur
al, F
ringe
Rur
al, D
ista
nt
Rur
al, R
emot
e
95%96%96%89%93%94%91%96%96%92%95%95%
% of Students Enrolled
0%
25%
50%
75%
100%
City
, Lar
ge
City
, Mid
-siz
e
City
, Sm
all
Subu
rb, L
arge
Subu
rb, M
id-s
ize
Subu
rb, S
mal
l
Tow
n, F
ringe
Tow
n, D
ista
nt
Tow
n, R
emot
e
Rur
al, F
ringe
Rur
al, D
ista
nt
Rur
al, R
emot
e
80%79%76%76%78%76%75%77%78%75%80%77%
% of Schools with Access
0%
25%
50%
75%
100%
City Suburb Town Rural
96%93%95%93%
% of Students Participating
0%
25%
50%
75%
100%
City Suburb Town Rural
78%77%77%77%
Appendix A
Free and Reduced Price Lunch
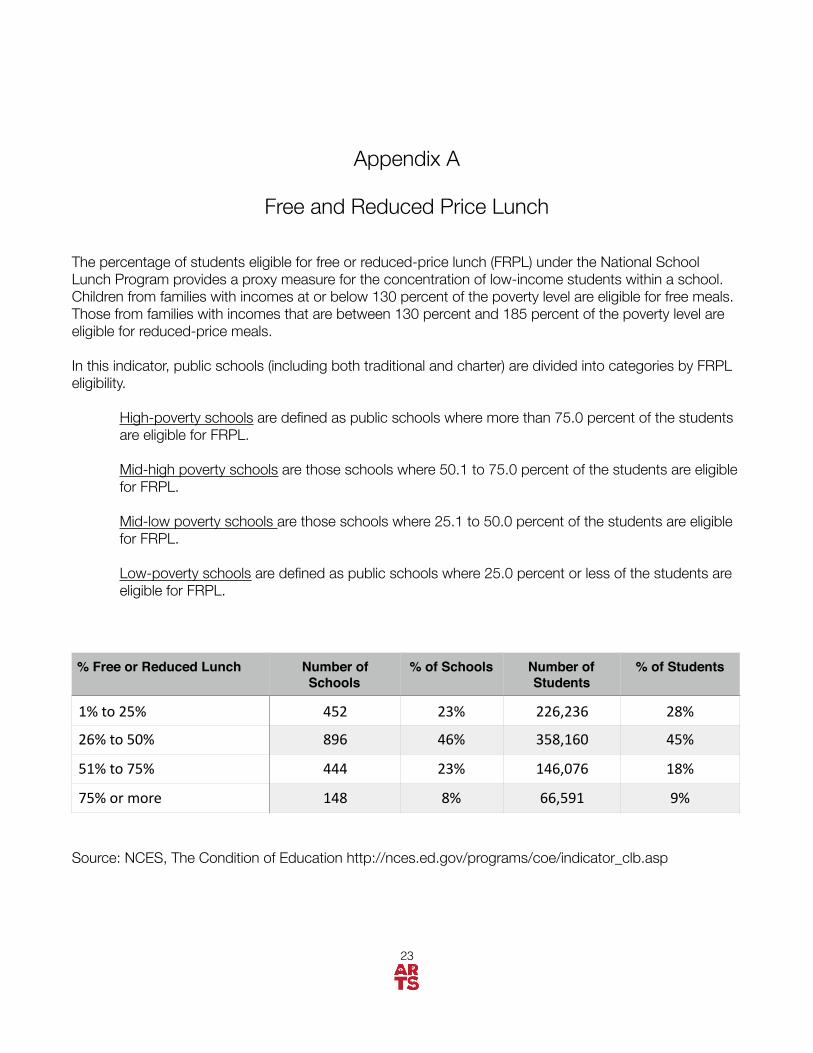
The percentage of students eligible for free or reduced-price lunch (FRPL) under the National School Lunch Program provides a proxy measure for the concentration of low-income students within a school. Children from families with incomes at or below 130 percent of the poverty level are eligible for free meals. Those from families with incomes that are between 130 percent and 185 percent of the poverty level are eligible for reduced-price meals.
In this indicator, public schools (including both traditional and charter) are divided into categories by FRPL eligibility.
High-poverty schools are defined as public schools where more than 75.0 percent of the students are eligible for FRPL.
Mid-high poverty schools are those schools where 50.1 to 75.0 percent of the students are eligible for FRPL.
Mid-low poverty schools are those schools where 25.1 to 50.0 percent of the students are eligible for FRPL.
Low-poverty schools are defined as public schools where 25.0 percent or less of the students are eligible for FRPL.
Source: NCES, The Condition of Education http://nces.ed.gov/programs/coe/indicator_clb.asp
% Free or Reduced Lunch Number of Schools
% of Schools Number of Students
% of Students
1%to25% 452 23% 226,236 28%
26%to50% 896 46% 358,160 45%
51%to75% 444 23% 146,076 18%
75%ormore 148 8% 66,591 9%
23
�

Appendix B
New Urban-Centric Locale Codes
“Locale codes” are derived from a classification system originally developed by NCES in the 1980s to describe a school’s location ranging from “large city” to “rural
Locale codes are a measure of geographic status on an urban continuum that ranges from “large city” to “rural.” The new locale codes used for analysis in this report incorporate changes in the way rural areas are defined, in agreement with geographic standards used in the 2000 decennial Census. The codes are based on the physical location represented by an address that is matched against a geographic database maintained by the Census Bureau. This database is the Topographically Integrated and Geographically Encoded Referencing system, or TIGER.
In 2005 and 2006, NCES supported work by the Census Bureau to redesign the original locale codes in light of changes in the U.S. population and the definition of key geographic concepts.
Locale Code Locale Code Description11 - City, Large Territory inside an urbanized area and inside a principal city with
population of 250,000 or more.12 - City, Midsize Territory inside an urbanized area and inside a principal city with
population less than 250,000 and greater than or equal to 100,000.13 - City, Small Territory inside an urbanized area and inside a principal city with
population less than 100,000.21 - Suburb, Large Territory outside a principal city and inside an urbanized area with
population of 250,000 or more.22 - Suburb, Midsize Territory outside a principal city and inside an urbanized area with
population less than 250,000 and greater than or equal to 100,000.23 - Suburb, Small Territory outside a principal city and inside an urbanized area with
population less than 100,000.31 - Town, Fringe Territory inside an urban cluster that is less than or equal to 10
miles from an urbanized area.32 - Town, Distant Territory inside an urban cluster that is more than 10 miles and
less than or equal to 35 miles from an urbanized area.33 - Town, Remote Territory inside an urban cluster that is more than 35 miles from
an urbanized area.41 - Rural, Fringe Census-defined rural territory that is less than or equal to 5 miles
from an urbanized area, as well as rural territory that is less than or equal to 2.5 miles from an urban cluster.
42 - Rural, Distant Census-defined rural territory that is more than 5 miles but less than or equal to 25 miles from an urbanized area, as well as rural territory that is more than 2.5 miles but less than or equal to 10 miles from an urban cluster.
43 - Rural, Remote Census-defined rural territory that is more than 25 miles from an urbanized area and is also more than 10 miles from an urban cluster.
24
�
Appendix C
Course Codes and Course Code Descriptions
The state of Wisconsin has established a series of course codes and course definitions for each of the arts disciplines (Dance, Music, Theatre, Visual Arts and Other). The complete list of course codes and definitions may be located at the Wisconsin Department of Public Instruction website by going to the following address:
https://dpi.wi.gov/wise/data-elements/coursereference
25
�
26
�
State Partners for the Wisconsin Arts Education Data Project
Arts Education Data Project Partners
National Funders of the Arts Education Data Project