wireless sensors for managing traffic · accel. arrays mag sensors sensor data and video . 42...
TRANSCRIPT

1
If you don’t know what’s happening on your roads, don’t expect to manage the traffic well Pravin Varaiya EECS, University of California, Berkeley Sensys Networks, Inc., Berkeley
Wireless sensors for managing traffic
Work with Ronnie Bajwa, Christopher Flores, Wenteng Ma, Ajith Muralidharan, Ram Rajagopal, Rene Sanchez, Ben Wild
2
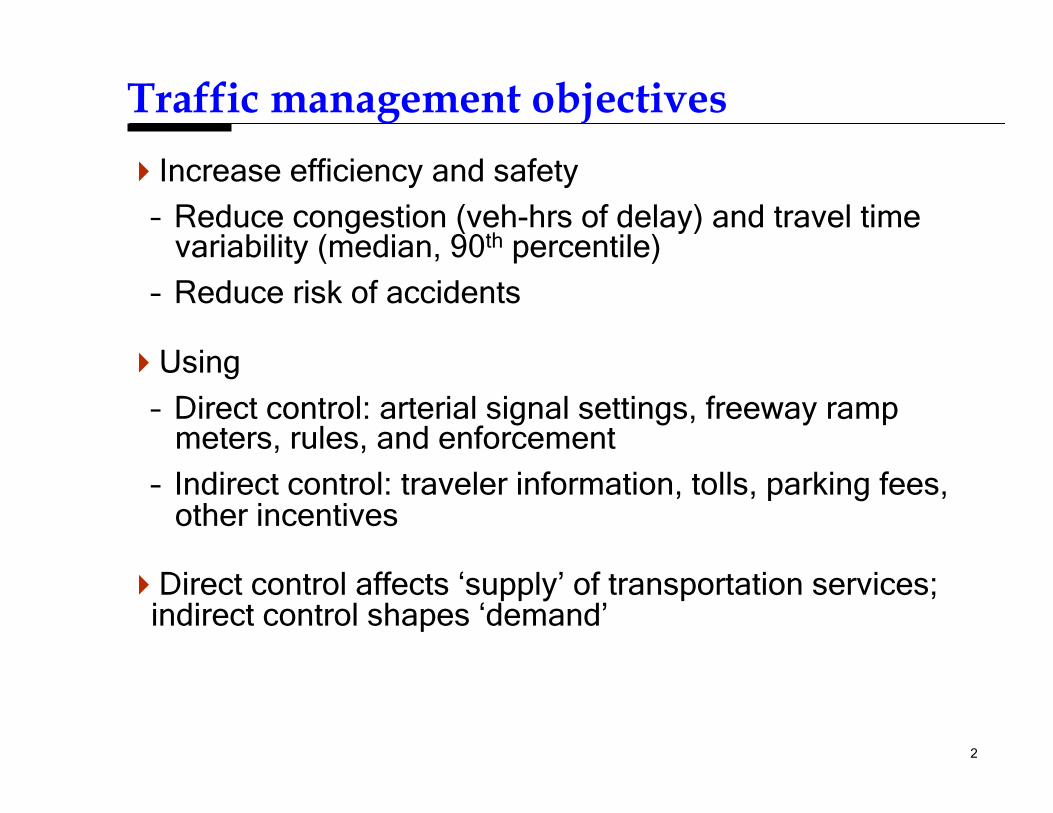
Traffic management objectives
Increase efficiency and safety
– Reduce congestion (veh-hrs of delay) and travel time variability (median, 90th percentile)
– Reduce risk of accidents
Using
– Direct control: arterial signal settings, freeway ramp meters, rules, and enforcement
– Indirect control: traveler information, tolls, parking fees, other incentives
Direct control affects ‘supply’ of transportation services; indirect control shapes ‘demand’

3
Control
Control is feedback function of network state estimate
Estimate obtained by processing traffic sensor signals
Estimate quality depends on sensor spatial coverage, accuracy, and informativeness of measurements
Measure
Estimate
Control
Road network
Signal, ramp settings …
Sensor measurements
Process and storage
State estimate and prediction
4
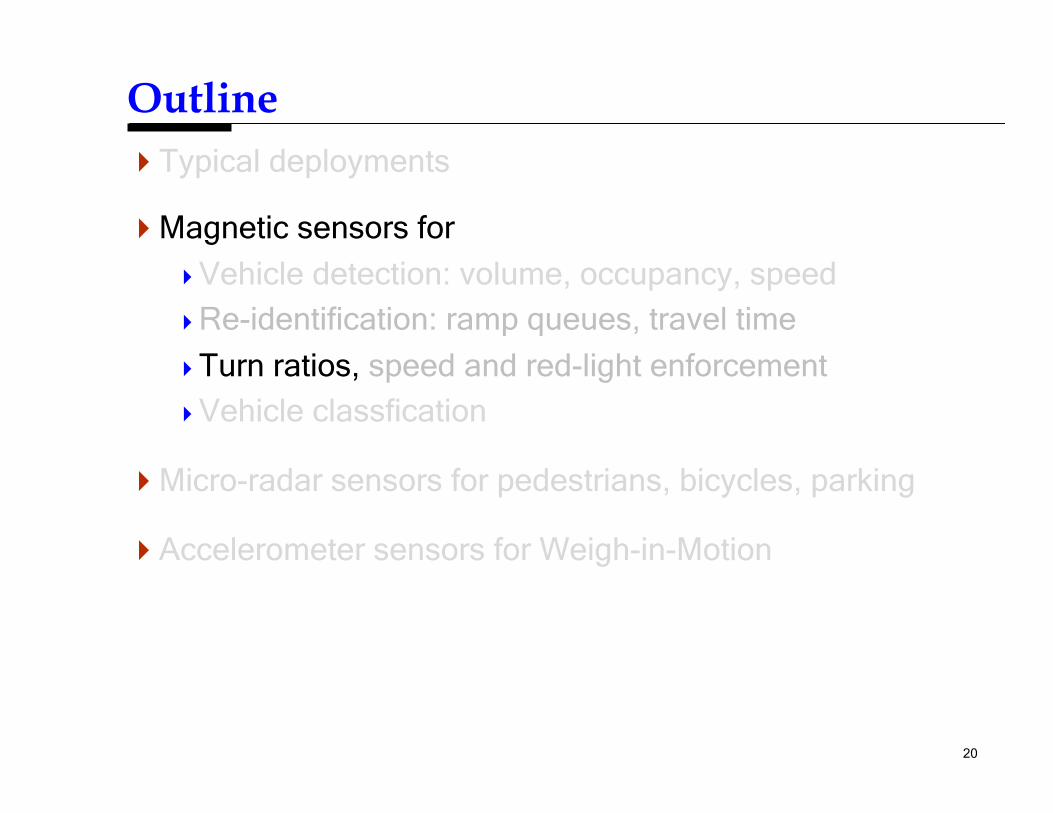
Outline Typical deployments
Magnetic sensors for
Vehicle detection: volume, occupancy, speed Re-identification: ramp queues, travel time
Turn ratios, speed and red-light enforcement Vehicle classfication
Micro-radar sensors for pedestrians, bicycles, parking
Accelerometer sensors for Weigh-in-Motion
5
Outline Typical deployments
Magnetic sensors for
Vehicle detection: volume, occupancy, speed Re-identification: ramp queues, travel time
Turn ratios, speed and red-light enforcement Vehicle classfication
Micro-radar sensors for pedestrians, bicycles, parking
Accelerometer sensors for Weigh-in-Motion

6
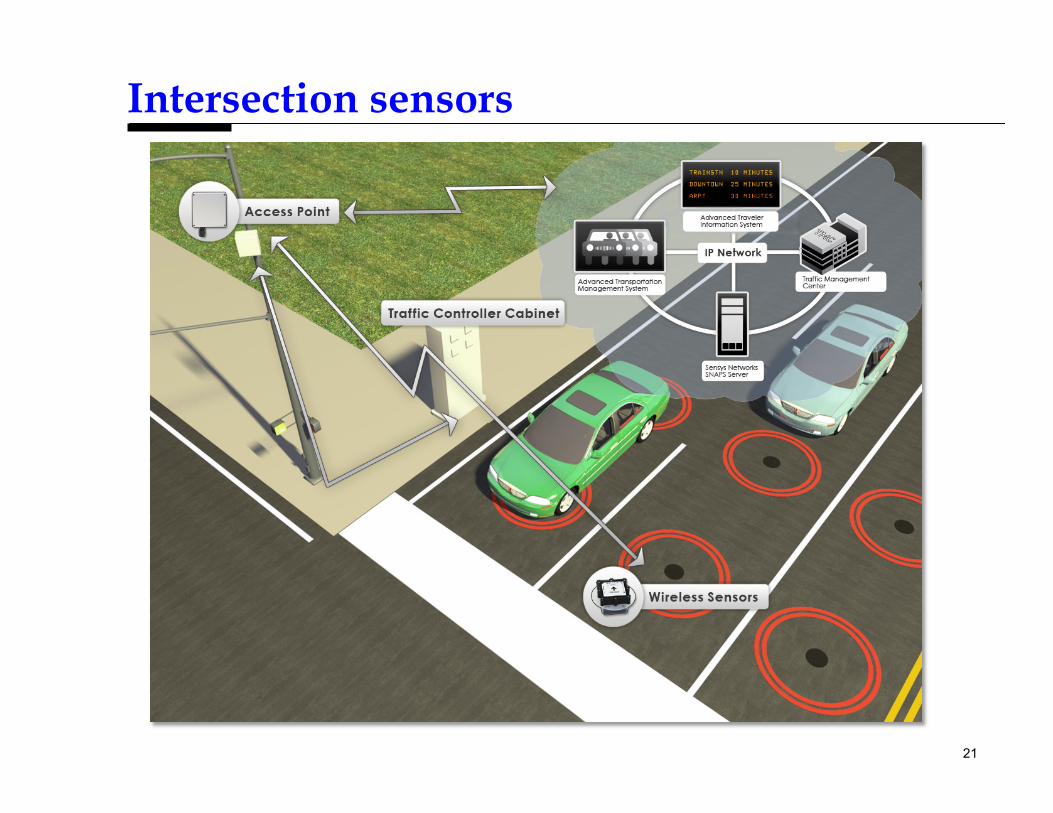
Full deployment
Stop-Bar Detection
170
Signal Controller
Ramp Metering
Advance Detection
Parking Guidance
Parking Enforcement
Traffic count
170
System Counts
Peds Detection
Truck weight Tolls
7
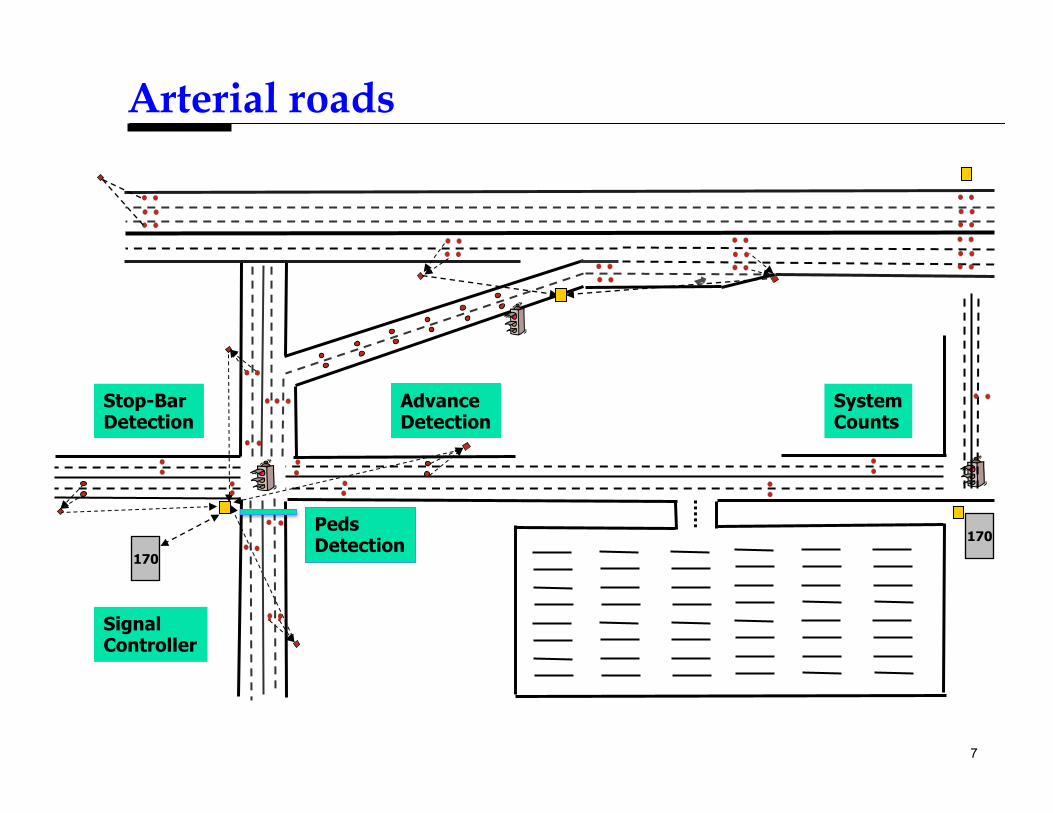
Arterial roads
Stop-Bar Detection
170
Signal Controller
Advance Detection
170
System Counts
Peds Detection

8
Outline Typical deployments
Magnetic sensors for
Vehicle detection: volume, occupancy, speed Re-identification: ramp queues, travel time
Turn ratios, speed and red-light enforcement Vehicle classfication
Micro-radar sensors for pedestrians, bicycles, parking
Accelerometer sensors for Weigh-in-Motion
9
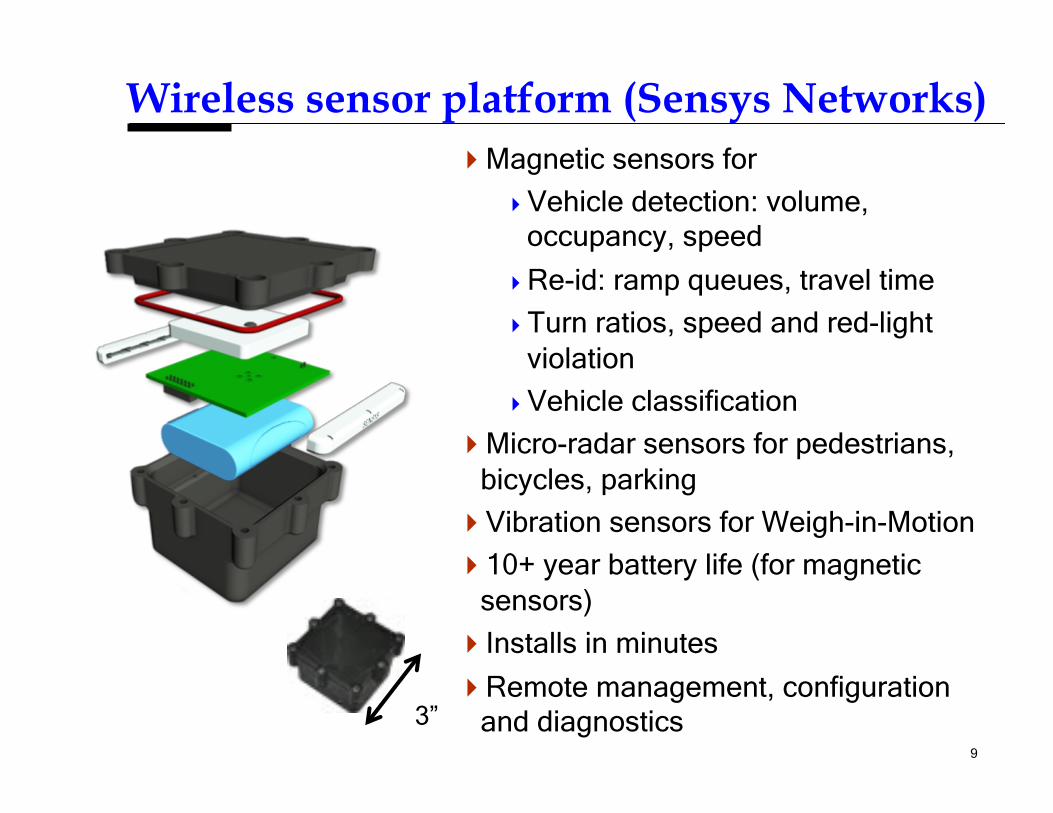
Wireless sensor platform (Sensys Networks) Magnetic sensors for
Vehicle detection: volume, occupancy, speed
Re-id: ramp queues, travel time
Turn ratios, speed and red-light violation
Vehicle classification
Micro-radar sensors for pedestrians, bicycles, parking
Vibration sensors for Weigh-in-Motion
10+ year battery life (for magnetic sensors)
Installs in minutes
Remote management, configuration and diagnostics 3”

10
Sensor installation
Place sensor in 4” diameter, 2 ½” deep hole; cover with epoxy; dry in 10 minutes
Access point (base station) 15’ high, with GPS receiver, GPRS interface, poE, or power over RS485. About 50% battery power used by radio
radio wave

11
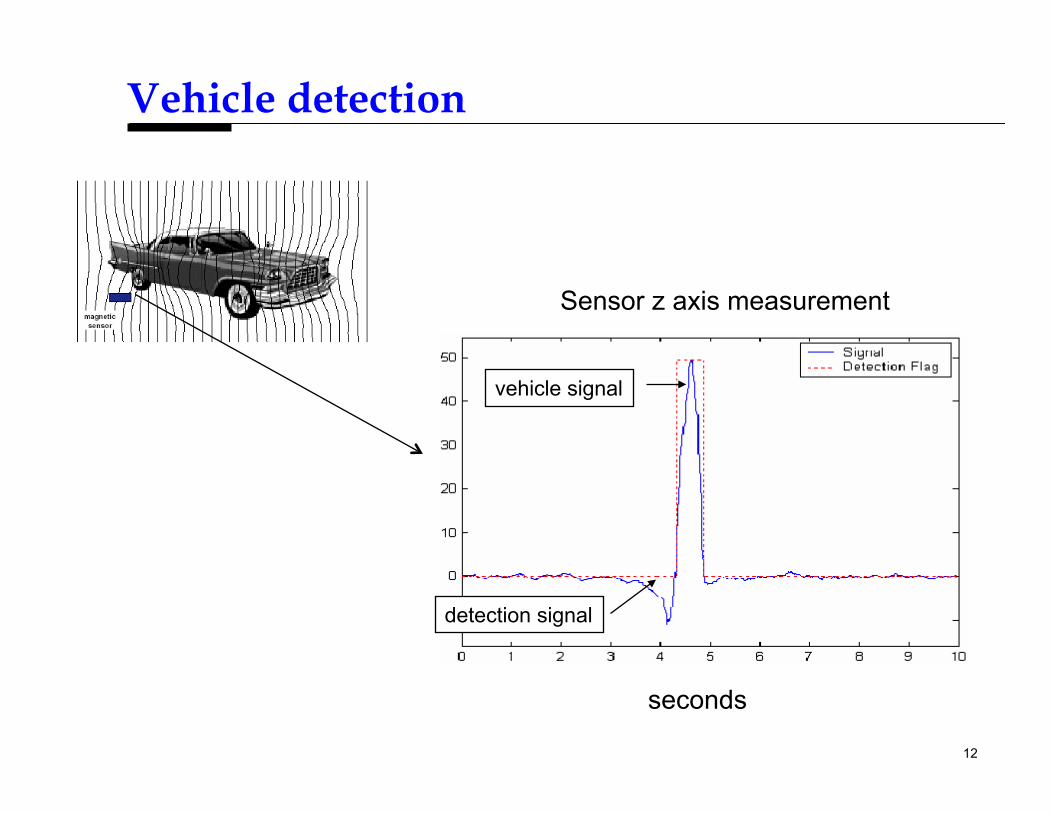
Vehicle magnetic signature
Earth’s magnetic field
Ferrous object
Distorted field
HMC1051Z
12
Vehicle detection
seconds
Sensor z axis measurement
vehicle signal
detection signal
13
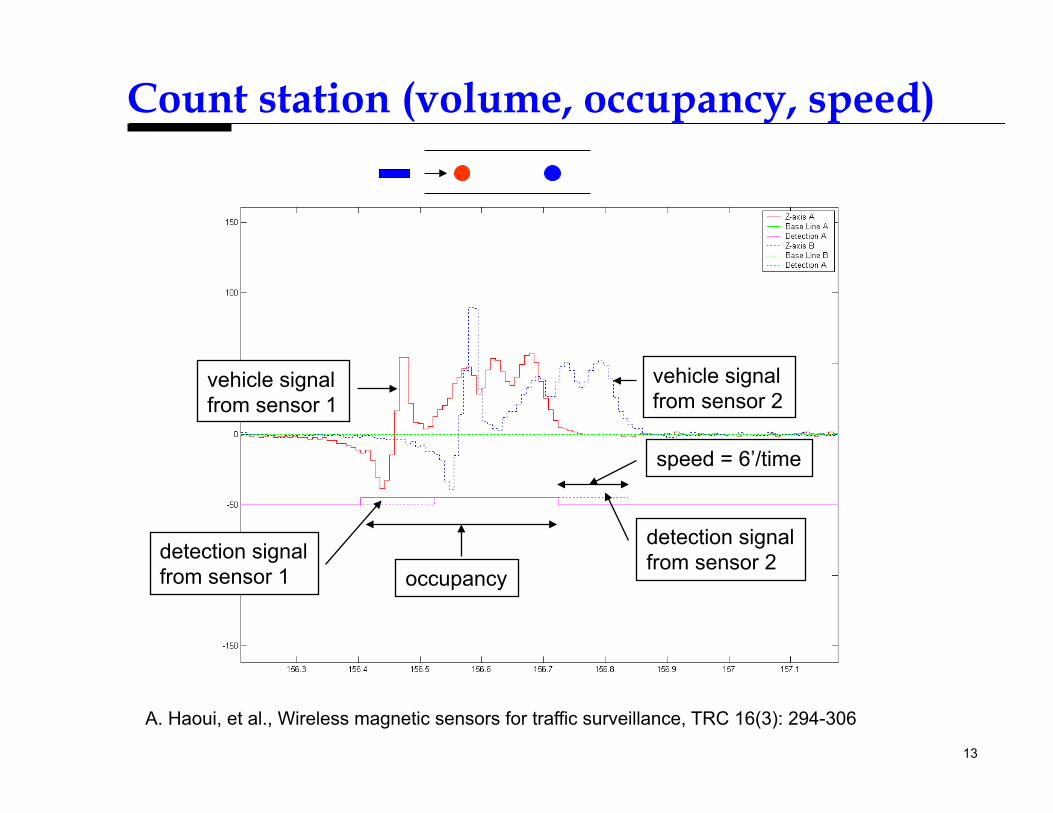
Count station (volume, occupancy, speed)
vehicle signal from sensor 1
detection signal from sensor 1
vehicle signal from sensor 2
detection signal from sensor 2
occupancy
speed = 6’/time
Configuration
A. Haoui, et al., Wireless magnetic sensors for traffic surveillance, TRC 16(3): 294-306

14
Outline Typical deployments
Magnetic sensors for
Vehicle detection: volume, occupancy, speed Re-identification: ramp queues, travel time
Turn ratios, speed and red-light enforcement Vehicle classfication
Micro-radar sensors for pedestrians, bicycles, parking
Accelerometer sensors for Weigh-in-Motion

15
Queue length and travel time estimates
A
D
Ramp queue between A and D = ? I-80S, Hegenberger Rd
Time from A to D = ? San Pablo Av, Albany CA
nA, nD
t
N
T
Vehicle re-identified at A, D
T = travel time from A to D N = # vehicles between A, D
nA(t)
nD(t)

16
Matching signatures at A, D
16
Signature at A
Signature at D
Raw signal
x feature
y feature
y feature
x feature
Compressed

17
Matching signatures
signature distance
extraction
(XA, YB) d(XA, YB)
Kwong, et al. “Real-Time Measurement of Link Vehicle Count and Travel Time in a Road Network” IEEE Trans ITSC 11(4): 814-825, 2010

18
Queue at Hegenberger Rd ramp
16.2 16.4 16.6 16.8 17 17.2 17.4 17.6
0
5
10
15
20
25
Queue Length vs Time of Day
Time of Day [hour]
Queu
e Len
gth [#
of V
ehicl
es]
Queue Length (Ground Truth)Queue Length (Veh Re-ID)Matched Vehicles (392/536)Mismatched Vehicles (24/392)
R. Sanchez et al. “Vehicle re-identification using wireless magnetic sensors: Algorithm revision, modifications and performance analysis.” ICVES 226 – 231, 2011.

19
TT distribution on San Pablo Ave
23 May 2008,1-1:30PM
K. Kwong et al. “Arterial travel time estimation based on vehicle re-identification using wireless magnetic sensors.” TRC 17(6): 586–606
20
Outline Typical deployments
Magnetic sensors for
Vehicle detection: volume, occupancy, speed Re-identification: ramp queues, travel time
Turn ratios, speed and red-light enforcement Vehicle classfication
Micro-radar sensors for pedestrians, bicycles, parking
Accelerometer sensors for Weigh-in-Motion
21
Intersection sensors

22
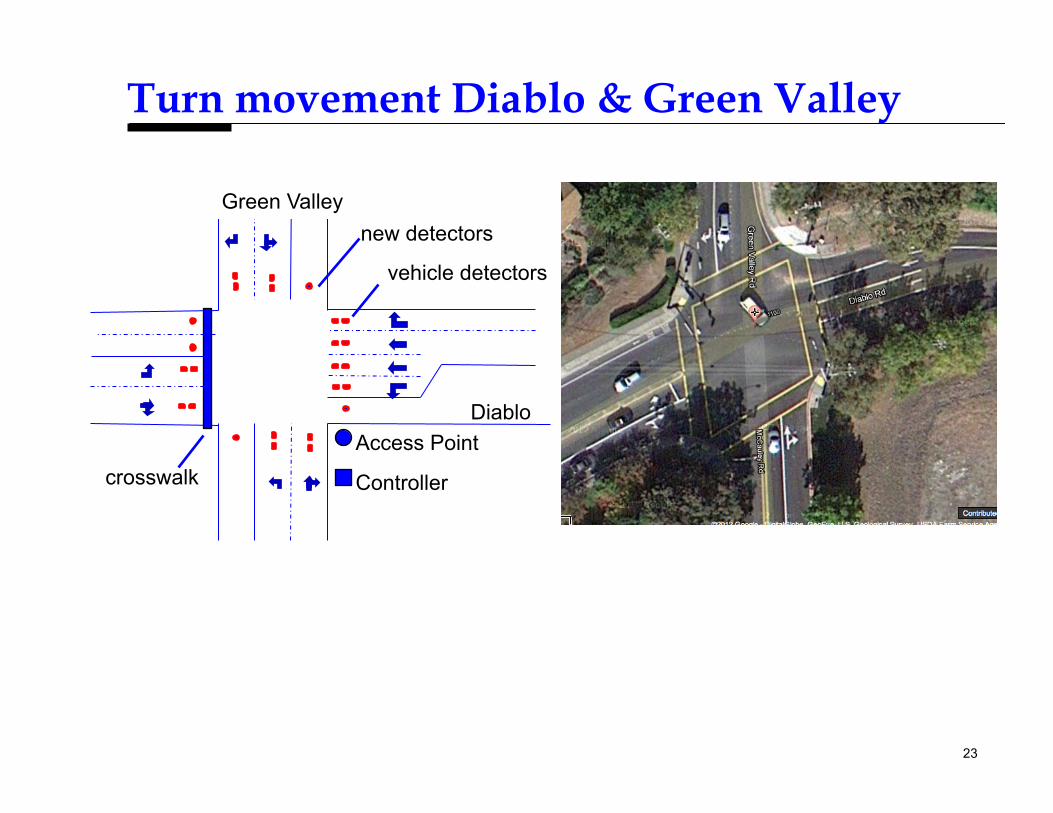
Turn movements
For each vehicle obtain departure lane and time and arrival lane and time . Match departures and arrivals under constraint
For protected turn lanes are there is no ambiguity
For permissive turns there is ambiguity (underdetermined)
tdtaτ < ta − td < τ
23
Turn movement Diablo & Green Valley
vehicle detectors
Diablo
Green Valley new detectors
Access Point crosswalk Controller

24
Turn ratios (%) 2011-11-17: 16:12-16:40
Dir/Turn
LT T RT
N 36 2.9 61
E 0.5 60 40
S 64 18 18
W 47 44 8.9
Dir/Turn
LT T RT
N 35 2.2 62
E 0.5 60 40
S 66 20 14
W 48 44 8.4
Estimated Actual
Dir/Turn
LT T RT
N 1 0.7 -1
E 0 0 0
S -2 -2 4
W -1 0 0.5
Error=E-A
25
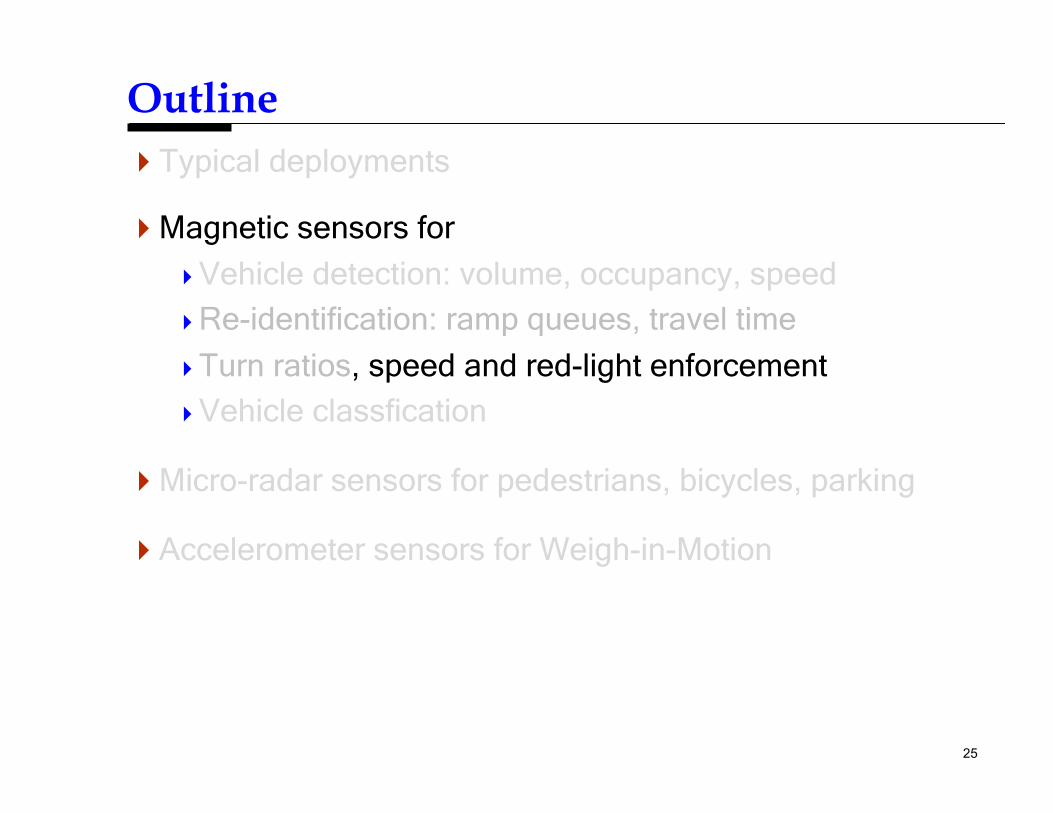
Outline Typical deployments
Magnetic sensors for
Vehicle detection: volume, occupancy, speed Re-identification: ramp queues, travel time
Turn ratios, speed and red-light enforcement Vehicle classfication
Micro-radar sensors for pedestrians, bicycles, parking
Accelerometer sensors for Weigh-in-Motion

26
-6 -4 -2 0 2 4 6 80
20
40
60
Direction - E Lane - 1. Time: 13hr to 17hrNo. Red Light Violations - 63
Time [s] after green end
Spee
d [m
ph]
Speed, red-light violations 2011-11-17
Data over many cycles. T=0 after start of green (top) or after end of green (bottom)
Right turns
-5 0 5 100
20
40
60
Direction - N Lane - 1. Time: 13hr to 17hrNo. Red Light Violations - 148
Time [s] after green end
Spee
d [m
ph]

27
Speed, red-light violations 2011-11-17
Data over many cycles. T=0 after start of green (top) or after end of green (bottom)
Speed limit 35
Through movement
28
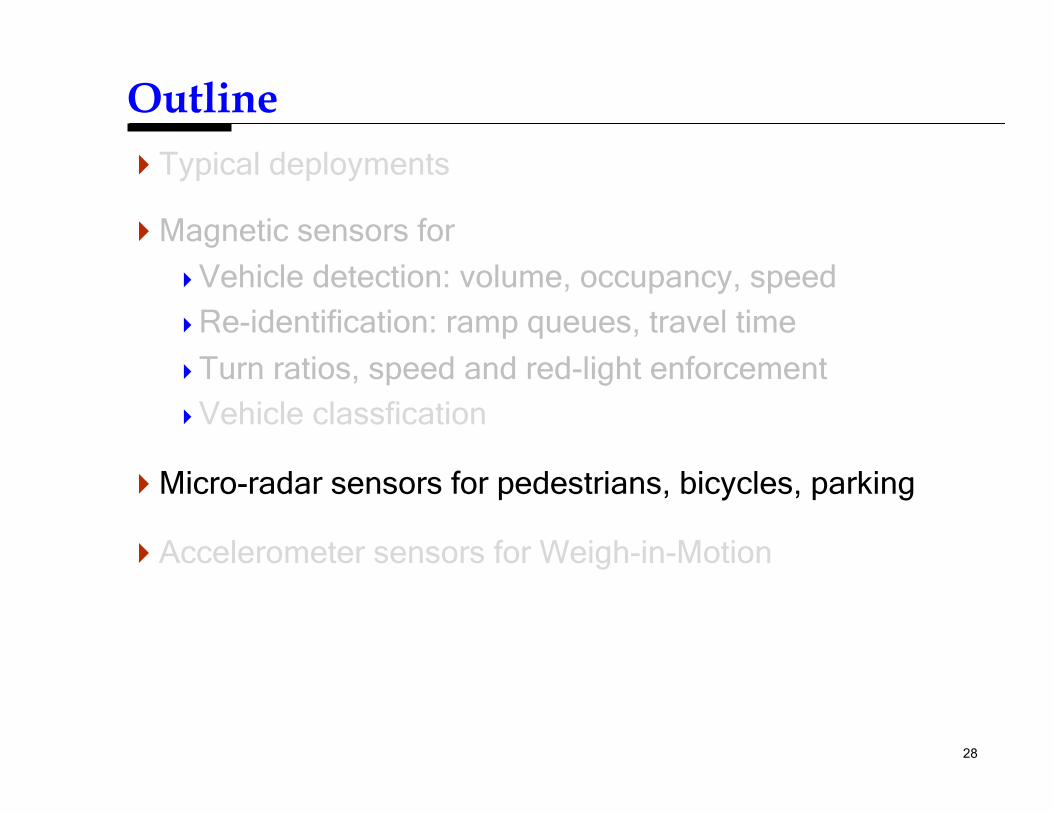
Outline Typical deployments
Magnetic sensors for
Vehicle detection: volume, occupancy, speed Re-identification: ramp queues, travel time
Turn ratios, speed and red-light enforcement Vehicle classfication
Micro-radar sensors for pedestrians, bicycles, parking
Accelerometer sensors for Weigh-in-Motion
29
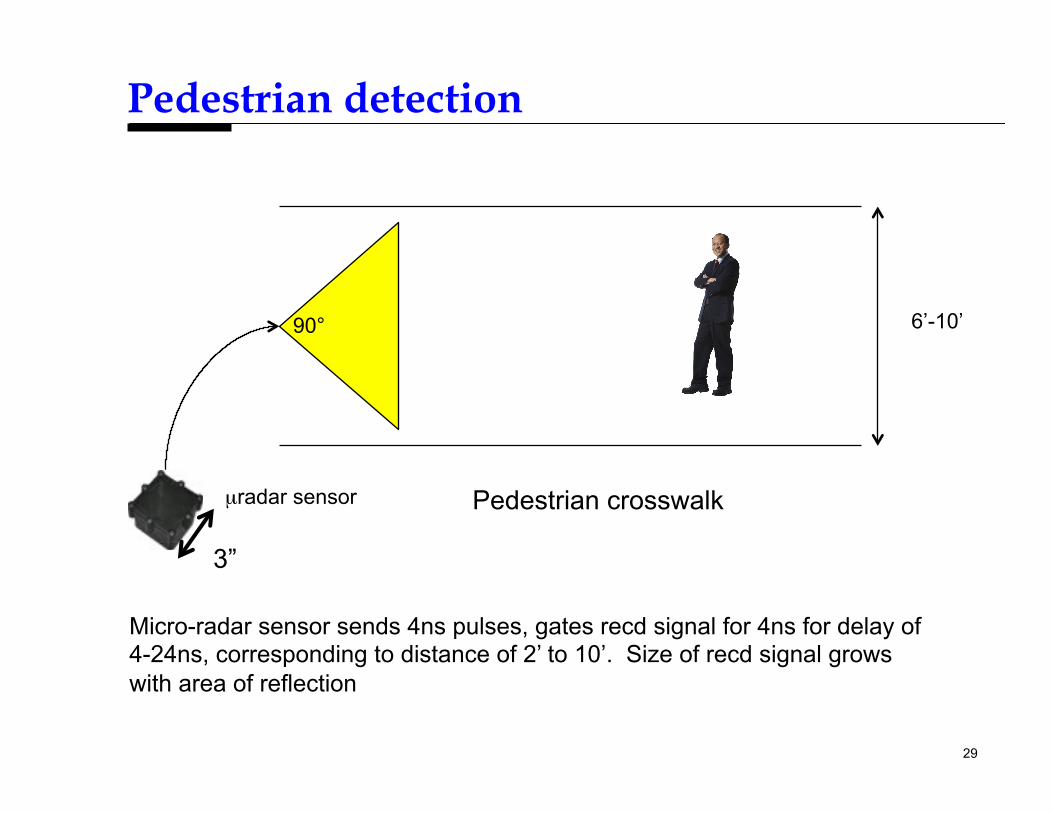
Pedestrian detection
Micro-radar sensor sends 4ns pulses, gates recd signal for 4ns for delay of 4-24ns, corresponding to distance of 2’ to 10’. Size of recd signal grows with area of reflection
3”
6’-10’
Pedestrian crosswalk
90°
µradar sensor

30
Pedestrian dynamic 10 to 8 ft
ignore
threshold
actual
holdover
31
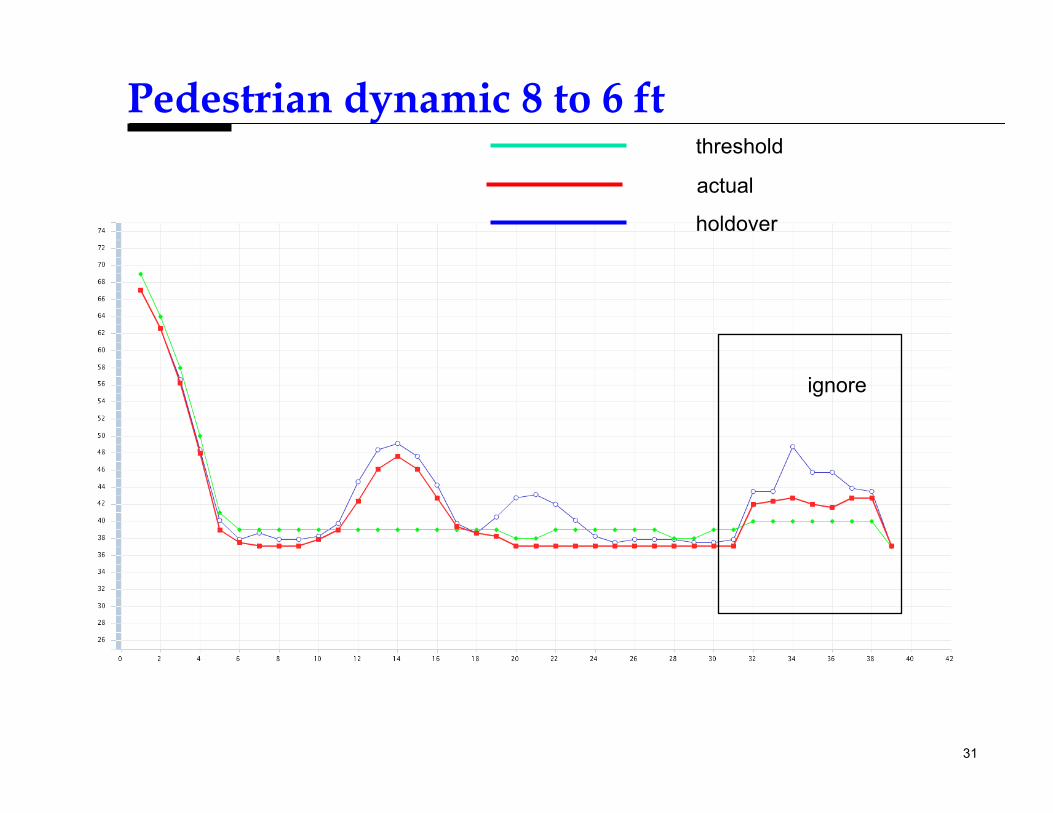
Pedestrian dynamic 8 to 6 ft
ignore
threshold
actual
holdover
32
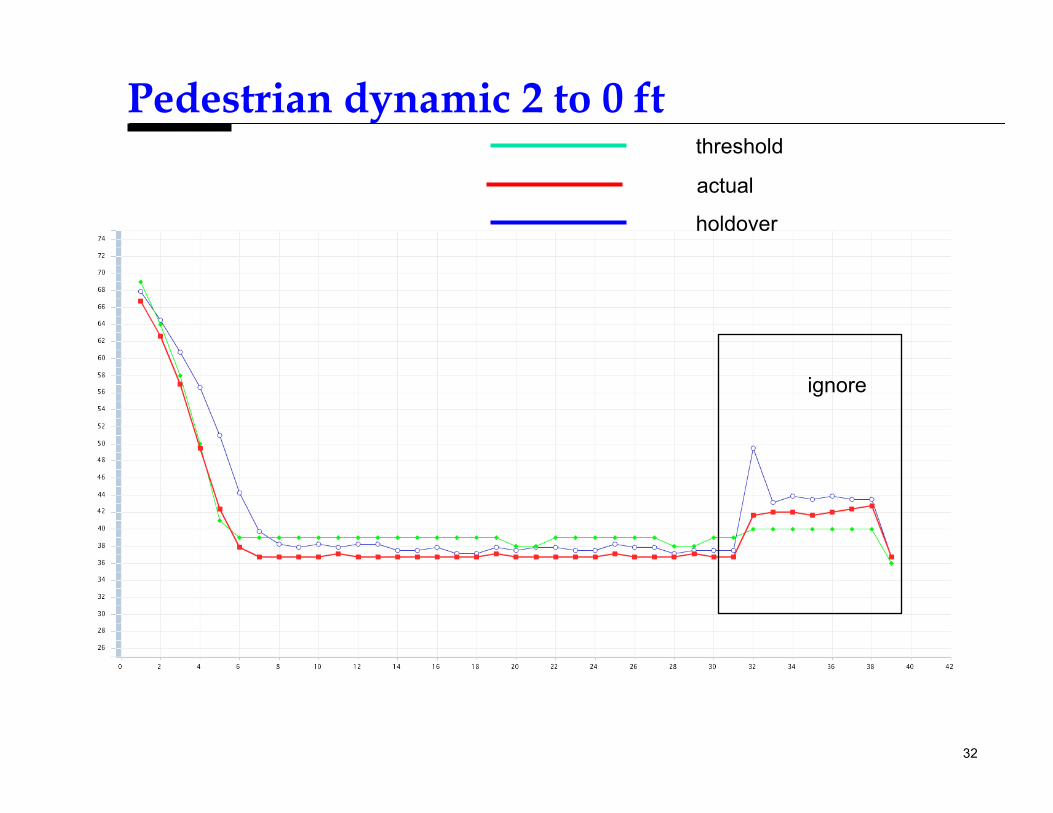
Pedestrian dynamic 2 to 0 ft
ignore
threshold
actual
holdover

33
Pedestrian detection zone
-5 -4 -3 -2 -1 0 1 2 3 4 5
0
2
4
6
8
10
Dist [m]
Dis
t [m
]
Pedestrian Detection Zone. Sensor at origin pointing at 90 deg. Pedestrian facing sensor

34
Outline Typical deployments
Magnetic sensors for
Vehicle detection: volume, occupancy, speed Re-identification: ramp queues, travel time
Turn ratios, speed and red-light enforcement Vehicle classfication
Micro-radar sensors for pedestrians, bicycles, parking
Accelerometer sensors for Weigh-in-Motion
35
Weigh station functions
Monitor load on roads (and bridges); enforce weight limits; charge fees based on truck class and weight
Early pavement damage diagnosis corrected by ‘preservation’ vs ‘rehabilitation’. In 2007 Caltrans preservation cost $90K/mile vs. rehabilitation cost $442K/mile, and contracted preservation of 2,700 miles of pavement and 696 bridges
36
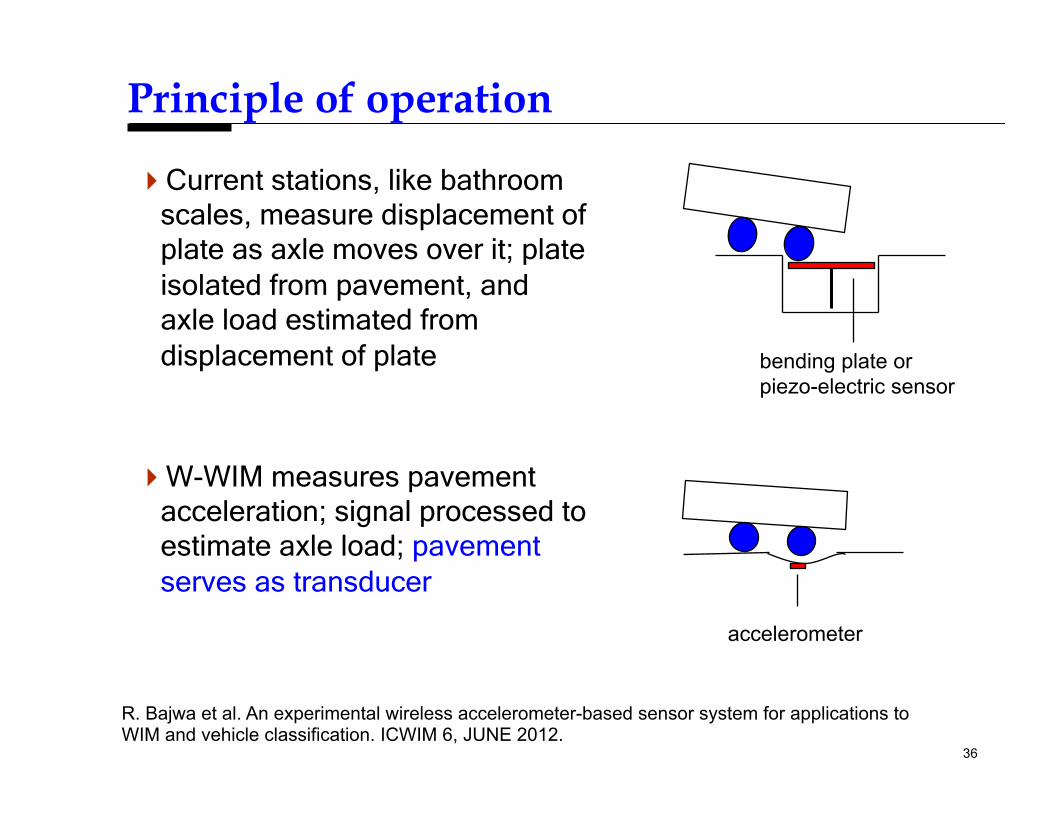
Principle of operation
Current stations, like bathroom scales, measure displacement of plate as axle moves over it; plate isolated from pavement, and axle load estimated from displacement of plate
W-WIM measures pavement acceleration; signal processed to estimate axle load; pavement serves as transducer
bending plate or piezo-electric sensor
accelerometer
R. Bajwa et al. An experimental wireless accelerometer-based sensor system for applications to WIM and vehicle classification. ICWIM 6, JUNE 2012.
37
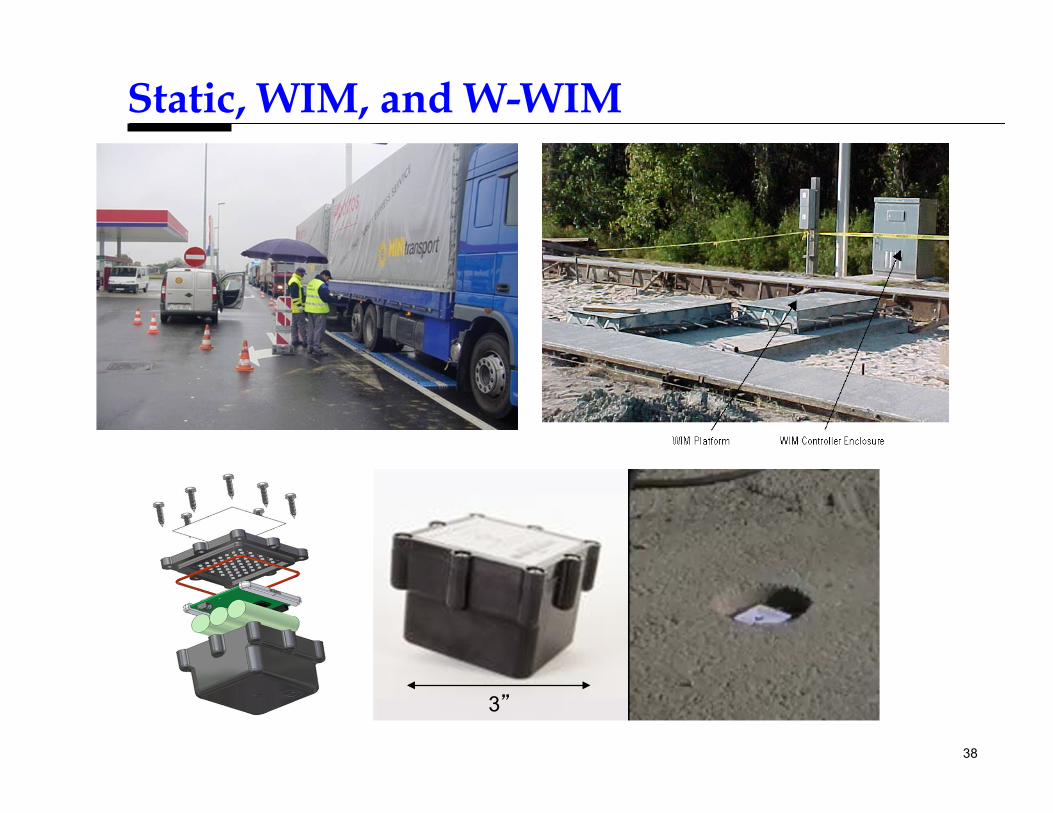
Types of station
Static weigh station—classify stationary trucks, measure axle load and enforce rules
WIM stations weigh axles and classify trucks at normal speed (cost $400K/lane); not used for enforcement
W-WIM wireless WIM will cost a fraction of curent WIM
38
Static, WIM, and W-WIM
3”
39
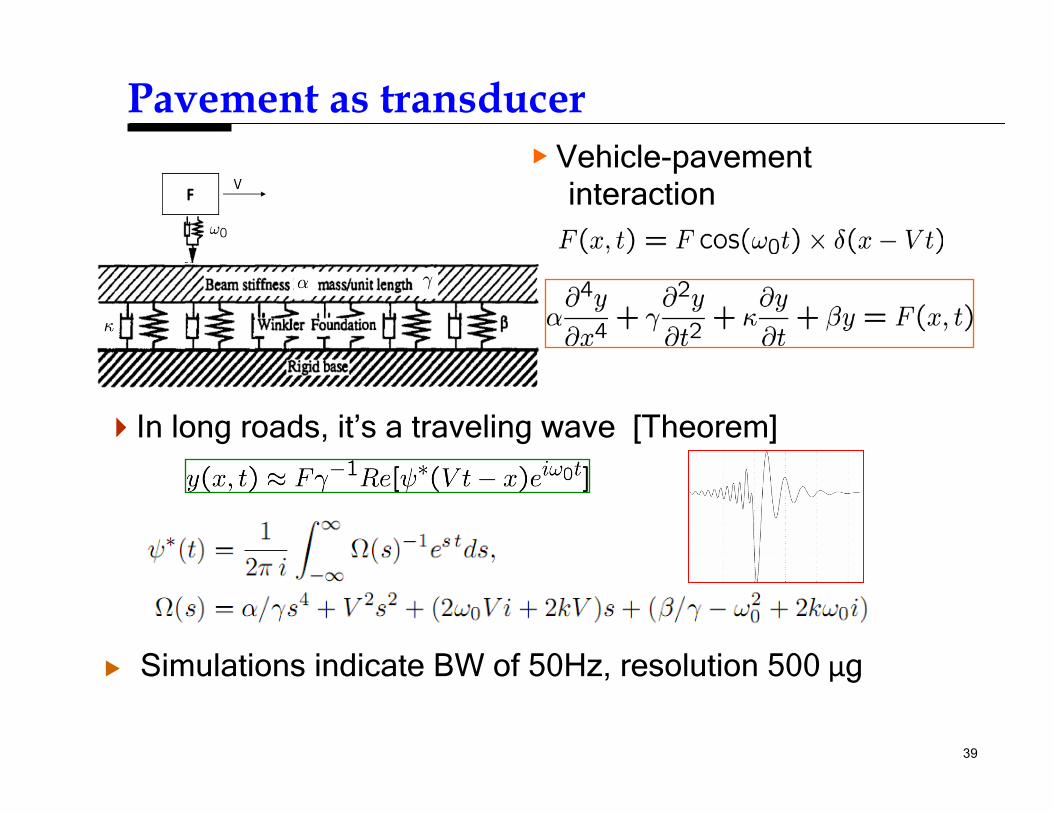
Pavement as transducer
In long roads, it’s a traveling wave [Theorem]
▶ Vehicle-pavement interaction
▶ Simulations indicate BW of 50Hz, resolution 500 μg
40
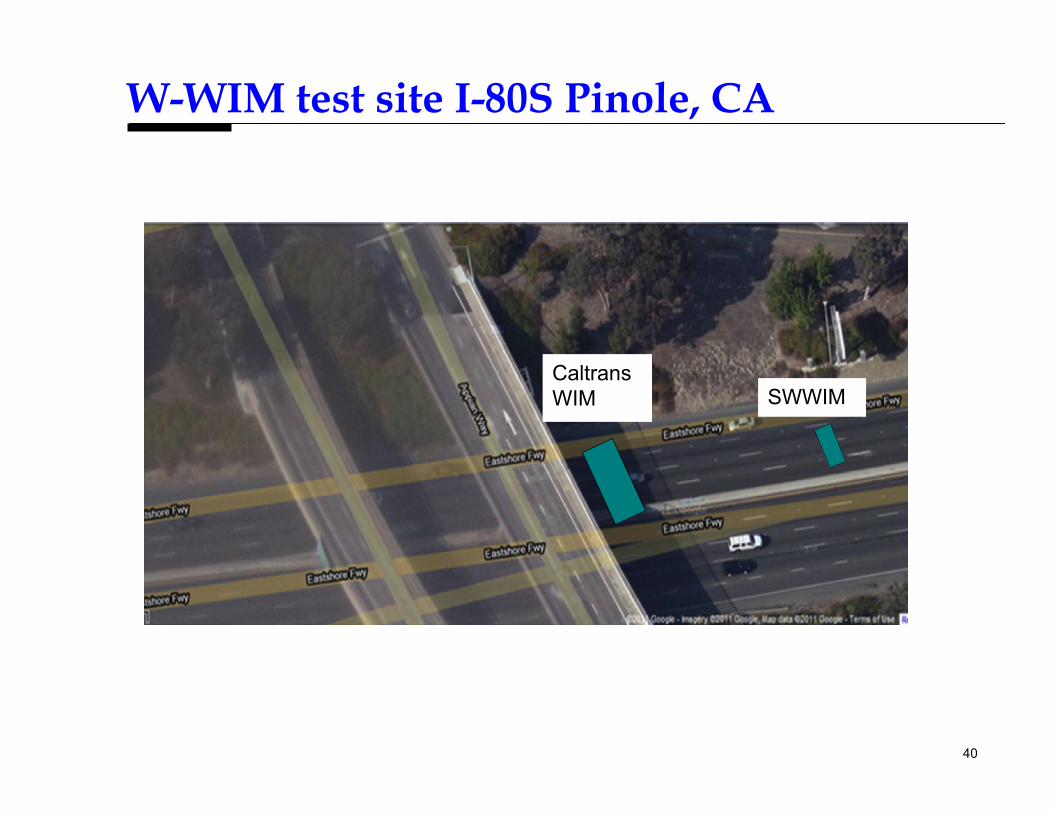
W-WIM test site I-80S Pinole, CA
Caltrans WIM SWWIM
41
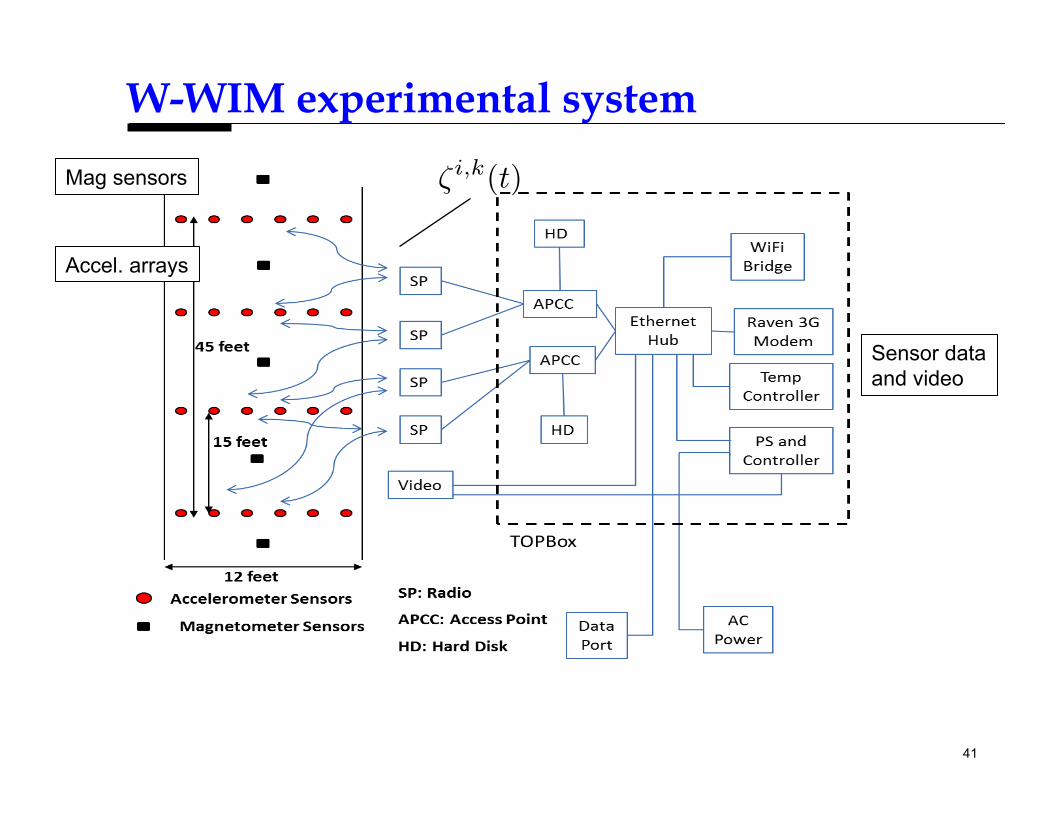
W-WIM experimental system
ζi,k(t)
Accel. arrays
Mag sensors
Sensor data and video

42
Installation
Installation team; procedure, 40 sensors (top)
Mounting top box; checking data. Total time 4 hours.

43
Signal processing
Next sensor Ti
Filter Align with T1
Average sensor
response
Least squares fit (allows DC offset)
Sum of three Gaussians with varying width,
location
Calibrated function
ζi,k ζ̂i,k
ζ̂k
speed, temp
ζi,k(t) = signal of sensor i from truck k
ζ̂k(t) = av signal of truck k

44
Raw acceleration signal
ζik(t)
45
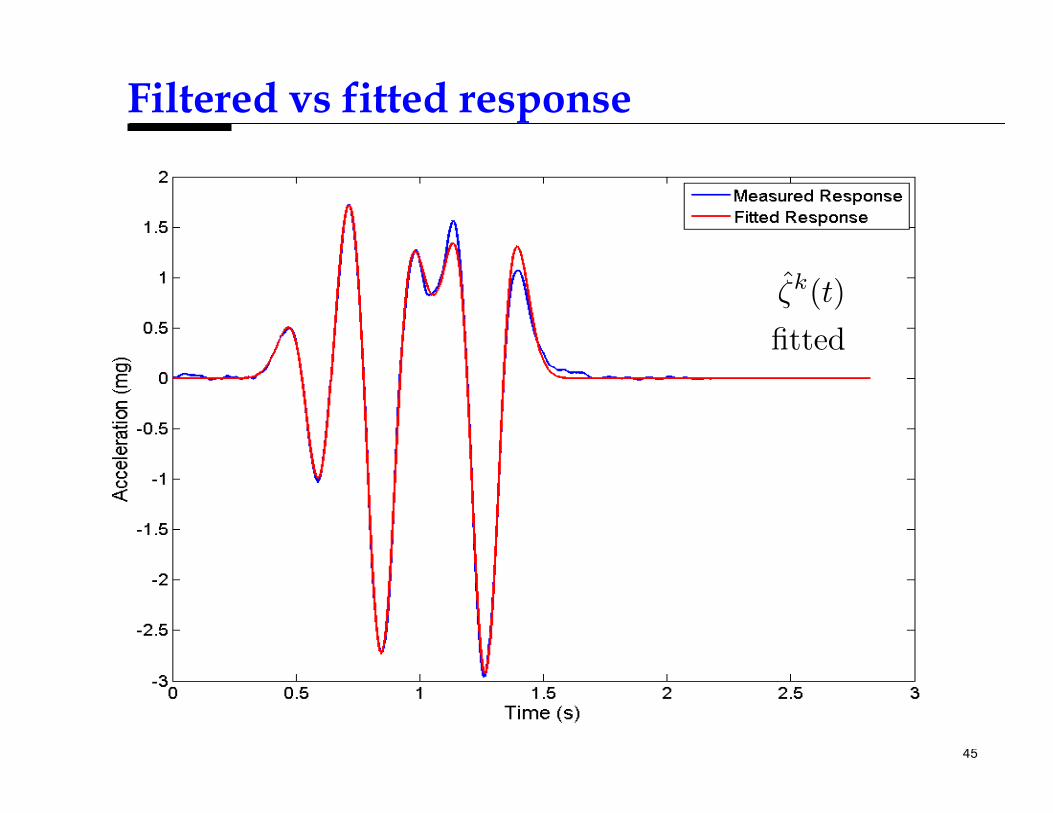
Filtered vs fitted response
ζ̂k(t)
fitted

46
Results (calibrated truck, 16 runs)
Mean Standard deviation
SWWIM Axle 1 error (%) -0.39 6.45
SWWIM Axle 2 error -0.12 3.61
SWWIM Axle 3 error -0.17 4.31
WIM Axle 1 error -4.31 2.51
WIM Axle 2 error -1.84 4.13
WIM Axle 3 error 5.02 2.98

47
300 class9 trucks, GT=WIM, Axle 1
Std = 7.7 after omitting last 2 outliers

48
300 class9 trucks, GT=WIM, Axle 2+3
Std = 8.1 after omitting last 3 outliers
49
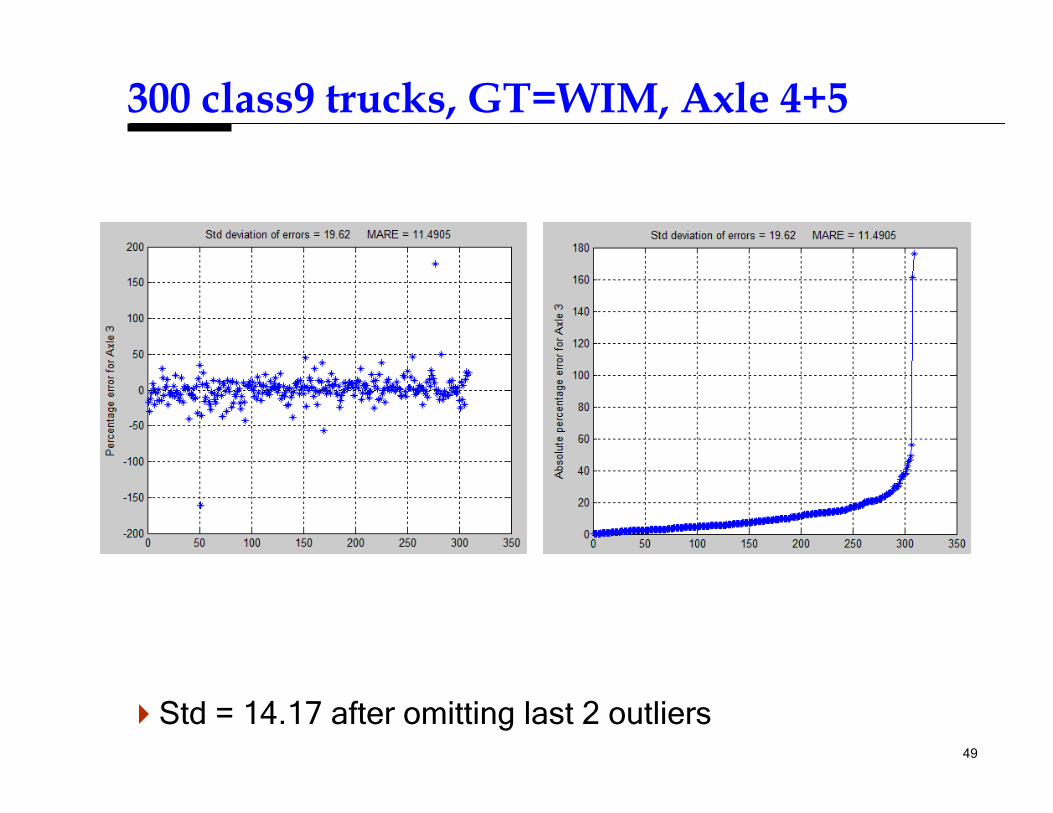
300 class9 trucks, GT=WIM, Axle 4+5
Std = 14.17 after omitting last 2 outliers

50
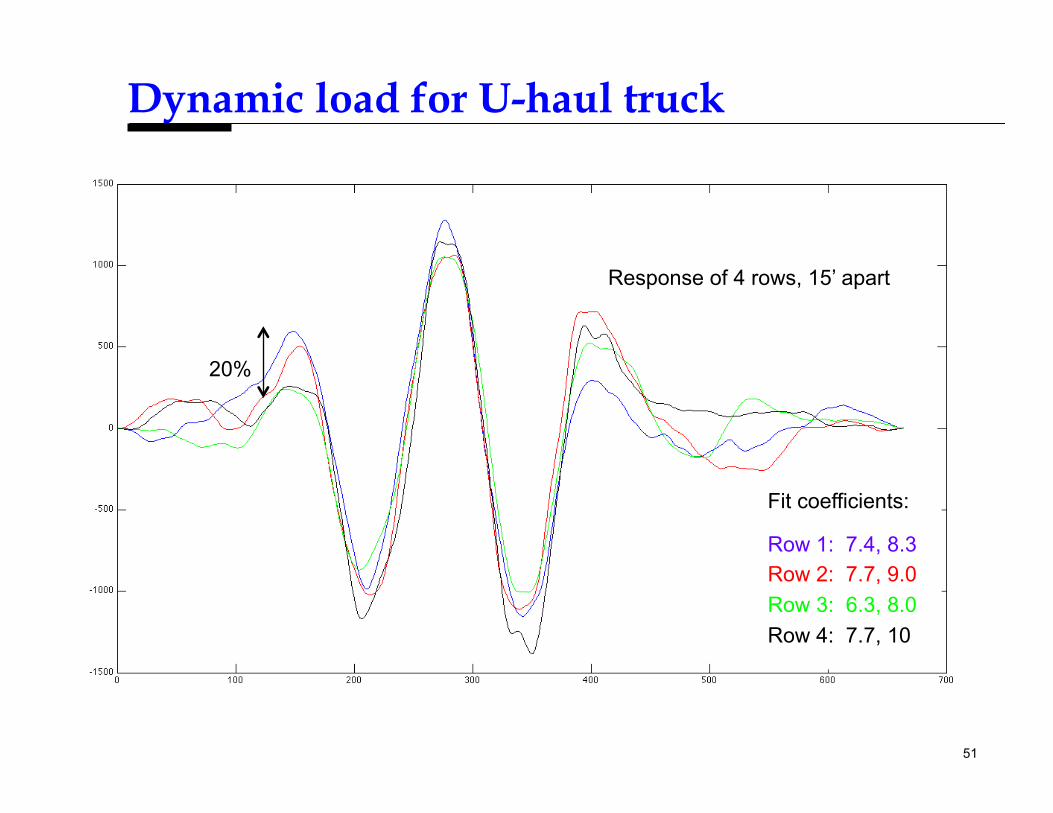
Dynamic loading
Load varies by array because of roughness and pavement-suspension interaction
Variation of weight estimate in different sensor arrays gives estimate of dynamic load
Average of array estimates gives static load
V
Average
sensors
D. Cebon. Handbook of Vehicle-Road Interaction.1999.
51
Dynamic load for U-haul truck
Fit coefficients:
Row 1: 7.4, 8.3 Row 2: 7.7, 9.0 Row 3: 6.3, 8.0 Row 4: 7.7, 10
20%
Response of 4 rows, 15’ apart
52
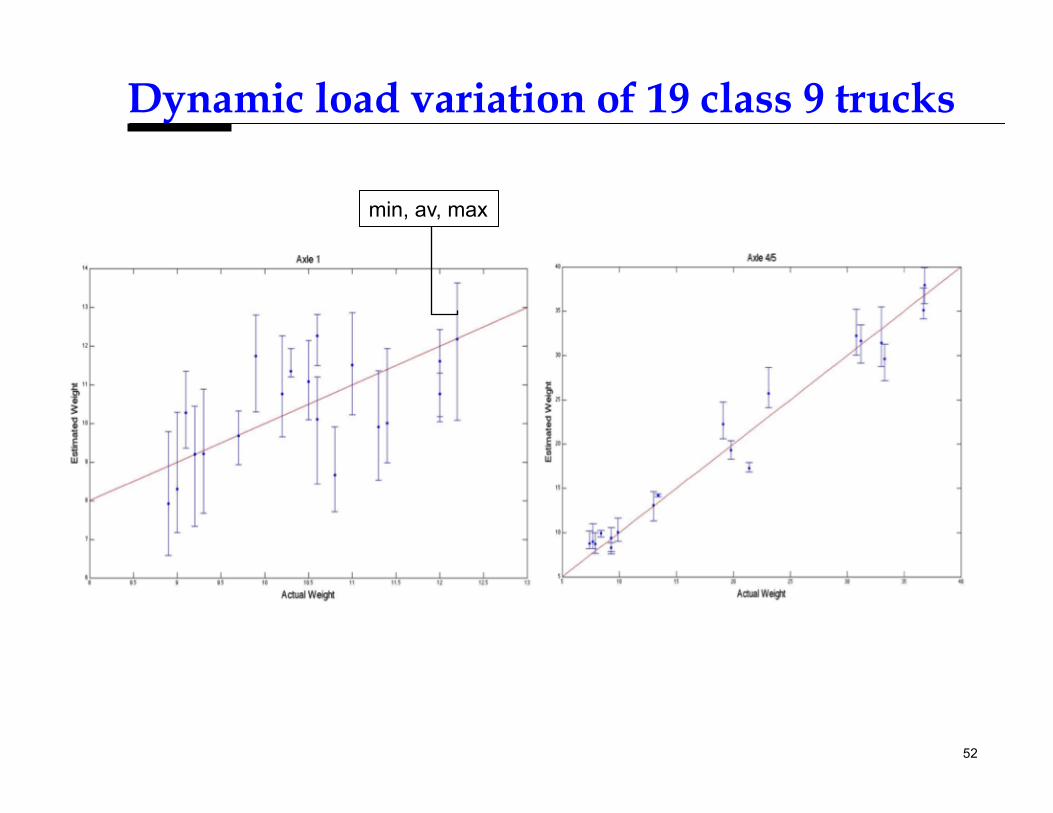
Dynamic load variation of 19 class 9 trucks
min, av, max
53
Future work
Larger set of calibrated trucks
Better compensation for wander, variable axle width, speed, and temperature
Relationship between error and dynamic variation

54
Conclusions
Wireless sensor networks can be economically deployed over a wide area with several sensing modalities
– Magnetometers give detection, flow, speed & occupancy; queue length & travel time distribution; with signal phase, give intersection perfomance, violations
– Accelerometers give per axle weight and per truck classification
– Radar sensors detect pedestrians, bicycles, parked cars; could be used to warn drivers at pedestrian crossings & red-light enforcement
A complete deployment gives data that can be processed to achieve large improvements in network performance
If you don’t know what’s happening on your roads, don’t expect to manage the traffic well