wireless charging and shared autonomous battery electric...
TRANSCRIPT

ORIGINAL ARTICLE
Wireless charging and shared autonomous batteryelectric vehicles (W+SABEV): synergies that acceleratesustainable mobility and greenhouse gasemission reduction
Zicheng Bi1 & Michael A. Reiner1 & Gregory A. Keoleian1& Yan Zhou2
&
Michael Wang2& Zhenhong Lin3
Received: 3 April 2019 /Accepted: 16 May 2019/# Springer Nature B.V. 2019
AbstractEmerging technologies play important roles in shaping future mobility systems andimpacting sustainability performance of the transportation sector in major economies,such as the United States of America (USA) and China. This study applies a lifecycle framework to demonstrate and evaluate the synergies of the following fouremerging transportation system technologies both qualitatively and quantitatively: (1)wireless charging; (2) shared mobility services; (3) autonomous driving; and (4)battery electric vehicles (BEV). The new concept of a wireless charging and sharedautonomous battery electric vehicle (W+SABEV) system is introduced and modeled.First, an analytical framework is presented to assess the pros and cons of the W+SABEV system vs. a conventional plug-in charging BEV system, adhering to theprinciples of sustainable mobility and highlighting the impacts and dynamics of thedisruptive technologies on the key parameters that define sustainable mobility. Second,a quantitative analysis presents the synergies of the four technologies by modeling aW+SABEV system and demonstrates that the combination of the four technologiescan shorten the payback time of greenhouse gas (GHG) emission burdens for infra-structure and vehicles. Compared to a plug-in charging BEV system, a W+SABEVsystem pays back the additional GHG emission burdens of wireless charging infra-structure deployment within 5 years if the wireless charging utility factor (ratio of enroute charging time vs. trip time) is above 19%.
Keywords Wireless charging . Sharedmobility . Autonomous vehicle . Electric vehicle .
Sustainability
Mitigation and Adaptation Strategies for Global Changehttps://doi.org/10.1007/s11027-019-09870-9
Zicheng Bi now work at Argonne National Laboratory ([email protected])
* Gregory A. [email protected]
Extended author information available on the last page of the article

1 Introduction
As world’s two largest economies, the United States of America (USA) and China are facingsignificant energy and environmental burdens from the transportation sector. Both countries areworking towards cleaner transportation by incentivizing and investing in vehicle electrification,automation, and connectivity, promoting shared mobility, and integrating charging infrastructure(Hao et al. 2015; Zhou et al. 2015). A new era in transportation is marked by recent dramatictransportation modal shifts, research and development (R&D) of clean vehicles and emergingtechnologies, and design of sustainable mobility systems. The trend is driven by three definingcomponents: (a) a shared vehicle economy; (b) connected and automated vehicles (CAVs); and(c) vehicle electrification (Fagnant and Kockelman 2014). Each component offers a distinct setof benefits, poses a complex range of challenges, would fundamentally reshape vehicle andmobility systems, and ultimately enables a more sustainable means of moving people. To ensurea sustainable transition in transportation services, the diffusion of these three disruptive tech-nologies requires a fundamental shift in our infrastructure in terms of the electricity grid, roadsystems, and the way in which vehicles are fueled or charged (Chen et al. 2016).
Charging time, vehicle driving range, and availability of conventional plug-in charginginfrastructure have long been cited as barriers to electric vehicle (EV) adoption (Bi et al. 2016).Therefore, a revolution in charging infrastructure and charging ways for EVs, including plug-in hybrid electric vehicles (PHEVs) and battery electric vehicles (BEVs), is critical in shapingfuture sustainable transportation and impacting EV adoption and performance of both privateand public fleets. Recent breakthroughs in the field of wireless power transfer (WPT) havemade the prospects of charging EVs wirelessly increasingly viable (Bi et al. 2016; Kan et al.2017; Lee et al. 2013; Li and Mi 2014; Liu and Song 2017). Advances in wireless chargingtechnology are perhaps the missing key to unlock the future of mobility systems, WPTdescribes the transfer of electricity across an electromagnetic field and uses magnetic reso-nance induction to transfer electricity from charging pads embedded within the ground to a padinstalled on the vehicle. Under laboratory conditions, WPT can charge at an efficiency close to80–90%, providing a similar charging power (e.g., 6–30 kW) as the conventional plug-inmethod (Bi et al. 2016). Compared to plug-in, wireless charging offers greater flexibility in itsapplication, allowing vehicles to charge in stationary mode called stationary wireless powertransfer (SWPT) (i.e., when parked in garage or public parking spaces, and at traffic intersec-tions) or dynamic mode called dynamic wireless power transfer (DWPT) (i.e., en routecharging when vehicles are moving on roadways). Despite its current limited availability,many original equipment manufacturers (OEMs) of automobiles, such as Kia, BMW,Mercedes Benz, Nissan, General Motors, and Tesla, have already begun integrating wirelesscharging capability into EV designs. Other companies, such as Plugless and Qualcomm, offerwireless charging pads that will be compatible with various vehicle models (Bi et al. 2016;Plugless Power 2015).
In addition to convenience and increased charging availability, WPToffers opportunities fordownsizing the expensive and heavy EV onboard battery thus reducing vehicle cost andweight, as well as improving vehicle fuel economy (Bi et al. 2015). Despite a growing bodyof literature dedicated to R&D of each emerging technology, respectively, little work exploresthe synergistic relationship between charging infrastructure and vehicle technologies in en-hancing fleet performance and sustainable mobility, which poses a research gap. The SharedAutonomous Battery Electric Vehicle fleet can be regarded as a car-sharing fleet that isdriverless and pure electric.
Mitigation and Adaptation Strategies for Global Change
This study applies sustainability-based and life cycle framework to evaluate and demon-strate the synergies of the following four emerging technologies both qualitatively andquantitatively:
& Wireless charging technology& Shared mobility services technology& Autonomous driving technology& Battery electric vehicle (BEV) technology
A wireless charging and shared autonomous battery electric vehicle (W+SABEV) system ismodeled. First, an analytical framework is presented to assess the pros and cons of the emergingW+SABEV system vs. the conventional plug-in charging BEV system, adhering to theprinciples of sustainable mobility, and highlights the impacts and dynamics of the disruptivetechnologies on the key parameters that define sustainable mobility. Second, a quantitativeanalysis presents the synergies of the four technologies by modeling a W+SABEV system anddemonstrates that the combination of the four technologies can shorten the payback time ofgreenhouse gas (GHG) emission burdens in terms of infrastructure and vehicles.
2 Qualitative analysis
2.1 Review of emerging technologies
A review of technologies is conducted based on a combination of literature review and aqualitative life cycle analysis of vehicle technologies. We derive a life cycle framework toevaluate the sustainability of proposed mobility systems based on the principles of greenengineering (Anastas and Zimmerman 2003). We consider the in-use and upfront burdens forthe cost, energy, and emissions of mobility systems, adopting a systems-level approach. Ourframework serves as a general guideline to assess proposed mobility systems and technologies,highlighting notable trends that correspond to sustainable performance. Charging infrastructureutilization, vehicle utilization, and vehicle ownership are three trends that ultimately drive thesustainable performance of vehicle transportation (Sperling 2018).
The vehicle technologies and mode choices are predicted to shift dramatically (Fulton et al.2017). A more in-depth summary of each mobility trend is provided as follows.
Shared mobility services Share mobility services include ride sharing, ride-hailing, and carsharing. This paper focuses on ride-hailing. Shared vehicle fleets increase the utilization of agiven vehicle, as private cars are estimated to be unused (parked) a majority of the time; theincrease in vehicle utilization offers opportunities to enhance both sustainability and mobility(Shoup 2017). Shared fleets can increase mobility for non-vehicle owners or populations nolonger capable of driving. Shared mobility could also increase vehicle miles traveled due torebound effect. From a sustainability objective, the reduction of on-road vehicles in conjunc-tion with their increased utilization will lead to significant reductions in emissions, energydemands, and system-wide costs. It is worth noting that shared mobility services shouldcomplement, not compete against, existing transportation systems. The prospect of sharedfleets is promising, but the transition away from private vehicle ownership will be gradual andlikely limited in non-urban environments.
Mitigation and Adaptation Strategies for Global Change

Vehicle autonomy and connectivity Connected and automated vehicles (CAV) technologyallows for the real-time optimization of routes and charging decision-making. While onlypartial vehicle automation is currently commercially available, full-scale driverless vehicles arepredicted to hit the market within the next five to 20 years (Anderson et al. 2014). CAVtechnology enhances mobility through the optimization of traffic flow, demand forecasting,and increase in mobility for users that cannot drive, to name a few. From a sustainabilityperspective, CAV technology has the potential to reduce emissions through platooning, moreefficient driving, and the optimization of charging time and location (Bi et al. 2016). Researchhas also shown, however, that CAV technology may lead to an increase in VMT due torebound effect from driving convenience and decrease in vehicle fuel efficiency due to theincrease in weight from the CAV technology (Gawron et al. 2018). Nonetheless, vehicle-to-vehicle (V2V) and vehicle-to-infrastructure (V2I) communication technologies allow for thedata-driven, real-time operation of vehicles.
Powertrain technology Currently, there are internal combustion engine vehicles (ICEVs),with hybrid electric (HEV), plug-in hybrid electric (PHEV), and battery electric vehicles(BEV) representing the remaining mix. Bloomberg New Energy Finance anticipates thatEVs will constitute 55% of new sales and represent 33% of the global fleet by 2040(BloombergNEF 2018). Battery electric vehicles offer the greatest opportunity to reduceGHG emissions, where a vehicle’s relative impact is dependent on electricity grid emissions(Zivin et al. 2014). The emission reductions between BEV and petroleum-based vehiclesystems will only increase as renewable energy resources displace fossil fuel–based powergeneration.
Therefore, the shift towards shared mobility, vehicle autonomy, and electrified transporta-tion is desirable for a future of sustainable mobility.
2.2 Synergies of the emerging technologies
2.2.1 Synergies of wireless charging and shared autonomous battery electric vehicles
Charging infrastructure decision-making requires that the synergies between vehicle technol-ogies be explicitly considered. The advantages and disadvantages of each technology aresummarized in Fig. 1.
By integrating wireless charging technology instead of the conventional plug-in chargingtechnology to charge shared autonomous battery electric vehicles (SABEV), the pros of eachtechnology can be enhanced, and some of the cons of each technology can be eliminated. Thekey synergies are summarized as follows.
Synergies between wireless charging and shared mobility services technologies On-roadwireless charging can extend the operation time of shared fleets by recharging the batteryincrementally, reducing the time and distance a vehicle must dedicate to maintain a minimumbattery range. The spatial flexibility wireless charging provides aligns with the dynamicoperations that shared fleets offer, highlighting the larger shift away from centralized vehicleinfrastructure. Despite limited research that models shared autonomous fleets with respect tovarious charging scenarios, initial research indicates that wireless charging reduces both laborcosts and non-passenger vehicle miles traveled (VMT), making shared, electric fleets
Mitigation and Adaptation Strategies for Global Change

financially competitive compared to shared internal combustion engine (ICE) fleets (Chenet al. 2016).
Synergies between wireless charging and autonomous driving technologies The benefitsof both technologies are realized when deployed together. Wireless charging supports the fullautomation of vehicles as they can charge without the need of human intervention. Wirelesscharging also allows autonomous vehicles to strategically charge not only in parked spaces,but also at traffic lights and along the road when dynamic charging is considered. Vehicleautonomy is needed to realize the benefits of wireless charging for a variety of reasons. From atechnical standpoint, an autonomous vehicle will maximize the charging efficiency by per-fectly aligning the wireless charging pads. An autonomous vehicle offers communicationbetween both vehicles and infrastructure. It can select optimal times and locations for chargingby smart routing. An autonomous vehicle can also park itself and charge itself without anyhuman intervention, reducing the amount of charging stations needed when vehicles are not inuse. Research on SABEV systems has concluded that wireless charging increases operationalefficiency, as vehicles can incrementally charge themselves throughout service (Chen et al.2016; Fagnant and Kockelman 2014).
Synergies between wireless charging and BEV technologies Although the large-scalewireless charging infrastructure poses significant deployment burdens, it offers opportunitiesto downsize the expensive and heavy BEV battery by recharging it incrementally to still satisfy
Decreased
charging
efficiency 1
Higher upfront cost
Charging convenience 3
In-trip charging 2, 5, 6
Spatial flexibility
Increased
passenger weight
Reduce vehicles on road 7
Increase vehicle utility
Increase mobility
Longer travel time
and distance 2
Require add-on equipment
Require add-on equipment
Increased
vehicle energy
demand
Increase mobility
Optimal routing and charging 1, 2
Efficient driving 2
Difficulty to
charge without
a person 3
No tailpipe emissions
Electric power support for
autonomous vehicle
equipment 4
Require significant
electric power
support 4
Range anxiety 5
Charging
infrastructure
needs
Less maintenance
Large, heavy, and
expensive batteries 6, 7
LegendPros: Pink text
Cons: Black text1 – 7 : Seven pairs of synergies
(i.e., a pro of one
technology eliminates a
con of another
technology)
W+SABEV
Fig. 1 Advantages and disadvantages of vehicle technologies that distinguish synergies of a wireless chargingand shared autonomous battery electric vehicle (W+SABEV) fleet
Mitigation and Adaptation Strategies for Global Change

the desired vehicle range. Such trade-offs are most evident when modeling the relationshipbetween vehicle battery size and charging station placement. With respect to fixed bus routes,the authors’ previous study has shown that wireless charging for pure electric busses allowsbatteries to be 27–44% the size of a plug-in charged battery. This battery downsizing wouldresult in lightweighting the vehicle and improving the fuel economy (Bi et al. 2015), as well asreduction in BEV costs. Wireless charging also offers spatial flexibility for charging infra-structure deployment, because it can be built on existing roads or parking spaces, without theneed of procuring new lots to build plug-in charging stations. This would address thechallenges of spatially constrained cities to supply adequate charging infrastructure.
2.2.2 System dynamics and key parameters for sustainability
Having shown the potential of wireless charging technology to enhance the sustainable mobility ofSABEV systems, this section focuses on the dynamics of critical parameters, trade-offs, andconstraints which define such systems. The system dynamics driven by the disruptive technologiesare shown in Fig. 2. It is assumed that the system seeks to serve a fixed passenger travel demand in agiven day. By penetrating the disruptive technologies into the system, there will be changes drivenby that penetration, as highlighted in the figure. The results are a combination of both positive andnegative feedbacks demonstrating the interconnected complexity of passenger travel demand,vehicle design, and infrastructure needs. Wireless charging can: (1) reduce the battery capacitydue to more en route charging time and charger utility improvement by optimal siting of charginginfrastructure; (2) reduce range anxiety due to more charging availability, therefore stimulating EVmarket share growth (Lin et al. 2014). As such, wireless charging serves as a catalyst to sparkadoption trends and improve sustainable mobility; and (3) increase the production burden andweight of vehicles due to the add-on equipment of onboard wireless chargers. Shared mobility canincrease the ridership which results in extra distance detoured to pick up and drop off the additionalpassengers and add-on vehicle weight from the additional passengers, but it would reduce the fleetsize required to serve the same amount of passenger travel. Autonomous driving technology would
Fig. 2 System dynamics driven by the disruptive technologies
Mitigation and Adaptation Strategies for Global Change

(1) reduce trip distance and improve fuel economy by smart routing; (2) improve vehicle range(miles traveled) and service time because of continuous operation of driverless vehicles as comparedto a human-driving vehicle operation that may be interrupted by the driver’s need to rest after a fewhours of driving; (3) improve thewireless charging efficiency by aligning the onboard charging padsperfectly with the off-board charging pads by precisely detecting the location of the wirelesscharging transmitter coils on the ground; (4) increase the production burdens, weight, and air dragof the vehicles due to the add-on equipment of autonomous technology (e.g., Lidar and computingsystems); and (5) reduce the vehicle weight due to no need of driver.
3 Quantitative analysis
3.1 System design
A life cyclemodel is developed to evaluate the synergistic effect of the four emerging technologies onthe payback time of GHG emissions of infrastructure and vehicle burdens, by comparing a W+SABEV system (system #1) vs. a non-shared plug-in charging BEV system (system #2) serving thesame fixed number of 12,500 passengers (hypothetical assumption) on a daily basis. The metric ofGHG emissions is selected as an indicator of environmental sustainability performance in this study.
The GHG payback time is defined as the time when the additional burdens resulting fromsystem #1 is equal to the cumulative savings of system #1, as compared to system #2. Theadditional burdens include (1) wireless charging infrastructure; (2) additional weight of pas-sengers per vehicle-trip that add weight to vehicles; and (3) autonomous vehicle device. Theadditional savings include (1) fleet size reduction; (2) battery downsizing; (3) no driver weight(for shared fleets operated by transportation network companies); and (4) use-phase electricitysavings. The emission factors of these burdens and savings are obtained from the literature(Argonne National Laboratory 2017; Bi et al. 2015; Gawron et al. 2018; Kim et al. 2016).
Key parameters of system #1 are varied to illustrate their impacts on the GHG paybacktime, number of vehicles needed, and average battery capacity of EVs, as shown in Table 1.The variation range of each key parameter is based on empirical estimate and the literature.Wireless charging utility factor is defined as the average percentage of time that a W+SABEVspends on charging relative to the entire trip duration, namely the probability that a W+SABEV encounters an available charging facility en route. Smart routing (eco-driving) factor
Table 1 Model setup for system comparison
Key parameters System #1 (W+SABEV) System #2(Plug-in Charging BEV)
Wireless charging utility factor 5– 25% N/AAverage ridership per BEV
(U.S. Department of Transportation 2017)1.5 passengers–2.25 passengers 1.5 passengers
DWPT efficiency (Bi et al. 2016) 65–80% N/A*Miles traveled per BEV per day 120 miles–180 miles 120 milesSmart routing (eco-driving) factor
(Gawron et al. 2018)1.00–0.85 1.00
W+SABEV, wireless charging shared autonomous battery electric vehicles; BEV, battery electric vehicles; DWPT,dynamic wireless power transfer; N/A, not available
*Plug-in charging efficiency (grid-to-battery) is assumed to be 90%
Mitigation and Adaptation Strategies for Global Change

is defined as the ratio of the trip distance after and before autonomous driving technology isemployed, due to better speed control, routing, and platooning. The ridership is varied startingfrom 1.5 passengers per trip because it is assumed to operate in populated urban area.
Detailed model parameters and equations are documented in the Appendix.
3.2 GHG payback time
The impacts on GHG payback time, fleet size, and average battery capacity from individualtechnologies as well as all technologies in conjunction are shown in Fig. 3. The results indicatethat deploying all of those technologies in conjunction would significantly decrease the GHGpayback time, number of vehicles, and battery capacity. Individual technology alone would notachieve such a great reduction. However, it is also noted that shared mobility and smart routing(or eco-driving) are key drivers to reduction of GHG payback time due to the benefits of fleetsize reduction and fuel efficiency improvement brought by each technology respectively. Theincrease of wireless charging utility factors will increase charging opportunity and time, sosmaller battery capacities are needed; however, this alone is not enough to reduce GHGpayback time. The increase of vehicle miles traveled per day for each EV would require alarger battery but would result in a reduction in number of vehicles.
Further analysis demonstrates the impact of wireless charging utility factor on the GHG paybacktime by evaluating an averageW+SABEV fleet, as shown in Fig. 4. Compared to a plug-in chargingBEV system, aW+SABEV systemwith wireless charging utility factor < = 5%will pay back GHGemission burdens of additional infrastructure deployment beyond 10 years; and a W+SABEVsystemwith wireless charging utility factor more than or equal to 19%will pay back GHG emissionburdens of additional infrastructure deployment within 5 years. The presented sustainability
Fig. 3 Effect of each technology on the payback time, fleet size, and battery capacity. DWPT, dynamic wirelesspower transfer; SWPT, stationary wireless power transfer; VMT, vehicle miles traveled; EV, electric vehicle; AV,autonomous vehicle
Mitigation and Adaptation Strategies for Global Change

framework suggests that a high utilization of a given system is a fundamental requisite for its overallsustainability. Within the context of transportation systems, this implies that vehicle operation timeand range should be maximized and charging infrastructure should be fully utilized through optimaldeployment. This principle of utility maximization is essential so that the upfront burdens can beoffset by in-use savings. This studymodels the future technologies and assumes that the autonomousdriving device consumes an additional 10% of energy of a BEV, which is based on the prediction offuture computing efficiency and energy performance of autonomous driving device. A sensitivityanalysis is conducted to evaluate if a higher energy consumption by autonomous driving devicewould significantly increase the GHG payback time. It is found that when the wireless chargingutility factor is above 15%, the payback time would only increase by about 2 to 4 years if theadditional energy consumption is increased to 20% of total BEV energy use, but when the utilityfactor is lower than 15%, the payback time would be doubled or even tripled. Therefore, it alsomeans a higher utility factor is very important for a promising payback time.
4 Conclusions and discussions
Much of the current literature focuses on the analysis of transportation systems andemerging technologies. While it is vital to develop individual emerging technology andimprove its individual performance, it is equally important to recognize and assess the
Fig. 4 Effect of wireless charging utility factor on the payback time. GHG, greenhouse gases; WPT, wirelesspower transfer
Mitigation and Adaptation Strategies for Global Change

synergistic effects of the following emerging technologies and the interconnectionbetween vehicle and infrastructure:
& Wireless charging technology& Shared mobility services technology& Autonomous driving technology& Battery electric vehicle technology
Through both qualitative and quantitative analyses and a parametric model of a W+SABEVfleet, the synergistic effects of the four technologies are demonstrated in enhancing sustain-ability of future transportation and reducing payback of upfront GHG emission burdens frominfrastructure and vehicles. Shared mobility and eco-driving are key drivers to reduction ofGHG payback time due to the benefits of fleet size reduction and fuel efficiency improvementbrought by each technology respectively. Results indicate that based on the status quo andpredictions of technology development using 2018 data, compared to a plug-in charging BEVsystem:
& AW+SABEV system with wireless charging utility factor less than or equal to will payback GHG emission burdens of additional infrastructure deployment beyond 10 years (sothis is not optimal by any means, and this valley of death needs to be avoided at the verybeginning of W+SABEV projects);
& AW+SABEV system with wireless charging utility factor more than or equal to 19% willpay back GHG emission burdens of additional infrastructure deployment within 5 years.
Globally, urbanization and growth in vehicle ownership pose significant sustainability chal-lenges for decision makers to mitigate emissions and reduce energy consumption from thetransportation sector. One way to address these challenges is to reduce vehicle ownership andimprove fleet efficiency through shared mobility. Ride-hailing vehicles currently represents upto 5% of total passenger miles traveled (U.S. Department of Transportation 2017), and it isexpected to continually gain more dominance. Wireless charging is becoming a promisingsolution for efficient operation of ride-hailing fleets, as indicated by a recent news announce-ment that wireless charging infrastructure is to be deployed for electric taxis in Oslo, Norway(Dzikiy 2019).
This study demonstrates that by integrating wireless charging, vehicle automation, andelectrification into a ride-hailing fleet, the resulting synergies can reduce the number ofvehicles needed by more than 50% while still serving the same travel demand. The efficiencyand convenience elements realized through these emerging technologies during fleet operationare vital contributors in terms of mitigating overall GHG emissions and paying back theinfrastructure GHG emission burdens.
There are a variety of applications of W+SABEV systems to shape future mobility andmitigate global impacts of transportation, for example, ride-hailing and taxi services, transitbusses, and shuttle busses. In urbanized areas, shared mobility is gradually replacing travel byprivately owned vehicles where W+SABEV systems can play an important role in drivingsustainable mobility transformations.
Future work using agent-based modeling (ABM) approaches would be useful tocharacterize the real-world stochasticity. A deterministic life cycle model is developedin study to evaluate the synergistic effect of four emerging technologies to enhance
Mitigation and Adaptation Strategies for Global Change

sustainable mobility. The deterministic model is capable of characterizing the keyparameters of the system, including vehicle miles traveled, average fuel economy, andbattery downsizing. However, in the real world, there is stochastic effect from passengertravel demand and actual traffic congestion. By modeling passengers and vehicles asagents, further examination of the W+SABEV system by using ABM can informdecision-making in terms of optimizing the layout of wireless charging infrastructureto better serve the passenger travel demand within a region by shared mobility services.An ABM would also help investigate and provide more insights on the effect ofrandomness of passenger travel demand (e.g., origin, destination, and trip distance) onthe reliability of the W+SABEV system. In addition, ABM approach can also incorporatethe convenience benefits of stationary wireless charging at home or at work whicheliminates the hassle of plugging in. Charging convenience can be quantitatively char-acterized by the monetary value of saved time. A policy analysis on the real-time pricingmechanisms can be conducted to examine the impact of different prices of electricityaccording to supply and demand on the vehicles’ decisions on route choices so as to helpregulate and decentralize congestion on wireless charging lanes. In this research, GHG isused as a sustainability indicator. Other metrics, such as costs, may have differentpatterns from the GHG results. In future work, the economic performance and synergiesof W+SABEV systems can be evaluated by using a sophisticated economic and businessmodel and calculating the payback of infrastructure investment costs from use-phasesaving and revenues. Through ABM, future work can also incorporate the possibleincrease in vehicle miles traveled due to dead-heading and rebound effects.
Acknowledgements This work is part of the U.S.-China Clean Energy Research Center (CERC) on CleanVehicles. This work is supported by the U.S. Department of Energy, Argonne National Laboratory [awardnumber 7F-30052] operated by UChicago Argonne LLC under Contract No. DE-AC02-06CH11357, and theirindustrial partners. This research also received support from a University of Michigan Rackham Graduate SchoolPreDoctoral Fellowship. Dr. Yan Zhou, Dr. Michael Wang, and Dr. Zhenhong Lin’s research efforts are fundedby the Vehicle Technologies Office of the U.S. Department of Energy Office of Energy Efficiency andRenewable Energy.
Compliance with ethical standards
Conflict of interest The authors declare that they have no conflict of interest.
Appendix
This Appendix provides detailed model equations and calculations. To compare the system perfor-mance of the base case of a plug-in charging BEV fleet vs. aW+SABEV fleet, it is assumed that bothsystems will provide mobility services for a fixed total passenger travel per day, i.e., Φ=12500passengers per day, as shown in Eq. (1). Φ is a product of average number of passengers per trip
(npassenger for the base case and n0passenger for theW+SABEV), average number of trips per vehicle per
day (ntrip for the base case and n0trip for the W+SABEV), and number of vehicles (nveh for the base
case and n0veh for theW+SABEV). The average mileage per vehicle per day (L for the base case and
L0for theW+SABEV) can be calculated using Eq. (2) to Eq. (5) with the average miles per trip (dtrip
Mitigation and Adaptation Strategies for Global Change

= 10 miles/trip), miles of detour per passenger (dpassenger = 1 mile/passenger), smart routing (eco-driving) factor θ, range extension factor β, and ridership factor κ.
Φ ¼ npassengerntripnveh ¼ n0passengern
0tripn
0veh ð1Þ
L ¼ Φ
npassengernvehdtrip þ dpassengernpassenger
� �ð2Þ
β ¼ L0
Lð3Þ
κ ¼ n0passenger
npassengerð4Þ
L0 ¼ Φ
n0passengern
0veh
dtrip þ dpassengern0passenger
� �θ ð5Þ
The average BEV battery capacity for the base case cB is defined by Eq. (6), where e is theaverage energy consumption rate of a battery electric vehicle (0.33 kWh/mile) and ε is the stateof charge window (60%), i.e., the operating capacity relative to the nameplate capacity. Theautonomous driving device consumes additional energy eAV(kWh/mile), which is assumed to
be a proportion (μ = 10%) of e, as shown in Eq. (7). The time of en route charging TSWPT
(hours of charging per vehicle per day) at SWPT charging spots can be calculated bymultiplying the utility factor kSWPT (probability of encountering a SWPT charging spot),
number of stops at traffic intersections per day L0
dstop(where dstop is the average distance between
stops), and average stoppage time at a traffic intersection (tSWPT), as shown in Eq. (8).
Similarly, the time of en route charging TDWPT (hours of charging per vehicle per day) onDWPT charging lanes can be calculated by multiplying the utility factor kDWPT (probability of
driving on a DWPT lane) and total vehicle operating time per day L0
v (where v is average
vehicle speed), as shown in Eq. (9). The average battery capacity for a vehicle in the W+SABEV fleet c″B can be calculated using Eq. (10) to Eq. (13). The base case battery capacity cBneeds to be adjusted by taking into account the following factors: (1) those en route charging
(ηSWPTηBPTSWPT and ηDWPTηBPTDWPT) can downsize the battery; (2) vehicle weight changeresulting from battery weight change, equipment weight change, and passengers’ weightchange; and (3) energy consumption rate change due to vehicle weight change, smart driving,and additional energy consumption by autonomous driving device. ηSWPT is the SWPT grid-to-battery charging efficiency, ηB is the battery charge/discharge efficiency (90%), P is the actualpower rate (30 kW), ηDWPT is the grid-to-battery DWPT charging efficiency, cB, min is theassumed minimum battery capacity (20 kWh), ρ is 0.156 kWh/kg of lithium ion battery of a
Mitigation and Adaptation Strategies for Global Change

Tesla Model S, Δe is the average change in energy consumption rate (kWh/mile),wperson is theaverage weight of a person (79 kg),wOW is the weight of an onboard wireless charger (16 kg),wAV is the weight of autonomous driving device (16–22 kg) (Gawron et al. 2018),wveh is theweight of a base case vehicle (1595 kg), ϕ is the lightweighting correlation (6% energyconsumption reduction per 10% vehicle weight reduction) (Bi et al. 2015), λ is a factorcharacterizing the energy saving due to smart routing (eco-driving) and better speed control ofautonomous vehicles and is assumed to equal θ, e′ is the energy consumption rate (kWh/mile)
for a W+SABEV, c0B is the intermediate calculated battery capacity for a W+SABEV, and c″B is
the final calculated battery capacity of a W+SABEV.
cB ¼ L⋅eε
ð6Þ
eAV ¼ e⋅μ ð7Þ
TSWPT ¼ kSWPT⋅L
0
dstop⋅tSWPT ð8Þ
TDWPT ¼ kDWPT⋅L
0
vð9Þ
c0B ¼ max
L0 ⋅ eþ eAVð Þ−ηSWPTηBPTSWPT−ηDWPTηBPTDWPT
� �ε
; cB;min
8<:
9=; ð10Þ
Δe ¼cB−c
0B
� �=ρþ wpersonnpassenger þ wperson
� �− wpersonn
0passenger þ wOW þ wAV
� �wveh
⋅ϕ⋅e ð11Þ
e0 ¼ λ⋅ e−Δe
� �ð12Þ
c″B ¼ maxL
0
⋅ e0 þ eAV� �
−ηSWPTηBPTSWPT−ηDWPTηBPTDWPT
ε; cB;min
8<:
9=; ð13Þ
Finally, the breakeven time τ (days) is calculated by letting fnet = fburdens − fsavings = 0 and solvingEq. (14) to Eq. (19). fnet,fburdens, and fsavings are the cumulative net emissions (kg CO2-eq),additional burdens of W+SABEV infrastructure and device (kg CO2-eq), and additionalsavings of W+SABEV (kg CO2-eq), respectively.nSWPT is number of traffic intersections with
Mitigation and Adaptation Strategies for Global Change
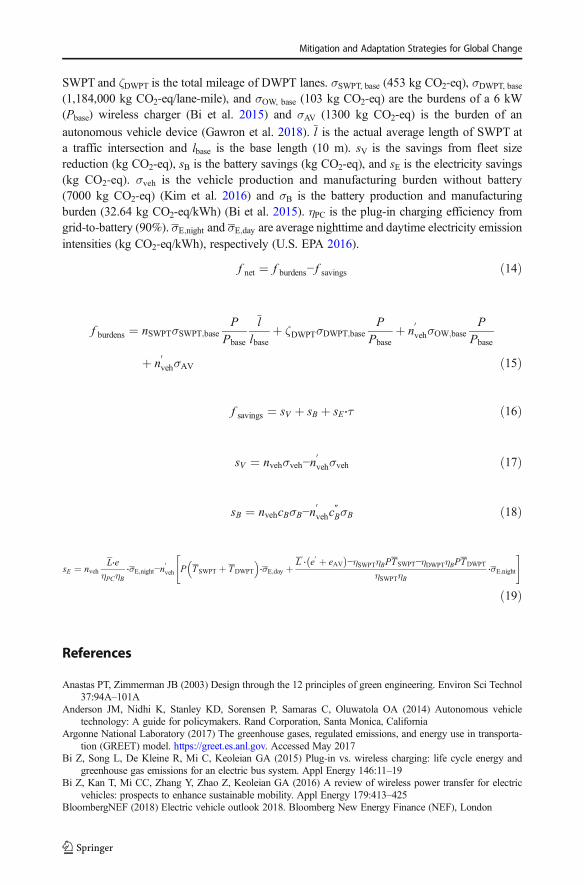
SWPT and ζDWPT is the total mileage of DWPT lanes. σSWPT, base (453 kg CO2-eq), σDWPT, base
(1,184,000 kg CO2-eq/lane-mile), and σOW, base (103 kg CO2-eq) are the burdens of a 6 kW(Pbase) wireless charger (Bi et al. 2015) and σAV (1300 kg CO2-eq) is the burden of an
autonomous vehicle device (Gawron et al. 2018). l is the actual average length of SWPT ata traffic intersection and lbase is the base length (10 m). sV is the savings from fleet sizereduction (kg CO2-eq), sB is the battery savings (kg CO2-eq), and sE is the electricity savings(kg CO2-eq). σveh is the vehicle production and manufacturing burden without battery(7000 kg CO2-eq) (Kim et al. 2016) and σB is the battery production and manufacturingburden (32.64 kg CO2-eq/kWh) (Bi et al. 2015). ηPC is the plug-in charging efficiency fromgrid-to-battery (90%). σE;night and σE;day are average nighttime and daytime electricity emissionintensities (kg CO2-eq/kWh), respectively (U.S. EPA 2016).
f net ¼ f burdens− f savings ð14Þ
f burdens ¼ nSWPTσSWPT;baseP
Pbase
llbase
þ ζDWPTσDWPT;baseP
Pbaseþ n
0vehσOW;base
PPbase
þ n0vehσAV ð15Þ
f savings ¼ sV þ sB þ sE⋅τ ð16Þ
sV ¼ nvehσveh−n0vehσveh ð17Þ
sB ¼ nvehcBσB−n0vehc
″BσB ð18Þ
sE ¼ nvehL⋅e
ηPCηB⋅σE;night−n
0veh P TSWPT þ TDWPT
� �⋅σE;day þ
L0 ⋅ e0 þ eAV� �
−ηSWPTηBPTSWPT−ηDWPTηBPTDWPT
ηSWPTηB⋅σE;night
" #
ð19Þ
References
Anastas PT, Zimmerman JB (2003) Design through the 12 principles of green engineering. Environ Sci Technol37:94A–101A
Anderson JM, Nidhi K, Stanley KD, Sorensen P, Samaras C, Oluwatola OA (2014) Autonomous vehicletechnology: A guide for policymakers. Rand Corporation, Santa Monica, California
Argonne National Laboratory (2017) The greenhouse gases, regulated emissions, and energy use in transporta-tion (GREET) model. https://greet.es.anl.gov. Accessed May 2017
Bi Z, Song L, De Kleine R, Mi C, Keoleian GA (2015) Plug-in vs. wireless charging: life cycle energy andgreenhouse gas emissions for an electric bus system. Appl Energy 146:11–19
Bi Z, Kan T, Mi CC, Zhang Y, Zhao Z, Keoleian GA (2016) A review of wireless power transfer for electricvehicles: prospects to enhance sustainable mobility. Appl Energy 179:413–425
BloombergNEF (2018) Electric vehicle outlook 2018. Bloomberg New Energy Finance (NEF), London
Mitigation and Adaptation Strategies for Global Change

Chen TD, Kockelman KM, Hanna JP (2016) Operations of a shared, autonomous, electric vehicle fleet:implications of vehicle & charging infrastructure decisions. Transport Res A 94:243–254
Dzikiy P (2019) Oslo to become first city with wireless charging infrastructure for electric taxis. https://electrek.co/2019/03/21/oslo-wireless-charging-taxis/. Accessed April 2019
Fagnant DJ, Kockelman KM (2014) The travel and environmental implications of shared autonomous vehicles,using agent-based model scenarios. Transp Res C 40:1–13
Fulton L, Mason J, Meroux D (2017) Three revolutions in urban transportation: how to achieve the full potentialof vehicle electrification, automation, and shared mobility in urban transportation systems around the worldby 2050. No. STEPS-2050,
Gawron JH, Keoleian GA, De Kleine RD, Wallington TJ, Kim HC (2018) Life cycle assessment of connectedand automated vehicles: sensing and computing subsystem and vehicle level effects. Environ Sci Technol52:3249–3256
Hao H, Wang M, Zhou Y, Wang H, Ouyang M (2015) Levelized costs of conventional and battery electricvehicles in China: Beijing experiences. Mitig Adapt Strateg Glob Chang 20:1229–1246
Kan T, Nguyen T-D, White JC, Malhan RK, Mi C (2017) A new integration method for an electric vehiclewireless charging system using LCC compensation topology: analysis and design. IEEE Trans PowerElectron 32:1–12
Kim HC, Wallington TJ, Arsenault R, Bae C, Ahn S, Lee J (2016) Cradle-to-gate emissions from a commercialelectric vehicle Li-ion battery: a comparative analysis. Environ Sci Technol 50:7715–7722
Lee S, Choi B, Rim CT (2013) Dynamics characterization of the inductive power transfer system for onlineelectric vehicles by Laplace phasor transform. IEEE Trans Power Electron 28:5902–5909
Li S, Mi C (2014) Wireless power transfer for electric vehicle applications. IEEE J Emerg Sel Topics PowerElectron 3:4–17. https://doi.org/10.1109/JESTPE.2014.2319453
Lin Z, Li J, Dong J (2014) Dynamic wireless power transfer: potential impact on plug-in electric vehicle adoptionSAE Technical Paper 2014-01-1965
Liu Z, Song Z (2017) Robust planning of dynamic wireless charging infrastructure for battery electric buses.Transp Res C 83:77–103
Plugless Power (2015) Plugless Power website. https://www.pluglesspower.com/. Accessed June 2015Shoup D (2017) The high cost of free parking: Updated edition. Routledge, New YorkSperling D (2018) Three revolutions: steering automated, shared, and electric vehicles to a better future. Island
Press, Washington D.C.U.S. Department of Transportation (2017) National Household Travel Survey. https://nhts.ornl.gov/. Accessed
January 2019U.S. EPA (2016) Avoided emissions and generation tool (AVERT). U.S. Environmental Protection Agency
(EPA) Office of Air and Radiation Climate Protection Partnerships Division, Washington D.C.Zhou Y, Wang M, Hao H, Johnson L, Wang H (2015) Plug-in electric vehicle market penetration and incentives:
a global review. Mitig Adapt Strateg Glob Chang 20:777–795Zivin JSG, Kotchen MJ, Mansur ET (2014) Spatial and temporal heterogeneity of marginal emissions: impli-
cations for electric cars and other electricity-shifting policies. J Econ Behav Organ 107:248–268
Publisher’s note Springer Nature remains neutral with regard to jurisdictional claims in published maps andinstitutional affiliations.
Affiliations
Zicheng Bi1 &Michael A. Reiner1 & Gregory A. Keoleian1 & Yan Zhou2 &Michael Wang2 &
Zhenhong Lin3
1 School for Environment and Sustainability, University of Michigan, Ann Arbor, MI 48109, USA2 Systems Assessment Center, Energy Systems Division, Argonne National Laboratory, Lemont, IL 60439,
USA3 Oak Ridge National Laboratory, National Transportation Research Center, Knoxville, TN 37932, USA
Mitigation and Adaptation Strategies for Global Change