wipro limited - it services, consulting, system ... · wipro limited presentation to ... 2006-07...
TRANSCRIPT

© 2017 Wipro wipro.com confidential 1
Wipro Limited
Presentation to Investors
January - March 2018

© 2017 Wipro wipro.com confidential 2
Safe Harbor
This presentation may contain certain “forward looking” statements, which involve a
number of risks, uncertainties and other factors that could cause actual results to
differ materially from those that may be projected by these forward looking
statements. These uncertainties have been detailed in the reports filed by Wipro
with the Securities and Exchange Commission and these filings are available at
www.sec.gov. This presentation also contains references to findings of various
reports available in the public domain. Wipro makes no representation as to their
accuracy or that the company subscribes to those findings.

© 2017 Wipro wipro.com confidential 33
Our track record on performance1
Agenda
Overall Market Opportunity2
Our Strategy3

© 2017 Wipro wipro.com confidential 4
Track record on performance

© 2017 Wipro wipro.com confidential 5
Growth of IT services business
$2,611 $3,647
$4,323 $4,390 $5,221
$5,921 $6,218 $6,618 $7,082 $7,346 $7,705
2006-07 2007-08 2008-09 2009-10 2010-11 2011-12 2012-13 2013-14 2014-15 2015-16 2016-17
Other Highlights
IT Services Revenue ($ million)
• 1200+ active global clients
• Nine $100M relationships
• 58% revenues on Fixed Price
• Part of NYSE TMT Index
• Present in six continents
• 50%+ Revenues from America
• Over 160,000 employees
• 100+ nationalities represented
• 33%+ women employees
Partner to Industry Global footprint Diverse talent pool
IT Services Business has grown at a CAGR of above 10% in the last 10 years

© 2017 Wipro wipro.com confidential 6
Revenue distribution – Well diversifiedRevenue Distribution Business Unit-wise share
Revenue contribution^
Top customer
Top 5 customers
Top 10 customers
Customers >$100 MN
Customers >$1 MN
3.1%
11.3%
17.8%
9
635A Trailing Twelve month basis
Customer Metrics
BFSI - Banking, Financial Services
and Insurance
HLS - Healthcare and Life Sciences
CBU – Consumer BU
ENU - Energy, Natural Resources
and Utilities
COMM – Communications BU
MNT - Manufacturing and
Technology
Service Line distribution
GIS-Global Infrastructure Services
PES-Product Engineering Services
BPS-Business Process Services
Scale in developed & presence in emerging markets
Revenue well-diversified across verticals, service line & geographies
The distribution percentages have been calculated based on Q3FY18 USD revenues for the Business Unit/ Service line/ Geography
Geographical Distribution
I&ME-India & Middle-East
APAC-Asia Pacific
OEM-Other Emerging Markets
COMM6%
BFSI29%
MNT23%
HLS14%
CBU16%
ENU12%
GIS28%
Analytics7%
BPS13%
PES7%
Application Services
45%
Americas53%
Europe26%
I&ME 10%
APAC and OEM 11%

© 2017 Wipro wipro.com confidential 7
Overall market opportunity

© 2017 Wipro wipro.com confidential 8
Global market size
India’s offshore IT and BPO exports ($B)~ 350-400
~200-225
23.6
617.7
31.440.3
59.1
47.149.7
CAGR
17%
FY12
68.8
FY13FY07FY06FY05 FY08 FY09 FY10 FY11 FY14
76.187.7
FY 2020
98.5
FY15 FY 2025
117
FY16
Digital technologies
FY17
108
• Long Term Fundamentals of the India Off-shoring story remain intact
• Off-shoring market is expected to grow at a 15% CAGR for the next eight years
• Revenues from Digital technologies are expected to represent 23% and 38% share by 2020 and 2025
Source: NASSCOM The IT - BPO Sector in India – Strategic Review 2017

© 2017 Wipro wipro.com confidential 9
Our strategy

© 2017 Wipro wipro.com confidential 10
Themes to win: Change: Driving the ‘Future’
World class Ecosystem
Digital
Non-Linearity
• Appirio and Designit have integrated well with our digital unit and the Joint GTM is helping in securing synergy deals
• Have 16 global digital pods; Have almost 90,000 technical employees trained on digital skills
• Digital grew from 17.5% of revenues in Q1 FY17 to 25.1% in Q3 FY18
• Consulting grew from 4.9% of revenues in Q1 FY17 to 6.8% of revenues in Q3 FY18
• M&A: Acquired 6 companies - Designit, Cellent, HealthPlan Services, Appirio, Infoserver and Cooper since 2015
• Ventures has 13 minority investments. We have multiple commercial GTM engagements with our portfolio companies
• Academia Partnerships: Our focus is to work with academic institutions and associations in the United States, Europe,
Israel and India in the fields of computer and electrical engineering
• Horizon Program: we are investing in key areas such as AI, cloud computing, cybersecurity, digital experience, digital
marketing & commerce, Industry 4.0, Block Chain and Software Defined everything. Total 14 themes being funded.
• Crowdsourcing: We are innovators in building crowdsourcing delivery models to serve enterprise customers.
• New Age Ecosystem: We have formed a fresh group tasked with creating solutions, platforms and offerings for these
customers in the areas of digital, cloud, analytics, cybersecurity and BPaaS, among others
• Advisory, Design & technology
• Transformative end-user experience
• Training Workforce in Digital
• Investments in IP
• Target incremental revenue led by IP
• Wipro HOLMES
• Focus on core suite of IP assets including product (eg. Promax), platform (eg, ServiceNXT), solution (eg. Managed File
Transfer) & tool (eg. RPA)
• Holmes for Business is focused on building verticalized solutions. Eg: use cases in areas such as compliance,
onboarding, customer service, supply chain & anomaly detection
• We have filed 1,858 patents including many on HOLMES and Blockchain
• M&A and Wipro Ventures
• Alliances & Academia
• Strategic partnerships
• Horizon Intrapreneurship
© 2017 Wipro wipro.com confidential 11
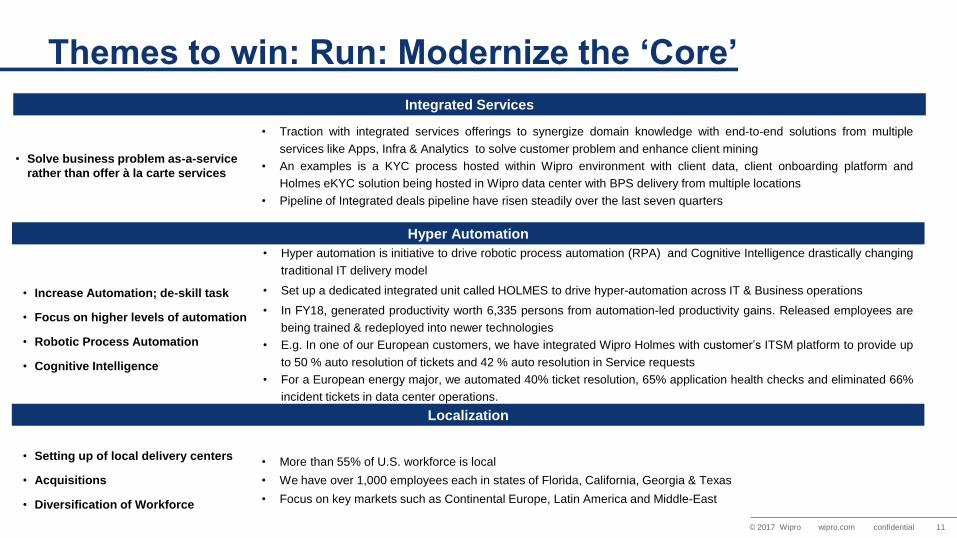
Themes to win: Run: Modernize the ‘Core’
Integrated Services
Hyper Automation
Localization
• Traction with integrated services offerings to synergize domain knowledge with end-to-end solutions from multiple
services like Apps, Infra & Analytics to solve customer problem and enhance client mining
• An examples is a KYC process hosted within Wipro environment with client data, client onboarding platform and
Holmes eKYC solution being hosted in Wipro data center with BPS delivery from multiple locations
• Pipeline of Integrated deals pipeline have risen steadily over the last seven quarters
• Hyper automation is initiative to drive robotic process automation (RPA) and Cognitive Intelligence drastically changing
traditional IT delivery model
• Set up a dedicated integrated unit called HOLMES to drive hyper-automation across IT & Business operations
• In FY18, generated productivity worth 6,335 persons from automation-led productivity gains. Released employees are
being trained & redeployed into newer technologies
• E.g. In one of our European customers, we have integrated Wipro Holmes with customer’s ITSM platform to provide up
to 50 % auto resolution of tickets and 42 % auto resolution in Service requests
• For a European energy major, we automated 40% ticket resolution, 65% application health checks and eliminated 66%
incident tickets in data center operations.
• More than 55% of U.S. workforce is local
• We have over 1,000 employees each in states of Florida, California, Georgia & Texas
• Focus on key markets such as Continental Europe, Latin America and Middle-East
• Solve business problem as-a-service
rather than offer à la carte services
• Increase Automation; de-skill task
• Focus on higher levels of automation
• Robotic Process Automation
• Cognitive Intelligence
• Setting up of local delivery centers
• Acquisitions
• Diversification of Workforce
© 2017 Wipro wipro.com confidential 12
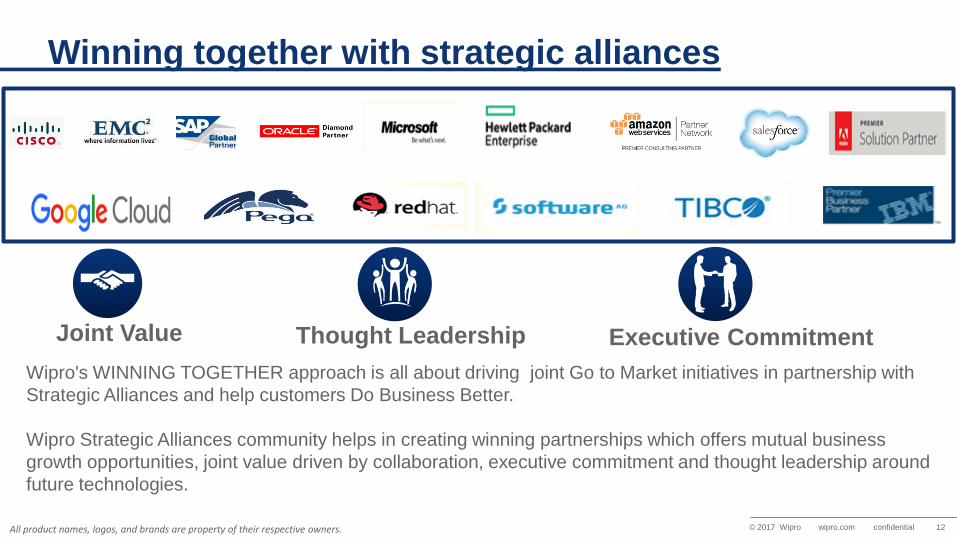
Winning together with strategic alliances
Joint Value Thought Leadership Executive Commitment
Wipro's WINNING TOGETHER approach is all about driving joint Go to Market initiatives in partnership with
Strategic Alliances and help customers Do Business Better.
Wipro Strategic Alliances community helps in creating winning partnerships which offers mutual business
growth opportunities, joint value driven by collaboration, executive commitment and thought leadership around
future technologies.
All product names, logos, and brands are property of their respective owners.

© 2017 Wipro wipro.com confidential 13
Recognitions on sustainability front
© 2017 Wipro wipro.com confidential 14
Annexure – key highlights

© 2017 Wipro wipro.com confidential 15
Financial summary for the quarter ended December 31, 2017
All figures based on IFRS Q3’18 (₹ crores) QoQ Growth
IT Services Revenue 13,235 0.5%
Results from Operating Activities (EBIT)1 1,959 -14.0%
1. We have recorded a provision of ₹3,175 million, consequent to insolvency of a customer, post balance sheet date. Adjusted for that, our Results from Operating
activities for the quarter was ₹2,276 crores.
1crore= 10million.
• Our Gross cash at December 31, 2017 was at ₹28,935 crores.
• IT Services Revenues in dollar terms were $2,013.0 million, which was flat QoQ and increased by 5.8% YoY.
• IT Services Revenues in Non-GAAP constant currency increased by 0.9% QoQ and 3.0% YoY.
• Wipro declared an interim dividend of ₹ 1.00 per share.

© 2017 Wipro wipro.com confidential 16
Highlights for the quarter
Top 10 accounts grew by 12% YoY.
$50Mn+ accounts increased from 33 in Q3’17 to 41 in Q3’18.
Digital revenue surpassed 25% of IT Services. We now have 90,000+ trained on digital skills.
Consulting portfolio grew 9.9% QoQ and 31.1% YoY with a 4-quarter CQGR of 7.0%
More than 55% of our employees in US, 95% in LATAM, and nearly 2/3rd in Continental Europe are locals.
Generated productivity of over 1,500 persons at L2 and above levels in Q3.
We concluded the buyback of 343.75 million equity shares which resulted in a total cash outflow of ₹110,000
million. We saw an active participation from the Investors.

© 2017 Wipro wipro.com confidential 17
Thank you

© 2017 Wipro wipro.com confidential 18
Reconciliation of Selected GAAP measures to Non-GAAP measures
WIPRO LIMITED AND SUBSIDIARIES
(Amounts in ₹crores)
As of
December 31, 2017
Computation of Gross cash position
Cash and cash equivalents 5,207
Investments - Current 23,728
Total 28,935
WIPRO LIMITED AND SUBSIDIARIES
(Amounts in ₹crores)
Three months ended Nine months ended
December 31, 2017 December 31, 2017
Profit for the period [A] 1,937 6,205
Computation of Free cash flow
Net cash generated from operating activities 2,983 7,673
Add/(deduct) cash inflow/(outflow) on :
Purchase of Property, plant and equipment (578) (1,540)
Proceeds from sale of Property, plant and
equipment11 80
Free cash flow [B] 2,416 6,213
Free cash flow as a percentage of Net income [B/A] 125% 100%
Reconciliation of Non-GAAP Constant Currency IT Services Revenue to IT Services Revenue as per IFRS ($MN)
Three months ended December 31, 2017 Three months ended December 31, 2017
IT Services Revenue as per IFRS $2013.0 IT Services Revenue as per IFRS $2,013.0
Effect of Foreign currency exchange movement $ 18.2 Effect of Foreign currency exchange movement $ (53.1)
Non-GAAP Constant Currency IT Services Revenue based on
previous quarter exchange rates$ 2,031.2
Non-GAAP Constant Currency IT Services Revenue based on
exchange rates of comparable period in previous year$1,959.9
Reconciliation of Non-GAAP constant currency Revenue
Reconciliation of Gross Cash Reconciliation of Free Cash Flow

© 2017 Wipro wipro.com confidential 19
Reconciliation of Adjusted Segment Result and Net Income
Reconciliation of Adjusted Segment Result and Net Income (₹ MN)
Three Months ended December 31,2017
IT Services Segment Results 19,590 Profit attributable to Equity Shareholders (Net Income) 19,371
Impact of customer insolvency 3,175 Post-tax impact of customer insolvency 2,568
Adjusted IT Services Segment Results 22,765 Adjusted Profit attributable to Equity Shareholders (Net
Income) 21,939