winthrop university football feasibility study university football feasibility study ... table of...
TRANSCRIPT

Winthrop University
Football Feasibility Study
May 9, 2016
Authors:
Dr. Laura Dawson Ullrich, Associate Professor of Economics and Project Director
Dr. Barbara Fuller, Professor of Marketing
Dr. Louis Pantuosco, Professor of Economics
Dr. Hemant Patwardhan, Associate Professor of Marketing
Dr. Gary Stone, Professor of Economics
Mr. Zach Ringlein, Graduate Research Assistant

2
Table of Contents
1. Executive Summary……………………………………………………………………....3
2. Football Interest Surveys
a. Students…………………………………………………………………………...7
b. Community……………………………………………………………………....12
c. Faculty/Staff…………………………………………………………………......15
d. Alumni…………………………………………………………………………...17
3. GIS Analysis……………………………………………………………………………..22
4. Statistical Analysis
a. Cohort Analysis………………………………………………………………….31
b. Regression Analysis……………………………………………………………..38
5. Costs and Benefits……………………………………………………………………….47
6. Title IX Compliance…………………………………………………………………..…56
7. Conclusion……………………………………………………………………………….65
8. Appendix………………………………………………………………………………...68
3
1. Executive Summary
Winthrop University, founded in 1886, has a strong history of both academic and athletic
success. The first intercollegiate sport at Winthrop was women’s basketball, which began in
1969. Women’s field hockey, volleyball and tennis followed in 1971. Originally a women’s
college, the first male sports were added 1974 when both tennis and golf became intercollegiate
sports. Since then, the quality and quantity of athletic ventures at Winthrop have grown, and a
beautiful sports campus has been developed at Winthrop Lake. As of 2016, the following
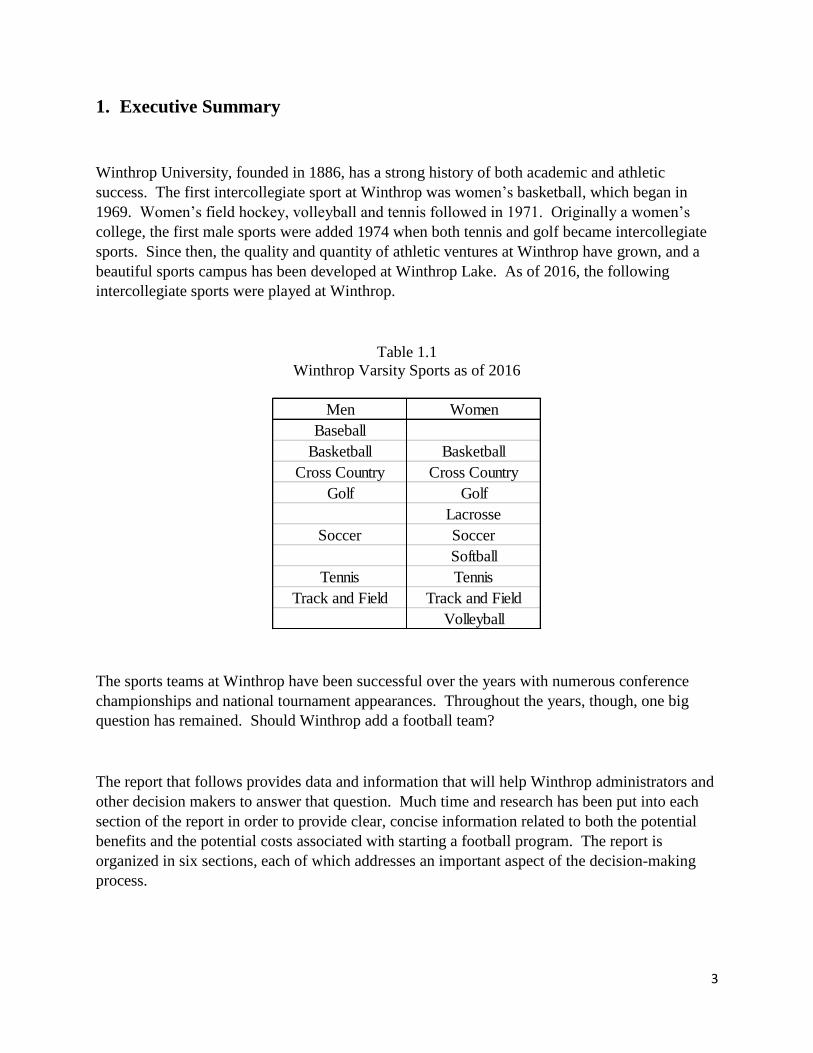
intercollegiate sports were played at Winthrop.
Table 1.1
Winthrop Varsity Sports as of 2016
The sports teams at Winthrop have been successful over the years with numerous conference
championships and national tournament appearances. Throughout the years, though, one big
question has remained. Should Winthrop add a football team?
The report that follows provides data and information that will help Winthrop administrators and
other decision makers to answer that question. Much time and research has been put into each
section of the report in order to provide clear, concise information related to both the potential
benefits and the potential costs associated with starting a football program. The report is
organized in six sections, each of which addresses an important aspect of the decision-making
process.
Men Women
Baseball
Basketball Basketball
Cross Country Cross Country
Golf Golf
Lacrosse
Soccer Soccer
Softball
Tennis Tennis
Track and Field Track and Field
Volleyball

4
Football Interest Surveys
Four football interest surveys were conducted, investigating the opinions of four distinct
stakeholder groups: students, alumni, faculty/staff, and local football fans. The overall responses
were positive with most respondents expressing a desire for a football program at Winthrop. The
most enthusiastic groups were alumni and local football fans. Current Winthrop students also
supported the idea overall, and indicated that their participation in campus activities would
increase if football were added. However, they were less enthusiastic about carrying the cost of
a Winthrop football program, with half of the students indicating that they would not be willing
to pay a student fee associated with the program. Faculty and staff had mixed opinions. Staff
members were generally supportive of adding football, while faculty were more lukewarm to the
idea.
Statistical Analysis
Two different types of statistical analysis were conducted. The first, used a Football Cohort and a
Non-Football Cohort to compare universities that have added football since 2003 and those that
did not. The evidence shows that schools that added football increased enrollment at a rate
greater than those that do not have a football team. This impact was stronger when analyzing
male student enrollment. Adding football increased male enrollment more than female
enrollment, although both increased at rates higher than were seen at schools which have not
added football.
A more sophisticated regression analysis was also conducted to see if the increases observed in
the cohort analysis were indeed related to football or were instead related to some other factor
such as tuition changes or a decrease in admission standards. Model results indicate that football
is indeed a statistically significant contributor to the higher freshman enrollment seen at schools
in the Football Cohort. This result holds both for schools that play in the Football Championship
Subdivision (FCS) and the group as a whole.1 Estimates from the regression suggest that, if
Winthrop had a football team, it would have had 13.53 percent more full-time freshman in 2014.
In addition, the models show that while applications and enrollment do seem to be positively,
and significantly, linked to the presence of a football team, having football does not appear to
significantly affect total full-time undergraduate enrollment. Results indicate that this is at least
partially due to the presence of lower retention rates in schools in the Football Cohort.2
1 The FCS subdivision will be discussed in more detail later in the report. 2 The number of transfer students may also impact total enrollment numbers. Transfer students are not included in
the freshman numbers, but any that transfer in as full-time students are captured in the total undergraduate
enrollment numbers.

5
Costs/Benefits
The cost of adding football is high, not just because of the fields and locker rooms that must be
built, but also because of the coaching and support staff that must be established. It is estimated
that it would cost $11.5 million to build the necessary facilities, and an additional $3.2 - $4.8
million would be needed annually for operating expenses. This amount varies based on whether
a scholarship or non-scholarship program is added. If a scholarship football program was
chosen, an estimated $1.5 million would be needed annually for scholarships.
While costs are high, there are also potential benefits. While the benefits are more difficult to
calculate, additional revenue would be expected if football were added at Winthrop. This
increase is not just from revenue received directly from football. It would also come from
tuition/fees from potential increased enrollment and the sale of Winthrop merchandise.
GIS Analysis
Geographic Information Systems (GIS) analysis was used to visually consider the regional
interest in football. Data on interest surrounding college and professional football were analyzed
based on a 30-, 60- and 120-minute drive time from Winthrop’s campus. Interestingly, residents
of York County were found to be more likely to attend college football games than residents in
the counties where the University of South Carolina and Clemson University are located.
Title IX
Title IX is a federal law that outlaws discrimination, based on sex, in institutions that receive
federal funding. This is applicable to college athletics since colleges and universities receive
federal funds through financial aid, grants, etc. The most well-known application of Title IX in
athletics is the proportionality of athletic opportunities which says that the proportion of sports
opportunities available to women should be equal to, or greater than, the proportion of women in
the full-time undergraduate student body.
Winthrop does not meet the strict definition of the proportionality of athletic opportunities, as 68
percent of full-time undergraduate students are female and only 49 percent of Winthrop athletes
are female. However, Winthrop has been able to remain Title IX compliant by showing a pattern
of adding additional women’s opportunities over time (most recently soccer and lacrosse).
Adding a football team is a move away from Title IX compliance unless at least an equivalent
number of female athletes are also added.

6
The report that follows expands on each of these topics and provides detailed information on
how football is expected to impact Winthrop University and the surrounding community.

7
2. Football Interest Surveys
There are many different stakeholders interested in Winthrop’s decision regarding adding
football as an intercollegiate sport. Some of these stakeholders, anecdotally at least, seem
excited about the proposition, while others appear hesitant. In order to investigate the opinion of
Winthrop’s stakeholders, four separate surveys were developed and conducted. The four surveys
are as follows:
Current Winthrop Students
Local Football Fans (surveyed at high school football stadiums)
Winthrop Faculty and Staff
Winthrop Alumni
Each of the stakeholder groups is subject to its own biases, and these are recognized. However,
it is still critical for decision makers to understand how current stakeholders feel about the issue.
It is reasonable to expect that local football fans would be biased towards a football program,
and that faculty/staff might be biased against a program as they worry about where the money to
operate a program would come from. While it is impossible to eliminate the bias from the
surveys, the questions and methods were chosen carefully with the possibility of biases in mind.
Student Survey
Shortly before the commencement of this study, a Winthrop graduate student created and
executed a detailed survey that measured Winthrop students’ interest in the addition of football at
the university. Because the response rate was strong and the questions were well written and
academically sound, the results of this student survey were utilized for the report. Using the
previously completed student survey also eliminated the probability of confusion and bias related
to two similar surveys coming out within a short period of time.
This survey of students who were enrolled at Winthrop University was conducted over the
course of three weeks in October 2015. The survey was administered using the Qualtrics (2013)
online survey program, and took subjects 5 to 10 minutes to complete. The subjects were given a
written statement prior to beginning the survey, had to agree to take the survey, and were
required to be 18 years or older and to be a currently registered Winthrop student.
The sample used for analysis included 833 students. The majority of the sample were female (n =
75 percent), and White (n = 65 percent) or African American (n = 27 percent). Other
demographic information is included in Table 2.1.
8
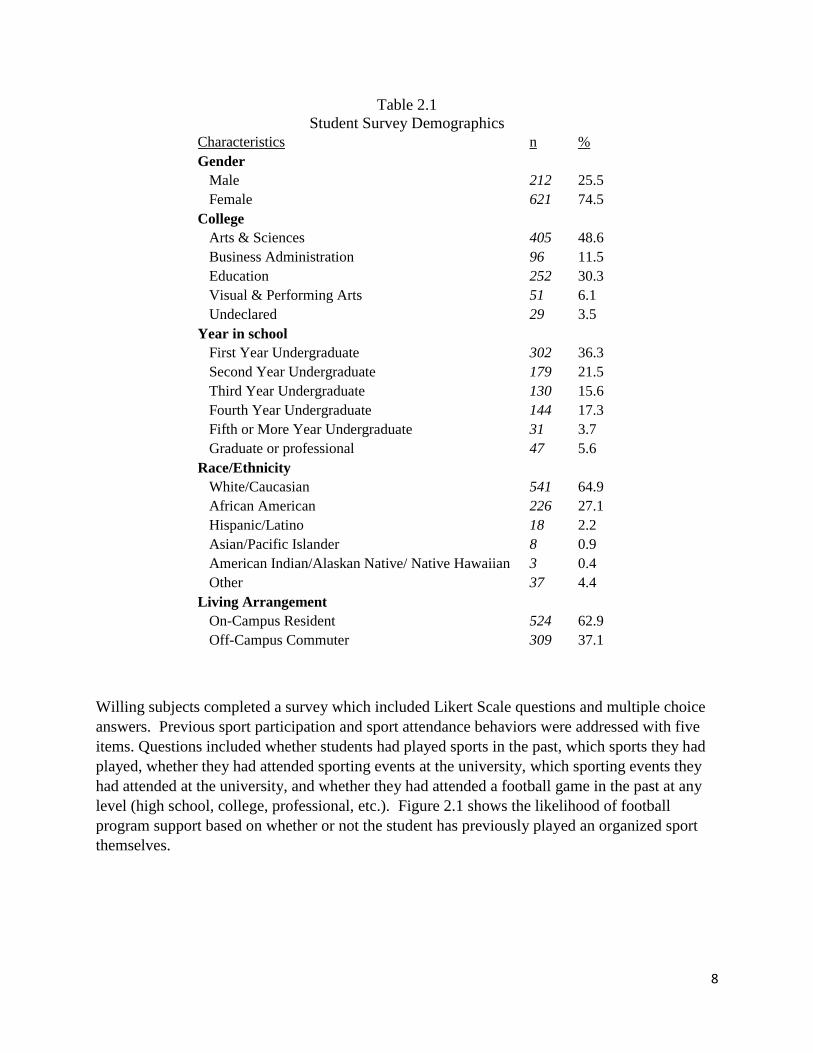
Table 2.1
Student Survey Demographics
Willing subjects completed a survey which included Likert Scale questions and multiple choice
answers. Previous sport participation and sport attendance behaviors were addressed with five
items. Questions included whether students had played sports in the past, which sports they had
played, whether they had attended sporting events at the university, which sporting events they
had attended at the university, and whether they had attended a football game in the past at any
level (high school, college, professional, etc.). Figure 2.1 shows the likelihood of football
program support based on whether or not the student has previously played an organized sport
themselves.
Characteristics n %
Gender
Male 212 25.5
Female 621 74.5
College
Arts & Sciences 405 48.6
Business Administration 96 11.5
Education 252 30.3
Visual & Performing Arts 51 6.1
Undeclared 29 3.5
Year in school
First Year Undergraduate 302 36.3
Second Year Undergraduate 179 21.5
Third Year Undergraduate 130 15.6
Fourth Year Undergraduate 144 17.3
Fifth or More Year Undergraduate 31 3.7
Graduate or professional 47 5.6
Race/Ethnicity
White/Caucasian 541 64.9
African American 226 27.1
Hispanic/Latino 18 2.2
Asian/Pacific Islander 8 0.9
American Indian/Alaskan Native/ Native Hawaiian 3 0.4
Other 37 4.4
Living Arrangement
On-Campus Resident 524 62.9
Off-Campus Commuter 309 37.1

9
Figure 2.1
Those students who had played organized sports before were significantly more likely to feel that
they would attend future university football games (p = .003), attend other athletic events (p <
.001), attend future tailgates (p = .002), and buy more university merchandise (p = .018) if the
school began a football team. However, both those who had played organized sports and those
who had not demonstrated positive intentions in regards to all six variables tested.
These same questions were also broken down between those students who indicated that they
attended Winthrop sporting events (or have in the past) and those who have not supported
Winthrop athletics. These results are shown in Figure 2.2.
Figure 2.2
00.5
11.5
22.5
33.5
44.5
Likely to
Attend
Football
Likely to
Attend Other
Likely Stay
Weekends
Likely Join
Fan Club
Likely Attend
Tailgates
Likely
Purchase
Merchandise
Comparing Past Sport Participation to Future Intentions
Have Not Played Organized Sport Have Played Organized Sport
0
0.5
1
1.5
2
2.5
3
3.5
4
4.5
Likely to
Attend Football
Likely to
Attend Other
Likely Stay
Weekends
Likely Join Fan
Club
Likely Attend
Tailgates
Likely
Purchase
Merchandise
Comparing Past Attendance to Future Intentions
Have Not Attended in Past Have Attended in Past

10
Not surprisingly, the results suggested that those who had attended past events are more likely to
attend future university football and other athletic events, to stay over the weekend, to join the
school’s athletic fan club, to attend pre-game tailgates, and to purchase university merchandise
than those who have not attended past events (p<.001). However, it is worth noting that even
students who have never attended Winthrop athletic events still had positive responses to these
questions, with answers with means greater than 3.0 in all cases. A total of 243 of the 833
respondents indicated that they had never attended a Winthrop sporting event, so there were a
significant number of students who are not currently attending events.3
It is important to note that regardless of how the data were separated, the groups all had positive
responses (on average) to the questions regarding the potential of starting a football team at
Winthrop. Figure 2.3 shows a summary of aggregate responses, and clearly shows a positive
level of support from Winthrop students.
Figure 2.3
Overall, our results show that students at this university would be willing to support the addition
of a football program, through attendance at games, purchasing of merchandise, and support of
other athletic teams. However, supporting the program with attendance and merchandise is only
part of the necessary support from students. When asked about funding a Winthrop football
program, they were less enthusiastic. Exactly 50 percent of students said that they were willing
3 Additional charts showing the data divided by gender, upper/lower classmen, and athletes/non-athletes are included in the appendix.
0.0% 10.0% 20.0% 30.0% 40.0% 50.0% 60.0% 70.0% 80.0% 90.0%
Would Attend Football Games
Would Attend 5+ Games a Year
Would Attend Other Athletic Events
Would Stay Weekends to Attend
Would Join Fan Club
Would Attend Tailgates
Would Purchase More Merchandise
Overall Support Levels for Football
No Yes

11
to pay a student fee to support the addition of football. The other 50 percent were not willing to
fund the program (even partially) via student fees. Figure 2.4 shows the amount that students are
willing to pay annually in fees to support a football program.
Figure 2.4
Figure 2.4 shows that 50 percent of students are unwillingly to pay any increased fees for
football, although 78.5 percent of surveyed students indicated that they would likely attend
Winthrop football games if a program was in place. Of those students who were willing to pay a
fee, the vast majority, 93.9 percent, are willing to pay less than $100 annually in fees for the
program. Only 6.1 percent of the students surveyed report that they are willing to pay a fee
exceeding $100.
The reality of student athletic fees, especially when adding football, is much different than these
students appear to expect. When The University of Texas at San Antonio decided to add football
in 2007, the maximum athletic fee increased from $120 a semester to $240 a semester, a total
increase of $240 a year.4 When UNC – Charlotte added football, the Board of Trustees increased
the General Student fee by $320 a year to help pay for football and the debt service for the
buildings that were constructed.5 The ability to raise large amounts of money, however, is
heavily tied to the size of the institution. Since UNC – Charlotte is a very large school, they can
4 http://www.utsa.edu/today/2007/09/athleticsfee.cfm 5 http://belkcollege.uncc.edu/unc-charlotte-trustees-approve-financing-plan-football
0.0%
10.0%
20.0%
30.0%
40.0%
50.0%
60.0%
$0 $1 - $25 $26 - $50 $51 - $75 $76 - $100 More than
$100
How much of an increase in the Athletic Fee would you
be willing to pay if Winthrop had a football program?

12
raise around $6 million a year solely from their full-time enrolled undergraduate students.6 For
Winthrop to raise this same amount of money in a fee for full-time undergraduates, the fee would
have to be a $1,374 a year. A Google search resulted in dozens of articles about schools
increasing student fees, generally by more than $100 to cover the increased cost of athletics.
However, no observed schools increased fees by more than $1,000 a year. Full-time Winthrop
students currently pay an athletic fee as a part of their $1,520 Student Activity Fee. This amount
is significantly higher than most other public universities in South Carolina, with the exception
of The Citadel, the College of Charleston and South Carolina State University. Based on the
current high level of Winthrop fees, and the students’ survey responses, it seems unrealistic to
expect to fund a significant amount of football expenses via student fees. This issue deserves
more attention, and will be discussed further in the Cost section of this report.
Community Survey – High School Football Fans
In 2013, The Sporting News labeled Rock Hill “Football City USA”.7 At the time the article was
published, Rock Hill had 21 former high school football players playing in the NFL. This was
the highest per capita number in the United States. In addition, there were also 24 former Rock
Hill high school athletes playing under scholarship in college football programs. The city of
Rock Hill has long been heralded for its high quality high school football, where a typical Friday
night in the fall sees thousands of local residents gathered together to watch 14-18 year olds play
football. Since much attention is paid to this loyal group of football players and fans, it was
decided to survey these stakeholders to see if they were interested in the addition of football at
Winthrop. In order to conduct the surveys, permission was granted from the Rock Hill School
District to survey fans at two high school football games on October 30, 2015. The first game
was Rock Hill High School vs. Northwestern High School at District 3 Stadium. The second
game was South Pointe High School vs. Clinton High School at South Pointe’s home stadium.
This survey involved local residents (94.3 percent of respondents live in York County) who
attended the games. Surveys were conducted by Winthrop faculty and students inside the
stadium gates. A paper survey was available, as well as an online survey that people could
access on a computer or mobile device. The online survey was administered using the Qualtrics
(2013) online survey program, and took subjects 5 to 10 minutes to complete. A total of 406
surveys were completed. A full list of survey respondent demographics is included in the
appendix.
6 In reality, they earn more than this since part-time students and graduate students pay a partial fee as well.
However, since these students are not observed and their fee payments are unknown, only full-time students are
considered. 7 http://www.sportingnews.com/ncaa-football-news/4544812-football-city-usa-few-places-can-match-rock-hills-
success

13
Since the surveys were administered to individuals who had chosen to attend a high school
football game, results need to be generalized cautiously. They would primarily apply only to the
football-loving populations in the area.
Not surprisingly, respondents indicated that they frequently attend high school football games.
They were also very positive about the potential for adding football at Winthrop. The faculty
and students who conducted the surveys all commented on the overwhelming positive responsive
received at the high school football stadiums. Figure 2.5 shows some of the responses to the
survey questions. These questions were answered on a Likert scale, ranging from Strongly
Disagree (1) to Strongly Agree (5). Any value over 3 indicates that the response is generally
positive. Respondents indicated that they had strong interest in attending home games, and 45
percent even stated that they would be likely to attend out of town Winthrop football games.
They indicated that they would show their support by buying Winthrop merchandise and believe
their attachment to the university would increase with a football program. Respondents are happy
to have Winthrop as a part of their community, feel attached to Rock Hill and the university, and
believe Winthrop plays an important role in the community.
Figure 2.5
Respondents were also asked how much they would be willing to pay to attend a Winthrop
football game. The average response was $22.06, with 35.9 percent of respondents indicating
that they would be willing to pay $25 or more per game.
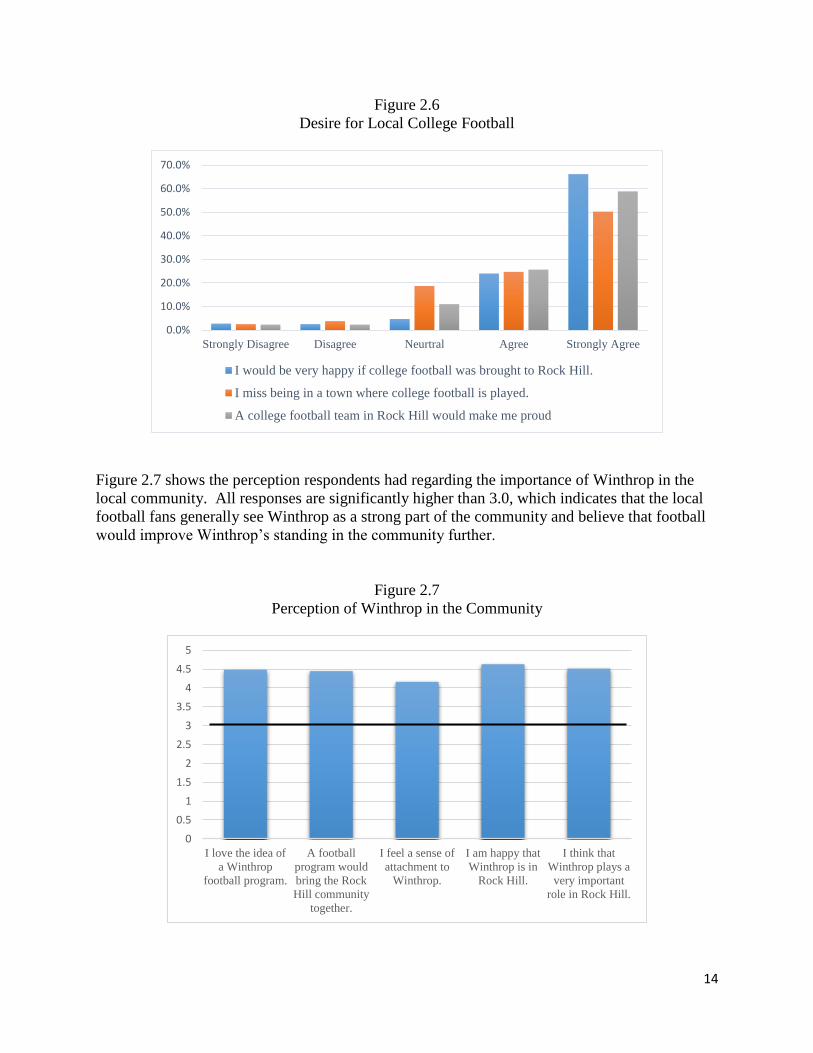
Figure 2.6 presents the answers to some additional questions, indicating support for college
football in Rock Hill. It is clear that the respondents were strongly in favor of having a local
college football team.
0
1
2
3
4
5
Attend Home Games Attend Out-of-TownGames
Buy WinthropMerchandise
Increased Attachmentto Winthrop
If Winthrop adds football, how would you support the
program?
14
Figure 2.6
Desire for Local College Football
Figure 2.7 shows the perception respondents had regarding the importance of Winthrop in the
local community. All responses are significantly higher than 3.0, which indicates that the local
football fans generally see Winthrop as a strong part of the community and believe that football
would improve Winthrop’s standing in the community further.
Figure 2.7
Perception of Winthrop in the Community
0.0%
10.0%
20.0%
30.0%
40.0%
50.0%
60.0%
70.0%
Strongly Disagree Disagree Neurtral Agree Strongly Agree
I would be very happy if college football was brought to Rock Hill.
I miss being in a town where college football is played.
A college football team in Rock Hill would make me proud
0
0.5
1
1.5
2
2.5
3
3.5
4
4.5
5
I love the idea of
a Winthrop
football program.
A football
program would
bring the Rock
Hill community
together.
I feel a sense of
attachment to
Winthrop.
I am happy that
Winthrop is in
Rock Hill.
I think that
Winthrop plays a
very important
role in Rock Hill.

15
It is safe to say that local high school football fans are enthusiastic about the potential of
Winthrop football and would support it via attendance at games. If a program were initiated at
Winthrop, it would be crucial to actively include those in the community who didn’t attend
Winthrop but have a very strong commitment to Rock Hill and to locally produced football.
Winthrop Faculty and Staff Survey
An online survey in Qualtrics was designed and administered in early February 2016 after
obtaining IRB clearance. The link was emailed out to 1459 faculty and staff (all listed members
of the “faculty-staff” email list as of early February). A total of 575 completed surveys were
received, giving us an overall response rate of 39.41 percent. Out of these, 502 surveys were
fully completed. A reminder email was sent out roughly a week after the initial email. The
survey was short, with 24 questions including some dealing with respondents’ demographics.8
Forty-seven percent of survey respondents identified themselves as ‘staff’ members while 53
percent identified themselves as ‘faculty’. Of the faculty that responded, 20 percent were
Assistant Professors, 25 percent were Associate Professors and 29 percent were Full Professors.
Remaining faculty respondents were instructors or adjunct faculty members. In addition, 44
percent of the faculty respondents were members of the College of Arts and Sciences faculty, 19
percent were faculty members in the College of Visual and Performing Arts, 14 percent were
faculty members in the College of Business, and 18 percent were faculty in the College of
Education. The remaining faculty work in the Dacus Library and University College. Fifty-nine
percent of all respondents to the faculty-staff survey were female.
Descriptive findings show many faculty and staff (42 percent) believe adding a football program
at Winthrop is not a good idea. However, if certain conditions are met, one third of faculty and
staff (33 percent) feel it could be a good idea. When asked what conditions needed to be met, the
majority of respondents cited the need to obtain new funding for the program and/or the need to
maintain academic standards. Other faculty and staff mentioned that they would not like to see
changes to other athletic programs and that they would support a program if a well designed plan
was followed. Faculty and staff who did not believe starting football was a good idea most often
cited the increase in costs, the low likelihood of net positive revenue, and the lack of a supportive
culture for football on campus. Many faculty and staff did support the idea of football, and those
in support most frequently cited a probable increase in enrollment, increased visibility, increased
revenue and an increase in school spirit as their primary reasons for supporting the idea of
Winthrop football.
8 Full survey results are included in the appendix.

16
Faculty and staff cautiously agree that a football program would have a positive impact on
enrollment (mean=3.43), their own involvement (mean=3.17), student involvement (mean=3.52),
local community support (mean=3.75), and student pride in Winthrop (mean=3.51). Overall,
they believe it will not have an impact on retention (mean=2.86), will not create security issues
(mean=2.76), will not impact our culture negatively (mean=3.15), and will not bring down our
education standards (mean=2.77). However, considering other issues facing the university,
football is perceived by many to be relatively unimportant (mean=2.46). When asked how much
it should cost the university, 70 percent of respondents were not able to give an estimate.
Figure 2.8 presents some of these findings broken down by status as faculty or staff. It is clear
from the chart that staff members were generally more positive than faculty regarding the
addition of football. Recall, as discussed earlier in the report, any value greater than 3.0 shows a
generally positive response regarding the impact football would have on each category. While all
staff averages are above 3.0, in two cases faculty members had a negative response, on average.
Faculty, overall, did not believe that adding football would improve student retention or the
campus culture. They did, however, believe that it would increase enrollment, community
support, donations, student involvement, and student pride. Statistical analysis showed that staff
responses were significantly more positive than faculty responses (p<0.05). Gender differences
in responses to the questions were not significant.
Figure 2.8
0
0.5
1
1.5
2
2.5
3
3.5
4
4.5
Enrollment Student
Retention
Campus
Culture
Your Own
Involvement
Student
Involvement
Student Pride Community
Support
Donations and
Sponsorships
Do you think that adding football at Winthrop will improve....
Faculty Staff

17
The length of tenure of the faculty-staff respondent also affected one’s perception of the
importance of adding football. Recent hires (less than 1 year had a mean=3.37 and 1 -5 years had
a mean=2.62) perceive football to be of greater importance than older hires (more than 20 years
had a mean = 2.07). The rating of the importance of a football program declines progressively
with length of tenure, with the oldest hires (more than 20 years) believing football to be
significantly less important than all others (p=0.00). This is further supported by the finding that
recent hires think a football program is a good idea, whereas older hires think it is not a good
idea (p=0.00).
It is interesting to note that a person’s perception of whether football is a good idea or not is
related to that person’s involvement. Testing reveals that those who believe it is not a good idea
felt it would negatively impact their involvement with the university. However, those who
believed it could be a good idea if certain conditions are met, were inclined to believe that their
involvement would not be affected or could be improved (p=0.00).
Winthrop Alumni Survey
An online survey in Qualtrics was designed and administered in mid-February 2016 after
obtaining IRB clearance. According to the Alumni Office, a total of 20,790 invitations to
participate were sent out. A total of 2,898 responses were received. This is a response rate of
13.93 percent. This was a relatively short survey with 26 questions, including respondent
demographics.9
A large number of respondents were recent graduates, with 15.5 percent of them graduating since
2010 and the majority graduating sometime between 2000 and 2015. Respondents were mainly
females (63.6 percent) and Caucasian (76.4 percent). The College of Arts and Sciences was the
largest college represented (42.8 percent) and the College of Visual and Performing Arts was the
smallest (7.4 percent). Results show that 26.4 percent of respondents live in York County. An
additional 12.5 percent live in the greater Charlotte area. This is important, as many of these
respondents live close enough to be active participants in the program if they support the
addition of football and it is indeed added at Winthrop.
Most alumni supported the idea of adding football, with 54 percent saying it was a good idea,
and another 25 percent saying it would be a good idea if certain conditions were met. Those that
liked the idea of a Winthrop football program most frequently referenced that they believe that a
football program would increase University revenue as their main reason for support. They also
frequently responded that alumni and community involvement would increase, that they believed
9 Full survey results can be found in the appendix.
18
that a Winthrop football program would increase enrollment, and that a football program would
improve retention and the ‘college town’ atmosphere.
Those that said they would support a football program if certain conditions were met, most
frequently mentioned that adding football could work if appropriate funds were raised. They also
frequently mentioned concerns over the maintenance of academic standards, the need to add
additional facilities and staff, and the concern over other university sports being under-supported
or eliminated.
Twenty-one percent of alumni stated that they were not currently in favor of adding football at
Winthrop University under any circumstance. These alumni gave a wide range of reasons for
their lack of support, but the most frequent reasons included the fact that it is very expensive and
that they thought it would reduce the quality of academics at Winthrop. Other common
responses included that it would negatively change Winthrop’s culture, that academic programs
should be better funded, safety concerns (mainly related to concussions), and that Winthrop is
unique in that they don’t have a football team.
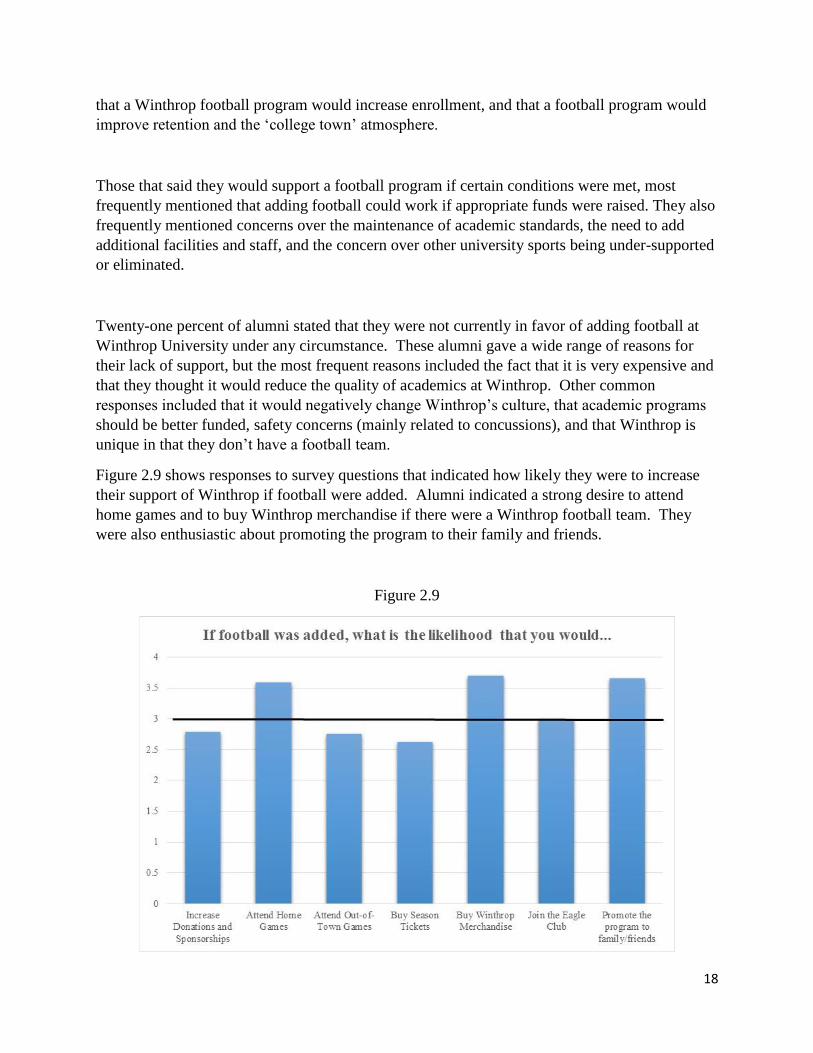
Figure 2.9 shows responses to survey questions that indicated how likely they were to increase
their support of Winthrop if football were added. Alumni indicated a strong desire to attend
home games and to buy Winthrop merchandise if there were a Winthrop football team. They
were also enthusiastic about promoting the program to their family and friends.
Figure 2.9

19
Figure 2.9 also indicates some weak spots when it comes to alumni support. There was an
average response below 3.0 for the possibility of attending out-of-town games and buying season
tickets. They also did not show strong support for increasing their donations and sponsorships of
Winthrop events if football were added. Lastly, alumni were willing to pay between $15 to $50
per home game, with the mode being $20 and the mean being $25.85 per ticket.
The likelihood of support for various activities was combined into one variable (Support) which
was regressed against whether respondents thought football was a good idea. The relationship is
significant (p=0.00) suggesting that those that thought football is a good idea would support the
program in various ways like attending games, buying merchandise, promoting it among friends,
etc. Similarly, those that supported the idea of a program were also willing to pay more for a
game ticket. The relationship is positive and significant (p=0.00).
Survey Summary
From the four constituencies, area residents, students and alumni are inclined to be more
enthusiastic about the idea of Winthrop football than faculty/staff. Those three groups would
support the initiative in various ways. Faculty and staff are more circumspect about expressing
their enthusiasm, with most suggesting it is not a good idea although it would have some
beneficial effects.
It is difficult to know how to interpret some of these results given the inherent bias. The
community members surveyed at the football stadiums have obvious biases, as they are clearly
football fans and may even have children (or other family members or friends) that have an
interest in playing college football. Students who currently attend Winthrop chose to apply to
and attend a university that does not have a football team. It is not surprising, therefore, that they
may be less enthusiastic than alumni, whose favored activities have likely evolved since
graduation. Similarly, faculty members are not typically the most enthusiastic college football
supporters in a community. They have deep interests in their fields of study as academics, and
they are often involved in activities related to those interests during their off-campus time. In
addition, given recent budgetary concerns at Winthrop faculty/staff seem concerned that the
addition of more athletic opportunities will further delay potential pay increases. While it is
certainly very important to listen to all Winthrop stakeholders, the biases should be recognized
and put into context closely.
Table 2.2 compares alumni and faculty-staff responses on common questions. On every question,
the alumni exhibit a more favorable attitude to football, greater involvement, more favorable
perceptions of the effects on enrollment, retention, culture, etc. In sum, more alumni believe the
football program is a good idea and that it would be good for the university.

20
Table 2.2
Comparison of Faculty/Staff and Alumni Responses
A very important question was asked on both the faculty/staff and alumni surveys that deserves a
bit more discussion. The question asked respondents, “Considering other current priorities of the
university, how do you view the importance of adding additional sports, including football?”
This question was intended to measure how important these stakeholder groups believe the
addition of football to be, given the financial realities of the university. In response to this
question, alumni had an average positive response (mean=3.23), indicating that they think
football is important. Faculty and staff had an average negative response (mean=2.46). Figure
2.10 shows the specific responses, broken down by faculty/staff and alumni. A very significant
difference can be observed. While 54 percent of faculty and staff indicated that, given other
priorities, adding a football team is “Unimportant” or “Very Unimportant”, 51 percent of alumni
responded that it was “Important” or “Very Important”.
Question Faculty and Staff Alumni
N 575 2,898
Is the football proogram a good idea No: 42% No: 21%
Yes: 25% Yes: 54%
Conditional Yes: 33% Conditional Yes: 25%
Mean Mean
Impact their involvement 3.17 3.70
Increase student enrollment 3.43 3.90
Increase student retention 2.86 3.51
Change university culture (for the better) 3.15 3.65
Cultivate greater student pride 3.51 4.04
Increase student involvement 3.52 4.06
Attract local and community support 3.75 4.25
Attract private donations and sposorships 3.23 3.89
Bring down education standards 2.77 2.31
Adverse impact on campus security and safety 2.76 2.51
Importance of football given other priorities 2.46 3.23

21
Figure 2.10
0%
5%
10%
15%
20%
25%
30%
35%
40%
Very
Unimportant
Unimportant Neutral Important Very Important
What is the importance of adding additional sports, including
football, considering other priorities?
Faculty/Staff Alumni

22
3. Geographic Information System Analysis
Maps and ESRI Business Analyst Data Related to Football
Introduction/Background
Geographic Information System (GIS) analysis can be used to investigate the interest and
activity surrounding football in the geographic area surrounding Winthrop University. Business
Analyst data from Environmental System Research Institute (ESRI) comes from GfK MRI’s
Survey of the American Consumer® which is the country’s largest and most current consumer
database. Three data points are provided for each product or service area: expected number of
users, the percentage of users, and the Market Potential Index (MPI).
The Expected Number is the estimated number of adults or households that use a
particular product or service.
The Penetration Percent is a measure of the percentage of adults or households that use a
particular product or service compared to the Total Households or Total Adults in the
geography.
The Market Potential Index measures the likelihood of adults or households in a specified
area to exhibit certain consumer behavior compared to the U.S. national average. The
index is tabulated to represent a value of 100 as the overall demand for the base area. A
value of more than 100 represents high demand; a value of less than 100 represents low
demand. For example, an index of 120 implies that demand in the trade area is likely to
be 20 percent higher than the U.S. national average; an index of 85 implies demand is 15
percent lower than the national average.
Based on the results from the GfK MRI’s Survey of the American Consumer®, data and maps
were produced looking at the current behavior of people living in the area surrounding Winthrop
University in relationship to football events. Each map has the location of Winthrop University
as its origin and looks at three drive time areas around the campus (30 minutes, 60 minutes and
120 minutes). These market areas were chosen based on the idea that it is reasonable to believe
that people within a two hour drive time might participate in a football program at Winthrop. All
data are separated into the three drive times so that variations can be seen.

23
The following map shows the counties located in the 30, 60 and 120 minute drive time market
areas.
Within the available data, there are 11 questions asked that are related to football. It is important
to note that questions were not asked about the frequency of attendance or viewership. Residents
Figure 3.1: Counties within the 30-60-120 minute drive times

24
were only asked if they participated in, attended, listened to, or watched football in the last 12
months. One cannot interpret the data to indicate intensity such as high attendance rates, but
rather that someone attended or participated in the event at least once.
The 11 questions ask on the survey about football were:
Did you participate in football in last 12 months?
Did you attend sports events: football game (college)?
Did you attend sports events: football game-NFL Mon/Thurs?
Did you attend sports events: football game - NFL weekend?
Did you listen to football (NFL Mon/Thurs) on radio often?
Did you listen to football (NFL weekend games) on radio often?
Did you listen to football (college) on radio often?
Did you watch on TV: football (college)?
Did you watch on TV: football (NFL Mon/Thurs night games)?
Did you watch on TV: football (NFL weekend games)?
Did you watch on TV: football (NFL playoffs/Super Bowl)?
Results from 30-60-120 Minute Drive-Time Rings
Data in Table 3.1 show the results from residents living inside each of the three 30-60-120
minute drive-time rings on the 11 questions on football. Keep in mind that while numbers and
percentages are interesting, the index shows a comparison of the local region with the US
national average. Therefore, the index allows one to see where the local community ranks in
relationship to national standings. Any index level above 100 indicates that interest or
participation in football, depending of the question, is above the national average, while an index
level below 100 indicates interest or participation below the national average.
Table 3.1 presents both a demographic summary of the drive time areas as well as a summary of
the answers to the questions related to football. All data are from the 2015 survey.
Demographic data are presented as of 2015, and are also estimated for 2020. This is important to
note, as our geographic area is in a period of significant growth and median household income
continues to rise in the area.

25
Table 3.1
The data presented in Table 3.1 indicate that TV is the most preferred way to enjoy football. All
four categories have the highest percentage of viewership (28.5% - 39.1%). In addition,
residents in Winthrop’s drive-time area all watch football on TV at rates greater than the U.S.
average, with indices ranging from 101 to 108. While the percentage of people actually
attending a football game is lower, ranging from 5.9 percent to 6.5 percent, the indices are higher
with values ranging from 105 to 116. The indices tend to be higher in the 30-minute drive-time
ring (116) and lower (105) in the 120-minute drive-time ring as you move away from the
university. Listenership of college football games tends to have lower percentages (2.5 percent
across the rings), but higher indices (113-117). This indicates that although the percentages may
not be high, overall attendance and listenership of football games are both higher than the U.S.
national average. The percentage participation in football in the last 12 months also tends to be
low (around 5 percent), but again indices for participation are higher with values ranging from
102 to 107.
It is clear from the data shown in Table 3.1 that residents in Winthrop’s drive-time area are more
interested and involved in football, at both the college, NFL and participation level, than average
Americans.
Demographic Summary 2015 2020 2015 2020 2015 2020
Population 444,957 491,262 2,113,242 2,297,431 6,309,361 6,629,986
Population 18+ 334,757 370,062 1,593,915 1,741,726 4,850,896 5,117,091
Households 174,207 192,595 811,245 882,446 2,453,858 2,580,808
Median Household Income $54,874 $60,897 $53,822 $60,283 $46,775 $53,551
Product/Consumer Behavior
Number of
Adults 18+ Percent MPI
Number
of Adults
18+ Percent MPI
Number
of Adults
18+ Percent MPI
Participated in football in last 12 months 17,924 5.4% 107 85,459 5.40% 107 247,998 5.10% 102
Attend sports events: football game (college) 21,920 6.50% 116 103,160 6.50% 115 286,227 5.90% 105
Attend sports events: football game-NFL Mon/Thurs 8,586 2.60% 99 41,523 2.60% 101 108,708 2.20% 87
Attend sports events: football game - NFL weekend 16,319 4.90% 105 78,734 4.90% 106 202,220 4.20% 90
Listen to football (NFL Mon/Thurs) on radio often 6,716 2.00% 105 30,408 1.90% 99 90,386 1.90% 97
Listen to football (NFL wknd games) on radio often 7,486 2.20% 101 35,306 2.20% 100 102,808 2.10% 96
Listen to football (college) on radio often 8,482 2.50% 117 39,176 2.50% 113 122,052 2.50% 116
Watch on TV: football (college) 95,488 28.50% 108 455,289 28.60% 108 1,381,454 28.50% 108
Watch on TV: football (NFL Mon/Thurs night games) 120,562 36.00% 105 569,653 35.70% 105 1,678,675 34.60% 101
Watch on TV: football (NFL weekend games) 127,702 38.10% 105 604,043 37.90% 105 1,784,611 36.80% 101
Watch on TV: football (NFL playoffs/Super Bowl) 130,756 39.10% 105 619,345 38.90% 104 1,838,987 37.90% 102
Drive Time: 30 minutes Drive Time: 60 minutes Drive Time: 120 minutes
Current Football Behavior 30-60-120 Minute Drive Times from Winthrop UniversityBased on ESRI Business Analyst Data for 2015

26
Results of Map Data by County
Four maps were developed looking at the 30-60-120 minute drive-time rings by county.10 The
first map, Figure 3.2, examines the “Watch College Football on TV” question and indicates that
viewership in almost all counties in the 120-minute drive-time ring around Winthrop University
is at or above the U.S. national average. The indices range from 88 to 129. York County has an
index of 112 meaning that residents are 12 percent more likely than the US national average to
watch football on TV. Richland County (the University of South Carolina) has an index of 105
and Laurens County (Clemson University) has an index of 104.
Figure 3.2
10 In the report appendix, there is a table with the data, percentages, and indices for each included county that is fully
or partially inside the 120 minute drive-time ring. This is true for each of the GIS maps presented.

27
Figure 3.3, which focuses on “Attend College Football”, shows pockets of college football
attendance in larger metropolitan areas and college towns with indices larger than the U.S.
average. Indices range from 71-152. York County has an index of 114 meaning that its
residents are 14 percent more likely than the US national average to attend football games.
Mecklenburg County (119), Union County NC (132) and Richland County (112) are a few of the
counties with indices over the US national average. Laurens County, where Clemson is located,
has an index of 84. It is interesting to note that York County residents are more likely to attend
college football games than residents in the counties where both USC and Clemson are located.
Figure 3.3

28
Figure 3.4, which shows the indices related to “Attend NFL Football Games – Weekends,”
shows overall lower attendance by residents than the U.S. average. Indices range from 46 to
137. York County has an index of 97 indicating that attendance at NFL weekend games is 3
percent below the US national average. Mecklenburg (119), Union, NC (116) and Cabarrus
(110) counties are the only three counties in our study area that exceeded the U.S. national
average. This isn’t surprising given their proximity to Charlotte and the Carolina Panthers.
Figure 3.4

29
The final map on “Participates in Football in the Last 12 Months,” Figure 3.5, looks at resident
participation in the sport of football. The indices range from 73 to 136. York County has an
index of 106 meaning that York County resident are 6 percent more like than the US national
average to participate in football. Mecklenburg County has an index of 111 indicating its
residents are 11 percent more likely to participate in football. Richland County has an index of
109 and Laurens County has an index of 92.
Figure 3.5

30
The GIS analysis supports the assertion that Winthrop is located in an area where demand for
football-related entertainment, both on television as well as in-person attendance, is strong. Most
of the counties surrounding Winthrop, and York County, have football participation and interest
levels above U.S. national averages. Interestingly, people in York County actually attend college
football games at rates equal to, or higher than, the counties directly surrounding USC and
Clemson.

31
4. Statistical Analysis
Cohort Analysis
The community, students, alumni and faculty/staff believe that adding a football program will
increase both enrollment and student involvement. The question remains as to whether or not
this is a realistic expectation at Winthrop. It is clear that adding a football program will be
expensive and will require significant yearly expenses for operation. Both costs and benefits will
be fully addressed later in this report. However, the cost of the program could potentially be
made up by increasing the tuition and fee revenues received by the university via increased
enrollment.
In order to examine this possibility, two cohorts of universities were created. The “Football
Cohort” includes 10 universities, mostly in the Southeast region, who added football between
2003 and 2013. All data included in the analyses in this section were pulled from the Integrated
Postsecondary Education Data System (IPEDS), collected and maintained by the U.S.
Department of Education.
Table 4.1
Football Cohort
There have not been a large number of new Division 1 football programs added since 2003.
Most Division I schools already have football teams in place. The large majority of new
programs are at schools that compete in Division II, Division IIII or NAIA. Since 2008, only 22
percent of all new football programs were Division I, which amounts to 12 new programs. Two
of these programs were started in 2015, so data on them are not yet available.11 This Football
Cohort includes all Division I schools that added football during the years in question, 2003 -
2014. Although some of these universities are quite large compared to Winthrop, they are
similar to Winthrop by having Division I athletics and a long sports history without football.
11 Kennesaw State University in Georgia and East Tennessee State University have programs that began in 2015.
School Location Public/Private
2014 Full-Time
Undergrad Enrollment
Year Football
was Added Current Athletic Conference
Campbell University Buies Creek, Noth Carolina Private 3,449 2008 Big South (Pioneer Football League)
Coastal Carolina University Conway, South Carolina Public 8,502 2003 Sun Belt
Georgia State University Atlanta, Georgia Public 18,982 2010 Sun Belt
Lamar University Beaumont, Texas Public 6,460 2010 Southland
Mercer University Macon, Georgia Private 3,833 2013 Southern
Old Dominion University Norfolk, Virginia Public 15,261 2009 Conference USA
Stetson University DeLand, Florida Private 2,804 2013 Atlantic Sun (Pioneer Football League)
University of North Carolina - Charlotte Charlotte, North Carolina Public 18,983 2013 Conference USA
University of South Alabama Mobile, Alabama Public 9,090 2010 Sun Belt
University of Texas - San Antonio San Antonio, Texas Public 20,248 2011 Conference USA

32
A “Non-Football Cohort” was also created. This group contains 13 schools, including Winthrop
University. This cohort includes all of the Division I schools in the states represented in the
Football Cohort that do not currently have a football team. 12 These states include Georgia,
Florida, North Carolina, South Carolina and Texas. The Non-Football Cohort includes 13
Division I schools, across the 6 states, that did not have a football program at any time between
2001 and 2014.
Table 4.2
Non-Football Cohort
Multiple analyses were conducted using these cohorts.13 This was done to see if there were
differentiated patterns between schools which added football and those that did not. First, the
growth in freshman applications was measured between 2001 and 2014. Those dates were
chosen based on data availability and the time period over which the schools added football.
Figure 4.1 shows the growth in total applicants, as well and female and male applicants over the
time period analyzed.
12 There are two other schools that do not currently have football teams that were not included in the analysis.
Florida Gulf Coast University does not have a team, but they did not transition to Division I until 2011, so they were
not included. Additionally, Texas A&M – Corpus Christi does not have a football team, but they had two years of
incomplete data in the IPEDS data system. Therefore, they could not be included. 13 A summary of data used in the analysis are included in the appendix.
School Location Public/Private
2014 Full-Time
Undergrad Enrollment
Current Athletic
Conference
College of Charleston Charleston, South Carolina Public 9,608 Colonial
George Mason University Fairfax, Virginia Public 17,818 Atlantic 10
Longwood University Farmville, Virginia Public 4,183 Big South
Radford University Radford, Virginia Public 8,507 Big South
High Point University High Point, North Carolina Private 4,165 Big South
University of North Florida Jacksonville, Florida Public 9,901 Atlantic Sun
University of North Carolina - Asheville Asheville, North Carolina Public 3,183 Big South
University of North Carolina - Greensboro Greensboro, North Carolina Public 12,773 Southern
University of North Carolina - Wilmington Wilmington, North Carolina Public 11,690 Colonial
University of Teaxas - Arlington Arlington, Texas Public 15,957 Sun Belt
University of South Carolina - Upstate Spartanburg, South Carolina Public 4,218 Atlantic Sun
Virginia Commonwealth University Richmond, Virginia Public 20,056 Atlantic 10
Winthrop University Rock Hill, South Carolina Public 4,421 Big South

33
Figure 4.1
Between 2001 and 2014, Winthrop saw a 50.58 percent growth in applications, from 3,019 in
2001 to 4,546 in 2014. Winthrop’s application peak was in 2007, with a total of 5,328
applications. On average, the Non-Football Cohort saw application growth of 106.42 percent
between 2001 and 2014. Application growth in the Non-Football Cohort ranged from 28.50
percent (Radford University) to 391.7 percent (High Point University). Four of the 13
universities in the Non-Football Cohort saw application growth of greater than 100 percent.
The Football Cohort saw larger application growth, with an average of 179.29 percent growth
over this fourteen-year period. Seven of the 10 schools saw applicant growth of greater than 100
percent between 2001 and 2014. Some of the universities saw staggering growth in the number
of applications. For example, Coastal Carolina saw growth of 484.25 percent and Stetson
University saw growth of 466.29 percent! Coastal Carolina is an especially interesting case, as
they have competed with Winthrop in the Big South Conference and compete for many of the
same South Carolina students. In 2001, Coastal Carolina had 2,533 applicants to their
undergraduate program, 486 fewer than Winthrop. In 2014, they had an incredible 14,799
applicants, 10,253 more applicants than Winthrop. There are other differentiating factors
between the two schools, including Coastal Carolina’s proximity to the beach, but this is an
increase that should be closely examined. Given the College of Charleston’s application growth
of only 33.8 percent and UNC-Wilmington’s growth of 54.3 percent, it is clear that proximity to
the beach can’t explain the entire picture.
Similar patterns are seen when the applicants are broken down by gender. This was done to see
if the effect of football on applications is different between men and women. The Football
0.00%
20.00%
40.00%
60.00%
80.00%
100.00%
120.00%
140.00%
160.00%
180.00%
200.00%
Total Applications Male Applications Female Applications
Application Growth Between 2001 and 2014
Football Program No Football Program Winthrop University

34
Cohort saw higher average applicant growth for both men and women, but the gap between
application growth was greater between Non-Football and Football universities when
considering male applicants. These data are shown in the previous chart, but the exact
breakdown of numbers is also shown in Table 4.3.
Table 4.3
In the Football Cohort, 7 of the 10 schools saw male application growth of greater than 100
percent between 2001 and 2014. All schools in the Football Cohort saw male applicant growth of
greater than 50 percent. Only 4 of the 13 schools in the Non-Football Cohort saw male applicant
growth of greater than 100 percent (George Mason, High Point, Texas-Arlington and USC-
Upstate). In addition, 4 schools in the Non-Football Cohort had male applicant growth below 50
percent. Winthrop saw a growth of 59.2 percent in male applications, which ranks 8th among the
23 total schools in the analysis.
Schools that added football also saw higher female application growth than the Non-Football
Cohort, 183.94 percent compared to 113.68 percent. However, the gap is a bit smaller than that
of male applicants. Five of 10 schools in the Football Cohort saw female application growth
greater than 100 percent, while 4 of 13 of the Non-Football Cohort saw female application
growth greater than 100 percent. While additional statistical analysis is needed, it appears from
these basic numbers that adding football has a bigger impact on the number of male applicants
than it does on the number of female applicants. This is not surprising since football is a male
sport.
While all schools certainly seek to increase their number of applications each year, an increase in
applications does not necessarily result in an increase in enrollment. Further analysis was also
conducted to examine freshman enrollment growth over the same time period for both cohorts.
Figure 4.2 shows these results.
Total Applications Male Applications Female Applications
Football Program 179.29% 174.06% 183.94%
No Football Program 106.42% 94.85% 113.68%
Winthrop University 50.58% 59.20% 47.18%

35
Figure 4.2
A similar pattern appears with regard to enrollment data. Universities that added a football
program during the period of analysis had higher overall freshman enrollment growth than those
that did not, with average rates of 62.82 percent and 40.04 percent respectively. The gap
between freshmen enrollment growth was slightly larger when comparing male enrollment to
female enrollment. Schools in the Football Cohort saw average male freshman enrollment
growth of 66.77 percent and female freshman enrollment growth of 60.65 percent. The Non-
Football Cohort saw male freshman enrollment growth of 43.14 percent on average and female
freshman enrollment growth of 38.72 percent over the same time period.
The most significant freshman enrollment growth rates were seen at High Point (217.16 percent),
Coastal Carolina (199.87 percent), University of Texas – San Antonio (95.55 percent), and Old
Dominion University (92.10 percent). Three of these four schools added football during the
period analyzed. Winthrop ranked near the bottom of the Non-Football Cohort with total
freshman enrollment growth of 12.35 percent between 2001 and 2014. This growth ranks 18th
out of the 23 included schools, and 10th out of the 13 schools in the Non-Football Cohort.
Winthrop’s male freshman enrollment grew at a rate of 10.73 percent, while its female freshman
enrollment grew 13.00 percent.
In addition to examine application and freshman enrollment growth, it is also important to
consider what impact football may have on total enrollment. For the purpose of this analysis,
total undergraduate full-time enrollment was considered. Figure 4.3 presents the growth in total
full-time undergraduate enrollment between 2001 and 2014.
0.00%
10.00%
20.00%
30.00%
40.00%
50.00%
60.00%
70.00%
80.00%
Freshman Enrollment Male Freshman Enrollment Female Freshman Enrollment
Freshman Enrollment Growth Between 2001 and 2014
Football Program No Football Program Winthrop University

36
Figure 4.3
An interesting pattern emerges here. While the gap between the Non-Football and Football
Cohorts are over 20 percentage points when considering freshman enrollment growth, the gap is
is less than 8 percentage points when considering the growth in full-time undergraduate
enrollment. To investigate this further, the change in retention rates was also considered. Data
regarding full-time retention rates at each institution were collected between the years 2004 and
2014.14 The Department of Education defines the full-time retention rate as the percentage of the
full-time students in the fall cohort that re-enroll at the institution as either a full-time or part-
time student the following year. Those who graduated are excluded. Figure 4.4 presents the
growth in retention rate in each cohort, as well as Winthrop University.
Figure 4.4
14 This data was not available in IPEDS for 2001 and 2002, and was only available for some schools in 2003.
0.00%
5.00%
10.00%
15.00%
20.00%
25.00%
30.00%
35.00%
40.00%
45.00%
50.00%
Football Program No Football Program Winthrop University
Full-time Undergraduate Enrollment Growth Between 2001 and 2014
-2.00%
-1.50%
-1.00%
-0.50%
0.00%
0.50%
1.00%
1.50%
2.00%
2.50%
3.00%
Football Program No Football Program Winthrop University
Change in Full-Time Retention Rates Between 2004 and 2014

37
To further analyze the situation, Figure 4.5 presents the average full-time retention rates in each
of the cohorts.
Figure 4.5
From the basic statistical analysis, it appears that having a football team leads to a higher average
application growth as well as higher growth in freshman full-time enrollment. However, schools
in the Football Cohort have lower retention rates than those in the Non-Football Cohort, so the
difference in the growth of total full-time undergraduate enrollment does not appear to differ as
significantly as is seen when only freshman enrollment is analyzed.
It is important to note that Winthrop significantly lags behind schools in both the Football Cohort
and the Non-Football Cohort in application, freshman enrollment, and total enrollment growth.
In each case, Winthrop is not only well below the schools that added football, but it also lags by
a large margin behind those who did not add football. What does this mean about the potential
for growth via a football program at Winthrop? On one hand, one could believe that Winthrop
has a lot of opportunity for growth because growth has been stagnant in recent years. In this
case, Winthrop might see even larger than average applicant and enrollment growth if football
were added. On the other hand, it could also indicate that there are additional factors, external to
this report, which are impeding growth, and without addressing those factors, growth in
enrollment will be low with or without a football team. Additional analysis and thought are
needed to better predict the impact football might have on Winthrop in terms of enrollment.
68.00%
69.00%
70.00%
71.00%
72.00%
73.00%
74.00%
75.00%
76.00%
77.00%
Football Program No Football Program Winthrop University
Average Retention Rates Between 2004 and 2014

38
Regression Analysis
While it is certainly valuable to look at the data presented in the cohort analysis, we can get more
specific, and likely more substantive, results by conducting a regression analysis using additional
collected data. It is important to look further into the causes of the growth in enrollment and
applications. Is football really a significant driver? Instead, could it be tuition costs or laxer
application standards for entering students? Could it also be due to the football subdivision in
which the school plays?15 We can control for these and other factors by conducting regression
analyses, which measure the variation in one variable explained by variations in other variables.
For the following analyses all 23 colleges and universities in the cohort analysis were included
and data were collected for all years from 2001 until 2014. The analyses investigate whether
university characteristics, including football, led to a significant increase in freshman enrollment
and retention rates. In addition, analyses were conducted to see if football had a differentiated
impact on male enrollment as compared to female enrollment. The university characteristics
included in the analyses were driven by the data that were consistently available for all schools in
the IPEDS database. Some variables that would be desirable to collect were either not available,
or were not available for all schools.
In each case, a random effects panel data model was utilized to estimate effects. In short, this
model is used in cases in which we have multiple periods (years) of data for a group of entities
(universities). This model allows us to control for both university specific effects and year fixed
effects. University specific effects control for any characteristics that exist at the university that
are not correlated with the independent variables. For example, in the case of Winthrop, this may
be the desirable location of the school, the small class sizes, the beautiful campus, etc. Similarly,
year fixed effects control for anything that is fixed across universities during a given year. For
example, many schools saw significant financial woes during 2009. This would be controlled
within the 2009 fixed effect and would control for the impact these fiscal issues might have on
enrollment and application growth.
15 There are two football subdivisions in Division I football. The Football Bowl Subdivision (FBS) contains the
largest and most competitive schools in the NCAA. As of 2014, there were 128 schools competing in the FBS.
These programs are ‘bowl eligible’ and include the “Power Five Conferences” in the NCAA. The Football
Championship Subdivision (FCS), formerly known as Division I-AA, contains the remaining Division I
conferences, including the Big South, and determines its national championship in a single-elimination tournament
each year. NCAA rules regarding squad size and scholarship requirements differ between subdivisions, with lesser
requirements applied to FCS programs.

39
The random effects model has the following specification,
ittiitititit xfZFy ˆ1
where yit represents the dependent variable (which varies from model to model) and µ is the
constant. Fit represents whether or not the university has football as a varsity sport that year, and
Ẑit represents a vector of university variables that are available in the IPEDS data portal. These
variables include the racial composition of the university, the 75th percentile math SAT, full time
enrollment, whether the school is a private institution, whether it plays in the FBS subdivision
and the total price for in-state students living on campus. The variables fi and xt represent
university-specific random effects and year fixed effects which are included in all models.
These models are mathematically sophisticated and quite complicated, but the results from the
model are relatively easy to interpret. The statistical software STATA was used to estimate all
models.
The first set of models utilizes the number of freshman, full-time students enrolled as the
dependent variable. Three models were considered: Total Freshman Enrollment, Female
Freshman Enrollment and Male Freshman Enrollment. The same independent variables were
considered in each case. Table 4.4 presents the results of these models.

40
Table 4.4
Regression Model – Freshman Enrollment
The results in Table 4.4 indicate that in the three freshman enrollment models, football is a
significant determinant of total and male freshman enrollment. Results show an average of
101.95 more male full-time freshmen for schools that have football, everything else held
constant.17 Football is not a significant driver for female freshman enrollment. Clearly some of
this additional male enrollment comes from football itself. With a roster size of around 90
players, and natural attrition of some student-athletes via transfers to other schools, injuries or
decisions to no longer play, it is reasonable to expect around 30 new freshman football players
each year. Therefore, this model predicts that schools with football see around 71 additional
male freshman beyond those who actually play on the football team. This report does not
address students involved with a marching band, but some of these additional freshman may
17 For the purpose of this report, only the coefficients related to football will be specifically interpreted and analyzed.
However, the authors are open to addressing additional results in the future if requested to do so.
TOTAL FRESHMAN
ENROLLMENT
FEMALE FRESHMAN
ENROLLMENT
MALE FRESHMAN
ENROLLMENT
FOOTBALL 86.211* -1.687 101.947***
(48.925) (25.841) (21.660)
AFRICAN AMERICAN -7.376** -4.035* -4.590**
(3.671) (2.086) (1.867)
HISPANIC -4.937 -4.001* -2.505
(3.828) (2.175) (1.945)
OTHER RACE -15.239*** -7.507*** -7.830***
(4.156) (2.236) (1.901)
75th_SAT MATH -1.713* -0.989** -0.620
(0.876) (0.473) (0.403)
IN-STATE COST 0.014** 0.011*** -0.620
(0.006) (0.003) (0.403)
FULL-TIME ENROLLMENT 0.199*** 0.100*** 0.100***
(0.010) (0.006) (0.005)
PRIVATE -111.649 -246.929** 159.795
(179.069) (109.120) (110.924)
FBS 106.808 -11.767 120.876
(141.177) (90.745) (96.280)
CONSTANT 1061.781 749.569 295.967
R-Squared 0.950 0.919 0.907
Standard errors shown in parentheses.
*, **, and *** represent significance at the 10%, 5%, and 1% levels respectively.
Year fixed effects are not shown in order to save space, but are included in all calculations presented.

41
come to campus to participate in marching band or some other football-related activity beyond
playing the sport itself. Others may just want to attend a school where football is a part of the
university culture and/or there are games to attend.
It is reasonable to wonder if these significant results are similar across football subdivisions: FBS
and FCS, or if they are limited to the larger football programs that participate in one of the larger
conferences. To address this question, freshman enrollment models were investigated using only
the FCS schools (both with and without football) in the cohorts. FCS was isolated because this is
the division Winthrop would compete in if football were added, as both the Big South and the
Pioneer Football League (non-scholarship) compete in the FCS. Table 4.5 presents those results.
Table 4.5
Regression Model – Freshman Enrollment – FCS
TOTAL FRESHMAN
ENROLLMENT
FEMALE FRESHMAN
ENROLLMENT
MALE FRESHMAN
ENROLLMENT
FOOTBALL 108.446** 32.702 71.215***
(50.894) (32.365) (25.169)
AFRICAN AMERICAN -7.552*** -5.275** -2.303***
(2.750) (2.082) (1.479)
HISPANIC -11.790*** -7.999*** -3.643**
(2.856) (2.155) (1.536)
OTHER RACE -12.610*** -7.043*** -3.997**
(3.184) (2.113) (1.609)
75th_SAT MATH -2.079*** -1.215*** -0.636*
(0.636) (0.435) (0.327)
IN-STATE COST 0.013*** 0.010*** 0.002
(0.005) (0.003) (0.002)
FULL-TIME ENROLLMENT 0.187*** 0.099*** 0.081***
(0.008) (0.007) (0.005)
PRIVATE -139.185 -208.307* 40.881
(122.500) (111.598) (68.380)
CONSTANT 1454.321 951.258 423.364
R-Squared 0.981 0.914 0.947
Standard errors shown in parentheses.
*, **, and *** represent significance at the 10%, 5%, and 1% levels respectively.
Year fixed effects are not shown in order to save space, but are included in all calculations presented.

42
Table 4.5 presents the enrollment models utilizing the 18 schools in the cohorts that are a part of
an FCS division conference.18 The results indicate that schools with football have significantly
higher total freshman enrollment, all else equal. FCS schools with football have full-time
freshman enrollment that is 108.45 students higher than non-football schools, all else equal. This
result is significant at the five percent level. This increase in enrollment related to football is
higher in the FCS model than the result seen in the full model presented in Table 4.4. This result
could be due to several factors including the fact that football may raise consciousness regarding
offerings at smaller, FCS schools more than it does larger, FBS programs.
It is interesting to note that this model estimates Winthrop’s enrollment well and indicates that
Winthrop would have had 1,048.45 full-time enrolled freshman in 2014. In reality, Winthrop
had 1,019 full-time freshman. In addition, results indicate that if Winthrop had football in 2014,
freshman full-time enrollment would have been 1,156.89. This would represent a growth of
13.53 percent above actual enrollment.
Anecdotal evidence from other universities and admissions staff indicated that there may be a
difference regarding how the presence of a football team impacts male and female enrollment,
with the hypothesis being that football is more of a draw for male students. In order to test this
hypothesis, two other models were investigated that separated enrolled full-time freshman by
gender. These results are also seen in Table 4.5. Indeed, the results show that the response to a
football program does appear to be greater with male students, with football schools seeing an
average of 71.215 more male full-time freshman than non-football schools, all else equal. This
result is significant at the one percent level. The coefficient of the football variable in the
Female Freshman Enrollment model is insignificant. The model indicates that Winthrop would
have had 351.5 male full-time freshman in 2014 with no football team, and 422.72 male full-time
freshman if Winthrop had a football team in 2014. In fact, Winthrop had 289 male freshman in
2014, which is significantly below what the model predicts for schools with similar
characteristics. This puts into question whether or not Winthrop would actually see high levels
of male enrollment growth or if there is some other factor that is discouraging male enrollment.
The cohort analysis previously presented indicated that while there seemed to be a relatively
large difference between freshman enrollment growth at schools with football as compared to
those without football, only small differences were observed when examining total
undergraduate enrollment. In order to investigate this further, additional models were run using
total, full-time undergraduate enrollment as the dependent variable. Table 4.6 presents these
models for the full cohorts, as well as just those in the FCS.
18 Five schools in the Football Cohort play in the FBS division. This includes Georgia State University, Old
Dominion University, University of Texas – San Antonio, University of North Carolina – Charlotte, and University
of South Alabama.

43
Table 4.6
Regression Model – Full-time Undergraduate Enrollment
The results in Table 4.6 indicate that football does appear to have a positive, and significant,
impact on total, full-time, undergraduate enrollment when all 23 schools are included in the
analysis. However, when the dataset is limited to FCS schools, that significant result is no
longer present. The variable FBS also indicates a high level of significance, showing that
schools with football programs in FBS conferences see significantly higher enrollment. Some
schools that add football appear to do so in order to move their school from an FCS conference
to an FBS conference. Within the schools analyzed in this report, this can be observed at Coastal
Carolina (who moves to the FBS as of 2016 as a part of the SunBelt Conference) and Old
Dominion (who moved to the FBS as a part of Conference USA in 2014).
How can freshman enrollment increase at FCS schools while total enrollment does not? Could it
be due to differences in retention rates? The Cohort Analysis showed that the schools in the
ALL SCHOOLS FCS SCHOOLS
FOOTBALL 542.257** -355.410
(213.581) (265.832)
AFRICAN AMERICAN 21.108 15.000
(20.233) (18.609)
HISPANIC 32.054 39.656
(20.976) (18.972)
OTHER RACE 60.497*** 61.303***
(18.906) (17.288)
75th_SAT MATH 10.851*** 9.245**
(4.029) (3.616)
IN-STATE COST -0.217*** 0.130***
(0.025) (0.026)
PRIVATE -2154.050 -3630.769*
(1895.108) (1891.597)
FBS 4450.862*** -
(1702.377) -
CONSTANT 2171.769 2530.723
R-Squared 0.508 0.407
Standard errors shown in parentheses.
*, **, and *** represent significance at the 10%, 5%, and 1% levels respectively.
Year fixed effects are not shown in order to save space, but are included in all calculations presented.
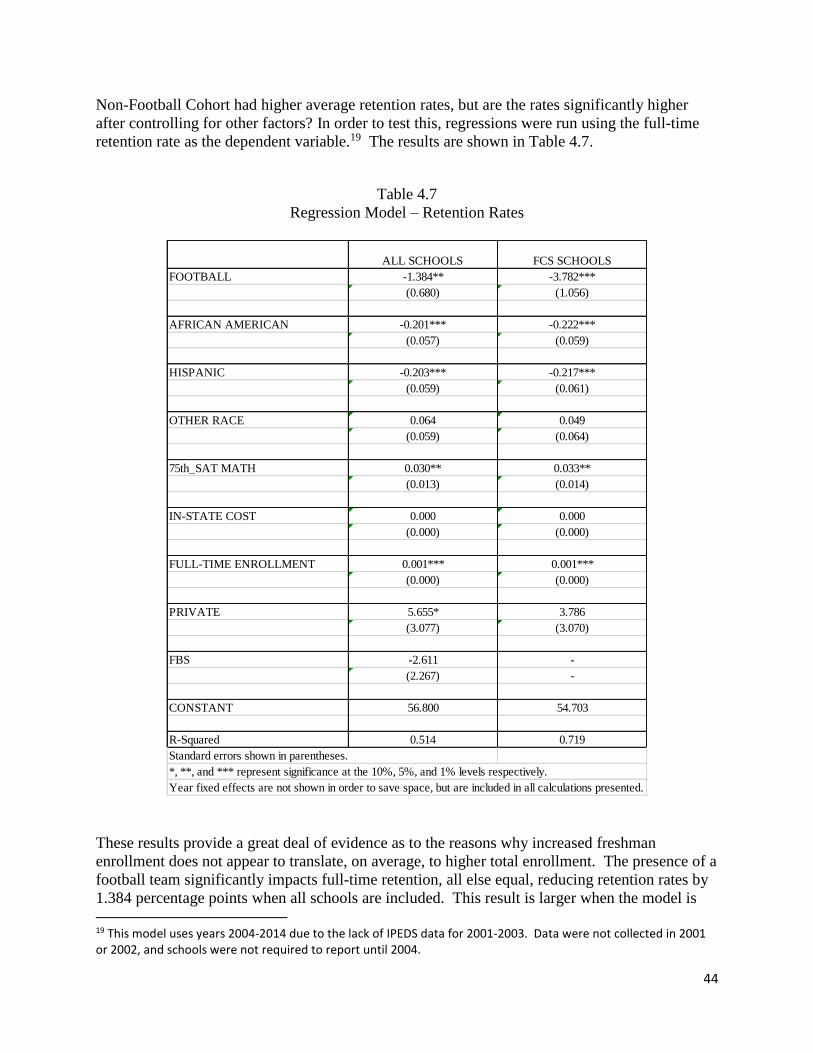
44
Non-Football Cohort had higher average retention rates, but are the rates significantly higher
after controlling for other factors? In order to test this, regressions were run using the full-time
retention rate as the dependent variable.19 The results are shown in Table 4.7.
Table 4.7
Regression Model – Retention Rates
These results provide a great deal of evidence as to the reasons why increased freshman
enrollment does not appear to translate, on average, to higher total enrollment. The presence of a
football team significantly impacts full-time retention, all else equal, reducing retention rates by
1.384 percentage points when all schools are included. This result is larger when the model is 19 This model uses years 2004-2014 due to the lack of IPEDS data for 2001-2003. Data were not collected in 2001 or 2002, and schools were not required to report until 2004.
ALL SCHOOLS FCS SCHOOLS
FOOTBALL -1.384** -3.782***
(0.680) (1.056)
AFRICAN AMERICAN -0.201*** -0.222***
(0.057) (0.059)
HISPANIC -0.203*** -0.217***
(0.059) (0.061)
OTHER RACE 0.064 0.049
(0.059) (0.064)
75th_SAT MATH 0.030** 0.033**
(0.013) (0.014)
IN-STATE COST 0.000 0.000
(0.000) (0.000)
FULL-TIME ENROLLMENT 0.001*** 0.001***
(0.000) (0.000)
PRIVATE 5.655* 3.786
(3.077) (3.070)
FBS -2.611 -
(2.267) -
CONSTANT 56.800 54.703
R-Squared 0.514 0.719
Standard errors shown in parentheses.
*, **, and *** represent significance at the 10%, 5%, and 1% levels respectively.
Year fixed effects are not shown in order to save space, but are included in all calculations presented.
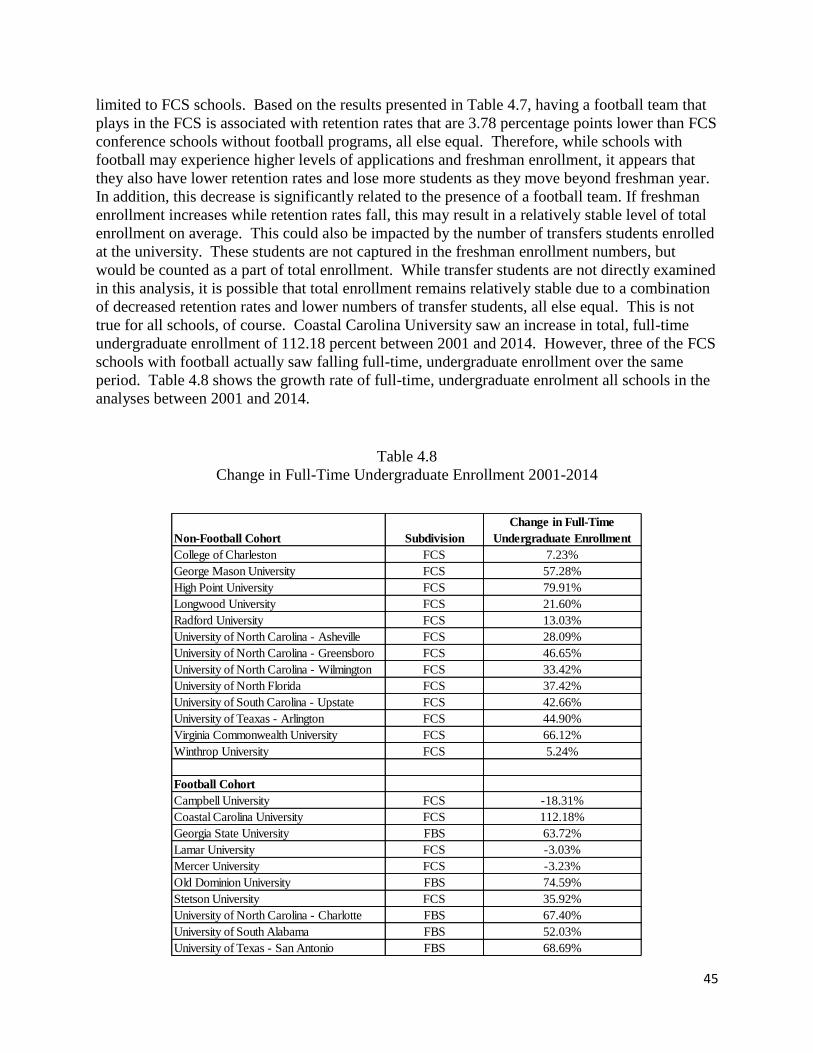
45
limited to FCS schools. Based on the results presented in Table 4.7, having a football team that
plays in the FCS is associated with retention rates that are 3.78 percentage points lower than FCS
conference schools without football programs, all else equal. Therefore, while schools with
football may experience higher levels of applications and freshman enrollment, it appears that
they also have lower retention rates and lose more students as they move beyond freshman year.
In addition, this decrease is significantly related to the presence of a football team. If freshman
enrollment increases while retention rates fall, this may result in a relatively stable level of total
enrollment on average. This could also be impacted by the number of transfers students enrolled
at the university. These students are not captured in the freshman enrollment numbers, but
would be counted as a part of total enrollment. While transfer students are not directly examined
in this analysis, it is possible that total enrollment remains relatively stable due to a combination
of decreased retention rates and lower numbers of transfer students, all else equal. This is not
true for all schools, of course. Coastal Carolina University saw an increase in total, full-time
undergraduate enrollment of 112.18 percent between 2001 and 2014. However, three of the FCS
schools with football actually saw falling full-time, undergraduate enrollment over the same
period. Table 4.8 shows the growth rate of full-time, undergraduate enrolment all schools in the
analyses between 2001 and 2014.
Table 4.8
Change in Full-Time Undergraduate Enrollment 2001-2014
Non-Football Cohort Subdivision
Change in Full-Time
Undergraduate Enrollment
College of Charleston FCS 7.23%
George Mason University FCS 57.28%
High Point University FCS 79.91%
Longwood University FCS 21.60%
Radford University FCS 13.03%
University of North Carolina - Asheville FCS 28.09%
University of North Carolina - Greensboro FCS 46.65%
University of North Carolina - Wilmington FCS 33.42%
University of North Florida FCS 37.42%
University of South Carolina - Upstate FCS 42.66%
University of Teaxas - Arlington FCS 44.90%
Virginia Commonwealth University FCS 66.12%
Winthrop University FCS 5.24%
Football Cohort
Campbell University FCS -18.31%
Coastal Carolina University FCS 112.18%
Georgia State University FBS 63.72%
Lamar University FCS -3.03%
Mercer University FCS -3.23%
Old Dominion University FBS 74.59%
Stetson University FCS 35.92%
University of North Carolina - Charlotte FBS 67.40%
University of South Alabama FBS 52.03%
University of Texas - San Antonio FBS 68.69%

46
Based on these results, and coupled with the cohort analysis previously presented, it is clear that
the addition of a football team typically leads to increases in the number of applicants to a
university as well as freshman enrollment, at least in Division I programs that have been started
since 2001. In addition, these application and enrollment impacts appear to be much more
significant with regard to male students, at levels that are beyond the number of males that
actually play football at the university. However, there also appear to be negative impacts to
retention rates, which may result in a negation of the observed freshman enrollment growth.
This is a relatively small dataset, so it is important not to overstate the results, however, it is clear
that the Division I football programs started since 2001 have not led to significant increases in
total full-time undergraduate enrollment, all else equal. For Winthrop, working from 2014
numbers, a 3.78 percentage point decrease in the full-time retention rate would result in the loss
of 167.11 students. If Winthrop experienced changes similar to those observed in the models
calculated, football would need to bring a significant number of new students to campus in order
to make up for the loss attributed to a decreased retention rate.
While these models are useful, this analysis, as presented thus far, does not consider the costs
associated with the addition of football, the potential revenues or the Title IX impact of the
change. In order to analyze the full impact football may have on the university, it is important to
consider each of these factors.

47
5. Costs and Benefits
It is important to consider both the costs and benefits associated with adding football as a sport at
Winthrop. While it is impossible to estimate exact costs, considerable effort has been made in
the past few years to calculate the cost of building the facilities, hiring new staff, and maintaining
the program.
COSTS
In late 2013, Quakenbush Architects and Planners were hired to estimate the cost of building
football facilities. In the 2013 plan, it was assumed that the new buildings and fields would be
constructed at the Winthrop Lake property, between the location of the current soccer and
softball fields. However, after considering other options on campus-owned land, it appears that
construction could be done at a lower cost on the 24-acre piece of property located near the
Winthrop Facilities Management building. The facilities and athletic departments concurred that
the estimates projected by Quackenbush remain reasonable if the facilities were constructed on
the land near the Facilities Management building rather than on the land at Winthrop Lake.
Construction Costs
Football operations center (with practice fields):
Site construction cost $1,712,623
Building construction cost $6,164,550
Equipment building $ 60,000
Subtotal $7,937,173
Contingency /Escalation:
Site design contingency $ 342,525
Design contingency $ 616,455
Construction contingency $ 308,228
Escalation $ 317,487
Subtotal $1,584,695
Total Construction Budget $9,521,868

48
Soft Costs
Site design fee $ 171,262
Building design fees $ 666,531
Geotechnical/testing $ 190,437
FF&E/AV/technology $ 500,000
Graphics/branding $ 100,000
Subtotal $1,628,230
Additional One-Time Costs
Marching band start-up costs $ 170,000
Improvement s to District 3 Stadium $ 160,000
Subtotal $ 330,000
Total Project Budget
Construction $9,521,868
Soft Costs $1,628,230
One-Time Costs $ 330,000
Total $11,480,098
One other potential cost should be acknowledged here before moving on to annual operating
costs. The opportunity may exist to purchase District 3 Stadium rather than renting (which will
be discussed in the operating costs). While this would be a significant increase in cost, it would
also allow Winthrop to fully brand the stadium and to sell naming rights and advertising in and
around the stadium. Purchasing the stadium, rather than renting it, may be a better investment
both in the short and long terms and should be closely investigated.
Football Operating Costs (annual costs)
These data were provided by Amanda Magshoud, Winthrop’s Associate Vice President for
Finance and Business. She obtained the estimates from Tom Hickman, Winthrop Athletic
Director. These figures were collected in 2013, but are believed to still be reasonable (per Ms.
Magshoud and Walter Hardin, Associate Vice President for Facilities Management).

49
Non-Scholarship Program Scholarship Program
Personnel $ 978,880 $1,185,030
Football operations $ 458,231 $ 556,174
Marching band $ 181,900 $ 181,900
Operation/maintenance of plant $ 384,275 $ 384,275
Stadium rental/personnel costs $ 30,000 $ 30,000
Scholarship awards* $ 234,720 $1,519,416
Facility annual debt service** $ 911,015 $ 911,015
Total $3,179,021 $4,767,810
*Scholarships $ 234,720 $1,519,416
(90 x $2,608) (63x$23,000 + 27x$2,608)
** Based on $12 million for 20 years @ 4.5% (adjusted from data of Amanda Magshoud)
It is important to acknowledge that these cost estimates are limited to the establishment and
operation of the football program. There are undoubtedly additional expenses related to the
addition of football, including the need for additional faculty, tutoring services, housing, etc.
Winthrop’s campus can currently absorb some additional students, but this potential is limited
and will eventually require significant additional spending.
Generally, before a football team begins play, there is a preparation year and a practice year.
During the preparation year, coaches are put into place and facilities are upgraded/built, but no
student-athletes are on campus. During the practice year, some student-athletes are on campus
and practice in preparation for playing the following year. During these two years, coaches must
be paid and facilities maintained. Additional preparation and practice-year costs would include
the institution of additional women’s sports, production of football marketing materials,
advertising, etc. Based on estimates from other schools, it is believed that Winthrop’s cost for
the two years prior to play would be about $4-5 million.20
The Knight Commission has done recent work showing the increased growth in athletic spending
compared to the growth in academic spending.21 Based on these data, one can see that since
2005, Winthrop has increased its per-athlete spending by 12 percent, from $36,657 in 2005 to
$40,882 in 2013. This spending is adjusted for cost inflation and includes total athletic operating
expenses and scholarships. Coastal Carolina had relatively similar per-athlete spending levels in
20 http://www.fgcu.edu/president/files/FGCU-FootballFeasibilityStudy-M011511.pdf 21 http://spendingdatabase.knightcommission.org/reports

50
2005 ($33,736), which grew to $52,335 in 2013, an increase of 55 percent. UNC-Charlotte,
which also recently added football, saw per-athlete spending grow from $45,345 in 2005 to
$65,634 in 2013, an increase of 45 percent.
While per-athlete spending was increasing at nearly all universities over the past decade, and
seems to have risen by higher amounts at schools that added football, academic spending per
full-time enrolled student grew at relatively lower rates. Winthrop saw an increase of 6 percent
between 2005 and 2013, while Coastal Carolina and UNC-Charlotte saw increases of 20 percent
and 3 percent, respectively.
It seems reasonable to expect per-athlete funding at Winthrop to go up if football were added.
Interestingly, based on the Knight Commission data, one can see that Coastal Carolina’s per-
athlete spending in 2013 excluding football players was $39,727, while with football players
included it was $52,335.22 Football appears to be more expensive per athlete than other athletic
programs in the case of all of the schools in the Football Cohort.
Only one athletic department in the FCS Division earned more revenue in 2013 than it had in
expenses. Therefore, as per-athlete spending increases, and revenues from athletics remain
relatively flat, the additional funding must often come from university subsidies to the athletic
department.23 According to USA Today, only 7 athletic departments in Division I public
universities did not receive university subsidies in 2012.24 Additionally, of the 234 Division I
public universities, 129 received more than 50 percent of their athletic funding via university
subsidies. Winthrop is a part of that group. A recent report showed that Winthrop’s athletic
program was subsidized by the university at an annual rate of 84 percent between 2010 and
2014.25 This ranked 15th highest out of the 234 Division I colleges and universities examined by
the Chronicle of Higher Education and the Huffington Post.26 The report showed that between
2010 and 2014, Winthrop’s $60,102,600 in athletic department revenue came from the following
sources:
Ticket Sales: 1%
NCAA Distributions: 4%
Other Revenue: 11%
Subsidy: 84%
Further, the report showed that 57 percent of Winthrop’s $50,404,856 athletic subsidy came from
student fees while 43 percent came from institutional support, much of which was raised via
22 http://spendingdatabase.knightcommission.org/reports/d7d688c0 23 http://www.usatoday.com/story/sports/college/2013/05/07/ncaa-finances-subsidies/2142443/ 24 Texas, Ohio State, LSU, Oklahoma, Penn State, Nebraska and Purdue did not use university subsidies to fund
their athletic departments last year. http://sports.usatoday.com/ncaa/finances 25 http://projects.huffingtonpost.com/projects/ncaa/sports-at-any-cost 26 http://projects.huffingtonpost.com/projects/ncaa/sports-at-any-cost

51
tuition dollars.27 With an already high level of student/university subsidization of the athletic
department, balancing additional and increasing costs would be a challenging feat.
When discussing costs, it is also important to mention the opportunity cost of adding football,
potentially alongside other female sports. Using enrollment growth to fund football prevents the
ability to use enrollment growth dollars for academic, capital or cultural improvements.
Winthrop has an aging campus with a deferred maintenance issue that is not unique in the state
of South Carolina. While tuition and fees from increased enrollment can be used to begin and
sustain a football program, having additional students on campus will increase the need for
additional faculty, staff, academic space, dorms, cafeterias, etc. Spending additional enrollment
income on athletic subsidies, above the high levels already sustained, would put additional
pressure on already stressed university resources. Because of the current fiscal picture of
Winthrop and its athletic department, a careful look at the benefits of a football program is
needed.
BENEFITS
The benefits related to adding a Winthrop football team are much harder to estimate than the
costs. There are several different categories of benefits that could be predicted. These include
increased enrollment, sponsorships, game revenue, community relations, donations, sales of
Winthrop merchandise, and several others discussed below.
Increased Enrollment
It is difficult to estimate the exact change a football program would have on enrollment at
Winthrop. Based on the models presented in Section 4 of this report, it is believed that adding
football could significantly increase the number full-time freshman each year. While freshman
enrollment would likely increase, there is a larger question mark surrounding what might happen
to total undergraduate enrollment. As discussed in Section 4, using the data collected, football is
significantly linked to a decrease in retention rates, and does not result in increased total
enrollment, on average. The problem is the difficulty in knowing what Winthrop’s exact
experience would be. While some programs have been started extremely well and have led to
large enrollment increases, others have struggled. It is hard to know what impact football would
have on Winthrop’s enrollment without knowing exactly how it would be rolled out and
operated.
Game Day Receipts
Based on alumni and community surveys, the projected revenue from home games is $600,000
for a six game home season. The average per-season ticket revenue from home games for FCS
27 http://projects.huffingtonpost.com/projects/ncaa/subsidy-scorecards/winthrop-university

52
programs, per the NCAA®, was slightly over $500,000 in 2014.29 However, given the higher-
than-average regional interest in football shown in the GIS analysis, it is estimated that Winthrop
could expect ticket sales of around $600,000 a year. This number was calculated by assuming
that people in the vicinity of Winthrop would be 20 percent more likely to attend games than the
national average. The previously presented GIS analysis showed that residents in York County
are already 14 percent more likely to attend college football games than the national average.
Since there are no local college teams, these York County residents are traveling to attend
games. It therefore seems reasonable to believe that they would be 20 percent more likely to
attend local college football games than the national average.
Increased Sports Sponsorships
NCAA data from 2014 show that Division I public universities with FCS football have
sponsorship levels that are 576 percent higher than Division I public universities without
football. More specifically, the data show median sponsorship and advertising revenues of
$54,000 a year for Division I schools without football and $365,000 a year for athletic programs
that compete in the FCS subdivision.30 An official from a school similar to Winthrop that added
football recently indicated that they saw an increase of 500 percent in sports sponsorships during
the first year of the program. The potential increase is difficult to estimate specifically for
Winthrop, but it is believed that it would be much higher if District 3 Stadium were purchased
rather than rented. If purchased, the stadium could be fully branded and naming rights could be
sold. During the 2015-2016 academic year, Winthrop received $268,800 in sponsorship
dollars.31
Increased Donations to the University
Donations to the athletic department, as well as to the academic units, would be expected to
increase if football were added. NCAA data from 2014 show median athletic donations of
$504,000 a year for public Division I universities without football and $862,000 a year for public
universities in the FCS subdivision, a 71.03 percent difference.32 Since Winthrop’s current
donation levels for the athletic department are relatively low, it is possible that Winthrop would
obtain relatively large increases in donations. During the 2015-2016 academic year, cash
donations to the athletic department equaled $110,500. This does not include in-kind gifts or the
receipts of the annual Eagle Club Auction. However, Winthrop’s relatively low level of current
donations may indicate a lower propensity to give amongst Winthrop alumni and friends.
Additional money would likely need to be spent in order to put a more significant emphasis on
giving.
29 http://www.ncaa.org/sites/default/files/2015%20Division%20I%20RE%20report.pdf 30 http://www.ncaa.org/sites/default/files/2015%20Division%20I%20RE%20report.pdf 31 This does not include trade amounts or the Adidas contract. 32 http://www.ncaa.org/sites/default/files/2015%20Division%20I%20RE%20report.pdf

53
Improved Community Relations
Survey results indicate that both alumni and community members would have a greater
connection to Winthrop University if football were added. This is important to the community
overall and helps students obtain internships, employment, etc.
Increased Sales of Winthrop Merchandise
With the addition of football, more Winthrop merchandise would be sold both on and off
campus. All of the surveys conducted show that people would be more likely to buy Winthrop
merchandise if there were a football team.
Potential to Move into a More Financially Lucrative Athletic Conference
Several of the comparable schools analyzed for this study noted that the addition of a successful
football team served as a catalyst for the movement into a more financially lucrative conference.
For example, in 2014 Mercer University moved from the Atlantic Sun Conference to the
Southern Conference. For Mercer, this move will mean a significant increase in exposure, as
well as higher levels of revenue sharing. In addition, because many of the Southern Conference
schools are closer to Mercer than the Atlantic Sun schools, travel costs will decrease for all
sports, not just football. However, it important also to note that changing conferences also can
increase travel costs, as Coastal Carolina University will see as a result of its move to the Sun
Belt Conference and their transition to the FBS in 2016. As mentioned previously, some schools
have started football as a way to enter FBS conferences, which provides additional benefits and
exposure to all sports, including football.
Potential to Play Large, Major Conference Schools and Receive Payment
If scholarship football were chosen, Winthrop would have the potential to play schools in the
large athletic conferences for additional revenue (called guarantees). For example, Coastal
Carolina was paid $375,000 to play the University of South Carolina in 2013.33 Because of the
travel distance, Georgia State was paid $900,000 to play the University of Washington in 2014.34
Schools the size of Winthrop typically play one or two of these games per season in order to
make additional revenue and to obtain greater national exposure. NCAA data indicate that
public universities competing in the FCS receive a median amount of $751,000 a year from
guarantee games (across all sports). This is nearly $500,000 higher than the median amount of
revenue from guarantees seen at Division I public universities without football programs.35
33 http://www.myhorrynews.com/sports/college/football/article_0c0f1978-62b1-11e3-9909-0019bb30f31a.html 34 http://www.seattletimes.com/sports/uw-huskies/here-is-why-washington-is-playing-an-apparently-overmatched-
georgia-state/ 35 http://www.ncaa.org/sites/default/files/2015%20Division%20I%20RE%20report.pdf

54
Table 5.1 presents 2014 median levels of the top five generated revenue categories for public
universities in the FCS and Division I public universities without football. All data are from the
NCAA Division I Intercollegiate Athletics Programs Report.36 The data indicate that the median
levels of the top 5 revenue categories are $1.81 million higher per year for FCS athletic programs
than those seen at Division I schools without football.37
Table 5.1
Top 5 Generated Revenue Categories
(median annual levels for public universities)
Costs versus Benefits
The question remains, will the revenues from a football program exceed its costs? It is
impossible to know for sure, but the potential certainly exists. If the program was supported at
the levels reported by alumni and community surveys, it is reasonable to expect that total
revenue growth at the university related to football could exceed the cost of football. The
information presented earlier estimates the cost to be in the range of $4.7 million a year for a
scholarship program. Based on estimated revenue from increased enrollment, home games and
paid away games, it would be possible to exceed this amount if a football program was
implemented. However, even if revenues exceeded direct costs, when factoring in the additional
costs of athletic and academic supporting jobs, as well as additional campus housing, food, etc.,
it is not clear that Winthrop itself would experience a significant net revenue benefit from the
addition of football.
Given the data presented in the Cohort and Statistical Analyses, it is also entirely possible that
football would not bring the large increases in enrollment that some survey participants indicated
they would expect. When examining the schools that have added football most recently, football
does not appear to have led to highly significant undergraduate enrollment growth, with the
36 http://www.ncaa.org/sites/default/files/2015%20Division%20I%20RE%20report.pdf 37 This does not include additional revenue sources such as concessions, sports camps, investment income or other
miscellaneous revenues.
Revenue Category FCS Programs Division I - No Football Difference
Ticket Sales $509,000 $151,000 $358,000
Guarantees and Options $751,000 $264,000 $487,000
Donations from Alumni and Others $862,000 $504,000 $358,000
NCAA and Conference Payments $785,000 $485,000 $300,000
Sponsorships and Advertising $365,000 $54,000 $311,000
Total from 5 Primary Revenue Sources $3,272,000 $1,458,000 $1,814,000

55
exception of Coastal Carolina and Stetson. It would be possible for Winthrop to experience this
strong growth as well, but it is far from guaranteed.
In 2014, FCS public universities had a median level of $4.16 million per year in generated
revenues. Division I schools without football only generated a median level of $2.48 million in
revenues.38 This is only one part of the story, however. The median level of total revenues,
much of which comes from university subsidies, was $13.64 million at FCS public universities
and $12.28 million at Division I public universities without football. This means that FCS public
schools’ athletic departments lost an average $9.43 million and Division I athletic departments
without football lost an average of $9.60 million. In other words, FCS universities subsidized
their athletic programs via institutional support at a median rate of around $9.43 million and
schools without football subsidized their athletic programs at a median rate of around $9.60
million.39 They are nearly identical. FCS schools generate more revenue than schools without
football, but they also tend to have higher expenses. According to NCAA data, FCS public
universities receive around 69.13 percent of their athletic department revenues from institutional
support, while Division I public universities without football receive around 78.16 percent from
institutional support.
The implementation of a successful football team would take time, careful planning and
execution. Some schools that initiated a football team have witnessed success and some schools
have struggled. It is important to note that it is not possible to see how much football directly
increases school revenue or how it impacts school morale. A student’s reason for applying or an
alumni’s reason for giving cannot typically be fully identified.
38 http://www.ncaa.org/sites/default/files/2015%20Division%20I%20RE%20report.pdf 39 Institutional support from universities includes revenue from university operating funds and revenue from student
athletic fees.
56
6. Title IX Compliance
Title IX of the Education Amendments of 1972 prohibits discrimination on the basis of sex in
education programs and activities by those who received funding from the federal government.
Title IX is enforced by the Office for Civil Rights (OCR), which in 1979 outlined the three-part
test to assess whether or not an institution is providing participation opportunities in a
nondiscriminatory manner. The three-part test is as follows:
“The 1979 Policy Interpretation provides that as part of this determination OCR will apply the
following three-part test to assess whether an institution is providing nondiscriminatory
participation opportunities for individuals of both sexes:
Test 1: Whether intercollegiate level participation opportunities for male and female
students are provided in numbers substantially proportionate to their respective
enrollments; or
Test 2: Where the members of one sex have been and are underrepresented among
intercollegiate athletes, whether the institution can show a history and continuing
practice of program expansion which is demonstrably responsive to the
developing interests and abilities of the members of that sex; or
Test 3: Where the members of one sex are underrepresented among intercollegiate
athletes, and the institution cannot show a history and continuing practice of
program expansion, as described above, whether it can be demonstrated that the
interests and abilities of the members of that sex have been fully and effectively
accommodated by the present program.”44
In addition to the three-part test, the OCR also considers the quality of competition offered to
both sexes in order to determine compliance. This examination is done for the program as a
whole. There are 13 program components that are reviewed for Title IX compliance. The first
two are the most well-known and are the primary focus of this analysis: Accommodation of
Interest and Abilities and Athletic Financial Assistance. These two areas cover the
proportionality of athletic opportunities as well as the proportionality of scholarship dollars. The
proportionality of athletic opportunities is calculated using full-time undergraduate student
enrollment by gender. In other words, if 56% of the students are female, then 56% of athletes
would need to be female in order to pass the first part of the three-part test. Scholarship dollars
are required to be awarded to men and women at the same proportion as their respective
participation rates.
44 Clarification of Intercollegiate Athletics Policy Guidance: The Three-Part Test, U.S. Department of Education,
Office for Civil Rights, January 16, 1996.

57
The other 11 (of 13) program components that are analyzed by the OCR for compliance are as
follows:
Equipment and Supplies Tutoring
Scheduling of Games and Practice Times Travel and Per Diem Allowances
Coaching Locker Rooms, Practice and Competitive Facilities
Publicity Housing and Dining Facilities and Services
Medical and Training Facilities and Services Recruitment of Student-Athletes
Support Services
The OCR examines the treatment of the athletes, coaches and staff, on the basis of sex, for the
entire athletic department at the university. Because Winthrop has a long history of Title IX
compliance in these 11 areas, this analysis will focus on the first two areas, the proportionality of
athletic opportunities and the proportionality of scholarship dollars.
The current state of Winthrop’s Title IX compliance:
Proportionality of Athletic Opportunities:
Number Percent
Full-time Undergraduate Female Students: 3,092 67.94%
Full-time Undergraduate Male Students: 1,459 32.06%
Total Full-Time Undergraduates: 4,551
Female Student-Athlete Participants: 197 49.00%
Male Student-Athlete Participants: 205 51.00%
Total Student-Athlete Participants: 402
Because the percentage of female student-athletes is below the percentage of female students,
Winthrop does not currently meet Test 1 as defined by Title IX for the proportionality of athletic
opportunities.45
Since Test 1 is not met, Test 2 must now be considered. Winthrop has remained compliant under
Title IX by showing a “history and continuing practice of program expansion which is
demonstrably responsive to the developing interests and abilities of the” underrepresented sex.
This was most recently shown in 2010, when the Winthrop Board of Trustees voted to begin a
45 It is important to note that some of the student-athlete participants are counted more than once per NCAA guidelines. For example, a female athlete may be counted for both cross-country and track and field.

58
women’s lacrosse program. This program began play in 2012, and currently has 38 participants.
Similarly, women’s soccer was added in 2003, and now has a roster of 35 women. No male
sports have been added at Winthrop during that span of time.
Proportionality of Scholarship Dollars:
Number Percent
Female Student-Athlete Scholarships: $2,605,280.75 56.20%
Male Student-Athlete Scholarships: $2,033,431.00 43.80%
Total Student-Athlete Scholarships: $4,638,711.75
Proportionality of scholarship dollars is measured differently than the proportionality of athletic
opportunities. Unlike the proportionality of athletic opportunities, the scholarship dollars do not
have to be proportional to the gender distribution of the student body. Instead, the amount of
scholarship dollars, broken down by gender, should be proportional to the percentage of men and
women athletes participating in sports. Since Winthrop has 49 percent female athletes, it should
have at least 49 percent of all athletic scholarships distributed to female athletes.
Because the percentage of scholarship dollars received by female student-athletes (56.2 percent)
exceeds the participation levels of female student-athletes (49 percent) Winthrop does currently
meet the Test 1 as defined by Title IX for the proportionality of scholarship dollars. Tests 2 and
3 do not need to be considered in this case.
To summarize, Winthrop University currently remains Title IX compliant by meeting Test 2 with
regard to the proportionality of athletic opportunities and Test 1 with regard to the
proportionality of scholarship dollars.
Potential Impact of Football
If we assume that football would add 90 new male student-athletes, the numbers previously
presented would change quite a bit, as this would be a 22.4 percent increase in the total number
of student athletes on campus. For the following analysis, we assume that the only change to the
student body is the addition of 90 new male student-athletes. Of course, it is logical to believe
that the addition of football could lead to student body changes as well, but since we do not
know the impact it would have, we will assume that it only brings 90 new male students to
campus.
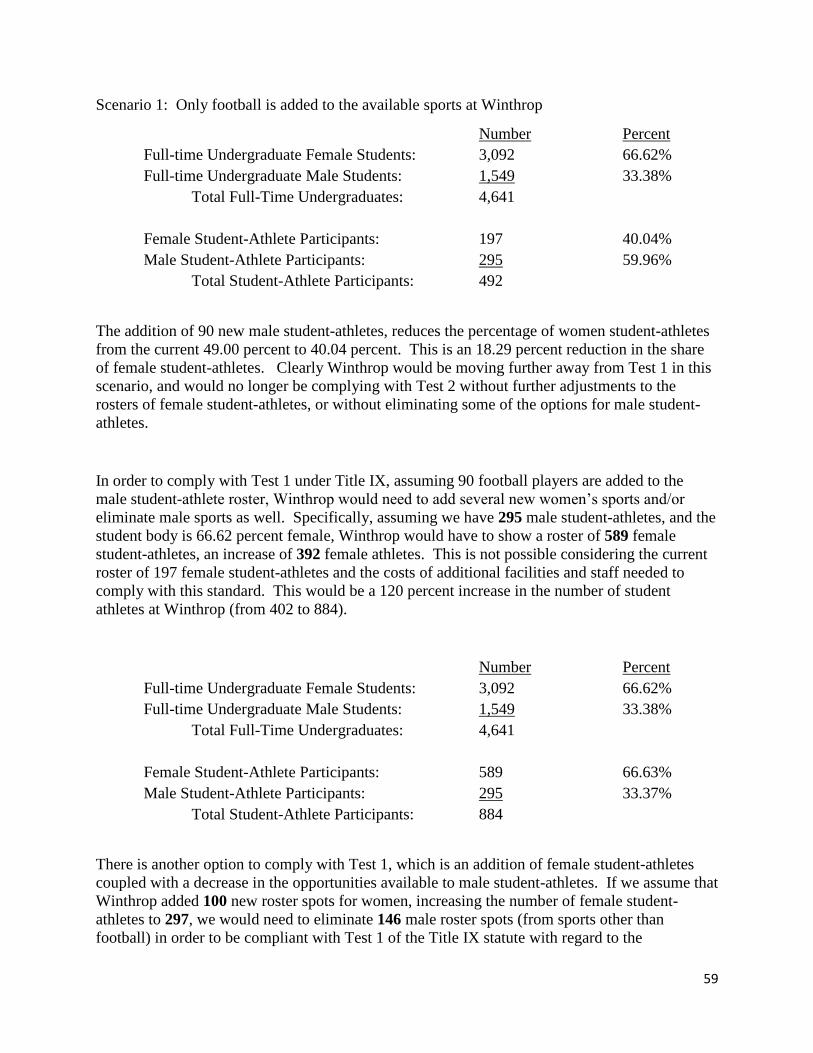
59
Scenario 1: Only football is added to the available sports at Winthrop
Number Percent
Full-time Undergraduate Female Students: 3,092 66.62%
Full-time Undergraduate Male Students: 1,549 33.38%
Total Full-Time Undergraduates: 4,641
Female Student-Athlete Participants: 197 40.04%
Male Student-Athlete Participants: 295 59.96%
Total Student-Athlete Participants: 492
The addition of 90 new male student-athletes, reduces the percentage of women student-athletes
from the current 49.00 percent to 40.04 percent. This is an 18.29 percent reduction in the share
of female student-athletes. Clearly Winthrop would be moving further away from Test 1 in this
scenario, and would no longer be complying with Test 2 without further adjustments to the
rosters of female student-athletes, or without eliminating some of the options for male student-
athletes.
In order to comply with Test 1 under Title IX, assuming 90 football players are added to the
male student-athlete roster, Winthrop would need to add several new women’s sports and/or
eliminate male sports as well. Specifically, assuming we have 295 male student-athletes, and the
student body is 66.62 percent female, Winthrop would have to show a roster of 589 female
student-athletes, an increase of 392 female athletes. This is not possible considering the current
roster of 197 female student-athletes and the costs of additional facilities and staff needed to
comply with this standard. This would be a 120 percent increase in the number of student
athletes at Winthrop (from 402 to 884).
Number Percent
Full-time Undergraduate Female Students: 3,092 66.62%
Full-time Undergraduate Male Students: 1,549 33.38%
Total Full-Time Undergraduates: 4,641
Female Student-Athlete Participants: 589 66.63%
Male Student-Athlete Participants: 295 33.37%
Total Student-Athlete Participants: 884
There is another option to comply with Test 1, which is an addition of female student-athletes
coupled with a decrease in the opportunities available to male student-athletes. If we assume that
Winthrop added 100 new roster spots for women, increasing the number of female student-
athletes to 297, we would need to eliminate 146 male roster spots (from sports other than
football) in order to be compliant with Test 1 of the Title IX statute with regard to the

60
proportionality of athletic opportunities. Based on current numbers, this would mean the
elimination of at least 4 male sports at Winthrop.
Number Percent
Full-time Undergraduate Female Students: 3,092 66.62%
Full-time Undergraduate Male Students: 1,549 33.38%
Total Student-Athlete Participants: 4,641
Female Student-Athlete Participants: 297 66.60%
Male Student-Athlete Participants: 149 33.40%
Total Student-Athlete Participants: 446
Based on these numbers, it appears nearly impossible to comply with Test I of Title IX with
regard to the proportionality of athletic opportunities if football is added to the list of
intercollegiate sports at Winthrop. The question becomes, can we comply with Test 2? Adding
football, without adding significant numbers of new opportunities for female student-athletes, is
clearly a move away from Test 2 compliance. Winthrop would likely need to add several new
female sports opportunities in conjunction with football in order to remain compliant with Test 2.
It would not be necessary to add all female sports in the first year football was played, but it
would be important to demonstrate a commitment to adding significant female athletic
opportunities. More specifically, Winthrop would likely need to add at least 90 new female
athletic opportunities to remain at current compliance levels, and significantly more than 90 new
female athletic opportunities to improve current Title IX standing.
Scholarship vs. Non-Scholarship Football
The decision of adding scholarship or non-scholarship football will also impact the
proportionality of scholarship dollars. If we assume that we add 90 non-scholarship male
athletes, while adding no female athletes, we would have 40.04 percent female participation
while providing 56.16 percent of scholarship dollars to females, which is clearly in compliance
with Test 1 of the scholarship proportionality rule.
Adding a scholarship program would result in quite different numbers. The Big South
Conference, to which Winthrop currently belongs, plays football in the Football Championship
Subdivision (FCS). FCS Football is an equivalency sport, which means that participants can
receive partial scholarships, and the number of full-ride scholarships permitted by the NCAA can
be spread over a larger number of student-athletes. Per NCAA guidelines, FCS programs can
offer a maximum of 63 full-ride football scholarships, which can be spread over a maximum of
85 student-athletes. If it is assumed that each of the 63 scholarships were equal to the in-state
cost of attendance, $27,152, then scholarship football would add an additional $1,710,576 in
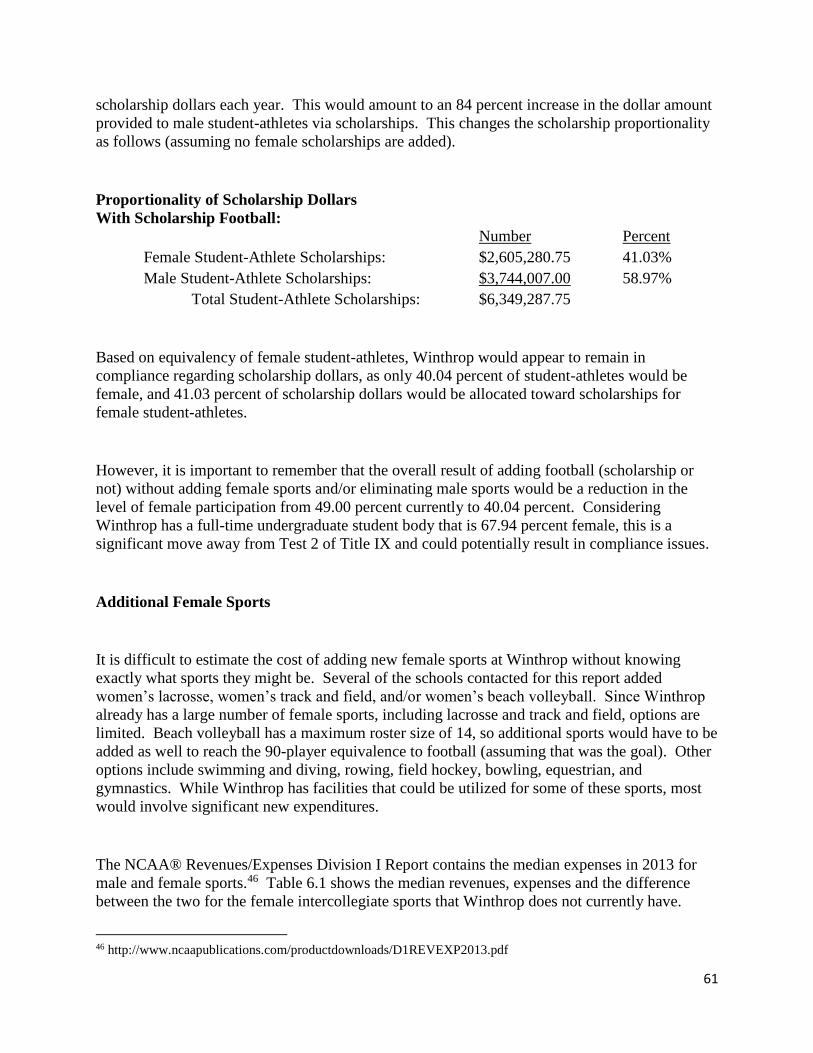
61
scholarship dollars each year. This would amount to an 84 percent increase in the dollar amount
provided to male student-athletes via scholarships. This changes the scholarship proportionality
as follows (assuming no female scholarships are added).
Proportionality of Scholarship Dollars
With Scholarship Football:
Number Percent
Female Student-Athlete Scholarships: $2,605,280.75 41.03%
Male Student-Athlete Scholarships: $3,744,007.00 58.97%
Total Student-Athlete Scholarships: $6,349,287.75
Based on equivalency of female student-athletes, Winthrop would appear to remain in
compliance regarding scholarship dollars, as only 40.04 percent of student-athletes would be
female, and 41.03 percent of scholarship dollars would be allocated toward scholarships for
female student-athletes.
However, it is important to remember that the overall result of adding football (scholarship or
not) without adding female sports and/or eliminating male sports would be a reduction in the
level of female participation from 49.00 percent currently to 40.04 percent. Considering
Winthrop has a full-time undergraduate student body that is 67.94 percent female, this is a
significant move away from Test 2 of Title IX and could potentially result in compliance issues.
Additional Female Sports
It is difficult to estimate the cost of adding new female sports at Winthrop without knowing
exactly what sports they might be. Several of the schools contacted for this report added
women’s lacrosse, women’s track and field, and/or women’s beach volleyball. Since Winthrop
already has a large number of female sports, including lacrosse and track and field, options are
limited. Beach volleyball has a maximum roster size of 14, so additional sports would have to be
added as well to reach the 90-player equivalence to football (assuming that was the goal). Other
options include swimming and diving, rowing, field hockey, bowling, equestrian, and
gymnastics. While Winthrop has facilities that could be utilized for some of these sports, most
would involve significant new expenditures.
The NCAA® Revenues/Expenses Division I Report contains the median expenses in 2013 for
male and female sports.46 Table 6.1 shows the median revenues, expenses and the difference
between the two for the female intercollegiate sports that Winthrop does not currently have.
46 http://www.ncaapublications.com/productdownloads/D1REVEXP2013.pdf

62
Figures shown are for FCS schools, as this is the division Winthrop would compete in if football
were added.
Table 6.1
Median Revenues and Expenses for Female Sports FCS Schools
(only includes sports not currently played at Winthrop)
As Table 6.1 demonstrates, none of the female sports Winthrop could add are profitable (at the
median level). In addition, these figures represent yearly operating revenues and expenses.
They do not include the start-up cost of beginning the program and building/purchasing of
capital resources. Sports such as swimming, beach volleyball and rugby could (at least partially)
utilize resources already present at Winthrop. However, others, such as gymnastics, crew and
equestrian would require substantial upfront costs in the form of new equipment, staff and
facilities.
Even if it is assumed that Winthrop were to add the least expensive of the women’s sports based
on current facilities, to get to an additional 90 (or more) female athletes would likely cost at least
$700,000 in additional annual operating expenses. This doesn’t include the start-up costs or the
additional athletic department staff/facilities or academic staff/facilities that would be needed to
accommodate so many new student athletes. There is no doubt that adding that many sports is
very expensive and significant revenues from these sports would be extremely unlikely.
Intercollegiate Sport Median Revenues Median Expenses
Median Revenues -
Median Expenses
Beach Volleyball $0.00 $80,000.00 -$80,000.00
Bowling $3,000.00 $156,000.00 -$153,000.00
Crew $70,000.00 $435,000.00 -$365,000.00
Equestrian $30,000.00 $197,000.00 -$167,000.00
Fencing $45,000.00 $131,000.00 -$86,000.00
Field Hockey $45,000.00 $472,000.00 -$427,000.00
Gymnastics $44,000.00 $395,000.00 -$351,000.00
Ice Hockey $80,000.00 $737,000.00 -$657,000.00
Rugby $1,000.00 $97,000.00 -$96,000.00
Skiing $116,000.00 $375,000.00 -$259,000.00
Swimming $35,000.00 $406,000.00 -$371,000.00
Water Polo $39,000.00 $288,000.00 -$249,000.00

63
Additional Related Issues
If Winthrop needed to add 5 sports (football plus 4 women’s sports) to remain Title IX
compliant, that would put Winthrop’s total number of intercollegiate sports at 21.47 According to
the NCAA® Revenues/Expenses Division I Report, FCS division schools with football (which
includes schools in the Big South Conference) had a median number of 18 sports as of 2013.48 It
is reasonable to believe that having 21 sports would lead to higher than median costs as well.
Table 6.2 shows the number of sports in which schools in the Football Cohort (that are also FCS
schools) participate.
Table 6.2
FCS Football Schools Available Sports by Gender49
As of spring 2016, Winthrop had 197 female participants and 205 male participants. This is well
above the Division I median for schools without football (189 female and 177 male). Winthrop
is nearly 30 male athletes above the median currently. If we assume that we add 90 male athletes
with the addition of football and 100 female athletes via the addition of new sports, Winthrop
would then have 297 female participants and 295 male participants. According to the same
NCAA® report, the median FCS school has 227 female athletes and 285 male athletes. This
would mean Winthrop would have 70 female athletes and 10 male athletes above the median.
Given Winthrop’s enrollment, budget and current endowment, it is difficult to surmise that
Winthrop should participate at levels above the FCS median.
Another option available to Winthrop is the addition of football and one to two female sports in
conjunction with the elimination of one or more male sports. Although this is a difficult topic to
confront, it is one that must be considered when trying to remain Title IX compliant while
adding football. If Winthrop decides to begin a football program, it will be necessary to weigh
47 These figures count track and field as one sport. These are often counted as two (indoor and outdoor), which
would put Winthrop’s current number of sports at 18. However, these figures count it as one, which means that
Winthrop currently has 16 intercollegiate sports. 48 http://www.ncaapublications.com/productdownloads/D1REVEXP2013.pdf 49 Counts track and field as one sport rather than separating it out as indoor and outdoor.
Men's Sports Women's Sports Total
Winthrop University 7 9 16
Campbell University 10 10 20
Coastal Carolina University 8 10 18
Lamar University 7 8 15
Mercer University 8 10 18
Stetson University 8 10 18

64
the costs of adding several additional female sports with the cost of adding fewer female sports
and eliminating one (or more) male sports.

65
7. Conclusion
The decision regarding the addition of football at Winthrop University is a complicated one, as
there are clear positives and negatives to consider. It is important to look at all issues thoroughly
and to compare the opportunities that exist if football is added to the risks involved in starting
such a large, and expensive, new program.
On one hand, it seems there is a high level of support from students, alumni and the local
community, and those stakeholder groups are the ones that would likely be the largest supporters
of the program. It is also expected that football would significantly increase freshman
enrollment at Winthrop, and, more specifically, increase male freshman enrollment. This is
desirable for several reasons. Additional revenue from students is a clear positive, and
Winthrop’s campus can currently absorb many new students without much additional new
construction, since the campus has been built to accommodate growth. In addition, with a
current female population that represents more than 68 percent of undergraduates, adding a
significant number of male students would likely be seen as a positive change by most
stakeholders. Winthrop desires to have a diverse campus, not just in terms of racial diversity, but
also in terms of gender. The addition of more male students would also help Winthrop’s Title IX
compliance, since the proportionality of opportunities test relies on the proportion of
undergraduate women as its standard. It is unclear if football would translate to higher total
enrollment on campus, but there would be some benefit, at least in the short-run, from increased
freshman enrollment.
There are also obvious benefits to the local community. For years, Winthrop and Rock Hill have
worked hard to create more of a college town atmosphere around campus. This can be observed
in the College Town Action Plan initiated in 2009 in Rock Hill and the recent plans to include
Winthrop in the Knowledge Park development near campus. The economic impact from the
addition of football would almost certainly increase the number of restaurants, bars, and hotels in
the areas near campus.
All that being said, there are clear issues that need close consideration as well. Simply put,
adding a college football team is very expensive. Winthrop is lucky to have access to a stadium
adjacent to campus, but significant expenditures would still be required. Many of the programs
analyzed in the Football Cohort received significant gifts of $5 million or greater to aid in their
starting of a football program. Carolina Panthers owner, Jerry Richardson, donated $10.25
million to the UNC-Charlotte football program in order to get naming rights to their newly built
stadium.50 Coastal Carolina University hired the retired CEO of TD Bank as their coach, and the
bank donated $5 million to the program in his second year on the job.51 Is it reasonable to expect
50 http://www.bizjournals.com/charlotte/blog/queen_city_agenda/2013/06/jerry-richardson-gives-10-million-
for.html 51 http://www.coastal.edu/newsarticles/story.php?id=3501

66
this at Winthrop? Is there a donor who would take on this opportunity? If not, how will the
money be raised?
Coastal Carolina has been discussed much throughout this report as they have recently added
football, have competed alongside us in the Big South Conference and are a rival state
institution. In addition, they have had significant increases in enrollment since adding football. It
is relevant to discuss them one more time in this report. In fiscal year 2008, Coastal Carolina
worked alongside the South Carolina legislature to amend a law that allows higher education to
participate in the sharing of education sales tax revenue. As a result of the amendment of the
state law, Coastal Carolina was included in a 1 percent sales tax referendum that passed in
November 2008. Coastal Carolina receives 13.3 percent of the tax collected from the 1 percent
sales tax. Horry County Schools and Horry Georgetown Technical College receive the
remaining 86.7 percent. Coastal Carolina began receiving the tax revenue in March 2009 and
will receive for at least the next 15 years. Between March 2009 and June 2015, Coastal Carolina
received over $48 million in sales tax revenue from Horry County. They expect the total amount
from the tax to exceed $133 million over the 15 year period.52 This amounts to an expected
average of $8.9 million per year. To put it into perspective, Coastal Carolina received $10.8
million in state appropriations in 2015.53 There is no doubt that the additional support from the
county provides Coastal with the ability to take part in activities and initiatives that would be
impossible without the sales tax revenue. This puts Coastal Carolina in a unique position within
the South Carolina institutions of higher education that allows for additional capital projects and
the addition of new programs.
The other major issue that must be closely considered is Title IX. Winthrop has done a good job
thus far remaining compliant by adding additional female sports over time. However, adding a
football program would be a significant departure from that pattern, and it would likely be
necessary to add additional women’s sports at the same time (or soon after) football was added.
While some additional women’s sports would require relatively small investments, beach
volleyball for example, some others would be quite expensive. Can Winthrop afford to add three
to four women’s sports while adding football? Is the better option to eliminate a male sport in
conjunction with adding one or two female sports? How would stakeholders respond?
There are many questions that must be considered as Winthrop moves forward in the process of
deciding whether it should add a football program. There exists the potential for higher revenue
and greater recognition. However, if it is not executed well, or if corners are cut due to budgetary
concerns, it could also lead to significant losses to the university. The addition of football is
52 The money received from the 1 cent sales tax is restricted to pay for campus construction, capital improvements,
renovations and land acquisitions. 53
https://www.coastal.edu/media/administration/vpforfinance/docs/cafr/2015%20CAFR%20Book%20updated%202-
15-16.pdf

67
certainly not a panacea. It only produces positive results when done well and when a significant
financial investment is made.

68
APPENDIX
Student Survey
The survey questions were broken down by gender to see if males and females have different
views regarding the impact of Winthrop football. There was no difference found between
genders. The only difference that can even be observed in a meaningful way in the figure below
is the likelihood of attending tailgates, which indicates that women are more likely than men to
attend.
The questions were also separated based on whether or not a respondent is a Winthrop athlete
and whether or not they are an underclassmen (freshman/sophomore) or an upperclassmen
(junior/senior/grad). These results are shown in the following two figures.
0
1
2
3
4
5
6
Likely to AttendFootball
Likely to AttendOther
Likely StayWeekends
Likely Join FanClub
Likely AttendTailgates
Likely PurchaseMerchandise
Comparing Gender Future Intentions
Male Female

69
Independent T-tests were conducted comparing gender, athletes, and upperclassmen vs.
underclassmen. Among those surveyed, there were no significant differences between males and
females except that females would likely attend more tailgates if a football team were started at
the university. There were also no significant differences between the athletes’ attitudes
regarding starting a football team. The differences were apparent when comparing
underclassmen (1st and 2nd year students) and upperclassmen (3rd year and higher). The
underclassmen significantly scored higher on all 6 future behavior variables.
0
0.5
1
1.5
2
2.5
3
3.5
4
4.5
5
Likely to
Attend Football
Likely to
Attend Other
Likely Stay
Weekends
Likely Join Fan
Club
Likely Attend
Tailgates
Likely Purchase
Merchandise
Comparing Athletes vs. Non-Athletes Future Intentions
Athletes Non-Athletes
0
0.5
1
1.5
2
2.5
3
3.5
4
4.5
5
Likely to
Attend Football
Likely to
Attend Other
Likely Stay
Weekends
Likely Join Fan
Club
Likely Attend
Tailgates
Likely Purchase
Merchandise
Comparing Underclass vs. Upperclass Future Intentions
Underclass (1-2 years) Upperclass (3 or more years)

70
Community Survey
Demographic Data
1. Gender
a. Male (53.5%)
b. Female (46.5%)
2. Family Income
a. Below $25,000 (7.3%)
b. $25,001 - $50, 000 (19.9%)
c. $50,001 - $75,000 (25.9%)
d. $75,001 - $100,000 (21.8%)
e. Above $100,000 (25.1%)
3. Race
a. Caucasian (63.0%)
b. African-American (31.8%)
c. Native American (1.6%)
d. Hispanic (3.4%)
e. Asian and Pacific Islander
f. Other
g. Rather not say (0.3%)
4. Age Group
a. Below 15 yrs. (4.1%)
b. 15 – 24 yrs. (16.3%)
c. 25 – 34 yrs. (7.8%)
d. 35 – 44 yrs. (27.6%)
e. 45 – 54 yrs. (21.7%)
f. 55 – 64 yrs. (13.4%)
g. Above 64 yrs. (8.8%)
5. Where do you currently live?
a. York County, SC (94.3%)
b. Mecklenburg County, NC (1.0%)
c. Lancaster County, SC (1.3%)
d. Chester County, SC (0.7%)
e. Union County SC (0.5%)
f. Cherokee County, NC
g. Gaston County, NC (0.8%)
h. Cabarrus County, NC
i. Union County NC
j. None of the above (1.3%)

71
Questions:
1. If Winthrop does start a football program, please tell us how you would support the
program by rating your agreement with the following statements.
1
Strongly
Disagree
2
Disagree
3
Neither
Agree nor
Disagree
4
Agree
5
Strongly
Agree
Mean
N
I would attend
home games.
1.7% 2.5% 5.7% 36.0% 54.1% 4.38 403
I would attend
out-of-town
games.
7.0% 13.0% 35.7% 24.9% 19.5% 3.37 401
I would proudly
buy Winthrop
University
merchandise to
show my support
for the team.
2.2% 3.2% 9.7% 34.4% 50.2% 4.40 404
I believe my
attachment to
Winthrop
University
would increase if
they had a
football
program.
3.5% 2.5% 14.0% 26.9% 53.1% 4.24 401
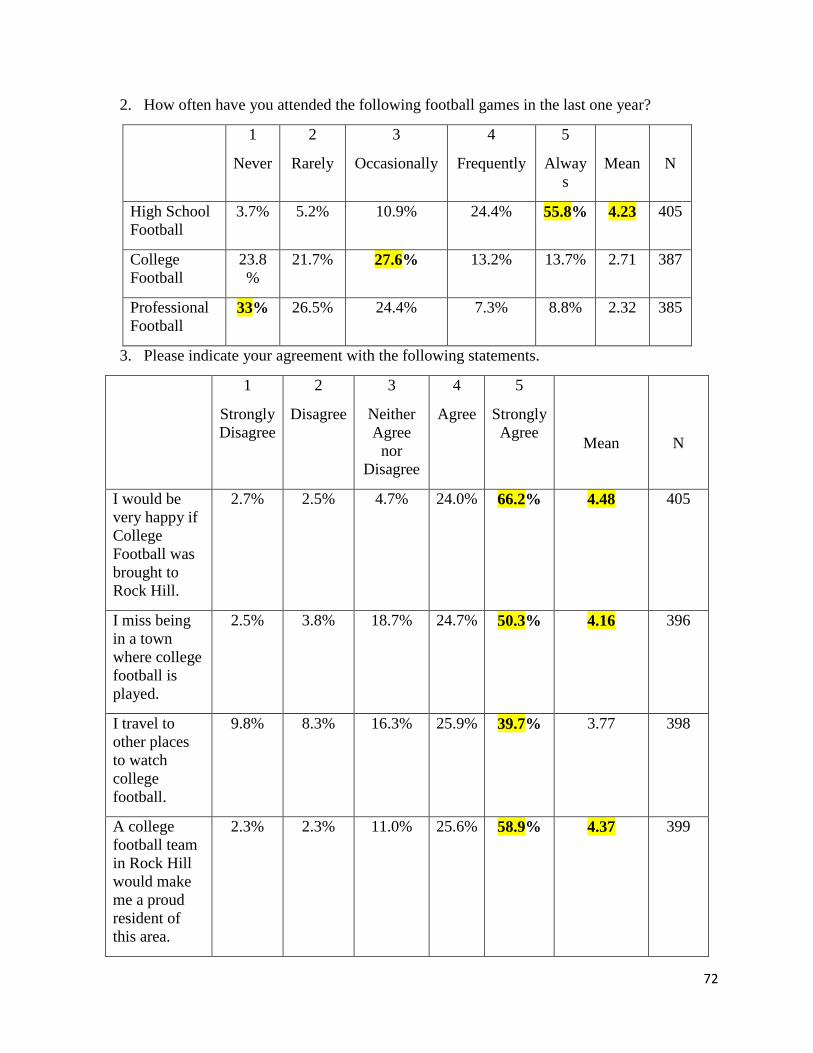
72
2. How often have you attended the following football games in the last one year?
1
Never
2
Rarely
3
Occasionally
4
Frequently
5
Alway
s
Mean
N
High School
Football
3.7% 5.2% 10.9% 24.4% 55.8% 4.23 405
College
Football
23.8
%
21.7% 27.6% 13.2% 13.7% 2.71 387
Professional
Football 33% 26.5% 24.4% 7.3% 8.8% 2.32 385
3. Please indicate your agreement with the following statements.
1
Strongly
Disagree
2
Disagree
3
Neither
Agree
nor
Disagree
4
Agree
5
Strongly
Agree
Mean
N
I would be
very happy if
College
Football was
brought to
Rock Hill.
2.7% 2.5% 4.7% 24.0% 66.2% 4.48 405
I miss being
in a town
where college
football is
played.
2.5% 3.8% 18.7% 24.7% 50.3% 4.16 396
I travel to
other places
to watch
college
football.
9.8% 8.3% 16.3% 25.9% 39.7% 3.77 398
A college
football team
in Rock Hill
would make
me a proud
resident of
this area.
2.3% 2.3% 11.0% 25.6% 58.9% 4.37 399

73
4. Please indicate your agreement with the following statements.
1
Strongly
Disagree
2
Disagree
3
Neither
Agree nor
Disagree
4
Agree
5
Strongly
Agree
Mean
N
I love the idea of a
Winthrop
University football
program.
3.5% 1.7% 4.9% 23.5% 66.4% 4.48 405
I believe a
Winthrop
University football
program would
bring the Rock Hill
community
together.
2.5% 2.0% 8.4% 22.3% 64.8% 4.45 403
I am proud to be a
part of the Rock
Hill community.
1.3% 0.8% 4.1% 27.9% 65.9% 4.56 390
I feel a sense of
attachment to
Winthrop
University.
1.3% 2.6% 19.6% 31.7% 44.8% 4.16 388
I am happy that we
have Winthrop
University as an
integral part of the
Rock Hill
community.
0.8% 0.5% 6.4% 31.5% 60.5% 4.63 390
I think Winthrop
University plays a
very important role
in the Rock Hill
community.
1.5% 1.0% 4.4% 30.6% 62.5% 4.51 389

74
5. How much would you be willing to pay for a Winthrop University game ticket $______
Mean: $ 22.0557; Mode: $ 10 (15.5%)
Other notable numbers: $5 (6.8%); $15 (11.5%); $20 (11.1%); $25 (13.3%); $30 (10.2%); $40
(3.7%); $ 50 (8.7%)
What is the highest price you would be willing to pay for a ticket to a
Winthrop University football game?
Mean = $22.06 Mode = $10
$5 $10 $15 $20 $25 $30 $40 $50
% of
respondents
6.8% 15.5% 11.5% 11.1% 13.3% 10.2% 3.7% 8.7%

75
Faculty/Staff Survey
Respondent demographics:
Responses were spread fairly evenly across the campus. The following is the composition of the
respondents (the mode is shaded yellow):
Question Frequency percent
1. Length of tenure at Winthrop
1–5 yrs. 25%
6-10 yrs. 22%
11-15 yrs. 19%
Above 20 yrs.16%
2. Faculty or staff Faculty: 47%
Staff: 53%
3. Faculty breakdown Full professor: 29%
Associate Professor: 25%
Assistant Professor: 20%
Adjunct/Instructor: 24%
4. Faculty college association CAS: 44%
CVPA: 19%
CBA: 14%
CoE: 18%
5. Gender Male: 41%
Female: 59%
6. Ethnicity: Caucasian: 87%

76
Frequency distributions for each survey question (frequencies in percentages), the mode (shaded
yellow) and the mean (if applicable), are given below:
Question Frequency percent
1. Is starting a football
program at Winthrop a good
idea?
Yes: 25%
No: 42%
Conditional Yes: 33%
2. What impact will a football
program have on faculty and
staff involvement?
1. Definite negative Impact: 12%
2. Probable negative impact: 13%
3. Neutral: 34%
4. Probable positive Impact: 28%
5. Definite positive impact: 13%
Mean: 3.17 / Mode: Neutral
3. Will a football program
increase student enrollment?
1. Definitely not: 5%
2. Probably not: 26%
3. No opinion: 11%
4. Probably will: 40%
5. Definitely will: 19%
Mean: 3.43 / Mode: “Probably will”
4. Will a football program
increase student retention?
1. Definitely not: 10%
2. Probably not: 39%
3. No opinion: 16%
4. Probably will: 27%
5. Definitely will: 9%
Mean: 2.86 / Mode: “Probably Not”
5. Will a football program
change the Winthrop culture?
1. Definitely for the worse: 8%
2. Probably for the worse: 29%
3. No impact: 13%
4. Probably for the better: 39%

77
5. Definitely for the better: 11%
Mean: 3.15 / Mode: “Probably for the
better”
6. Will a football program
result in greater student pride
in Winthrop?
1. Definitely not: 5%
2. Probably not: 20%
3. No opinion: 16%
4. Probably will: 39%
5. Definitely will: 21%
Mean: 3.51 / Mode: “Probably will”
7. Will a football program
increase student involvement?
1. Definitely not: 3%
2. Probably not: 24%
3. No opinion: 12%
4. Probably will: 41%
5. Definitely will: 21%
Mean: 3.52 / Mode: “Probably will”
8. Will a football program
attract support from Rock Hill
and York county
communities?
1. Definitely not: 4%
2. Probably not: 16%
3. No opinion: 10%
4. Probably will: 40%
5. Definitely will: 30%
Mean: 3.75 / Mode: “Probably will”
9. Will a football program
attract private donations and
sponsorships?
1. Definitely not: 5%
2. Probably not: 29%
3. No opinion: 21%
4. Probably will: 30%
5. Definitely will: 16%
Mean: 3.23 / Dual Mode: “Probably not”
and “Probably will”
10. Will a football program
bring down education
standards?
1. Definitely not: 15%
2. Probably not: 37%

78
3. No opinion: 13%
4. Probably will: 26%
5. Definitely will: 9%
6. Mean: 2.77 / Mode: “Probably not”
11. Will a football program
adversely impact campus
security and safety?
1. Definitely not: 10%
2. Probably not: 42%
3. No opinion: 18%
4. Probably will: 25%
5. Definitely will: 6%
Mean: 2.76 / Mode: “Probably not”
12. What is the importance of
adding additional sports,
including football,
considering other priorities?
1. Very Unimportant: 30%
2. Unimportant: 24%
3. Neutral: 20%
4. Important: 20%
5. Very important: 5%
Mean: 2.46 / Mode: “Very Unimportant”
13. What do you think will be
the annual cost of a football
program at Winthrop?
“I don’t know: 69%
14. What is the maximum
annual financial support the
university should commit to a
football program?
“I don’t know” : 71%

79
Alumni Survey
Respondent demographics:
Responses came mainly from more recent graduates. Respondents were mainly females (62.4%),
Caucasian (76.1%), alumni of the College of Arts and Science (42.8%), and lived in York
County (26.4%). The modal age group was 25 – 34 years. (33%) and the modal annual income
was $25,000-$50,000 (30.4%).
Question Frequency percent
1. What was your year of
graduation?
2015: 6.7%
2014: 4.3%
2013: 4.3%
2012: 3.9%
2011: 3.5%
2010: 2.8%
2009: 3.4%
2008: 2.4%
Responses from recent graduates
were generally higher.
2. Where do you live? York County: 26.4%
Greater Charlotte region: 12.5%
Greater Columbia region: 10.6%
Greenville-Spartanburg region:
11.3%
Other: 39.3%
3. What is your annual Income? Below $25,000: 7.1%
$25,000 - $50,000: 30.4%
$51,000 - $75,000: 24.1%
$76,000 - $100,000: 15.8%
More than $100,000: 22.6%
4. What is your age group? Below 25 years.: 9.7%
25 – 34 years.: 33%

80
35 – 44 years.: 21.7%
45 – 54 years. :16.9%
55 – 64 years.: 9.6%
Above 64 years.: 9.1%
5. Of which college are you a
graduate?
CAS: 42.8%
CVPA: 7.4%
CBA: 26.9%
CoE: 22.7%
UC: 0.2%
6. What is your gender? Male: 37.3%
Female: 62.4%
7. What is your ethnicity? Caucasian: 76.1%
African America: 20.1%
Other: 3.8%
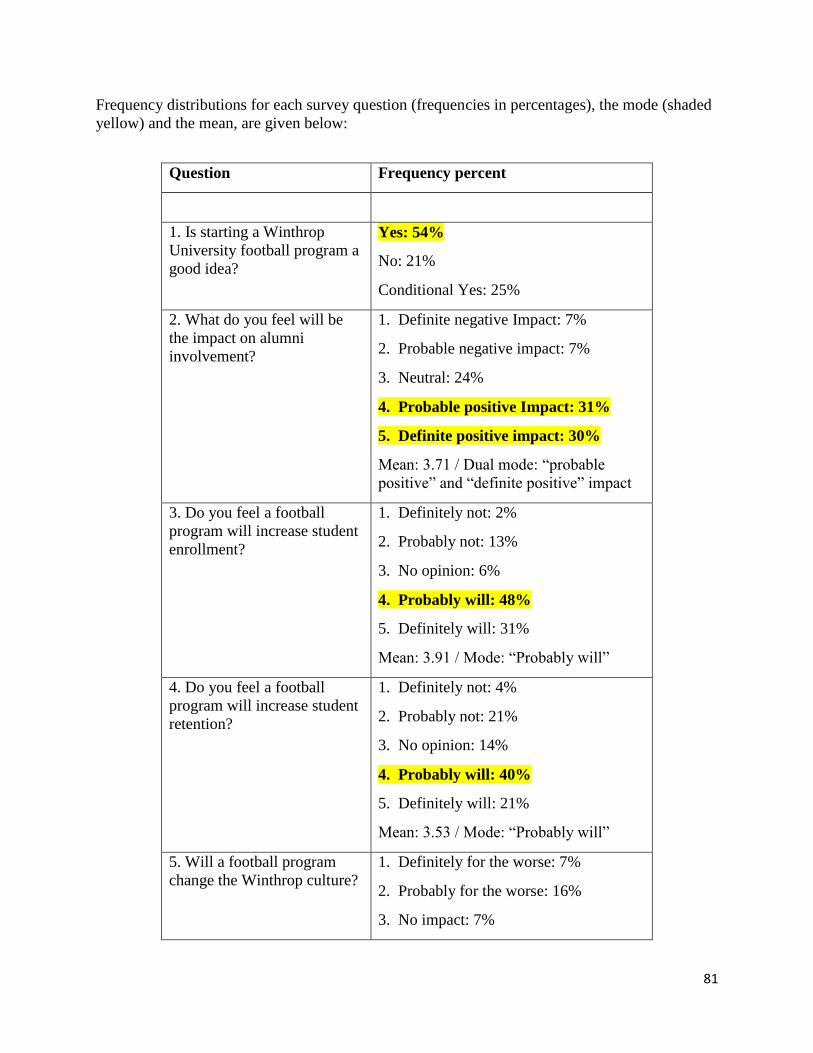
81
Frequency distributions for each survey question (frequencies in percentages), the mode (shaded
yellow) and the mean, are given below:
Question Frequency percent
1. Is starting a Winthrop
University football program a
good idea?
Yes: 54%
No: 21%
Conditional Yes: 25%
2. What do you feel will be
the impact on alumni
involvement?
1. Definite negative Impact: 7%
2. Probable negative impact: 7%
3. Neutral: 24%
4. Probable positive Impact: 31%
5. Definite positive impact: 30%
Mean: 3.71 / Dual mode: “probable
positive” and “definite positive” impact
3. Do you feel a football
program will increase student
enrollment?
1. Definitely not: 2%
2. Probably not: 13%
3. No opinion: 6%
4. Probably will: 48%
5. Definitely will: 31%
Mean: 3.91 / Mode: “Probably will”
4. Do you feel a football
program will increase student
retention?
1. Definitely not: 4%
2. Probably not: 21%
3. No opinion: 14%
4. Probably will: 40%
5. Definitely will: 21%
Mean: 3.53 / Mode: “Probably will”
5. Will a football program
change the Winthrop culture?
1. Definitely for the worse: 7%
2. Probably for the worse: 16%
3. No impact: 7%

82
4. Probably for the better: 47%
5. Definitely for the better: 24%
Mean: 3.68 / Mode: “Probably for the
better”
6. Will a football program
result in greater student pride
in Winthrop?
1. Definitely not: 3%
2. Probably not: 11%
3. No opinion: 7%
4. Probably will: 35%
5. Definitely will: 44%
Mean: 4.06 / Mode: “Definitely will”
7. Will a football program
increase student involvement
at Winthrop?
1. Definitely not: 2%
2. Probably not: 1%
3. No opinion: 6%
4. Probably will: 39%
5. Definitely will: 42%
Mean: 4.07 / Mode: “Definitely will”
8. Will a football program
attract support from Rock Hill
and York county
communities?
1. Definitely not: 1%
2. Probably not: 7%
3. No opinion: 6%
4. Probably will: 35%
5. Definitely will: 51%
Mean: 4.26 / Mode: “Definitely will”
9. Will a football program
attract private donations and
sponsorships?
1. Definitely not: 2%
2. Probably not: 11%
3. No opinion: 13%
4. Probably will: 40%
5. Definitely will: 34%
Mean: 3.92 / Mode: “Probably will”

83
10. Will a football program
bring down education
standards?
Definitely not: 31%
1. 1. Probably not: 38%
2. 2. No opinion: 9%
3. Probably will: 16%
4. Definitely will: 7%
Mean: 2.31 / Mode: “Probably not”
11. Will a football program
adversely impact campus
security and safety?
1. Definitely not: 18%
2. Probably not: 42%
3. No opinion: 17%
4. Probably will: 17%
5. Definitely will: 6%
Mean: 2.51 / Mode: “Probably not”
12. What is the importance of
adding additional sports,
including football,
considering other priorities?
1. Very Unimportant: 12%
2. Unimportant: 16%
3. Neutral: 21%
4. Important: 37%
5. Very important: 14%
Mean: 3.25 / Mode: “Important”
13. What is the likelihood of a
football program increasing
your support via donations
and sponsorships?
1. Very unlikely: 27.9%
2. Unlikely: 13.4%
3. Undecided: 22.6%
4. Likely: 24.3%
5. Very likely: 11.8%
Mean: 2.79
Mode: “Very unlikely”
14. What is the likelihood of
you providing support to a
football program by attending
home games?
1. Very unlikely: 16.2%
2. Unlikely: 9.2%
3. Undecided: 7.8%
4. Likely: 32.9%
5. Very likely: 33.9%

84
Mean: 3.59
Mode: Dual Mode: “likely” and “very
likely”
15. What is the likelihood of
you providing support to a
football program by attending
out-of-town games?
1. Very unlikely: 23.8%
2. Unlikely: 17.8%
3. Undecided: 23.8%
4. Likely: 26.8%
5. Very likely: 7.8%
Mean: 2.77
Mode: “Likely”
16. What is the likelihood of
you supporting a football
program by buying season
tickets?
1. Very unlikely: 29.3%
2. Unlikely: 19.9%
3. Undecided: 21.4%
4. Likely: 18.3%
5. Very likely: 11.1%
Mean: 2.62
Mode: “Very unlikely”
17. What is the likelihood of
you supporting a football
program by buying Winthrop
merchandise?
1. Very unlikely: 15.8%
2. Unlikely: 5.1%
3. Undecided: 7.9%
4. Likely: 34.9%
5. Very likely: 36.3%
Mean: 3.71
Mode: “Very likely”
18. What is the likelihood of
you supporting a football
program by joining the Eagle
Club?
1. Very unlikely: 20.9%
2. Unlikely: 11.9%
3. Undecided: 27.5%
4. Likely: 24.6%
5. Very likely: 15%

85
Mean: 3.00
Mode: “Undecided”
19. What is the likelihood of
you providing support to a
football program by
promoting it among friends,
etc.?
1. Very unlikely: 16.4%
2. Unlikely: 6.1%
3. Undecided: 8.5%
4. Likely: 33.5%
5. Very likely: 35.5%
Mean: 3.66
Mode: “Very likely”
Overall Support (Combined
variable)
Mean: 3.15 (closer to neutral position)
20. How much would you be
willing to pay for a ticket to a
Winthrop home football
game?
Mean: $25/- (15.6%)
Mode: $20/- (17.4%)
Other notables: $50: 7.5%; $40: 5.7%;
$35: 5%; $30: 9.8%; $15: 9.7%

86
Counties
Attended sports
events: football
game (college)
Attended sports
events: football game
(college) (%)
Attended sports
events: football
game (college)
(Index)*
Abbeville County, SC 943 4.78% 85
Aiken County, SC 7,473 5.73% 102
Alexander County, NC 1,448 4.75% 84
Anderson County, SC 7,891 5.31% 94
Anderson County, TN 3,417 5.65% 100
Anson County, NC 939 4.41% 78
Bristol city, VA 780 5.58% 99
Burke County, NC 3,516 4.85% 86
Cabarrus County, NC 9,828 6.91% 123
Caldwell County, NC 3,227 4.96% 88
Calhoun County, SC 540 4.48% 80
Catawba County, NC 6,712 5.56% 99
Cherokee County, SC 2,009 4.63% 82
Chester County, SC 1,133 4.38% 78
Chesterfield County, SC 1,669 4.58% 81
Cleveland County, NC 3,772 4.85% 86
Darlington County, SC 2,525 4.75% 84
Davidson County, NC 6,967 5.41% 96
Davie County, NC 1,978 6.02% 107
Fairfield County, SC 882 4.63% 82
Florence County, SC 5,576 5.23% 93
Forsyth County, GA 12,464 8.58% 152
Forsyth County, NC 17,713 6.33% 112
Gaston County, NC 9,013 5.49% 97
Greenville County, SC 23,776 6.44% 114
Greenwood County, SC 2,819 5.24% 93
Guilford County, NC 25,288 6.41% 114
Henderson County, NC 5,179 5.77% 102
Iredell County, NC 7,964 6.21% 110
Kershaw County, SC 2,708 5.56% 99
Lancaster County, SC 3,135 4.87% 86
Laurens County, SC 2,478 4.76% 84
Lee County, SC 600 4% 71
Lexington County, SC 13,427 6.27% 111
Lincoln County, NC 3,463 5.55% 98
Marlboro County, SC 1,068 4.62% 82
McDowell County, NC 1,779 4.81% 85
Mecklenburg County, NC 50,647 6.71% 119
Montgomery County, NC 957 4.4% 78
Newberry County, SC 1,504 5.07% 90
Orangeburg County, SC 3,374 4.73% 84
Pickens County, SC 5,689 5.82% 103
Polk County, NC 885 5.09% 90
Randolph County, NC 5,676 5.13% 91
Richland County, SC 20,017 6.32% 112
Richmond County, NC 1,572 4.39% 78
Rowan County, NC 5,375 4.95% 88
Rutherford County, NC 2,686 4.93% 87
Saluda County, SC 729 4.65% 83
Sampson County, NC 2,279 4.64% 82
Scotland County, NC 1,236 4.38% 78
Spartanburg County, SC 12,487 5.51% 98
Stanly County, NC 2,516 5.19% 92
Sumter County, SC 4,218 5.12% 91
Surry County, NC 2,878 4.99% 88
Union County, NC 11,627 7.44% 132
Union County, SC 988 4.45% 79
Wilkes County, NC 2,814 5.04% 89
Wilson County, NC 3,437 5.45% 97
Yadkin County, NC 1,430 4.71% 84
York County, SC 11,764 6.45% 114
Attended Sports Events: College Football Games
*NOTE: Index based on 100. An index of 120 means the people in that county are 20% more
likely to engage in the activity than the average person.
Breakdown by County - Number, Percentage and Index

87
Counties
Attended sports
events: football
game - NFL
weekend
Attended sports
events: football
game - NFL
weekend (%)
Attended sports
events: football
game - NFL weekend
(Index)*
Abbeville County, SC 513 2.6% 56
Aiken County, SC 5,126 3.93% 85
Alexander County, NC 845 2.77% 60
Anderson County, SC 5,209 3.5% 75
Anderson County, TN 2,205 3.64% 78
Anson County, NC 490 2.3% 50
Bristol city, VA 548 3.92% 84
Burke County, NC 2,297 3.17% 68
Cabarrus County, NC 7,245 5.09% 110
Caldwell County, NC 2,061 3.17% 68
Calhoun County, SC 288 2.39% 51
Catawba County, NC 4,473 3.7% 80
Cherokee County, SC 1,240 2.86% 62
Chester County, SC 622 2.41% 52
Chesterfield County, SC 906 2.49% 53
Cleveland County, NC 2,323 2.98% 64
Darlington County, SC 1,500 2.82% 61
Davidson County, NC 4,751 3.69% 79
Davie County, NC 1,351 4.11% 88
Fairfield County, SC 491 2.58% 56
Florence County, SC 3,672 3.44% 74
Forsyth County, GA 9,218 6.34% 137
Forsyth County, NC 12,695 4.54% 98
Gaston County, NC 6,543 3.99% 86
Greenville County, SC 16,701 4.52% 97
Greenwood County, SC 2,009 3.73% 80
Guilford County, NC 18,231 4.62% 99
Henderson County, NC 3,734 4.16% 89
Iredell County, NC 5,781 4.51% 97
Kershaw County, SC 1,649 3.38% 73
Lancaster County, SC 1,983 3.08% 66
Laurens County, SC 1,542 2.96% 64
Lee County, SC 323 2.15% 46
Lexington County, SC 8,988 4.2% 90
Lincoln County, NC 2,365 3.79% 82
Marlboro County, SC 568 2.46% 53
McDowell County, NC 1,005 2.72% 58
Mecklenburg County, NC 41,660 5.52% 119
Montgomery County, NC 613 2.82% 61
Newberry County, SC 1,011 3.41% 73
Orangeburg County, SC 2,005 2.81% 60
Pickens County, SC 3,378 3.46% 74
Polk County, NC 524 3.02% 65
Randolph County, NC 3,567 3.22% 69
Richland County, SC 14,345 4.53% 98
Richmond County, NC 973 2.72% 58
Rowan County, NC 3,566 3.28% 71
Rutherford County, NC 1,545 2.83% 61
Saluda County, SC 425 2.71% 58
Sampson County, NC 1,317 2.68% 58
Scotland County, NC 759 2.69% 58
Spartanburg County, SC 8,347 3.68% 79
Stanly County, NC 1,610 3.32% 72
Sumter County, SC 2,749 3.34% 72
Surry County, NC 1,777 3.08% 66
Union County, NC 8,385 5.37% 116
Union County, SC 549 2.47% 53
Wilkes County, NC 1,546 2.77% 60
Wilson County, NC 2,575 4.08% 88
Yadkin County, NC 849 2.8% 60
York County, SC 8,254 4.52% 97
Attended Sports Events: Football Games - NFL WeekendBreakdown by County - Number, Percentage and Index
*NOTE: Index based on 100. An index of 120 means the people in that county are 20% more
likely to engage in the activity as the average person.
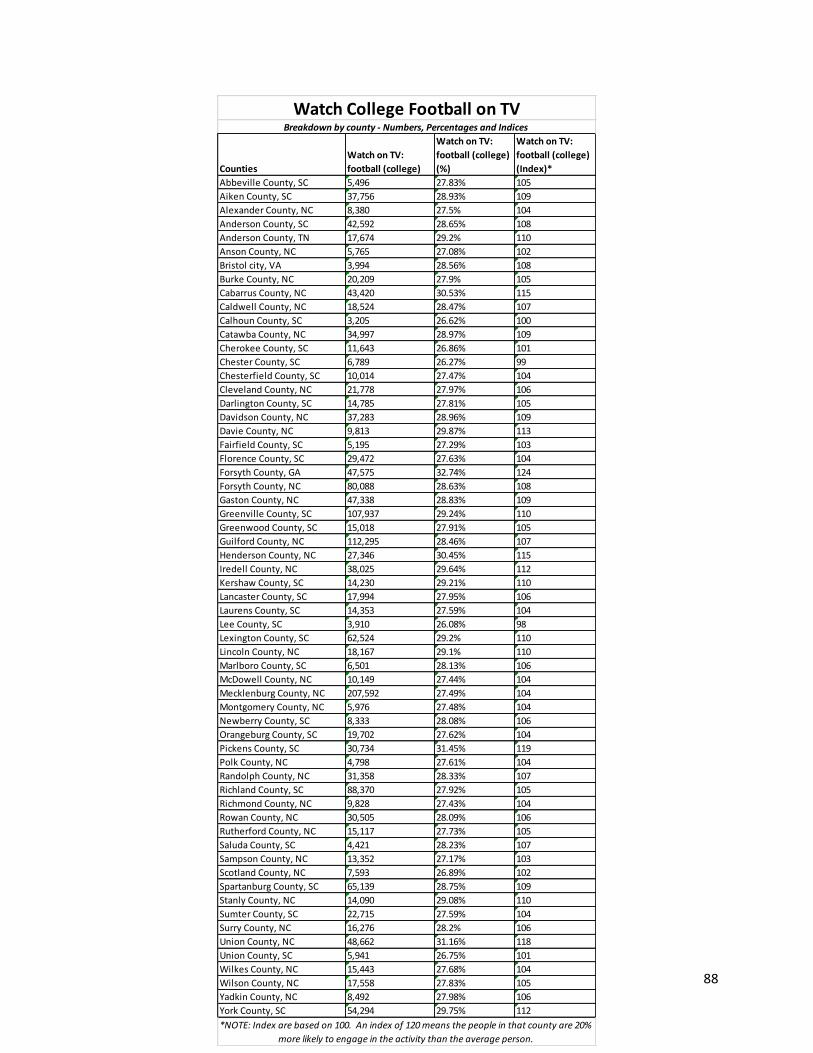
88
Counties
Watch on TV:
football (college)
Watch on TV:
football (college)
(%)
Watch on TV:
football (college)
(Index)*
Abbeville County, SC 5,496 27.83% 105
Aiken County, SC 37,756 28.93% 109
Alexander County, NC 8,380 27.5% 104
Anderson County, SC 42,592 28.65% 108
Anderson County, TN 17,674 29.2% 110
Anson County, NC 5,765 27.08% 102
Bristol city, VA 3,994 28.56% 108
Burke County, NC 20,209 27.9% 105
Cabarrus County, NC 43,420 30.53% 115
Caldwell County, NC 18,524 28.47% 107
Calhoun County, SC 3,205 26.62% 100
Catawba County, NC 34,997 28.97% 109
Cherokee County, SC 11,643 26.86% 101
Chester County, SC 6,789 26.27% 99
Chesterfield County, SC 10,014 27.47% 104
Cleveland County, NC 21,778 27.97% 106
Darlington County, SC 14,785 27.81% 105
Davidson County, NC 37,283 28.96% 109
Davie County, NC 9,813 29.87% 113
Fairfield County, SC 5,195 27.29% 103
Florence County, SC 29,472 27.63% 104
Forsyth County, GA 47,575 32.74% 124
Forsyth County, NC 80,088 28.63% 108
Gaston County, NC 47,338 28.83% 109
Greenville County, SC 107,937 29.24% 110
Greenwood County, SC 15,018 27.91% 105
Guilford County, NC 112,295 28.46% 107
Henderson County, NC 27,346 30.45% 115
Iredell County, NC 38,025 29.64% 112
Kershaw County, SC 14,230 29.21% 110
Lancaster County, SC 17,994 27.95% 106
Laurens County, SC 14,353 27.59% 104
Lee County, SC 3,910 26.08% 98
Lexington County, SC 62,524 29.2% 110
Lincoln County, NC 18,167 29.1% 110
Marlboro County, SC 6,501 28.13% 106
McDowell County, NC 10,149 27.44% 104
Mecklenburg County, NC 207,592 27.49% 104
Montgomery County, NC 5,976 27.48% 104
Newberry County, SC 8,333 28.08% 106
Orangeburg County, SC 19,702 27.62% 104
Pickens County, SC 30,734 31.45% 119
Polk County, NC 4,798 27.61% 104
Randolph County, NC 31,358 28.33% 107
Richland County, SC 88,370 27.92% 105
Richmond County, NC 9,828 27.43% 104
Rowan County, NC 30,505 28.09% 106
Rutherford County, NC 15,117 27.73% 105
Saluda County, SC 4,421 28.23% 107
Sampson County, NC 13,352 27.17% 103
Scotland County, NC 7,593 26.89% 102
Spartanburg County, SC 65,139 28.75% 109
Stanly County, NC 14,090 29.08% 110
Sumter County, SC 22,715 27.59% 104
Surry County, NC 16,276 28.2% 106
Union County, NC 48,662 31.16% 118
Union County, SC 5,941 26.75% 101
Wilkes County, NC 15,443 27.68% 104
Wilson County, NC 17,558 27.83% 105
Yadkin County, NC 8,492 27.98% 106
York County, SC 54,294 29.75% 112
Watch College Football on TVBreakdown by county - Numbers, Percentages and Indices
*NOTE: Index are based on 100. An index of 120 means the people in that county are 20%
more likely to engage in the activity than the average person.

89
Counties
Participated in
football in /12
mos
Participated in
football in /12
mos (%)
Participated in
football in /12 mos
(Index)
Abbeville County, SC 896 4.54% 91
Aiken County, SC 6,248 4.79% 96
Alexander County, NC 1,297 4.26% 85
Anderson County, SC 7,351 4.94% 99
Anderson County, TN 2,750 4.54% 91
Anson County, NC 1,001 4.7% 94
Bristol city, VA 596 4.26% 85
Burke County, NC 3,210 4.43% 89
Cabarrus County, NC 7,702 5.42% 108
Caldwell County, NC 2,921 4.49% 90
Calhoun County, SC 550 4.57% 91
Catawba County, NC 5,748 4.76% 95
Cherokee County, SC 2,202 5.08% 101
Chester County, SC 1,212 4.69% 94
Chesterfield County, SC 1,763 4.84% 97
Cleveland County, NC 3,605 4.63% 93
Darlington County, SC 2,583 4.86% 97
Davidson County, NC 6,300 4.89% 98
Davie County, NC 1,454 4.43% 88
Fairfield County, SC 969 5.09% 102
Florence County, SC 5,446 5.11% 102
Forsyth County, GA 7,779 5.35% 107
Forsyth County, NC 15,057 5.38% 108
Gaston County, NC 8,356 5.09% 102
Greenville County, SC 18,851 5.11% 102
Greenwood County, SC 2,716 5.05% 101
Guilford County, NC 22,447 5.69% 114
Henderson County, NC 3,777 4.21% 84
Iredell County, NC 6,413 5% 100
Kershaw County, SC 2,327 4.78% 95
Lancaster County, SC 2,988 4.64% 93
Laurens County, SC 2,389 4.59% 92
Lee County, SC 789 5.26% 105
Lexington County, SC 10,159 4.74% 95
Lincoln County, NC 2,889 4.63% 92
Marlboro County, SC 1,147 4.96% 99
McDowell County, NC 1,605 4.34% 87
Mecklenburg County, NC 42,020 5.56% 111
Montgomery County, NC 978 4.5% 90
Newberry County, SC 1,453 4.9% 98
Orangeburg County, SC 3,665 5.14% 103
Pickens County, SC 5,220 5.34% 107
Polk County, NC 771 4.44% 89
Randolph County, NC 4,956 4.48% 89
Richland County, SC 17,308 5.47% 109
Richmond County, NC 1,808 5.05% 101
Rowan County, NC 5,304 4.88% 98
Rutherford County, NC 2,370 4.35% 87
Saluda County, SC 700 4.47% 89
Sampson County, NC 2,162 4.4% 88
Scotland County, NC 1,388 4.92% 98
Spartanburg County, SC 11,597 5.12% 102
Stanly County, NC 2,268 4.68% 94
Sumter County, SC 4,132 5.02% 100
Surry County, NC 2,520 4.37% 87
Union County, NC 8,293 5.31% 106
Union County, SC 1,043 4.7% 94
Wilkes County, NC 2,430 4.36% 87
Wilson County, NC 3,284 5.21% 104
Yadkin County, NC 1,335 4.4% 88
York County, SC 9,685 5.31% 106
Participated in Football in the Last 12 MonthsBreakdown by Count - Number, Percentage, an Index
*NOTE: Index based on 100. An index of 120 means the people in the county are
20% more likely to engage in the activity than the average person.

90
Data from Cohort Analyses
Football Cohort 2001 2014 2001 2014 2001 2014 2004 2014
Campbell University 2,884 6,770 834 881 4,222 3,449 82% 72%
Coastal Carolina University 2,533 14,799 792 2,375 4,007 8,502 70% 67%
Georgia State University 8,134 12,858 2,200 3,701 11,594 18,982 83% 81%
Lamar University 2,101 4,572 1,340 1,403 6,662 6,460 65% 60%
Mercer University 2,771 4,375 656 807 3,961 3,833 83% 80%
Old Dominion University 6,162 9,161 1,455 2,795 8,741 15,261 78% 81%
Stetson University 1,940 10,986 529 773 2,063 2,804 78% 79%
University of North Carolina - Charlotte 7,533 15,610 2,203 3,319 11,340 18,983 77% 82%
University of South Alabama 2,647 5,465 1,457 2,073 5,979 9,090 72% 71%
University of Texas - San Antonio 4,791 14,933 2,586 5,057 12,003 20,248 62% 64%
Non - Football Cohort
College of Charleston 8,356 11,179 1,974 2,166 8,960 9,608 82% 79%
George Mason University 8,106 22,532 2,146 3,080 11,329 17,818 81% 88%
High Point University 1,507 7,410 437 1,386 2,315 4,165 73% 77%
Longwood University 2,792 4,593 895 1,103 3,440 4,183 77% 79%
Radford University 6,021 7,737 1,877 2,015 7,526 8,507 76% 75%
University of North Carolina - Asheville 1,858 3,090 455 633 2,485 3,183 80% 77%
University of North Carolina - Greensboro 6,729 10,040 1,894 2,593 8,710 12,773 77% 78%
University of North Carolina - Wilmington 7,466 11,523 1,673 2,159 8,762 11,690 86% 84%
University of North Florida 6,314 11,154 1,781 1,862 7,205 9,901 78% 83%
University of South Carolina - Upstate 1,558 4,069 616 801 2,911 4,218 66% 73%
University of Teaxas - Arlington 4,376 10,245 1,965 2,714 11,185 15,957 69% 69%
Virginia Commonwealth University 7,071 13,758 2,729 3,531 12,073 20,056 79% 86%
Winthrop University 3,019 4,546 907 1,019 4,201 4,421 76% 77%
Applications Freshman Enrollment
Total Full-Time
Undergraduate Enrollment Full-Time Retention Rate