winter outlook report 1 winter outlook report · 2017-07-08 · winter outlook report 1 foreword...
TRANSCRIPT

Winter Outlook Report 1
2015/16
Amended 26 October 2015
Winter Outlook Report

Contents
Foreword 1Executive summary 2Stakeholder engagement 6Electricity: Winter Outlook 10Winter view 12Operational view 18Operational toolbox 24Interconnected markets 29Gas: Winter Outlook 32Gas demand 33Gas supply 40Fuel prices 45Winter security assessment: gas 48Safety Monitors 54Operational challenges 56Gas/electricity interaction 63Glossary 68

Winter Outlook Report 1
Foreword
Welcome to our 2015 Winter Outlook Report, which includes our latest detailed analysis on the supply and demand position of both gas and electricity for the coming winter.
Each year our outlook reports evolve to reflect our stakeholders’ feedback, as we endeavour to create better tools for you. We have made some changes to the structure and content of the report this year. We hope you’ll find it easier to understand and access the information you need.
The Winter Review showed that our analysis of winter 2014/15 was well informed and accurate, shaped by the feedback received from a wide cross-section of stakeholders. I’d like to thank those companies and organisations who responded to this year’s Consultation and have engaged with us throughout the year. Your views are important in ensuring that we continue to add value through developing our understanding of our stakeholder requirements for the winter period.
As the GB System Operator, part of our role is to provide credible analysis of how the energy sector might look based on the latest information available to us. This report draws together analysis and feedback from across the industry to present robust data and help optimise availability for the coming winter by ensuring the market is fully informed.
Our analysis suggests that electricity margins will continue to be tight but manageable throughout the winter period. We have taken appropriate steps to support security of supply through the procurement of additional balancing services and believe that we have the correct tools in place to effectively operate the system whilst continuing to ensure value for money for consumers.
For gas, we expect that the UK will be well supplied this winter. We continue to consider how geopolitical events might impact upon supply but with a wide range of supply sources believe that the market is well positioned to respond.
To continue to improve how we engage with you, we’ll be publishing our review of winter 2015/16 earlier than usual, in spring next year. The consultation process will be launched separately in summer 2016.
Thank you for taking the time to read this year’s report. Please continue to help us make our outlook reports as useful as they can be by telling us what you think.
You can join the debate in real time on Twitter using #NGWinterOutlook, on our LinkedIn Future of Energy page or email us at [email protected]
Cordi O’Hara Director, UK System Operator

2
Executive summaryThe Winter Outlook Report (WOR) is an annual publication delivered by National Grid that shows the expected security of supply position on both the gas and electricity system for the coming winter. It is the product of the winter consultation process and is based on data supplied by the industry, market insight and analysis. It helps us to fulfil our role as market facilitator and is designed to consult, inform and enable the market to respond in preparation for the coming winter.
Overview: Electricity winter 2015/16
Electricity margins are manageable and remain unchanged from those published in the Winter Review and Future Energy Scenarios document. We have a range of tools available to support security of supply and help balance the system. The loss of load expectation (LOLE) for winter 2015/16 is 1.1 hours/year, which is equivalent to a de-rated capacity margin of 5.1%.
The winter view analysis has informed our procurement of additional contingency balancing reserve. These additional balancing services are in place and there is an increased likelihood we will use these tools to help us balance the system over the winter period.
Improving the Winter Outlook Report
Based on stakeholder feedback, received as part of the consultation process, we have simplified the analysis carried out regarding electricity security of supply. Analysis is now presented in two sections, the winter view and the operational view.
Winter view: this is a probabilistic assessment of security of supply for the whole winter period. It is based on our Future Energy Scenarios, published in July 2015. The winter view helps us to prepare for winter and assess the balancing services we need to procure so we have the right tools in place to balance the system.
Operational view: this is a week by week analysis of operational surplus across the winter. The operational view shown in this report is a snapshot of the latest dynamic data we have from generators at the time of publication. We will be continually reviewing the operational view data throughout the winter period and remain vigilant regarding security of supply.
The data underpinning this operational view is updated regularly and is available throughout the year on the BM Reports website1.
1 http://www.bmreports.com/

3Winter Outlook Report 3Winter Outlook Report
5.1% De-rated capacity margin
1.1 hours/year Loss of load expectation
2.43 GWAdditional balancing services procured

4
Overview: Gas winter 2015/16
Great Britain benefits from highly diverse and flexible sources of gas supply. Analysis shows GB supplies can meet gas demand even under severe weather conditions for an extended period of time.
Gas demand over the full winter period is expected to be broadly in line with last year, showing a slight increase to 48.6 bcm with a peak demand forecast (1-in-20) of 465 mcm/d.
The maximum potential Non Storage Supply (NSS) is 467 mcm/d which, when combined with current storage deliverability of 146 mcm/d, gives a maximum supply potential of 613 mcm/d. This is significantly higher than the peak day forecast and the 1-in-20 forecast.
For gas supply the provisional UK Continental Shelf maximum supply forecast is expected to be in line with winter 2014/15 as are Norwegian imports. There is more uncertainty over continental supplies this year due to production restrictions at Groningen in the Netherlands which may restrict imports through the BBL pipeline.
Although overall storage capacity has reduced due to constraints at the Rough and Hornsea sites we expect other supplies to replace this. Storage withdrawal capability, which is the maximum amount that can be delivered on a daily basis, has increased from last winter due to two new medium range sites coming online, giving more flexibility to respond to any short-term supply constraints. This should allow storage to be more responsive to short-term supply and demand fluctuations but does increase the risk of stocks running low in the case of an extended cold spell. If this were to occur we would expect imports to increase as has been the case in the past.
With new liquefaction plants coming online, global supply of LNG is expected to increase this winter. As market signals will determine where this LNG will be delivered to, we’ve considered a range of possible import volumes to the UK.

5Winter Outlook Report
48.6 bcmTotal winter demand
465 mcm/dPeak demand
613 mcm/dSupply potential

6
Stakeholder engagement
The Winter Outlook Report, published annually in October, is the culmination of our winter consultation process. It is our view of security of supply for the coming winter informed by the feedback and information received from a broad range of stakeholders.
You’ve told us that you find the outlook reports useful in providing a well-informed, industry-wide view to help you prepare for winter. In particular we were told that our demand and margin analysis are a valuable source of information. The detailed market intelligence we received through the consultation process has helped shape our analysis of winter 2015/16.
Interest in our outlook reports continues to grow with more people downloading the report each year. As our audience increases, we want to ensure that our reports continue to improve and provide a more useful document for you.
How we have engaged with youIn order to deliver a well-informed view of the energy market for winter 2015/16, we have collected feedback in a number of ways:
1 Future Energy Scenarios (FES) consultation Stakeholders are fundamental in the development of our Future Energy Scenarios, shaping the range and content. This year we met with over 230 organisations to inform our scenario development. The scenarios provide a starting point for much of the analysis in this report, such as our electricity winter view.
2 Regular data submissions In our role of System Operator, we engage with and receive data from a range of market participants, such as generators and shippers. This data is used to inform our analysis of gas and electricity supply and demand for the coming winter.
3 Responses to Winter Consultation Each year in the Winter Review and Consultation Report, we present a review of what happened over the previous winter, together with a series of questions designed to understand the views of our stakeholders on the supply and demand position for the coming winter. This feedback then informs the methods and assumptions we use to develop our winter forecasts.

7Winter Outlook Report
Customers
Energy Industry
Non-Government Organisations
Political
4
1
1
7
Customers
Energy Industry
Non-Government Organisations
Political
4
1
1
7
“ We find the Winter Review and Consultation Reports very useful as they provide a good review of how the previous winter turned out against expectations and an opportunity to review and comment on National Grid’s views and data for the forthcoming winter.” Energy customer stakeholder
Responding to your feedback Each year our outlook reports evolve as we respond to our stakeholders’ feedback. Your views shape all aspects of the report, from the assumptions underlying our forecasts to the layout and style. You can see how we are improving the report based on your feedback in Table 1.
To continue to improve stakeholder participation in the Winter Consultation this year we once again requested responses both in the traditional manner by email and via an online survey. We received thirteen detailed responses in total; six via email and seven via the online survey. Responses came from a wide range of stakeholders as shown in Figure 1, including energy generators, suppliers and brokers, as well as government and non-governmental organisations.
“ We support the new layout and format of the Winter Review which we feel is suitable for all our employees, and have subsequently found it to be a useful tool in building commercial knowledge and innovation throughout our organisation.” Energy industry stakeholder
Figure 1 Respondents to the Winter Consultation report by stakeholder group

8
You said... We did...
Explanation of complex concepts could be clearer.
Key concepts and terms are explained at the start of each chapter and there is now a link to the glossary on every page.
We have kept the new structure from the Winter Review. You will find the big picture and key messages at the start of each chapter, before the detailed analysis.
The electricity analysis could be presented more clearly.
We have simplified how we present our electricity analysis. You can find more details at the start of the electricity section.
The new layout and format of the Winter Review is easier to read and helps you to find the information you need.
Consider a range of potential outcomes for the gas market due to geopolitical events in Ukraine and supply restrictions at the Groningen field.
We have considered the impact of reduced flows of gas from the continent on UK supplies.
Improving our stakeholder engagementWe want to ensure that we continue to improve our engagement and make our outlook reports of greater value to you. To do that we need to understand how you use them and what you really value from us. In 2016, we will be exploring a
wider range of engagement methods, with a programme of one-to-one meetings, topic-specific discussions and presence at National Grid events. The Winter Consultation for 2016/17 will be launched in summer 2016.
Table 1How we have responded to your feedback

Winter Outlook Report 9
10
Electricity Winter Outlook
This electricity chapter sets out our current view for electricity security of supply for winter 2015/16.
The chapter contains the following sections:
n Winter viewn Operational viewn Operational toolboxn Interconnected markets.

11Winter Outlook Report
2015/16 changesWhat’s changed?n Introduction of the “winter view” and
“operational view” for the coming wintern Removal of arduous view and
clean forecastn There are only two demand views in
the report; one for the winter view and one for the operational view. There have previously been four different views of demand.
Why has it changed?n Stakeholder feedback suggested that
too many definitions and forecasts made the report difficult to understand. The
1-in-20 demand forecast provides calculations on conditions that have a 5% chance (based on historical data) of being experienced. Previously we have provided a week by week look at the effects on margins if these conditions were experienced; this level of detail provides a false feeling of accuracy that does not reflect the layers of assumptions we need to apply.
n We cannot identify any users of the clean forecast so it has been removed. It is published separately on our website so we can monitor interest in the information.
Key termsWinter view: this is a probabilistic assessment of security of supply for the whole winter period. It is based on our Future Energy Scenarios, published in July 2015. The winter view helps us to prepare for winter and assess the balancing services we need to procure so we have the right tools in place to balance the system. Operational view: this is a week by week analysis of operational surplus across the winter. The operational view shown in this report is a snapshot of the latest dynamic data we have from generators at the time of publication. It is possible to access the latest operational data throughout the winter on the BM Reports website.

12
Winter viewOur winter view is a probabilistic assessment of security of supply for the whole winter period. Based on this assessment, we expect electricity margins to be tight but manageable for this winter. We have procured our contingency balancing services which we may need to use in order to help us balance the system. Headline margin for the coming winter is a loss of load expectation (LOLE) of 1.1 hours/year, equivalent to a de-rated capacity margin of 5.1%. We will continually review the latest information and remain vigilant regarding security of supply throughout the winter.

13Winter Outlook Report
Key messagesn We believe that electricity margins remain manageablen We have procured additional contingency balancing reserve compared
to 2014/15n Loss of load expectation is 1.1 hours/year, equivalent to a de-rated margin
of 5.1%n There is an increased likelihood that we will use the contingency balancing
reserve procured for this winter to assist in system balancing.
Overview
The winter view considers security of supply for the whole winter period and is the basis for our assessment of LOLE and de-rated margin. The underlying assumptions for the winter view are based on our Future Energy Scenarios2 (FES) 2015 and a wider credible range of sensitivities.
The analysis for the winter view is based on the Slow Progression scenario. This is the base case as it is the scenario that has
2 http://fes.nationalgrid.com/3 http://www2.nationalgrid.com/UK/Services/Balancing-services/System-security/Contingency-balancing-reserve/4 https://www.ofgem.gov.uk/publications-and-updates/decision-approve-revised-sbr-and-dsbr-volume-requirement-
procurement-and-operational-methodologies
Key termsPresentation of security of supply for electricityOur stakeholders have told us that they want us to present security of supply for electricity in terms of both generation margins and loss of load expectation (LOLE).Generation margins: the sum of generators declared as being available during the time of the peak demand, minus the expected demand at that time and a basic generation reserve requirement that is held by the System Operator. This is presented as a percentage.LOLE: loss of load expectation (LOLE) is used to describe electricity security of supply. It is an approach based on probability and is measured in hours/year. It measures the risk across the whole winter of demand exceeding supply under normal operation. It does not mean that there will be a loss of supply for X hours/year. It gives an indication of the amount of time across the whole winter that the System Operator may need to call on a range of emergency balancing tools to increase supply or reduce demand, typically through voltage reduction. In most cases, loss of load would be managed without significant impact on end consumers.
a LOLE closest to the average of all four scenarios; it is not the scenario that we think is most likely to occur.
In accordance with the revised Volume Requirement Methodology3 approved by Ofgem4, we carry out analysis to help inform the procurement of additional contingency balancing reserve, in the form of Demand Side Balancing Reserve (DSBR) and Supplemental Balancing Reserve (SBR). These services have been procured as additional tools to help National Grid balance the system.

14
5 http://media.nationalgrid.com/press-releases/uk-press-releases/corporate-news/additional-reserve-secured-for-winter-1516/
Loss of load expectation and de-rated marginThe results of our analysis show that the LOLE for this winter is 1.1 hours/year. This is equivalent to a de-rated capacity margin of 5.1%. It includes the additional reserve that we procured for this winter following the conclusion of the second tender round for SBR and DSBR.
Procurement of contingency balancing reserveThe de-rated volume requirement of SBR and DSBR for winter 2015/16 was determined as 2.5 GW based on analysis conducted in line with the approved Volume Requirement Methodology.On 3 June 2015, we announced the procurement of 2.56 GW of additional reserve for this winter following the conclusion of a second tender round for SBR and DSBR5. Subsequent validation and participants withdrawing from the service has resulted in a slight decrease in this volume to 2.43 GW, consisting of 2.29 GW of SBR and 0.13 GW of DSBR. One potential SBR participant is returning to the market, therefore reducing our overall volume requirement.
The unit cost of these services was lower than the previous winter and represents less than 50 pence a year on the electricity bill of the average consumer.
These services will be held outside the market by the System Operator and will only be dispatched as a last resort in the event that there is insufficient supply available in the market to meet demand. They form part of a set of tools that are available to the System Operator to help balance the system.

15Winter Outlook Report
Assumptions and results
1. Demand
The average cold spell (ACS) peak demand is expected to remain fairly flat compared to last year with a narrow range (~ 0.1 GW) between the four scenarios. The ACS peak demand for the coming winter is expected to be 54.2 GW.
Restricted ACS peak transmission system demand (54.2 GW)
The ACS transmission system peak demand is the demand we expect to see for power on our transmission network, excluding station load. We also add an assessment of demand met by distributed wind generation. This is because both transmission and distributed wind generation are modelled as available supply in our analysis.
For further explanation of terms such as restricted demand and station load please refer to the glossary.
For the purposes of calculating the winter view LOLE and de-rated margin 0.9 GW of reserve is added. This is consistent with the level of reserve added for the operational view. The total demand including reserve for winter 2015/16 is 55.1 GW. The reserve is to cover the largest in-feed loss. The demand excludes any interconnector exports, which are discussed later in this section.
6 71.9 GW includes the total generation capacity (i.e. before de-rating) on the transmission system and also distributed wind generation. In addition, there is 2.43 GW of de-rated contingency balancing reserve held outside the market.
2. Generation capacity and availability
There have been no significant changes in generation from those that were assumed in FES 2015, published in July 2015. We have however excluded Ironbridge and Wylfa from our analysis because based on market intelligence and operational data, these power stations are expected to cease generating near the start of the winter. We assumed a total of approximately 72 GW of generation capacity6 to be available for the winter. Figure 2 shows the breakdown.

16
0
GW
Capacity
10
30
20
50
40
60
70
80
90
2.43.8
26.1
0.82.71.4
17.9
12.91.19.0
SBR + DSBRInterconnectorsCCGTOCGTPumped StorageBiomassCoalWindHydroNuclear
Figure 2Generation capacity for winter 2015/16 assumed for our base case (Slow Progression)
Our analysis allows for a reduction in generation capacity by applying a de-rating factor to the plant capacity. This is to account for breakdowns, planned outages and any other operational issues that may result in a plant having a decreased ability to generate at their normal level. The de-rating factors for conventional generation are calculated based on their historic availability on high demand days during the winter peak period.7 Table 2 shows the assumed availabilities for each type of power station.
The de-rating factor for wind is calculated differently to other forms of generation and is based on its equivalent firm capacity (EFC) rather than its historic availability. The wind EFC provides an assessment of the contribution that the wind fleet makes to security of supply over the whole winter. It represents how much of 100% available conventional plant could theoretically replace the entire wind fleet and leave security of supply unchanged.
Table 2Assumed availability for each type of power station
Power station type Assumed availabilityNuclear 82%Hydro 85%Wind EFC 22%Coal and biomass 88%Pumped storage 97%OCGT 95%CCGT 87%
7 The winter peak period is defined as 07:00 – 19:00, Mon – Fri, Dec – Feb (inclusive)
It is reported as a percentage of the installed wind capacity. The wind EFC does not measure the load factor of wind over the winter or predict the amount of wind generation that we might expect in a particular half hour period.

17Winter Outlook Report
3. Interconnectors
The assumed installed capacity for interconnectors is 3.75 GW. We have assumed 1.1 GW of net imports to Great Britain. This consists of 1.8 GW imports from the continent and 0.75 GW exports to Ireland in all scenarios. This represents higher net imports than our assumptions from last year, when we assumed that 0.75 GW imports from the continent were balanced with 0.75 GW exports to Ireland giving a net zero float position.
In our security of supply analysis, the sensitivities considered a range of continental interconnector flows, varying from low imports of 0.5 GW to full imports of 3 GW. We assumed that exports to Ireland were fixed at 0.75 GW throughout the analysis.

18
Operational viewOur operational view is not designed as a forecast but instead to represent the current picture of operational surplus for each week across winter 2015/16 based on data provided from the generators to us. The data currently shows that whilst demand peaks in mid-December, the operational surplus is expected to be lowest for the weeks beginning the 26 October and 11 January. We currently expect there to be sufficient generation and interconnector imports to meet even the tightest week.
Key messagesn Based on current data, demand is expected to peak in mid-Decembern Current information indicates that the week commencing the 26 October
has the lowest operational surplus, due to planned outagesn The week with the next lowest level of operational surplus is expected to
be the 11 of Januaryn We are able to meet normalised demand in all weeks across the winter
under three different interconnector scenarios; the only exception is the week commencing 26 October when demand is met by medium and full interconnector imports.

19Winter Outlook Report
Key termsOperational surplus: is the difference between demand (including the amount of reserve held) and the generation expected to be available, modelled for each week of winter. It includes both planned outages and assumed breakdown rates for each power station type. This information helps to inform the market and identify weeks where less surplus is likely to be available. Generators are then able to consider planning outages outside of these tighter weeks.
Equivalent Firm Capacity (EFC): provides an assessment of the entire wind fleet’s contribution to capacity adequacy. It represents how much of 100% available conventional plant could theoretically replace the entire wind fleet and leave security of supply unchanged. EFC is currently assumed to be 22%. In the future as installed wind capacity increases, its associated variability will have an increased impact on system security and EFC will decrease as a result.
Transmission system demand: demand that National Grid as System Operator see at grid supply points (GSPs), which are the connections to the distribution networks. It includes demand from the power stations generating electricity (the station load) and interconnector exports.
Normalised demand: is forecast for each week of the year based on a 30 year average of each relevant weather variable. This is then applied to linear regression models to calculate what the demand could be with this standardised weather.
Overview
Our operational view is based on current generation availability data, otherwise known as Operational Code 2 (OC2) data. This data is provided to us by generators and includes their known maintenance outage plans. In this report we have used OC2 data provided to us on the 8 October 2015. The only modification we have applied to the data is to introduce an expected breakdown rate per fuel type to account for unplanned generator breakdowns or losses close to real time. It is possible to access the latest OC2 data throughout the winter on the BM Reports website8.
The weekly generation data is modelled against a forecast normalised transmission system demand and a range of interconnector flows; low imports, base case and full continental imports. The reserve level required to securely operate the system is also included in the demand forecast. The operational view does not take into account any market response by generators to high demand or tighter conditions.
8 http://www.bmreports.com/

20
Assumptions
1. Demand
Our normalised peak for transmission system demand for the coming winter is 53.3 GW and occurs in weeks commencing 7 and 14 December 2015. Normalised transmission system demand is made up of:
Normalised transmission system demand (53.3 GW) = national weather corrected peak demand (51.9 GW) + station load (0.6 GW) + interconnector exports (0.75 GW)
For further explanation of terms such as weather corrected and station load please refer to the glossary.
Our methodology for calculating normalised demand uses a 30 year average of each relevant weather variable (temperature, wind speed and solar radiation) and is constructed for each week of the year. We then calculate what the demand could be with this standardised weather.
As embedded generation is not visible to us but acts to reduce demand on the transmission system, normalised demand forecasts are adjusted to take account of a standardised weekly amount of embedded wind and solar generation. Current embedded wind generation capacity is 4.0 GW and embedded solar generation capacity is 7.8 GW. We have assumed a 90 MW increase per month in solar generation in our forecasts.
Figure 3 illustrates the forecast demand for 2015/16 compared to the weather corrected and actual weekly peak demands for winter 2014/15.
2. Generation assumptions
Plant providing SBR and DSBR has been factored into the total generation available for those weeks when the contracts are active. There is an increased likelihood that we will dispatch these services this winter to help us balance the system.

21Winter Outlook Report
46,000
Wee
kly
Pea
k TS
D /
MW
47,000
48,000
49,000
50,000
51,000
53,000
52,000
54,000
26/1
0/15
02/1
1/15
09/1
1/15
16/1
1/15
23/1
1/15
30/1
1/15
07/1
2/15
14/1
2/15
21/1
2/15
28/1
2/15
04/0
1/16
11/0
1/16
18/0
1/16
25/0
1/16
01/0
2/16
08/0
2/16
15/0
2/16
22/0
2/16
29/0
2/16
07/0
3/16
14/0
3/16
21/0
3/16
Winter 2014/15 Weather Corrected DemandWinter 2014/15 Actual DemandWinter 2015/16 Forecast Demand
Figure 3Previous winter (2014/15) demands and forecast demand for 2015/16
3. Reserve assumptions
There is a requirement to carry operating reserve to manage the second by second regulation of system frequency and respond to sudden changes in demand and supply. We have therefore assumed a reserve requirement of 0.9 GW for each week of our analysis.
4. Interconnector assumptions
Our analysis is based on three interconnector scenarios. All of the scenarios assume full export to Ireland, which adds 750 MW to expected demand. Each scenario includes a varying level of import from the continent:
n Low imports of 500 MWn Medium base case of 1800 MWn Full interconnector imports of 3000 MW.
22
5. Generation breakdown assumptions
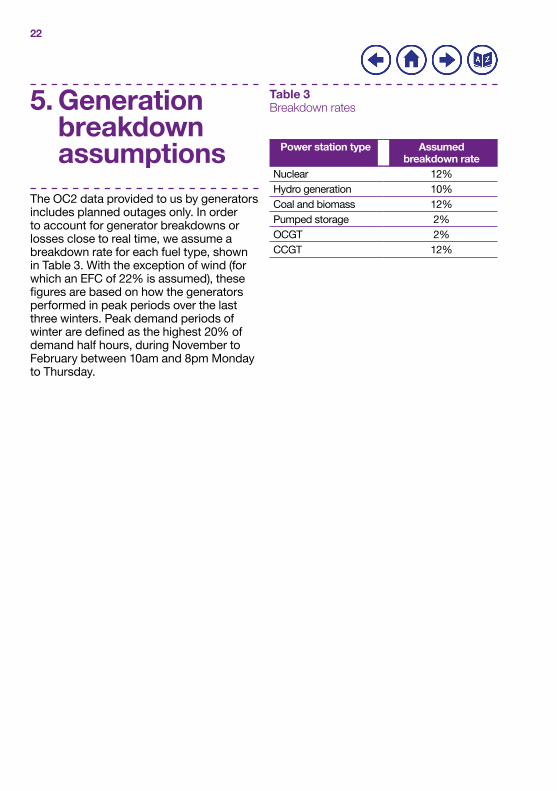
The OC2 data provided to us by generators includes planned outages only. In order to account for generator breakdowns or losses close to real time, we assume a breakdown rate for each fuel type, shown in Table 3. With the exception of wind (for which an EFC of 22% is assumed), these figures are based on how the generators performed in peak periods over the last three winters. Peak demand periods of winter are defined as the highest 20% of demand half hours, during November to February between 10am and 8pm Monday to Thursday.
Table 3Breakdown rates
Power station type Assumed breakdown rate
Nuclear 12%Hydro generation 10%Coal and biomass 12%Pumped storage 2%OCGT 2%CCGT 12%

23Winter Outlook Report
Results of analysis
Based on a snapshot of the OC2 data provided to us on the 8 October, Figure 4 below compares the expected weekly
Currently the weeks with the lowest levels of operational surplus are those commencing the 26 October and 11 January 2016. In October, a number of units are on planned outages before the main winter peak, some of which have overrun. In January there are a greater number of units on planned outage and closures at the end of the year. The graph shows normalised demand is met in all weeks across the winter against all three interconnector scenarios, with the exception of the week commencing the 26 October when demand is met by medium and full interconnector imports.
generation, with differing levels of interconnector flows, against the weekly normalised demand forecast for the winter period. This data will change throughout the winter as we approach real time and market participants continue to update their plans. Updated OC2 data is published each Thursday and can be found on the BM Reports website.
For information and comparison purposes the ACS peak demand, as defined and used for the winter view analysis, is also shown in Figure 4. History shows the ACS peak has never occurred before the first week in December, during the Christmas fortnight or after the first week in February. ACS demand is therefore only shown on the chart outside of these weeks. In all weeks, with the exception of the first three weeks in January 2015, ACS peak can also be met by all three interconnector scenarios. In January demand is met by medium and full interconnector imports.
GW
3840
4442
52504846
585654
60
26/1
0/15
02/1
1/15
09/1
1/15
16/1
1/15
23/1
1/15
30/1
1/15
07/1
2/15
14/1
2/15
21/1
2/15
04/0
1/16
11/0
1/16
18/0
1/16
25/0
1/16
01/0
2/16
28/1
2/15
08/0
2/16
15/0
2/16
22/0
2/16
29/0
2/16
07/0
3/16
14/0
3/16
21/0
3/16
Reserve RequirementNormalised Demand (including Full Ireland Export 750 MW)ACS Peak – Winter ViewAssumed Generation (Wind at EFC) including 500 MW importsAssumed Generation (Wind at EFC) including 1800 MW importsAssumed Generation (Wind at EFC) including 3000 MW imports
Figure 4Operational view winter 2015/16

24
Operational toolboxNational Grid have access to a number of balancing services, which have been procured to ensure sufficient operating margin is available over the highest demand periods. We can also use system notifications and other balancing tools to manage the system. This section provides background information on some of these tools to give a better understanding of the range of services that National Grid may use to ensure we continue to effectively balance the system.
Key messagesn The range of contingency balancing reserves National Grid has access
to this winter means that the projected margins are manageablen National Grid is prepared and may need to use the balancing tools
at its disposaln Notifications may be used to inform industry that we would like more
capacity to be made available. They may not always result in contingency balancing services being dispatched.

25Winter Outlook Report
Overview
As System Operator, National Grid must ensure that we are able to balance supply and demand in real time. This means we must maintain adequate levels of reserve. To do this, we procure a range of balancing services ahead of time to ensure sufficient operating margin is always available. As different sources of balancing reserve require different timescales in order to be ready, we have access to a range of services with different response times.
Reserve can be flexible generation, that can provide an increase or decrease in power output, or flexible demand that can provide an increase or decrease in power consumption. The System Operator works to a set of security standards that determine the levels of reserve that must be maintained at all times. In addition system frequency must be maintained within operational standards, which is achieved by maintaining reserve for frequency response.
Demand and generation uncertainty means that the Control Room must be able to turn up, or turn down the generation on the system and therefore maintain a level of positive and negative reserve at all times. This reserve is relied upon to replace any discrepancy in forecast demand or generation. The amount of reserve that is held depends on the demand profile for the particular day; for example a Sunday would have a different requirement to a normal working day.
From day ahead the Control Room monitor market conditions and data provided to ensure there is sufficient positive and negative reserve available.
This is done by monitoring submissions from market participants and comparing this with forecast demand and reserve requirements. The Control Room engineers monitor and optimise the programme of generator synchronisation and de-synchronisation events, considering generators with long start up times, some of which can require long notice periods. The process builds up an operational plan which is reviewed and revised up to real time, to ensure that the required reserve levels are achieved.
Types of reserve
Contingency ReserveThis form of reserve is used to cover losses and shortfalls in generation and demand forecast errors that can occur between 24 hours ahead and real time. With the approach of real time the levels of planned Contingency Reserve drop, as the risk of generation losses and demand forecast error diminish.
Operating ReserveIn contrast to Contingency Reserve, Operating Reserve refers to generation and demand response that is planned at the final short term planning stage. Operating Reserve is divided into two types, Short Term Operating Reserve and Scheduled Reserve.
Short Term Operating Reserve (STOR)STOR is provided by contracted generation and demand reduction, the vast majority of which can be called upon from stand still to provide reserve within 20 minutes. It is one of the tools used to provide a healthy operating margin between supply and demand in the last few hours before real time.
STOR is procured through a regular competitive tender process.

26
Scheduled ReserveScheduled Reserve is provided by synchronised generators and contracted balancing services providers operating in a mode that provides regulating capability. This means that they can provide flexibility in a positive or negative sense at short notice. Regulating Reserve is part of this Scheduled Reserve and covers for losses and shortfalls in supply in the last few hours before real time.
Scheduled Reserve also contains Reserve for Frequency Response, which is made up of generation and demand that can automatically respond to changes in system frequency. System frequency is a continuously changing variable that is determined and controlled by the second by second (real time) balance between system demand and total generation. If demand is greater than generation the frequency falls, while if generation is greater than demand the frequency rises.
Other contracted reserve servicesIn addition to the reserve services described above, there are other balancing services that National Grid procures to help operate the electricity transmission system securely and efficiently.
Fast StartFast Start is a contracted balancing service, provided by Open Cycle Gas Turbine generators (OCGTs) that have the ability to start rapidly from standstill and deliver full rated power output automatically within five minutes in response to low system frequency. Alternatively they can be manually instructed by National Grid to deliver full output within seven minutes. Fast Start forms part of the Control Room’s Operating Reserve to provide additional electricity supply when it is needed quickly.
Fast ReserveFast Reserve is the rapid and reliable delivery of active power following receipt of an electronic dispatch instruction from National Grid. It is provided as an increased output from generation or a reduction in consumption from demand sources. Fast Reserve is an additional energy balancing service used to control frequency changes.
BM Start UpThe BM Start Up service gives National Grid access to additional generation Balancing Mechanism Units (BMUs) that would not otherwise be available in operational timescales due to their technical characteristics and associated lead times. Some generation needs to be warmed up before it can be used; this service allows the plant operators notice to start this readiness programme. To ensure that system security can be appropriately managed, an adequate margin is required at day ahead timescales, held as contingent generation reserve in excess of forecast demand. BM Start Up is used by National Grid as the residual balancer to assist in ensuring sufficient plant is available on the day to meet demand plus reserve requirement.

27Winter Outlook Report
Additional balancing services
In addition to the traditional contingency balancing services described above, we are continuing to utilise the additional services developed prior to winter 2014/15. These services are Demand Side Balancing Reserve (DSBR) and Supplemental Balancing Reserve (SBR). They provide National Grid as System Operator with the option of accessing additional balancing services if required, which are not included in the reserve calculations at earlier stages.
System notifications
The electricity market is responsible for trading electricity up to the last hour before delivery. National Grid, as the System Operator, is then required to fine-tune, in real time, the electricity generated to match demand. In addition, we ensure that there is an adequate reserve capacity (margin) to account for any fluctuations in plant availability and uncertainty in demand forecasts. We use a range of routine communications to constantly inform the market of the supply needed to match demand or to help to mitigate system operating problems such as system frequency, system voltage levels or system overloads.
Notifications are designed to enable the market to make informed decisions so they can respond, either by making more generation available or reducing demand levels.
Additional tools to notify the market are used when the reserve falls to a particular trigger level, which prevents disturbing the market unnecessarily. If forecasts indicate that there is a significant likelihood that there will be an inadequate margin of reserve capacity then a Notice of Inadequate System Margin (NISM) will be issued to market participants to inform them of the forecasted position and request more capacity to be made available. The majority of time when a NISM is issued, the market responds, and we are able to withdraw the notice quickly. This reaction shows the electricity market working as it should. If the market does not respond there are a number of further actions that the System Operator can take. This includes further signals to the market, using the additional reserves (such as DSBR and SBR, which are not included in the reserve calculations at earlier stages) and importing more power through the interconnectors. Should this still prove insufficient, it is possible to issue a Demand Control Instruction, requiring stages of voltage reduction to avoid the shortfall. This can make hundreds of megawatts available and is unnoticed by customers.

28
We have a number of tools available to communicate inadequate margins to the market.
1. Notification of Inadequate System Margin (NISM)
National Grid forecasts demand and generation and the amount of operational reserve and response required for the next day. If forecasts indicate that there is a significant likelihood that the electricity margin is inadequate then a NISM will be issued to generators, interconnected system operators, and suppliers. The purpose of this notification is to make these parties aware of the situation and request that reserve generation is prepared, and any additional capacity is made available. This notice is required before SBR and DSBR services can be dispatched.
2. High Risk of Demand Reduction (HRDR)
A High Risk of Demand Reduction (HRDR) provides early notification of an increased risk of demand reduction and provides additional information to DNOs and transmission connected customers about the location of a potential demand reduction. Recipients are required to prepare their demand reduction arrangements.
3. Demand Control Imminent (DCI)A Demand Control Imminent (DCI) notification may be issued to provide short-term notice when a Demand Control Instruction is expected in the following 30 minutes. It must be cancelled or re-issued within the next two hours. The notification is sent only to the DNOs and transmission connected demand that will receive a demand control instruction.
4. Demand Control InstructionIn the event of a system margin shortfall National Grid may issue a Demand Control Instruction as a last resort to the DNOs and transmission connected demand. The instruction contains the level of reduction required to avoid the shortfall and specifies the demand control action required including stages of voltage reduction and, only in extreme cases, demand disconnection.
For more information on how National Grid balances the electricity transmission system, visit our website.

29Winter Outlook Report
Interconnected marketsForward power prices for this winter along with an analysis of the price spreads from last winter suggest that Continental European electricity interconnectors (IFA and Britned) will be flowing power into GB. Forward power prices across Europe are expected to rise over the coming months as we approach winter. Price spreads are expected to remain in favour of GB net imports.
Key messagesn For winter 2015/16, we expect there to be a net flow of electricity from
Continental Europe to GBn Based on current high power prices in Ireland, we expect there to
be a net flow of electricity from GB to Ireland.
Interconnectors
Interconnector flows are closely correlated with price spreads. However with the effects of the weather, plant unavailability and increased penetration of renewable generation, there is significant volatility of power prices close to real time. This results in significant uncertainty for any long-term flow forecast.
France and the NetherlandsInterconnexion France Angleterre (IFA) was at full capability (+/-2,000 MW) last winter apart from a few weeks of essential maintenance work. There are currently no outages scheduled for winter 2015/16.
BritNed is a 1,000 MW capacity interconnector to the Netherlands. There were no technical restrictions to its capability last winter and no restrictions expected in the coming winter.
IrelandThe interconnector to Northern Ireland (Moyle) is at a capability of +/-250 MW and is expected to remain at this level until the middle of 2016 when the cable replacement project is complete. This is a year earlier than it was initially planned for the cable to return.
East West Interconnector (EWIC) is expected to be at full capability (+/-500 MW) throughout this winter.

30
Prices
The North West Europe (NWE) day ahead coupling regime, which introduced implicit trading in day ahead timescales, has meant that we have seen an increasing price convergence between markets on the continent. However this effect has not been seen in GB and power prices remain consistently higher here than on the continent, which in turn maintains net interconnector imports.
Continental European forward power prices for this coming winter remain low. This is partly due to the increased renewable generation on the continent and two consecutive mild winters. There are some signs that these prices may rise due to low levels of gas storage in Ukraine (a major pipeline for European gas supply) and forecasts of a colder winter than the previous two years. Even though power prices may rise, it is likely that GB prices will increase at a similar rate, maintaining a healthy spread which favours flow from the continent into GB.
France and the NetherlandsCurrent forward prices for this winter in France and the Netherlands are similar, with the Netherland’s prices being slightly lower than France’s. However both France and Netherland’s forward prices are at a large discount to that of GB; therefore we expect net import flows to GB on IFA and BritNed throughout the winter.
We have used the historical price information below combined with forward prices to forecast that interconnectors will be importing this winter. The average of last year’s peak price spreads show that GB – FR and GB – NL prices remained positive over last winter and therefore the interconnectors consistently imported over the peaks for the whole of the winter 2014/15. We expect to see a similar situation this winter.
Pric
e (£
)
0
5
10
15
25
20
30
06/1
0/14
20/1
0/14
03/1
1/14
17/1
1/14
01/1
2/14
15/1
2/14
29/1
2/14
12/0
1/15
26/0
1/15
09/0
2/15
23/0
2/15
FR – UK SpreadNL – UK Spread
Figure 5Day ahead peaks price spread

31Winter Outlook Report
IrelandLast winter EWIC and Moyle exported consistently to Ireland at maximum flow over the peaks. Based on current power prices remaining high in Ireland, this winter we expect to see a net flow from GB to Ireland over both interconnectors. Although this is likely to reduce or even import to GB during periods of high wind power output in Ireland.
European markets reviewn Forward prices for this winter remain low throughout Europe, due to
increased renewable generation capacity and two previous mild wintersn A colder winter on the continent could push up prices and reduce
interconnector imports to GBn French and Belgian supply is expected to remain tight this winter as older
fossil fuel plants mothball or close in response to the Industrial Emission Directive and economic factors. Availability is not anticipated to improve until 2020/21, when new units are expected to be commissioned and additional grid infrastructure put in place
n Although margins will remain tight, the Belgian power market is likely to see greater availability than last winter. A strategic reserve has been created and operational extensions agreed for some nuclear reactors
n Day ahead market coupling has continued to extend this year. We are now seeing increasing price convergence between markets on the continent.

32
Gas Winter Outlook
This gas chapter sets out our current view of gas supply and demand for winter 2015/16. It also details potential operational issues and the tools we have in place to deal with these.
The chapter contains the following sections:
n Gas demandn Gas supplyn Fuel pricesn Winter security assessmentn Safety Monitorsn Operational challengesn Gas/electricity interaction.

33Winter Outlook Report
Key messagesn Demand is expected to be similar to last yearn The price differential between coal and gas is likely to be much
narrower than previous years. There is a potential for higher gas-fired generation demand
n We have used a revised method on peaks, resulting in up to 4.8% reduction in peak demand.
Gas demandThe 2015/16 winter gas demand is expected to be similar to the 2014/15 weather corrected demand. Forward prices show that the price differential between coal and gas is much narrower than previous years; we have updated our analysis to reflect this. As such gas for power generation is anticipated to be slightly higher than last year.
Overview
Our view for winter 2015/16 is based on our Consumer Power scenario and is taken from our 2015 Future Energy Scenarios. Consumer Power was selected as it has the highest winter 2015/16 peak day across the range of our scenarios and therefore represents the tightest market in which to analyse the resilience of the system.
We have updated the gas-fired power generation numbers based on the latest forward prices.
Figure 6 shows the forecast gas demand for winter 2015/16 based on seasonal normal weather conditions. In addition, lines to represent cold and warm demand are also shown. These lines represent the influence of weather rather than any demand changes associated with, for example, power generation economics.

34
Figure 6Forecast gas demand winter 2015/16
0
mcm
/d
50
150100
200
300250
350400450500
Oct
15
Nov
15
Dec
15
Jan
16
Feb
16
Mar
16
Peak DayWarm DemandCold DemandStorage InjectionInterconnectorNon Daily MeteredTotal PowerNon-power Daily MeteredIreland
The chart shows seasonal normal demand peaking around 300 mcm/d. Peak winter demands may be appreciably higher than this as temperatures can be colder than seasonal normal temperatures. The peak day forecast demand of 465 mcm/d is significantly higher than the cold demand curve, as the peak day assumes colder weather, leading to higher weather sensitive (i.e. residential, other building and industrial) demand and includes power station demand of 86 mcm/d.
Flows to Ireland are expected to decrease when Corrib, a new gas field west of Ireland, increases flows to its full capability. This is currently anticipated for March 2016.
Figure 7 shows the actual and weather corrected demand for last winter and the forecast demand for winter 2015/16.

35Winter Outlook Report
Figure 7Forecast gas demand October to March 2015/16
0
BC
M
10
30
20
50
40
60
2014/15 Actual Demand
2014/15 Weather Corrected
Demand
2015/16Forecast
Storage InjectionInterconnectorNon Daily MeteredTotal PowerNon-power Daily MeteredIreland
The above chart shows the 2015/16 total power demand forecast to be slightly higher than 2014/15, showing an increase of 0.8 bcm as shown in Table 4. Despite some unplanned outages of nuclear and coal power stations last winter, the price differential between gas and coal was sufficiently large so as to drive coal over gas-fired generation. This year the forward prices indicate that the price gap will be much smaller and we have updated our analysis accordingly.
The 2014/15 non-daily metered (NDM) demand is not significantly higher than weather corrected despite the fact that the six months from October 2013 to March 2014 were warmer than normal. This is because weather correction has a greater impact on cold weather, with only a limited impact on warm weather.

36
Table 4Forecast gas demand October to March 2015/16
Table 4 shows the historic actual and weather corrected demand for winters 2012/13 through to 2014/15 and the forecast for winter 2015/16.
On a weather corrected basis, the table shows the potential impact of colder weather. For example, the 2012/13 NDM demand is more than 10% higher than the weather corrected demand for that winter. The table also highlights high IUK exports in winter 2014/15. This is as a result of low GB demand in October and high LNG supplies being transported through the GB network to Europe in early 2015.
DailyThis section sets out the daily average demand for last winter and the forecast demand for winter 2015/16. It also gives the day to day range of demand experienced last winter and a forecast range for 2015/16. Results are shown in Table 5 and are based on the mid-winter months of December to February.
October to March winter 2012/13 2013/14 2014/15 2015/16
bcm ActualWeather
corrected ActualWeather
corrected ActualWeather
corrected ForecastNDM 33.9 30.0 28.1 29.0 29.3 29.3 29.6DM + Industrial 5.4 5.3 5.1 5.2 4.9 4.9 5.4Ireland 3.1 3.1 2.9 2.9 2.9 2.9 2.4Total Power 8.6 8.5 7.9 7.9 8.7 8.7 9.5Total demand 51.2 47.2 44.2 45.2 45.9 46.0 46.8IUK export 0.6 0.6 0.6 0.6 1.5 1.5 0.4Storage injection 1.8 1.8 1.8 1.8 0.9 0.9 1.4GB Total 53.5 49.5 46.6 47.5 48.3 48.3 48.6

37Winter Outlook Report
Table 5Forecast daily gas demand December to February 2015/16
The ranges highlight the considerable variation that exists for all demand sectors. The largest range is in the NDM sector which includes residential demand. The range is so large because gas is the major fuel for heating and heat demand varies greatly based on the weather conditions.
The forecast range is set differently for different components. For weather sensitive loads the low forecast in the range is set according to the demand expected on a warm late winter day. Ireland, IUK and storage demands are based on low historic observations, whilst power assumes our low gas-fired generation scenario.
The high forecast in the range for weather sensitive loads is based on a very cold January day, whist Ireland is set according to our peak day forecast. IUK and storage demands are based on high historic observations. Power assumes our high gas-fired generation scenario.
PeaksFigure 8 and Table 6 show the highest ever day of demand in January 2010 and the 1-in-20 peak day demand forecasts for winter 2015/16. The 1-in-20 peak day demand is the level of daily demand that would be exceeded in 1 out of 20 winters.
Diversified peak demand is the demand that could be expected for the country as a whole on a very cold day. Undiversified peak demand is the peak day demand calculated for each offtake independently, and then added together. Obligated is the total amount of capacity that National Grid is required to make available on every day of the year.
December to February winter Daily average Actual range Forecast range
mcm/d2014/15 actual
2014/15 weather
corrected2015/16 forecast
2014/15 low
2014/15 high
2015/16 low
2015/16 high
NDM 196 189 188 138 248 107 342DM + Industrial 28 27 30 19 32 20 39Ireland 17 17 14 11 22 10 17Total Power 46 46 40 24 76 15 78Total demand 287 280 274 213 366 182 459IUK export 5 5 0 0 26 0 30Storage injection 3 3 5 0 37 0 45GB Total 295 287 279 237 367 188 459

38
Figure 81-in-20 peak day gas demand 2015/16
0
mcm
/d
100
300
200
700
600
800
500
400
900
8 Jan 2010
TotalDiversified
TotalUndiversified
Obligated
Storage InjectionIUK ExportsNTS High PowerNTS Base PowerNTS Low PowerIrelandNTS IndustrialLDZ
The relationship between demand and weather is periodically reviewed with a new industry standard having taken effect on 1 October 2015. This update to the relationship was completed using an updated weather history dataset supplied by the Met Office. It follows Mod 330 which introduced the concept of a weather station substitution methodology into UNC. The new weather data also came with a climate change methodology.
This has enabled us to complete our analysis using a weather history that is adjusted to climate conditions that are appropriate for the period in which the demand to weather relationship will persist (2015-2020). As a consequence of using this new data our 1-in-20 diversified peak has decreased by 4.8%.

39Winter Outlook Report
Due to the price assumptions, the base case forecast for gas-fired power generation in Table 5 is relatively low. For the 1-in-20 peak, a high case forecast for power generation is used. This assumes lower gas prices than our base forecast, and lower availability of non-gas generation such as nuclear and wind. For the 2015/16 forecast this increases the power generation component of the diversified peak day forecast to 86 mcm.
2015/16 Forecast
mcm/dJanuary 8th 2010
Total Diversified
Total Undiversified Obligated
LDZ 341 350 362 498NTS Industrial 8 8 12 15Ireland 26 21 21 48NTS Power 87 86 115 165IUK Exports 1 0 0 59Storage Injection 2 0 0 98Total 465 465 511 884
Table 61-in-20 peak day gas demand 2015/169
9 Demand data can differ between different sources for a number of reasons including classification, CV and close-out date. Power generation classifications are: in Table 4 and Table 5, the LDZ connected power stations at Shoreham, Barry, Severn Power and Fawley are included in the total power category; but in Table 6, they are included in Local Distribution Zone (LDZ) demand. Grangemouth and Winnington NTS offtakes are included in total power in Table 4 and Table 5 but NTS industrial in Table 6. Immingham is classified as NTS power stations for all 3 tables.
40
Key messagesn There are significant supply options to meet demand for winter 2015/16n There is reduced space in storage sites compared to last wintern We expect there to be an increase in global LNG availabilityn There may be a potential reduction in supplies from the continent.
Gas supplyWe are predicting that there will be sufficient gas available to meet demand from across a wide and diverse supply base, although there is uncertainty around the mix of supply sources. Supplies from the UK Continental Shelf (UKCS) and Norway are expected to be similar to winter 2014/15. LNG flows have the potential to be higher due to increased availability globally. Continental flows are uncertain for the coming winter given production restrictions in the Netherlands due to the issues at the Groningen field and the volatile nature of IUK flow. There is also a reduction in storage space compared to previous winters.
Gas supply by source
Table 7 summarises the supply range and our supply forecast for a ‘cold day’. A ‘cold day’ was historically defined as a day with total demand over 400 mcm/day. As demand has not reached this level for the last three winters the cold day is now slightly lower and is taken from the average load duration curve. Load duration curves are published every year in our Gas Ten Year Statement10.
In Table 7 we show a cold day supply assumption for each component of the Non Storage Supply (NSS) at high demand levels. This is used in assessing whether a Margins Notice11 should be issued to the industry, indicating that there is a potential imbalance between supply and demand in the coming gas day. Also shown are the actual 2014/15 ranges for the six month period. The forecast ranges are based on observation of maximum flows seen over recent winters, and give an upper range for NSS of 467 mcm/d.
10 http://www2.nationalgrid.com/UK/Industry-information/Future-of-Energy/Gas-Ten-Year-Statement/11 http://www2.nationalgrid.com/uk/industry-information/gas-transmission-system-operations/balancing/
gas-deficit-warnings-and-margins-notices/

41Winter Outlook Report
Table 7Supply components
mcm/d2014/15 2015/16
Actual range Cold Day Forecast range Cold DayUKCS 70-101 99 70-112 100Norway 55-136 110 60-136 110LNG 5-56 50 5-100 50IUK 0-15 45 0-74 45BBL 1-36 40 1-45 40Total 344 345
UKCSTable 7 shows our forecast range for UKCS flows for winter 2015/16, based on information received from the producers. It also shows the actual range observed in winter 2014/15. UKCS flows are predicted to be of a similar level to last winter, although there is potential for a higher peak day supply due to newer fields ramping up production.
Norwegian suppliesDue to the potential variation in continental flows, a range of Norwegian flows to GB is calculated based on observed load factors to each of the continental countries that receive Norwegian supplies. For winter 2015/16 our forecast range of Norwegian supplies to GB, over the whole winter, is between 60 mcm/d and 136 mcm/d, with an estimate of 110 mcm/d made for the cold day assumption as shown in Table 7.
Continental importsContinental imports to GB flow through two pipelines into the Bacton terminal. These are the BBL pipeline from the Netherlands and IUK from Belgium.
Imports through the BBL pipeline are less certain this winter due to production restrictions at the Groningen field in the Netherlands.
While imports to GB did drop last winter when the restrictions were introduced, this coincided with a fall in demand, so the behaviour at higher demands with the current restrictions has not been tested. Based on feedback received from the Winter Consultation, along with the latest market intelligence, we have kept our assumption of 40 mcm/d imports for our cold day NSS assumption.
IUK has the ability to import and export gas, typically importing gas to GB during winter and exporting during the summer. However flows are determined by market conditions and exports from GB have occurred at times in each of the last five winters. Feedback from the Winter Consultation indicated high imports could be expected from IUK later in the winter should GB storage stocks run low, as was seen in March 2013. For our NSS assessment IUK has remained at last year’s level of 45 mcm/d.
Given the uncertainty surrounding both IUK and BBL we have carried out an assessment of the impact of lower imports in the winter security assessment section of this report.

42
LNGWinter 2014/15 saw an increase in LNG imports compared with the previous winter, particularly in Q1 2015 following a reduction in the LNG spot prices in the East Asian market.
In terms of attracting LNG cargoes, national balancing point (NBP) gas prices remain lower than LNG prices in the East Asian market, although the price differential is substantially closer than last winter. LNG prices in East Asia have decreased throughout 2015, but they are still expected to remain higher than the GB price over the winter and therefore are likely to be the preferred market for most traded and spot LNG.
To manage the supply uncertainty surrounding GB LNG a wide range is considered, from 5 mcm/d (approximate boil off levels) up to potentially 100 mcm/d under favourable conditions. Given the capacity of the GB LNG terminals is 145 mcm/d there are significant options for how these levels of LNG could be supplied.
Global LNG supply is expected to increase during winter 2015/16 with the commissioning of new LNG liquefaction plants. There are some in the Asia – Pacific area and also in the US, where the first export terminal, Sabine Pass, is expected online in early 2016. Although GB may not benefit directly from the new LNG supply sources, a surplus of non-contracted LNG supplies may result in higher deliveries to GB. However this could be affected by a number of different factors that would change the market signals and therefore destinations of LNG deliveries.
Table 8 shows some of the factors which may increase or decrease global LNG availability, thus supporting higher or lower GB LNG imports.
Table 8Factors affecting LNG availability
Increased LNG availability(Potentially higher GB imports)
Lower LNG availability(Potentially lower GB imports)
Increased global production capacity Liquefaction outages or delays to new liquefaction projects limit LNG supplies
Increasing volumes of LNG re-exports A cold winter in the Far East increases LNG demands in that area
Milder weather in Far East reduces LNG demand in Asia
Increased LNG to South America to replace low hydro generation
Chinese energy demand is low reducing LNG demand
Higher LNG prices in Asia attracts surplus LNG
The expanded Panama Canal (due Q1 2016) enables surplus LNG from Asia – Pacific region to flow to European destinations
Reduced pipeline imports into Europe may lead to increased LNG imports into competing European markets

43Winter Outlook Report
Table 9Aggregate storage data
StorageThere is reduced storage space for the coming winter, down from 4.9 bcm last winter to 4.2 bcm this winter. This is a result of reduced capacity at the Rough and Hornsea sites. There is also a temporary small reduction to deliverability of around 11 mcm/d from 1 September to 1 December due to a planned outage at Hornsea. This is not included in Table 9 as we expect the site to be back at full capacity before the period of highest demand.
Based on assessments of current storage sites, deliverability for this winter is approximately 146 mcm/d. This is an increase from 129 mcm/d last winter, due to increased deliverability at Aldbrough, Hill Top and Stublach.
Given the diverse nature of the GB gas market we expect sufficient flexibility and diversity across all sources to cope with the reduction in storage space for the coming winter. The potential impact of these changes along with the other supply uncertainties is explored further in the winter security assessment section.
Table 9 shows our assumed levels of storage space and deliverability for this winter. These levels are based on current storage operator view and have the potential to increase or decrease over the winter period. Current stocks can be found on the National Grid website.
Space (mcm) Injection (mcm/d) Deliverability (mcm/d)
Short Range (LNG) 44 0 13Medium Range (MRS) 1217 71 91Long Range (Rough) 3016 26 42Total 4277 97 146

44
Locational supplySo far we have discussed ranges of expected flows and flows on a cold day, but with no indication of location.
Table 10 shows an indication of the maximum flow expected at each terminal, together with the flow on a cold day. This year’s view is in line with what we expected last year, the main difference being the cold day assumption for LNG.
We have moved 5 mcm/d from Grain to Milford Haven based on flows we have witnessed over the last few winters.
The Teesport LNG terminal has now been dismantled. This has reduced Teesside’s maximum capacity by 17 mcm/d from last year.
2015/16 Cold DayBacton 151 110Barrow 8 7Easington 74 72St Fergus 102 79Teesside 24 21Theddlethorpe 7 6Grain 59 10Milford Haven 86 40Storage 146 146
Table 10Supplies by terminal

45Winter Outlook Report
Key messagesn Oil prices almost halved in the last 12 months n Coal and gas follow downward trendn UK Carbon Prices (EU Carbon Price + UK Carbon Price Support)
increased by around 70%n With coal prices expected to be lower than those for gas, coal is
expected to be the preferred fuel over lower to average efficiency gas-fired power generation
n With a narrower differential between coal and gas prices than in winter 2014/15, higher efficiency gas plants may be able to compete with coal.
Fuel pricesFuel prices can have a significant effect on energy demands and are analysed to help understand changes to energy supply patterns. Fuel prices for power generation are largely governed by the shorter term spot markets. In contrast prices for end users are generally based on tariffs that respond to longer term trends in wholesale prices. As a result any uncertainty in fuel prices over a short time period, such as the winter ahead, is likely to have a greater effect on the choice of fuel for power generation than on end- user demand; we concentrate on this aspect in our Winter Outlook Reports.
Overview Energy prices have fluctuated significantly over the last 12 months as shown in Figure 9. Since October 2014 oil prices decreased by around 50%, coal prices decreased by around 25%, gas prices decreased by around 20% and baseload electricity prices decreased by around 6%. The latest forward prices indicate that the fuel prices may remain at this lower level for the winter ahead.
Figure 10 shows how the forward prices for winter 2015/16 slightly favour coal burn over lower to average efficiency gas plants for power generation. Higher efficiency gas plants may be able to compete with coal over the winter period. This is a more favourable position for gas than last winter and is partly due to an increase of around 40% to the European Trading Scheme (ETS) Carbon Prices in the previous 12 months and the Carbon Price Support increasing on 1 April 2015 to £18/tonne.

46
Figure 9Energy prices since October 2014
0
Fuel
Pric
es
20
40
80
60
100
01/1
0/14
15/1
0/14
29/1
0/14
12/1
1/14
26/1
1/14
10/1
2/14
24/1
2/14
07/0
1/15
21/0
1/15
04/0
2/15
18/0
2/15
04/0
3/15
18/0
3/15
01/0
4/15
15/0
4/15
29/0
4/15
13/0
5/15
27/0
5/15
10/0
6/15
24/0
6/15
08/0
7/15
22/0
7/15
05/0
8/15
19/0
8/15
02/0
9/15
16/0
9/15
Dec
Nov
NovOct
Jan
Jan
Feb
Mar
Mar
Brent Oil ($/bbl)Brent Oil Fwds ($/bbl)Coal ($/tonne)Coal Fwds ($/tonne)
NBP Gas (P/therm)Gas NBP Fwds (P/therm)UK Baseload Power (£/MWh)BL Power Fwds (£/MWh)
Historic Prices Forward Prices
In our Winter Consultation, published in July we were expecting coal to be clearly the favoured fuel for power generation. The change from that position to our current view of a much smaller advantage for coal reflects a significant change in forward prices for gas in quite a short time and emphasises the uncertainty inherent in predicting prices.

47Winter Outlook Report
Figure 10Relative power generation economics12
30
Gas
(p/t
h)
40
50
70
60
80
90
110
100
120
50 60 70 80 90 100
Coal ($/tonne)
110
120
130
140
150
Coal favouredUncertainGas favoured Price indication Gas range (40% – 55%)
Gas burn favoured
Coal burn favoured
Coal/gas burn
Prices as of 18/08/15Carbon (�/tonne): 33.7
November 15 – March October 15
55% CCGT efficiency
40% CCGT efficiency
12 Gas-fired power station efficiencies are assumed to be roughly 40% for Open Cycle Gas Turbines (OCGTs) or Combined Cycle Gas Turbines (CCGTs) operating in open cycle mode. CCGTs operating in combined cycle are assumed to be in the range of 50-55% efficient.

48
Key messagesn Margin of 148 mcm/d at peakn Sufficient supply capability to cope with an N-1 supply lossn Our stress test shows that in the event of lower BBL flows
and a disruption to Russian gas through Ukraine the market is well placed to respond.
Winter security assessment: gasGB infrastructure can meet gas demand under severe weather conditions for an extended period, even with a single large import infrastructure failure or supply loss.
Security assessment analysisThe total Non Storage Supply (NSS) as detailed in Table 7 is 467 mcm/d. When the potential storage of 146 mcm/d is considered this gives an overall supply potential of 613 mcm/d. The mix of supplies is uncertain and not subject to a strict merit order with flows from some storage expected throughout the winter.
With the 1-in-20 peak demand for the winter defined as 465 mcm/d the supply margin is 148 mcm/d, as can be seen in Figure 11. This suggests there will be significant supply options for the GB gas market at all levels of demand.

49Winter Outlook Report
Severe winterTo further assess the security of the gas system for the coming winter, we have carried out some analysis on how demand could be met during a sustained cold spell during a severe winter.
The demand is split into three parts:n Protected demandn Other large loadsn Potential demand side response (DSR).13
The expected NSS for each demand level is assessed with a potential upside if the maximum NSS, as defined in Table 7, was delivered. The available storage is then added to give the total supply potential for that day. The available storage declines as the winter progresses as stocks are depleted. This assessment is based on a persistent cold spell, lasting three months, and no refill of storage during the period.
As can be seen in Figure 12 there are sufficient supplies to meet demand under normal supply conditions without the requirement to utilise any demand side response or NSS upside.
Figure 11Potential supply margin
0
mcm
/d
100
200
400
300
600
500
700
1-in-20 Peak DemandCold Day DemandStorageBBLIUKLNGNorwayUKCS
148 mcm/d surplus supply
465 mcm 1-in-20 Peak
394 mcm Cold Day
13 15 mcm/d based on previously observed levels of DSR

50
Figure 12Supply/demand analysis under severe conditions
0
mcm
/d
100
300
200
500
400
600N
SS
Ups
ide
+ S
tora
ge
NS
S +
Sto
rage
Dem
and
NS
S U
psid
e+
Sto
rage
NS
S +
Sto
rage
Dem
and
NS
S U
psid
e+
Sto
rage
NS
S +
Sto
rage
Dem
and
NS
S U
psid
e+
Sto
rage
NS
S +
Sto
rage
Dem
and
Protected DemandOther Large Loads
Peak Day Very Cold Week Very Cold Month Very Cold Winter
Large Loads DSRNSS
StorageNSS Upside
Severe winter with an infrastructure lossTo assess the loss of infrastructure we have also repeated the analysis with the loss of the largest single piece of gas supply infrastructure (the Milford Haven to Felindre pipeline, an 86 mcm/d supply loss). This is consistent with the N-114 test used to assess gas security by the EC.
14 Regulation (EU) No 994/2010 of the European Parliament and of the Council of 20 October 2010 concerning measures to safeguard security of supply and repealing Council Directive 2004/67/EC
Under this circumstance, further response would be required to meet demand throughout the winter. This may involve additional supply or utilisation of DSR. We would expect the market to provide the required signals to ensure security of supply is maintained.

51Winter Outlook Report
Figure 13Supply/demand analysis under severe conditions with infrastructure loss
0
mcm
/d
100
300
200
500
400
600
NS
S U
psid
e+
Sto
rage
NS
S +
Sto
rage
Dem
and
NS
S U
psid
e+
Sto
rage
NS
S +
Sto
rage
Dem
and
NS
S U
psid
e+
Sto
rage
NS
S +
Sto
rage
Dem
and
NS
S U
psid
e+
Sto
rage
NS
S +
Sto
rage
Dem
and
Protected DemandOther Large Loads
Peak Day Very Cold Week Very Cold Month Very Cold Winter
Large Loads DSRNSS
StorageNSS Upside
Impact of supply uncertaintiesIn order to assess the impact on the GB gas market of supply disruptions we have carried out an impact assessment to test the capability of the market. After consulting with stakeholders we identified two potential supply losses we should include in our assessment. These were:
n low imports via BBLn a disruption of supplies of Russian
gas through Ukraine.
In addition to these two potential losses we have also included the impact of the restrictions at the Rough and Hornsea storage sites explained in the gas supply section. The analysis has been based on the weather pattern for 1985/86, a 1-in-14 cold winter with a cold February. This year was chosen both to allow our stakeholders to compare the results with last year’s assessment and because a cold February would test the impact of lower storage stocks.
Impact of lower flows through BBLAs detailed in the gas supply section our central assumption for imports through BBL is 40 mcm/d. However with production restrictions in place at the Groningen gas field there is significant uncertainty over these flows. To assess the potential impact of lower flows we have applied a level of 15 mcm/d to reflect the lowest sustained flows observed in February/March 2015 after the cap was introduced. The analysis shows that under these conditions there is sufficient capability to meet demand without the requirement for any additional market actions.

52
Figure 14Cold winter with lower BBL flows
0
100
200
400
300
500
Oct
Nov
Dec Jan
Feb
Mar
mcm
/d
Market ActionStorageBBLIUKLNGNorwayUKCS
Impact of disruption to Russian supplies through UkraineWhile there has not been an interruption of flows to Russian gas to the EU since the current dispute began we felt it was worthwhile to test our supply assumptions as detailed below. These include the potential for lower BBL flows as a result of the restrictions at Groningen.
n 95 mcm/d UKCS – consistent with our winter long expectations
n 110 mcm/d Norway – a reduction of 20 mcm/d at times of high demand as flows are redirected to Continental Europe
n 120 mcm/d LNG – this represents 85% of GB capacity
n 5 mcm/d BBL – a further reduction of 10 mcm/d as flows are redirected to Continental Europe
n 35 mcm/d export IUK – reduced from the potential 74 mcm/d of imports which could be available on a cold day. Exports are based on the levels seen in January 2009.

53Winter Outlook Report
Figure 15Cold winter with lower BBL flows and a disruption to Russian supplies through Ukraine
0
mcm
/d
100
200
400
300
500
Oct
Nov
Dec Jan
Feb
Mar
Market ActionStorageBBLIUKLNGNorwayUKCS
Figure 15 shows that under these conditions there is a requirement for 77 mcm of further market response, with the maximum daily requirement of 39 mcm. These results show a tighter supply balance than was the case in our Ukraine only case study carried out in Winter Outlook 2014/15, where no further response was required. This is due to the lower storage capability and the additional restrictions we have applied to BBL.
There are several potential sources which could provide the required response.
These are: n reduced exports to Continental Europe
(+35 mcm/d)n full utilisation of LNG capacity
(+25 mcm/d)n lower diversions of Norwegian/
Dutch imports (+35 mcm/d).
Given the relatively low level of the requirement and the short duration there are several potential combinations of these sources which would ensure GB demand could be met without the requirement for demand side response.

54
Key messagesn Assumed storage space for winter 2015/16 is 47047 GWh n 2015/16 Safety Monitor space is 859 GWh,
which is an increase from 754 GWh in 2014/15n 2015/16 Safety Monitor deliverability is 558 GWh/d,
which is an increase from 504 GWh/d in 2014/15.
Key termsThe Safety Monitor assesses and ensures that sufficient gas supplies are held to support those gas consumers whose premises cannot be physically and verifiably isolated from the gas network within a reasonable time period. The Safety Monitor is made up of two elements:
n Protected by monitor – this applies to sites that cannot be safely isolated. Their gas demand is determined over a cold winter and the amount of gas required is compared to the assumed Non Storage Supply (NSS) for the winter period. Where there is not enough NSS to meet this demand, this is the volume of gas that needs to be available in storage
n Protected by isolation – this applies to sites that can be safely isolated but not instantaneously. As a result there is an additional gas demand associated with the isolation process. The time and associated gas demand required for isolating these generators is established via emergency exercises.
The Safety Monitor defines the requirements for both space, which defines the volume of gas required in storage to cover across the winter, along with the deliverability required for the highest demand day.
Safety MonitorsThe 2015/16 winter Safety Monitor has been set at 859 GWh of space with 558 GWh/d of deliverability. This meets the requirement to ensure security of supply for those customers who cannot be safely isolated from the gas network.

55Winter Outlook Report
Figure 16 uses a variable demand dependent NSS assumption that more accurately reflects the flexible supply options available within GB. It is important that the assumed level of NSS used for calculating the Safety Monitors is available throughout the winter, particularly at times of high demand.
The current Safety Monitor method treats all storage types equitably, by grouping all storage types/facilities together such that there is only one aggregated monitor for space. Hence operational storage space is apportioned equitably across all storage sites, including those with high cycling rates.
National Grid Demand Statements that are published in the Gas Ten Year Statement.
Supply assumptions come from analysis of the last five years of historical NSS versus demand, illustrated in Figure 16.
Figure 16Non Storage Supply (NSS) versus demand for the winters 2010/11 to 2014/15
150
NS
S S
uppl
y (m
cm/d
)
Demand (mcm/d)
250
200
300
400
350
450
150
200
250
300
350
400
450
500
The resulting Safety Monitor for winter 2015/16 is detailed below. The relatively low Safety Monitor level reflects a continued view that Non Storage Supply can adequately supply demands protected by the Safety Monitor.
n 2015/16 assumed storage space = 47047 GWh
n 2015/16 Safety Monitor space = 859 GWh (1.8%) (2014/15 = 754 GWh)
n 2015/16 Safety Monitor deliverability = 558 GWh/d (2014/15 = 504 GWh/d).
Safety Monitors and the associated winter profiles (i.e. how the monitors reduce later in the winter) are published on the Joint Office website15.
15 http://www.gasgovernance.co.uk/monitors
Overview The ‘protected by monitor’ element of the space Safety Monitor has both demand assumptions and supply assumptions. The demand assumptions are from

56
Operational challengesThe way the network is being used by our customers within day is changing. We are working with the industry to understand the impact of this to ensure we embrace this in our future designs, both commercially and physically, so we are able to continue to meet our customer needs in delivering gas.
Key messagesn Supply and demand profiling continues to generate increased levels
of linepack swing seen on the networkn The average linepack utilised on a daily basis has increased
by over 300% since winter 2002/03. Last winter saw linepack deplete by 38.6 mcm on a single day
n The average linepack depletion per day reduced in 2014/15 compared to the previous winter. However four of the largest five linepack swings ever recorded occurred between 2 February and 11 February 2015
n Although a large depletion in linepack, and the subsequent high replenishment rates, make forecasting our end of day pressure obligations difficult, we continue to meet, on average, 99.6% of all assured and agreed pressures throughout the year
n We are consulting with the industry through IED/Flex workshops to fully understand the implications of the issues.
Linepack utilisationThe NTS has historically been built to transport gas efficiently, based on flat supply and demand, within a range of operating pressures. The ability of the network to manage a supply/demand mismatch varies according to prevailing network conditions, asset availability and profile of expected supplies and demands. It is therefore complex to simply model and report the limits of availability.
We have over recent winters both seen and reported on a marked increase in within [commercial gas] day supply and demand profiling alongside day to day changes. These have resulted in a notable trend towards later reconciliations of daily balance.
Figure 17 shows how the rates of supply and demand can vary throughout the day where the highest ever linepack swing was seen. Figure 18 highlights how the different sources caused these fluctuations on the same day.

57Winter Outlook Report
Key termsLinepack: the amount of gas within the National Transmission System. The more linepack in the system, the higher the gas pressure will be.
Linepack swing: the difference between the amount of gas in the system at the start of the day and the lowest point during the day.
Figure 17Supply v Demand
300
310
330
320
350
340
360
200
mcm
Rat
e
mcm
Lin
epac
k
250
225
400
375
350
325
300
275
425
06:0
007
:00
08:0
009
:00
10:0
011
:00
12:0
013
:00
14:0
015
:00
16:0
017
:00
18:0
019
:00
20:0
021
:00
22:0
023
:00
24:0
001
:00
02:0
003
:00
04:0
005
:00
DemandSupplyActual Linepack
Linepack Swing (38.6)

58
The data in Figure 19 highlights that the last two winters have had the biggest proportion of days where high linepack swings have been seen. The largest of those swings was experienced in February last winter. Over the duration of last winter there were a number of different supply points and demand offtakes that contributed to the swings seen.
However the volume differences vary for each supply point/offtake type over the period with no uniform patterns; this makes it difficult to accurately forecast the magnitude of the swing in advance.
0
Hou
rly F
low
(mcm
)
0.5
2.0
1.5
1.0
2.5
3.0
4.0
3.5
4.5
07:0
008
:00
09:0
010
:00
11:0
012
:00
13:0
0
15:0
014
:00
16:0
017
:00
18:0
019
:00
20:0
021
:00
22:0
023
:00
00:0
001
:00
03:0
0
05:0
0
02:0
0
04:0
0
06:0
0
LNG (Supply)Storage Withdrawal (Supply)Interconnector (Supply)
Time
Figure 18Supply v Demand
0
Hou
rly F
low
(mcm
)
Time
2
8
6
4
10
12
07:0
008
:00
09:0
010
:00
11:0
012
:00
13:0
0
15:0
014
:00
16:0
017
:00
18:0
019
:00
20:0
021
:00
22:0
023
:00
00:0
001
:00
03:0
0
05:0
0
02:0
0
04:0
0
06:0
0
Power (Demand)LDZ (Demand)

59Winter Outlook Report
If we do see a day with high linepack depletion, National Grid has a range of operational and commercial tools available to ensure the safety and security of operation. These include using operational solutions such as network reconfiguration and compressor running strategies. Actions have limited impact on network users. At times these may be insufficient and commercial tools, such as restriction of network flexibility, capacity actions and locational balancing, may be required.
Supply uncertaintiesAs the UK Continental Shelf (UKCS) supplies decline and GB becomes more reliant on imports, the ability to accurately predict the supply patterns each day becomes increasingly difficult.
Figure 19Comparison of swing of NTS linepack (mcm)
An anticipated reduction in supply this winter from Rough Storage and from BBL via the Groningen field adds further complexity.
Supply options are becoming increasingly price sensitive with fast cycle storage sites switching between injection and withdrawal regularly within day as energy prices fluctuate.
This can lead to multiple revisions of within day operational and commercial strategies as network configurations and compressor operations are revised to meet the changes. Figure 20 illustrates the fast cycle storage behaviour seen last winter.
0
Line
pak
Sw
ing
(mcm
)
5
35
30
25
20
15
10
40
45
Oct
Nov
Dec Jan
Feb
Mar
2002/032007/082012/132013/142014/15

60
Winter 2014/15 saw an increase in the number of supply losses notified to us by terminal operators from the previous winter. This also resulted in an increase in the end of day loss seen from 265 mcm in 2013/14 to 419 mcm last winter.
Figure 21 highlights how supply sources have changed over the past five winters. Increased Norwegian flows and variability with interconnector, storage and LNG outputs can be seen.
Figure 21Supply patterns 2010/11 to 2014/15
0
20%
40%
80%
60%
100%
2010/11
2011/12
2012/13
2013/14
2014/15
InterconnectorStorageLNGNorwayUKCS
39% 40% 31% 36% 33%
25% 31%
35% 37% 38%
20% 14%
6% 6% 10%
7% 6%
11% 7%
10%
9% 8% 17% 13% 8%
Figure 20Medium range storage behaviour winter 2014/15
0
mcm
10
40
30
20
50
60
01/1
0/14
08/1
0/14
15/1
0/14
22/1
0/14
29/1
0/14
05/1
1/14
12/1
1/14
26/1
1/14
19/1
1/14
03/1
2/14
10/1
2/14
31/1
2/14
07/0
1/15
14/0
1/15
21/0
1/15
28/0
1/15
04/0
2/15
11/0
2/15
18/0
2/15
25/0
2/15
04/0
3/15
11/0
3/15
18/0
3/15
25/0
3/15
Storage InjectionStorage Withdrawal
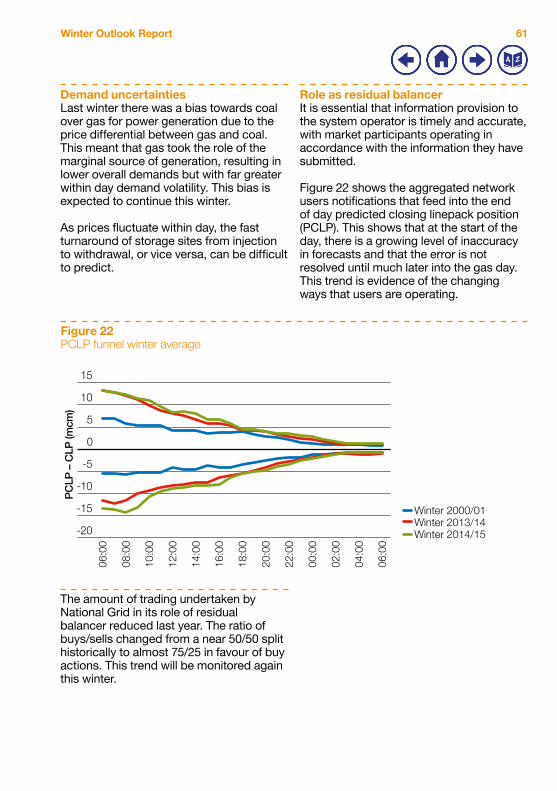
61Winter Outlook Report
Figure 22PCLP funnel winter average
-20
PC
LP –
CLP
(mcm
)
-15
-10
-5
0
10
5
15
06:0
0
08:0
0
10:0
0
12:0
0
14:0
0
16:0
0
18:0
0
20:0
0
22:0
0
00:0
0
02:0
0
04:0
0
06:0
0
Winter 2000/01Winter 2013/14Winter 2014/15
Role as residual balancerIt is essential that information provision to the system operator is timely and accurate, with market participants operating in accordance with the information they have submitted.
Figure 22 shows the aggregated network users notifications that feed into the end of day predicted closing linepack position (PCLP). This shows that at the start of the day, there is a growing level of inaccuracy in forecasts and that the error is not resolved until much later into the gas day. This trend is evidence of the changing ways that users are operating.
Demand uncertaintiesLast winter there was a bias towards coal over gas for power generation due to the price differential between gas and coal. This meant that gas took the role of the marginal source of generation, resulting in lower overall demands but with far greater within day demand volatility. This bias is expected to continue this winter.
As prices fluctuate within day, the fast turnaround of storage sites from injection to withdrawal, or vice versa, can be difficult to predict.
The amount of trading undertaken by National Grid in its role of residual balancer reduced last year. The ratio of buys/sells changed from a near 50/50 split historically to almost 75/25 in favour of buy actions. This trend will be monitored again this winter.
62
Regime changesThe introduction of new EU codes for capacity, balancing, interoperability and transparency will incorporate some fundamental changes for gas day re-definition and Bacton ASEP reconfiguration.
The commercial default cash out prices will increase by over 10%.
The Gas Security of Supply Significant Code Review (SCR) has been introduced to reduce the likelihood, severity and duration of a gas supply emergency. The changes, effective from 1 October 2015, ensure that in an emergency the market rules provide incentives on shippers to balance the market, by reforming cash-out arrangements.
Gas shippers who do not balance their supply and demand are subject to cash-out charges. Previously, the cost of interrupting any consumer involuntarily was not factored into the cash-out price. The new arrangements change the imbalance prices faced by shippers in a gas deficit emergency (GDE) and use funds collected through cash-out to pay consumers that have been involuntarily interrupted. The reforms are:
n Cash-out prices are unfrozen in an emergency
n The cost of involuntary interruption for domestic customers is calculated at £14 per therm and this is incorporated into cash out charges
n Funds recovered from cash-out charges are used to make payments to consumers for the involuntary service they provide in a GDE.
Information provisionNational Grid is the residual balancer and carries out balancing trades when there is a risk that the end of day system balance and hence linepack levels will be outside of expected tolerances. Where appropriate, National Grid can issue further information to the market via an Active Notification System notice, an ad-hoc website update or, in the more severe cases, via a Margins Notice or Gas Deficit Warning to highlight the issue in sufficient time for market participants to take effective action to remedy the imbalance.
The Margins Notice provides the industry with a day ahead notification of a forecast supply deficit against the forecast NTS demand. A Gas Deficit Warning can be issued in advance of, or during the gas day. It indicates that there is a significant risk of not achieving the end of day NTS balance position. National Grid offers a subscription service for Gas Deficit Warnings at the following link: Gas Deficit Warnings
Our operational data details real time information. As physical and regime changes occur the industry will see these developments incorporated into the existing suite of reports and data items. Users can also subscribe to receive update notifications by using this link: Operational Data

63Winter Outlook Report
Gas/electricity interactionGas-fired power generation is one of the responses available to help manage the daily demand pattern and variability of renewable generation. This causes changes in gas demand which the gas System Operator must manage.
Key messagesn Flexibility from gas-fired generation is one of the principle ways to manage
variations in renewable generationn If all variations in renewable generation were managed by gas-fired
generation this winter: – Day to day changes in renewable generation could be managed without
operational difficulties – Within day changes are unlikely to cause additional operational
challenges this winter n We believe that we will be able to manage the gas/electricity interaction
throughout winter 2015/16.
Overview Gas-fired power generation is the tool predominantly used by market participants and the System Operator to manage day to day and within day variation caused by the daily demand pattern and the variation in renewable output.
The use of gas-fired generation to balance variations in electricity generation brings with it an increasing focus on analysing the effects on the gas transmission system.
The analysis in this section provides detail on the variations in gas demand we are likely to experience as a result of gas-fired generation on both typical and extreme days. We believe that we will be able to manage this interaction throughout winter 2015/16.

64
Day to day variationsThe largest day to day variations for combined wind and solar generation last winter were 140 GWh, with an average of approximately 35 GWh. If this was all to be managed by gas-fired power generation it would result in average gas demand changes of approximately 6 mcm/d, up to a maximum of around 26 mcm/d. If the increase in renewable capacity since last winter is considered, it could result in gas demand changes with a potential of 7 mcm for an average day and 28 mcm for the maximum day respectively. The magnitude of these changes is unlikely to cause any additional operational challenges this winter. These ranges are illustrated in Figure 23.
Analysis
The potential gas demand from gas-fired generation this winter is expected to be between 15 and 78 mcm/d. This is a range of 63 mcm/d.
During winter 2014/15, combined wind and solar PV generated instantaneous outputs were estimated to average around 5 GW. Maximum and minimum combined instantaneous outputs were estimated to be approximately 13 GW and 0.5 GW respectively. If this variability was to be met solely by gas-fired generation it would represent changes in gas demand of over 50 mcm/d. It is unlikely that this change in gas demand will occur this winter as it represents the highest potential range of flexibility required from gas-fired generation over the whole winter period. Whilst gas-fired power generation contributes a considerable proportion of the necessary flexibility required to respond to the variability of renewable generation, it does not account for all of it.
To better establish how much gas-fired generation may be required to respond to variations in renewable generation this section will address day to day and within day changes separately.

65Winter Outlook Report
Figure 23Total expected range for power generation gas demands compared to potential influence of solar and wind
0
Dem
and
(mcm
/day
)
Max potential range of gas demand to cover changes in
renewable generation
Average potential range of gas demand to cover changes in
renewable generation
Expected winter range
20
10
60
50
70
40
30
80
Within day variationsThe largest within day variations for wind and solar generation combined last winter were approximately 8 GW, with an average of 3 GW. If this was all to be covered by changes in gas-fired power generation, it would result in average gas demand rate changes of around 15 mcm/d and a maximum of around 36 mcm/d. For winter 2015/16, with the increase in renewables considered, it would result in gas demand changes with a potential of 16 mcm/d rate for an average day and around 40 mcm/d rate change for the maximum day.
The potential rate changes on an average day would be unlikely to cause additional operational challenges this winter. Significant within day variation of renewable generation, which could have resulted in potential gas demand changes over 30 mcm/d, occurred on only 5% of
days last winter. With so few days likely to experience this level of demand change, and not all renewable variability being met by gas-fired power generation, within day variations are unlikely to cause operational issues this winter.
If demand variations do occur, National Grid as the gas System Operator has a number of tools to ensure it can continue to effectively balance the system. These include network reconfiguration and compressor running, which have a limited impact on network users.
To demonstrate the potential impact of changes in wind and solar generation, we have examined two of the days that caused most operational challenges last winter. They show very different patterns of renewable generation, as illustrated in Figure 24.

66
Figure 24Instantaneous power generation from wind and solar on two days in winter 2014/15
0
Gen
erat
ion
(MW
)
Hour
1,000
500
4,000
3,500
3,000
2,500
2,000
1,500
4,500
1 2 3 4 5 6 7 8 9 10 11 12 13 14 15 16 17 18 19 20 21 22 23 24
Day 1Day 2
These days both show considerable within day variation, but very different patterns. Generation on day 1 finished the day almost at the same level as the start of the day but shows within day variation. Generation on day 2 reduced considerably. If all flexibility had been met by gas-fired generation, gas demand rate changes of 5 mcm/d would have been required for day 1. For day 2 a 13 mcm/d rate change would have been required. Both of these rate changes are manageable.
On both of these days last winter, the requirement for gas-fired generation to respond to changes in renewable generation had limited impact on the gas network.
All potential within day variations are shown in Figure 25. The average expected potential is represented by the dashed line. The figures in the chart represent the highest potential impact, with the actual impact likely to be less. It is difficult to assess exactly how much less, but as gas-fired generation has such high flexibility it may be the majority of the illustrated potential.
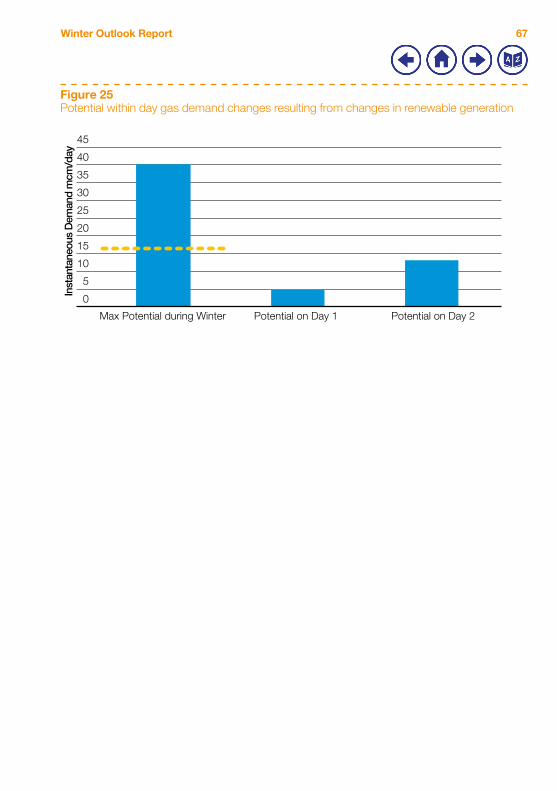
67Winter Outlook Report
Figure 25Potential within day gas demand changes resulting from changes in renewable generation
0
Inst
anta
neou
s D
eman
d m
cm/d
ay
Potential on Day 1 Potential on Day 2Max Potential during Winter
15
10
5
35
30
40
25
20
45

68
Acronym Word Section Description 1-in-20 demand Electricity A particular combination of weather elements
which gives rise to a level of winter peak demand with a 5% chance of being exceeded as a result of weather variation alone. We have removed the 1-in-20 demand from our electricity analysis this year.
1-in-20 peak day demand
Gas The level of demand that, in a long series of winters, with connected load held at the levels appropriate to the winter in question, would be exceeded in one out of 20 winters, with each winter counted only once.
ASEP Aggregated system entry point
Gas The point at which a collection of sub-terminals joins the National Transmission System.
Annual power demand
Electricity The electrical power demand in any one fiscal year. Different definitions of annual demand are used for different purposes.
ACS Average cold spell Electricity A particular combination of weather elements which gives rise to a level of winter peak demand which has a 50% chance of being exceeded as a result of weather variation alone. There are different definitions of ACS peak demand for different purposes.
Average winter Gas The average winter condition that has applied over the last 50 years.
BM Balancing Mechanism
Electricity The Balancing Mechanism is a regulated market framework used to balance supply and demand in each half hour trading period of every day. If National Grid predicts that there will be a discrepancy between the amount of electricity produced and that which will be in demand, during a certain time period, they may accept a ‘bid’ or ‘offer’ to either increase or decrease generation (or consumption).
BBL Balgzand Bacton Line
Gas A gas pipeline between Balgzand in the Netherlands and Bacton in the UK. http://www.bblcompany.com
Baseload Various The permanent minimum load that a system experiences.
bcm billion cubic metres
Gas Unit or measurement of volume, used in the gas industry. 1 bcm = 1,000,000,000 cubic metres.
BritNed Electricity BritNed Development Limited: A joint venture of Dutch TenneT and British National Grid that operates the electricity link between Great Britain and the Netherlands. It is a bi-directional interconnector with a capacity of 1,000 MW.
Glossary

69Winter Outlook Report
Acronym Word Section Description Capacity Assessment
Electricity Ofgem’s annual report to the Secretary of State assessing the risks to electricity security of supply in Great Britain for the next five winters. The last Capacity Assessment was published in 2014. In 2015, Ofgem published a shorter Electricity Security of Supply report covering the next three winters only.
Clean forecast Electricity A forecast using data that is largely unadjusted.CLP Closing linepack Gas The volume of gas held within the NTS
at the end of the gas day (05:00hrs).CCGT Combined cycle
gas turbineVarious Gas turbine that uses the combustion of natural
gas or diesel to drive a gas turbine generator to generate electricity. The residual heat from this process is used to produce steam in a heat recovery boiler which in turn, drives a steam turbine generator to generate more electricity.
Compressor Gas Compressors are used to move gas around the network through high pressure transmission pipes. There are currently 68 compressors at 24 compressor sites across the country. These compressors move the gas from entry points to exit points on the gas network. They are predominately gas driven turbines which are in the process of being replaced with electric units.
Cycling rates Gas The average number of times a reservoir’s working gas volume can be turned over during a specific period of time.
DBSR Demand side balancing reserve
Electricity Demand side balancing reserve (DSBR) is a balancing service that has been developed to support National Grid in balancing the system. DSBR provides an opportunity for large consumers or owners of small embedded generation to earn money through a combination of upfront payments and utilisation payments by contracting to reduce demand or provide generation when required. The service may be required for short periods between 4pm and 8pm on weekday evenings between November and February.
DSR Demand side response
Various A deliberate change to an industrial and commercial user’s natural pattern of metered electricity or gas consumption, brought about by a signal from another party.
De-rated capacity margin
Electricity The sum of generators declared as being available during the time of the peak demand, minus the expected demand at that time and a basic generation reserve requirement that is held by the System Operator. It is presented as a percentage.
De-rated generation availability
Electricity Submitted generator data which has been reduced to allow for shortfalls and breakdowns which includes imports from the continent.

70
Acronym Word Section Description Distributed generation
Electricity Generation connected to the distributed networks which is equal or greater than 1 MW in size, up to onshore transmission areas’ mandatory connection thresholds. The thresholds are 100 MW in NGET transmission area, 30 MW in Scottish Power (SP) transmission area and 10 MW in Scottish Hydro-Electric Transmission (SHET) transmission area.
DN Distribution network
Gas Distribution network operators own and operate gas distribution networks.
DNO Distribution network operator
Electricity Distribution network operators own and operate electricity distribution networks.
Diversified peak demand
Gas Demand that could be expected for the country as a whole on a very cold day.
EWIC East West Interconnector
Electricity A 500 MW interconnector that links the electricity transmission grids of Ireland and Great Britain.
Embedded generation
Electricity Power generating stations/units that don’t have a contractual agreement with the National Electricity Transmission System Operator (NETSO). They reduce electricity demand on the National Electricity Transmission System.
EFC Equivalent Firm Capacity
Electricity An assessment of the entire wind fleet’s contribution to capacity adequacy. It represents how much of 100% available conventional plant could theoretically replace the entire wind fleet and leave security of supply unchanged.
ETS European Trading Scheme
Gas An EU wide system for trading greenhouse gas emission allowances which covers more than 11,000 power stations and industrial plants in 31 countries.
EU European Union Various A political and economic union of 28 member states that are located primarily in Europe.
Frequency response
Electricity An ancillary service procured by National Grid as System Operator to help ensure system frequency is kept as close to 50 hertz as possible. Also known as frequency control or frequency regulation.
FES Future Energy Scenarios
Various The FES is a range of credible futures which has been developed in conjunction with the energy industry. They are a set of scenarios covering the period from now to 2050, and are used to frame discussions and perform stress tests. They form the starting point for all transmission network and investment planning, and are used to identify future operability challenges and potential solutions.
Gas Deficit Warning
Gas A Gas Deficit Warning can be issued at the discretion of the Transmission System Operator in advance of or during the gas day and indicates that there is a significant risk of not achieving the end of day NTS balance position.
GTYS Gas Ten Year Statement
Gas The GTYS illustrates the potential future development of the (gas) National Transmission System (NTS) over a ten year period and is published on an annual basis.

71Winter Outlook Report
Acronym Word Section Description Generator capacity
Electricity The total capacity of all generators.
Generation margins
Electricity The sum of generators declared as being available during the time of the peak demand, minus the expected demand at that time and a basic generation reserve requirement that is held by the System Operator. This is presented as a percentage.
GW Gigawatt Electricity 1,000,000,000 watts, a measure of power.GWh Gigawatt hour Electricity 1,000,000,000 watt hours, a unit of energy.GWh/d Gigawatt hours
per dayElectricity 1,000,000,000 watt hours per day.
GB Great Britain Various A geographical, social and economic grouping of countries that contains England, Scotland and Wales.
GSP Grid Supply Points
Electricity A connection point between the Transmission System and the Distribution System.
Interconnector, gas
Gas Gas interconnectors are transmission assets that connect the GB market to other European gas markets. There are currently three gas interconnectors which connect to the National Transmission System (NTS). These are: – IUK interconnector to Belgium– BBL to the Netherlands– Moffat to the Republic of Ireland,
Northern Ireland and the Isle of Man. Interconnector, power
Electricity Electricity interconnectors are transmission assets that connect the GB market to other European markets and allow suppliers to trade electricity between markets.
IUK Interconnector (UK) Limited
Gas A bi-directional gas pipeline between Bacton in the UK and Zeebrugge Belgium. http://www.interconnector.com
IFA Interconnexion France Angleterre
Electricity The England-France Interconnector is a 2,000 MW link between the French and British transmission systems with ownership shared between National Grid and Réseau de Transport d’Electricité.
Linepack Gas The volume of gas within the National Transmission System (NTS) pipelines at any time.
LNG Liquefied natural gas
Gas LNG is formed by chilling gas to -161˚C so that it occupies 600 times less space than in its gaseous form. This enables the gas to be transported by ship. http://www2.nationalgrid.com/uk/Services/Grain-lng/what-is-lng/
Load Various The energy demand experienced on a system.LDZ Local Distribution
ZoneGas A gas distribution zone connecting end users
to the (gas) National Transmission System.

72
Acronym Word Section Description LOLE Loss of load
expectationElectricity LOLE is used to describe electricity security of
supply. It is an approach based on probability and is measured in hours/year. It measures the risk, across the whole winter, of demand exceeding supply under normal operation. This does not mean there will be loss of supply for X hours/year. It gives an indication of the amount of time, across the whole winter, the system operator (SO) will need to call on balancing tools such as voltage reduction, maximum generation or emergency assistance from interconnectors. In most cases, loss of load would be managed without significant impact on end consumers.
Margin Various The difference between the level of demand and supply that is available to meet it.
Margins Notice Gas A day-ahead notification, to the industry, of a forecast supply deficit should forecasted NTS demand exceed assumed NTS supply.
MW Megawatt Electricity 1,000,000 watts, a measure of power.mcm Million cubic
metersGas Unit or measurement of volume, used in the gas
industry. 1 mcm = 1,000,000 cubic metres.mcm/d Million cubic
meters per dayGas Unit or measurement of volume per day, used in the
gas industry. 1 mcm = 1,000,000 cubic metres.Moyle Electricity A 250 MW bi-directional interconnector
between Northern Ireland and Scotland.N-1 N-1 Gas A test to ensure there is sufficient gas infrastructure
to meet demand in the event of the failure of the largest single piece of infrastructure. This test is used by the European Commission to test security of supply across all member states as defined in regulation No 994/2010. http://eur-lex.europa.eu/legal-content/EN/TXT/?uri=CELEX:32010R0994
NBP National balancing point (NBP) gas price
Gas Britain’s wholesale NBP gas price is derived from the buying and selling of natural gas in Britain after it has arrived from offshore production facilities. https://www.ofgem.gov.uk/gas/wholesale-market/gb-gas-wholesale-market
NETS National Electricity Transmission System
Electricity It transmits high-voltage electricity from where it is produced to where it is needed throughout the country. The system is made up of high voltage electricity wires that extend across Britain and nearby offshore waters. It is owned and maintained by regional transmission companies, while the system as a whole is operated by a single system operator (SO).
NTS National Transmission System
Gas A high-pressure gas transportation system consisting of compressor stations, pipelines, multijunction sites and offtakes. NTS pipelines transport gas from terminals to NTS offtakes and are designed to operate up to pressures of 94 bar.

73Winter Outlook Report
Acronym Word Section Description NSS Non Storage
SupplyGas All gas supplies to the National Transmission System
excluding short, medium and long range storage. Normalised demand
Electricity Demand forecast for each week of the year based on a 30 year average of each relevant weather variable. This is then applied to linear regression models to calculate what the demand could be with this standardised weather.
NISM Notification of Inadequate System Margin
Electricity A routine notification issued to generators, interconnected system operators and suppliers to advise there is a likelihood that there will be an inadequate margin of reserve capacity available. The purpose is to make the recipients aware and request that additional reserve capacity is made available.
OFGEM Office of Gas and Electricity Markets
Various The UK’s independent National Regulatory Authority, a non-ministerial government department. Their principal objective is to protect the interests of existing and future electricity and gas consumers.
OCGT Open Cycle Gas Turbine
Various Gas turbines in which air is first compressed in the compressor element before fuel is injected and burned in the combustor.
OC2 Operational Code 2 data
Electricity Information provided to National Grid by generators which includes their current generation availability and known maintenance outage plans. It is possible to access the latest OC2 data throughout the year on the BM Reports website http://www.bmreports.com
Operational surplus
Electricity The difference between demand (including the amount of reserve held) and the generation expected to be available, modelled for each week of winter. It includes both planned outages and assumed breakdown rates for each power station type.
Peak demand Electricity The maximum power demand in any one fiscal year. Peak demand typically occurs at around 5:30pm on a week-day between December and February. Different definitions of peak demand are used for different purposes.
Peak demand Gas The 1-in-20 peak day demand is the level of demand that, in a long series of winters, with connected load held at levels appropriate to the winter in question, would be exceeded in one out of 20 winters, with each winter counted only once.
pa Per annum Various Per year.PCLP Predicted closing
linepack positionGas The predicted volume of gas held within the
NTS at the end of the gas day (05:00hrs).Residual Balancer Gas Users of the system are required to balance
supply into, and demand from the network. If this balance is not expected to be achieved on any given day, then the System Operator (National Grid), as Residual Balancer, will enter the market and undertake trades (buys or sells) to seek to resolve any imbalance on the system.

74
Acronym Word Section Description Restricted Electricity An estimate of the demand after any customer
demand management has occurred.Safety Monitor Gas A system to ensure that sufficient gas is held
in storage to support those gas consumers whose premises cannot be physically and verifiably isolated from the gas network within a reasonable time period.
Seasonal normal Gas The level of gas demand that would be expected when the effect of weather is removed.
STOR Short term operating reserve
Electricity Short term operating reserve (STOR) is a service for the provision of additional active power from generation and/or demand reduction.
Station load Electricity The onsite power station requirement, for example for systems or start up.
SBR Supplemental balancing reserve
Electricity Supplemental balancing reserve (SBR) is a balancing service that has been developed to support National Grid in balancing the system. Contracts are set up between National Grid and generators to make their power stations available in winter, where they would otherwise be closed or mothballed.
SO System operator Various An entity entrusted with transporting energy in the form of natural gas or power on a regional or national level, using fixed infrastructure. Unlike a TSO, the system operator may not necessarily own the assets concerned. For example, National Grid operates the electricity transmission system in Scotland, which is owned by Scottish Hydro Electricity Transmission and Scottish Power.
Transmission system demand
Electricity Demand that National Grid as System Operator see at grid supply points (GSPs), which are the connections to the distribution networks. It includes demand from the power stations generating electricity (the station load) and interconnector exports.
Triad Electricity Triad demand is measured as the average demand on the system over three half hours between November and February (inclusive) in a financial year. These three half hours comprise the half hour of system demand peak and the two other half hours of highest system demand which are separated from system demand peak and each other by at least ten days.
UKCS UK Continental Shelf
Gas The UK Continental Shelf (UKCS) comprises those areas of the sea bed and subsoil beyond the territorial sea over which the UK exercises sovereign rights of exploration and exploitation of natural resources.
Undiversified peak demand
Gas Peak day demand calculated for each offtake independently and then added together.

75Winter Outlook Report
Acronym Word Section Description UK United Kingdom
of Great Britain and Northern Ireland
Various A geographical, social and economic grouping of countries that contains England, Scotland, Wales and Northern Ireland.
Weather corrected demand
Electricity A 30 year average of each relevant weather variable is constructed for each week of the year. This is then applied to linear regression models to calculate what the demand would have been with this standardised weather. It is the demand expected or outturned with the impact of the weather removed.
Weather corrected demand
Gas Actual demand converted to demand at seasonal normal weather conditions by subtracting the difference between the seasonal normal composite weather variable (CWV) and actual CWV multiplied by the weather sensitivity term in the daily demand model. It is the demand expected with the impact of weather removed.
WOR Winter Outlook Report
Various The Winter Outlook Report is published each year in October by National Grid to show the expected security of supply position on both the gas and electricity systems for the coming winter. It is the product of the winter consultation process and is based on data supplied by the industry, market insight and analysis.

76

Winter Outlook Report 77
Legal NoticePursuant to their respective licences, National Grid Electricity Transmission plc operates the electricity transmission and National Grid Gas plc operates the gas transmission network.
For the purpose of this outlook document “National Grid” is used to refer to both licensed entities, whereas in practice their activities and sharing of information are governed by the respective licences.
National Grid has prepared this outlook document in good faith, and has endeavoured to prepare this outlook document in a manner which is, as far as reasonably possible, objective, using information collected and compiled by National Grid from users of the gas transportation and electricity transmission systems together with its own forecasts of the future development of those systems. While National Grid has not sought to mislead any person as to the contents of this outlook document and whilst such content represents National Grid’s best views as at the time of publication, readers of this document should not place any reliance on the contents of this outlook document. The contents of this outlook document must be considered as illustrative only and no warranty can be or is made as to the accuracy and completeness of such contents, nor shall anything within this outlook document constitute an offer capable of acceptance or form the basis of any contract. Other than in the event of fraudulent misstatement or fraudulent misrepresentation, National Grid does not accept any responsibility for any use which is made of the information contained within this outlook document.
CopyrightAny and all copyright and all other intellectual property rights contained in this outlook document belong to National Grid. To the extent that you re-use the outlook document, in its original form and without making any modifications or adaptations thereto, you must reproduce, clearly and prominently, the following copyright statement in your own documentation: © National Grid plc, all rights reserved.

78
National Grid plcNational Grid House, Warwick Technology Park, Gallows Hill, Warwick. CV34 6DA United KingdomRegistered in England and Wales No. 4031152
www.nationalgrid.com