winning through shelf-centered collaboration
TRANSCRIPT

Creating Value through CustomizationWinning through Shelf-Centered Collaboration

Grocery Manufacturers Association
The Grocery Manufacturers Association (GMA) represents the world’s leading branded food, beverage and consumer products companies. Since 1908, GMA has been an advocate for its members on public policy issues and has championed initiatives to increase industry wide productivity and growth. GMA member companies employ more than 2.5 million workers in all 50 states andaccount for more than US$680 billion in global annual sales. The association is led by a board of member company chief executives. For more information, visit the GMA web site at www.gmabrands.com.
Booz Allen Hamilton
Booz Allen Hamilton has been at the forefront of management consulting for businesses and governments for more than 90 years. Integrating the full range of consulting capabilities, Booz Allen is the one firm that helps clients solve their toughest problems, working by their side to help them achieve their missions.Booz Allen is committed to delivering results that endure.
With 18,000 employees on six continents, the firm generates annual sales that exceed $3.7 billion. Booz Allen has been recognized as a consultant and an employer of choice. In 2005 and in 2006, Fortune magazine named Booz Allen one of “The 100 Best Companies to Work For,” and for the past sevenyears, Working Mother has ranked the firm among its “100 Best Companies forWorking Mothers.”
Our global Consumer & Media practice is the largest and fastest growing commercial practice within the firm. Representative service offerings include Innovation, ROI Marketing, Trade Promotion Effectiveness, Supply Chain Management, Sales Force Effectiveness, Organizational Effectiveness, Smart Customization, and Post-Merger Integration. Our clients include leading companies across products categories such as food and beverage, personal care, apparel, durable goods and home improvement.
To learn more about the firm, visit the Booz Allen Web site at www.boozallen. com. To learn more about the best ideas in business, visit www.strategy- business.com, the Web site for strategy+business, a quarterly journal sponsored by Booz Allen.
© Copyright 2006 by the Grocery Manufacturers Association and Booz Allen Hamilton.All rights reserved. No part of this publication may be reprinted
or reproduced in any way without written consent from GMA or Booz Allen Hamilton.

Table of Contents
i Methodology and Participants
1 Executive Summary
4 Key Findings
19 Selected References
About the Authors
Richard Kauffeld, a Partner based in New York with over 20 years of consulting and senior CPG experience, specializes in strategy, transformation programs and supply chain management. Rich can be reached at (212) 551-6582 or at [email protected].
Matthew Egol, a Principal based in New York with 10 years consulting experience, specializes in channel strategies and “go to market” solutions for consumer packaged goods clients. Matt can be reached at (212) 551-6716 or [email protected].
Elisabeth Hartley, an Associate in the firm’s New York office, has worked withclients in consumer packaged goods clients since joining Booz Allen.
Table of Contents

Methodologyand Participants
i Creating Value through Customization
This study was jointly sponsored by the GMA Supply Chain Vanguard and Salescommittees. It focused on both product and services customization in order to develop key insights into how CPG manufacturers and retailers can better address the challenges of creating win-win customization programs.
The study combined a written survey of manufacturers and retailers with detailed case examples for select manufacturers. The surveys addressed topics such as the focus of manufacturers’ and retailers’ current customization programs, the relative effectiveness of different forms of customization,and processes and metrics for successfully managing customization. The case studies provided additional in-depth assessment of the economics of customization programs, key breakdowns for less effective programs, and key success factors for greater program effectiveness.
The Grocery Manufacturers Association and Booz Allen Hamilton would like to sincerely thank the following companies for their participation in this study:
All responses to the study were treated as confidential information. Specific responses of individual participants were not identified.
CPG Manufacturers
} Alberto-Culver Company } Mariani Packaging Company, Inc.
} Bimbo Bakeries, USA } Masterfoods USA
} Campbell Soup Company } McCain Foods USA, Inc.
} Clorox Company, The } McCormick & Company, Inc.
} Dial Corporation, The } Meadwestvaco Corp.
} Diamond Foods, Inc. } Nestle Waters North America, Inc.
} General Mills, Inc. } Pharmavite LLC
} Georgia-Pacific Corporation } Playtex Products, Inc.
} International Paper Company } Reily Foods Company
} Johnson & Johnson } Rich Products Corporation
} Kimberly-Clark Corporation } San Antonio Farms
} Kraft Foods, Inc. } Sara Lee Corporation
} Land O’ Lakes, Inc. } Welch Foods, Inc.
Retailers
} Brookshire Market
} CVS Pharmacy
} Giant Eagle, Inc.
} Meijer, Inc.
} PetSmart, Inc.
} Publix Super Markets, Inc.
} Rite Aid Corp.
} Target Brands, Inc.
Methodology and Participants

1 Winning through Shelf-Centered Collaboration
Retailers are increasingly demanding customized products and services from consumer goods manufacturers. Manufacturers, seeking volume growth and looking to improve their competitive position with key customers, strive to meet these demands, driving additional complexity into their businesses. The results from such efforts have clearly been mixed: half of all customization programs fail to meet the goals of either the manufacturer or the retailer; product costs and complexity increase, yet sales do not grow enough. Perhaps more importantly, opportunities to maximize shelf performance erode as less effective programs and proliferating SKUs compete for valuable display space and promotional resources.
As frustrating as customization can be, simply rationalizing the number of customization events will not solve the problem. The growth in customization is closely linked to efforts by both manufacturers and retailers to meet important objectives. To improve program effectiveness, retailers and manufacturers need to take a more strategic approach that better integrates shelf-forward efforts to drive consumer response with shelf-back programs to create a more efficient supply chain from product sources to the shelf.
Our report identifies a set of successful practices for Shelf-Centered Collaboration that significantly improves program effectiveness and enhances efforts to build market-leading merchandising and supply chain capabilities.
Four key findings:
1. Retailers and manufacturers are each driving increased customization in pursuit of category growth and cost efficiency.
Growth in customization has accelerated with the emergence of new retail formats, such as warehouse clubs and dollar stores. Eager to differentiate between their formats and competing channels, retailers asked manufacturers to create exclusive products or new sizes and packaging options such asclub sizes, multi-packs, variety packs and bundled products. Manufacturers responded proactively to this changing environment, introducing a variety of customization options to promote greater in-store merchandising effectiveness. These programs seek to replicate some of the benefits of an in-store direct- store-delivery (DSD) model by creating more points of presence in a store, increasing the quantity and quality of display share, shelf-space, and signage.
In parallel, a desire to create more efficient supply chains drives customization programs. These collaborative planning efforts focus on improving the flow of products to the shelf, reducing out-of-stocks and unsaleables, and improving promotion program compliance and cost efficiency.
Not surprisingly, given these important drivers of customization, two-thirds of manufacturers surveyed said they had seen an increase in customization over the past three years and expect that trend to continue. An equal proportionof retailers polled agree that customization of products and services will also increase over the next few years.
Executive Summary
Executive Summary

2 Creating Value through Customization
2.Despite considerable efforts, half of customization programs fail to meet the objectives of either the manufacturer or retailer.
Manufacturers believe product and service customization programs are more likely to create value for retailers than for themselves. On average, the manufacturers surveyed estimated that product and service customization create value for retailers approximately two-thirds of the time – but less than half the time for the manufacturer.
However, manufacturers’ perceptions are not supported by retailer feedback. Retailers surveyed say that most customization programs fail to deliver value that exceeds opportunity costs for space and labor. Retailers agree that the benefits of many customization programs do not outweigh the extra costs and complexity.
3.Success starts with making strategic choices about what to customize and where, rather than just focusing on complexity management.
We have found, across industries, that the biggest determinant of success consists of making two sets of choices: what to customize for whom, and what set of scalable capabilities to use. In a cross-industry study of 50 productand service companies, Booz Allen found that the companies we call “Smart Customizers” outperformed industry peers two-to-one in revenue growth and had profit margins five to 10 percent above their competitors.
The case studies from this report confirmed our prior findings that the most critical choice for creating shared value is what to customize, not how to manage the complexity in an existing program more efficiently. Creating a limited menu of items that can be customized turns out to be a much more efficient and cost-effective strategy than trying to accommodate ad hoc demands and then struggling to manage the resulting complexity.
4.Leaders create value through Shelf-Centered Collaboration with retailers. The power comes from developing shelf-forward insights and shelf-back enablement – together.
Customization programs based on joint insights and decisions tend to work better than those requests made to manufacturers on an ad hoc basis. Our study showed that the most successful programs are those where there is greater collaboration. Indeed, manufacturers who scored higher in our survey on a number of key dimensions for collaboration outperformed those who followed fewer of those successful practices.
Shelf-Centered Collaboration gives manufacturers the chance to not merely “do better” but also achieve substantially higher rates of success and build leading customer relationships. Getting to that level, however, requires substantial commitment to build the required data and insights, manage the collaborative process, and build adaptive capabilities that are scalable across the company’s portfolio of brands and business units.
Executive Summary
3 Winning through Shelf-Centered Collaboration
Conclusion
Clearly, the current customization boom will end in two ways – failure and success. Companies that continue on their present path of customizing without sufficient effort to create a more systematic, analytical approach will generally succeed and fail in equal measure – a track record that will crowd out other opportunities to invest as complexity increases and eats up whatever gains are made. For those companies that learn how to collaborate and plan theircustomization strategies, however, successes will become much more common than failures.
In summary, we identified 10 lessons learned for more effective Shelf-CenteredCollaboration:
#1 Understand all costs and value from end-to-end
#2 Manage trade-offs jointly
#3 Establish effective gating criteria
#4 Weed out losing programs
#5 Focus resources on the most promising strategic opportunities
#6 Require commitments for off-menu exceptions
#7 Sustain dialog throughout the program
#8 Measure compliance proactively
#9 Make-to-order for customized products
#10 Learn from your mistakes
And over time, such Shelf-Centered Collaboration will become not just a generator of new revenues at lower total incremental costs, but a profound source of innovation to create shared value with retail partners.
Executive Summary

4 Creating Value through Customization
Key Findings
1. Retailers and manufacturers are each driving increased customization in pursuit of category growth and cost efficiency.
Consumer packaged goods manufacturers used to face far less complexity in their businesses. They enjoyed fewer requests to customize products and services, and could focus on managing for greater scale and cost efficiency. Over the past decade, however, customization has increased dramatically.Much of the increase in customization has been driven by increased retail format competition. However, manufacturers’ own go-to-market strategies have been a contributing factor as well, as they seek to create shared value withkey retailers. Together, CPG manufacturers and retailers have pursued three basic strategies – complementary strategies, conceptually, but often tugging in different directions in reality – and the pursuit of those strategies has caused an unprecedented increase in complexity.
Exhibit 1: Customization Program Strategies
The current customization boom began with the introduction of new sizes and packaging options designed to create a closer fit with particular shopping occasions and create unique value for consumers. Retailers were looking for greater exclusivity on the shelf, both through their own investments in store brands, as well as through customized offerings from manufacturers.
Today, the appetite for customized goods and services continues to grow. Manufacturers face demands for customized products across club, dollar, mass merchants, drug, grocery and specialty retail channels alike. Retailers request an increasing number of exclusive SKUs, ranging from unique formulations, sizes, and packaging options such as multi-packs (the selling of the sameitem in bulk), variety-packs (mix of flavors of same item), and bundle-ins (the bundled packaging of complementary, but different, items). At the same time, manufacturers and retailers each see customized displays and pallets as a way to increase the effectiveness of promotional events in store.
IN-STORE MERCHANDISING EFFECTIVENESS
SUPPLY CHAIN EFFECTIVENESS
RETAILER DIFFERENTIATION
Unique Formulation / Content
Forms of Product CustomizationForms of Supply Chain Services Customization
Inventory Management
Special Handling
Bundled-In Items Graphics & Labeling
Multi-PacksUnique Size
Display Unit
Dedicated In-Store Support Unique Routes to Market Collaborative Planning
Pre-Mixed Pallets Special Pallets
Key Findings

5 Winning through Shelf-Centered Collaboration
Manufacturers and retailers have also jointly pursued a growing set of customized services. They have made investments in stronger category management, trade promotions, and shopper marketing insights capabilities in order to improve the effectiveness and efficiency at the shelf. They have also collaborated on a growing set of supply chain services to accommodate the ever-increasing variety of products that need to be brought from the plant floor to the shelf. Seeking to reduce stock outs and inventory investment, manufacturers and retailers have experimented with new ways to drive shorter order lead-times, more rapid replenishment, and better collaborative planning for promotions and custom displays.
Exhibit 2: Types of Product and Services Customization
As a result, customization represents a growing proportion of industry sales volume. As Exhibit 2 shows, the vast majority of CPG manufacturers provide a broad scope of product and services customization. Today, the largest proportion of manufacturers report that customization accounts for six to 10 percent of sales, with more than one-third of of manufacturers reporting that customized product sales are greater than 10 percent of their sales.
Exhibit 3: Customization of Products
Percent of Manufacturers for Whom CUSTOMIZED PRODUCTS Represent a Sizeable Portion of Total Sales Revenue
Percent of Manufacturers Pursuing Forms of SERVICES Customization
65%
Percent of Manufacturers Pursuing Forms of PRODUCT Customization
Unique Size 78%Display Unit
Multi-Packs
Unique FormulationBundled-
InItems
Graphics & Labeling
Inventory
Management
Pre-Mixed
Pallets
Special
Handling
CollaborativePlanning
Unique
Routes
Special
Pallets
Dedicated In-Store
Support
30%
52%
22%
26%
64%
68%
72%
84%
64%
56%
48%
Per
cent
of R
espo
nden
ts
2-5% 6-10% 11-20%
% of Sales from Customized Products
< 2% > 20%
20%
16%
28%
16%
20%
0
15
10
5
20
25
30%
Lesson #1: Understand all
costs and value from end-to-end.
One manufacturer worked closely with a retail partner to
develop better forecasts for incremental volume from
customized end-cap displays and special packaging, including estimates of
cannibalization from baseline sales. At the same time,
the manufacturer worked carefully to manage complexity from the
program and resulting costs. The result: product
customization options that were subsequently
approved drove sales lift of25 percent and 8 percent
higher profits after taking into account
cannibalization and all incremental costs.
Key Findings

6 Creating Value through Customization
Customization of services is even more widespread. Four out of 10 manufacturers say that customized supply chain services are provided to retailers accounting for more than 50 percent of their current sales volume, and nine out of 10 provide customized supply chain services to retailers representing at least 10 percent of their volume.
Exhibit 4: Customization of Supply Chain Services
Over the last three years, customization has risen substantially – and manufacturers and retailers both expect that the trend will continue. More than two-thirds of manufacturers saw the percentage of their sales from customized products increase over the past three years, and a comparable number saw the same for customized supply chain services. Looking forward, an even greater proportion expect further growth in customization over the next three years.
Exhibit 5: Growth in Customization for Manufacturers
Per
cent
of R
espo
nden
ts
Percent of Manufacturers Who Provide CUSTOMIZED SERVICES to a Sizeable Portion of Their Customers
% of Sales from Customers to Whom Customized Services Are Provided
< 10% 10-25% 25-50% > 50%
12%
20%
28%
40%
20%
0
5
10
15
20
25
30
35
40%
Lesson #2: Manage
trade-offs jointly.
A CPG manufacturer faced growing demands for
customized SKUs to support more differentiated trade promotions for retailers.
These demands often took the form of customized
displays with special product offers, such as unique sizes
or bundle-ins of complementary goods.
Recognizing the opportunity to engage the customer in a
more proactive dialog around what forms of events are
most effective, the manufacturer instituted a
“one fund” approach. Under the new model,
customization program costs are charged against trade
funds. In addition to this simple change, the
manufacturer’s sales teams also have a set of fact-based
toolsthey can use to frame
more productive collaboration.
Per
cent
of M
anuf
actu
rer R
espo
nden
ts
Customization Growth in Past 3 Years
Expected Growth over Next 2-3 Years
Increased Somewhat
Services
Increased Significantly
Products Products Services
68%72%
87%91%
0
20
40
60
80
100%
Per
cent
of M
anuf
actu
rer R
espo
nden
ts
0
20
40
60
80
100%
24%24%
44%48%
Key Findings

7 Winning through Shelf-Centered Collaboration
Retailers did not perceive the growth of product customization quite as strongly as manufacturers, perhaps because their attention is often focused on private label and store brands. Moreover, for retailers, product customization provided by manufacturers can be seen as something of a “free good.” A branded packaged good requires less direct investment compared to store brands, where retailers are more actively involved in managing the brand and the supply chain. Similarly, for supply chain services, greater investments are required by retailers for changes to processes and IT systems.
While customization has grown, the success rates of customized projects are quite low. One reason is that all this customization has created an enormous new source of additional complexity for both manufacturers and retailers, particularly as the varieties of customization continue to multiply. Many manufacturers now receive hundreds (some, even thousands) of requests for customization each year – either directly from customers and customerteams, or arising from programs launched by the sales leadership, supply chain organization or brand marketing teams. Often, once these programs begin, they become an ingrained part of the business.
Customization makes the manufacturer’s task more complex in a variety of ways. Forecasting, for example, becomes increasingly complex, as analysts face the challenge of predicting the lift from a promotional event and the cannibalization of base volume as special displays, unique sizes and packaging are added to the equation. Lead times to manage supply chain partners efficiently grow as well, as the manufacturers struggle to better manage co-packers and graphics, and face a greater challenge capturing procurement efficiencies.
Per
cent
of R
etai
ler R
espo
nden
ts
Increased Somewhat Increased Significantly
Customized Products
Customized Supply Chain Services
Customized Private Label Products & Store Brands
Customized Supply Chain Services
78%
43%
78%80%
0
20
40
60
80
Retailers also noticed that customization is spreading. Their perceptions are most in alignment for services, where a comparable percentage of retailers saw customization programs grow over the past three years.
Exhibit 6: Growth in Customization for Retailers
Customization Growth in Past 3 Years Expected Growth over Next 2-3 Years
100% 100%89%
Per
cent
of R
etai
ler R
espo
nden
ts
0
20
40
60
80
29%
18% 30%
50%60%
14%
Key Findings

8 Creating Value through Customization
Typically, the handling of this complexity is made more on an ad hoc basis, without a fully fact-based analysis. Often, manufacturers have few guidelines and fewer analytical tools to help decide which requests to fulfill, and only rarely do businesses evaluate the full impact of their customization choices within the broader context of their entire program offering. And in part because of all the busy-ness customization brings about, a key question generally goes unanswered: with all this increased complexity, is customization creatingenough shared value for manufacturers and retailers to offset the added costs?
2. Despite their strategic importance, half of customization programs fail to meet the objectives of either the manufacturer or retailer.
Unfortunately, despite the significant investments both manufacturers and retailers are making in customized products and services, roughly half of all customization programs fail to create shared value.
Manufacturers believe that the cost of the failures falls on them. Asked to estimate who wins and loses in customization, manufacturers estimate that product customization programs create value for retailers roughly two-thirds of the time. In contrast, manufacturers believe that the same programs create value for themselves less than half the time, on average.
Manufacturers have the same view of supply chain services. They believe that retailers benefit from customized supply chain program roughly two-thirds of the time. Again, manufacturers believe that retailers benefit more than they do.Manufacturers estimate that they “win” only one-third the time, or roughly half asoften as they believe retailers do.
Exhibit 7: Manufacturer vs. Retailer Perceptions for Product and Services Customization
Lesson #3: Establish
effective gating criteria.
Recently, one CPG manufacturer created a
tiered menu for customized programs, more clearly
specifying what aspects of the offering could be
customized with what lead times and parameters.
As a result, the company has created a
much more efficient set of customization menu options
that add value for the company and
its customers, while focusing customization on
growing and profitable brands and addressing
root causes of underperformance.
MANUFACTURER Perspective on PRODUCT Customization
RETAILER Perspective on PRODUCT Customization
MANUFACTURER Perspective on SERVICES Customization
RETAILER Perspective on SERVICES Customization
% P
rogr
ams
Effe
ctiv
e
at C
reat
ing
Valu
e
0 Retailers Manufacturers
20
40
60
80
100%
% P
rogr
ams
Effe
ctiv
e
at C
reat
ing
Valu
e
0 Retailers Manufacturers
20
40
60
80
100%
% P
rogr
ams
Effe
ctiv
e
at C
reat
ing
Valu
e
20
40
60
80
100%
% P
rogr
ams
Effe
ctiv
e
at C
reat
ing
Valu
e
0 Retailers Manufacturers
20
40
60
80
100%
Note: Bubbles indicate averages; ranges show the 25%-75% quartiles
73%
59%
50%
60%
30%
44%53%
33%
58%
13% 13%0
Retailers Manufacturers
52%
80%
60%67% 60%
50%
40%
68%
52%
40%
60%
13%
38%
Key Insights
} Manufacturers believe they win less than retailers, particularly for products – this win-lose gap is consistent across company size, category and retail format
} Retailers believe they win about the same as manufacturers, and agree that about half of customization programsare lose-lose
} Manufacturers indicate higher program effectiveness for product customization
} However, manufacturers believe there is a greater gap in effectiveness for supply chain services than do retailers
Key Findings

9 Winning through Shelf-Centered Collaboration
Many manufacturers believe retailers have an informational advantage that helps them avoid losing propositions for themselves. They perceivecustomization programs to be similar to their experience with win-win and win- lose trade promotion events. Many manufacturers, having spent years building stronger capabilities to engage the trade in a better dialog about how to create a better mix of win-win promotional events, now believe they face the prospect of pushing the rock back up the hill.
Yet retailers are evidently not profiting as much as manufacturers like to think. As Exhibit 7 shows, retailers believe product customization benefits them half as often as manufacturers estimate. And retailers’ were only slightly more optimistic about the value being created from customized supply chain services: in fact, they thought that manufacturers and retailers both succeeded in service customization only about half the time.
Some might see this as a sign that there is something inherently wrong with product and services customization. They might point to the fire of increased complexity which they perceive to be burning out of control and look solely for ways to put out the blaze, or at least significantly contain it and prevent it from spreading again in the future. Moreover, customization of SKUs runs against the grain for most category management initiatives, which tend to focus more on reducing SKU proliferation and consumer confusion at the shelf. Customized services, in turn, would be more effective if they were more scalable across a broader number of customers.
However, it is worth emphasizing that when customization programs do work, they create significant shared value for both manufacturers and retailers, as our case studies demonstrated. Moreover, good customization programs can serve as an important laboratory where manufacturers and retailers collaborate to find new ways to get consumers to purchase the product (shelf-forward collaboration) and to find better ways to bring products from the plant floor to the shelf (shelf-back collaboration).
Therefore, leading manufacturers cannot risk passing up such an opportunity altogether. Not only would they miss the chance to capture the benefits available, but they would provide a greater opening for competitors to take their place in forging more collaborative relationships with retailers.
3. Success starts with Shelf-Centered Collaboration. Making strategic choices about what to customize and where, rather than just focusing on complexity management.
The fact that retailers feel they fare as poorly as manufacturers suggests asignificant opportunity for greater collaboration exists.
Indeed, in the cases studied for this report, we found a consistent set of breakdowns that erode the performance of customization programs.
Why do so many projects go wrong? Most of the problems stem either from insufficient communication or insufficient commitment – problems that tend to become exacerbated over time as complexity grows.
Lesson #4: Weed out losing
programs.
A manufacturer faced more than 1000
customized display requests across its divisions. To better
manage the complexity of this proliferating
customization, the manufacturer decided to
createa centralized display
team, and put in place hurdle guidelines based
on sales volume and profit margin requirements.
Centralized capabilities enabled the company to
learn from its mistakes and its successes. Today,
there is more visibility into the total costs and
benefits of display programs, and at the same time, display execution is more efficient at
a lower overall cost.
Key Findings

10 Creating Value through Customization
On the retailer side, short lead times for customized program development often leads to rushed design-to-deliver timelines and higher costs on such elements as graphics. Poor forecasting also sets projects on the wrong path. Failure to maintain volume commitments, especially for exclusive merchandise, leads some programs to fall short, as does non-compliance with agreements to set-up on-floor displays and promotions or to keep displays up for a certain time period– a problem often traceable to labor shortages or poor communications.
Exhibit 8: Examples of Retailer and Manufacturer Breakdowns
On the manufacturer side, there are similar problems. Often, there are ineffective selection criteria for customization programs, including a lack of attention to hurdle requirements. A lack of collaboration within the manufacturer itself is another source of expensive mistakes, as many companies have customer teams that don’t interact well enough with marketing, finance andthe supply chain. Inadequate service levels from co-packers and suppliers also compromises many projects, as do product returns and products that are unsaleable because they were damaged en route.
These are symptoms of a bigger issue. The underlying driver of these breakdowns is that customization programs are too often managed at the event level, rather than as a strategic capability that is well integrated into theoverall set of capabilities that are being developed in collaboration with retailers. Indeed, while customization heavily intersects a broad array of capability areas— for example, category management, trade promotions, shopper marketing and supply chain integration — customization programs are typically not elevated to the same strategic level as these other capabilities.
The ad hoc nature of customization management is evident from the way most programs are initiated. As Exhibit 9 shows below, the vast majority of customization requests flow “bottom up” out of a myriad of interactions withcustomers, often through customer teams. Our survey shows that between half and two-thirds of manufacturers’ customization programs originate from either a retailer or a customer team making a request as opposed to a more “top-down” planning process or strategy.
Opportunity for Improved Collaboration
Retailer Breakdowns
} Short lead times for customized program development, resulting in rushed design-to-deliver timeline and higher costs (e.g., graphics)
} Poor forecasting for sales and orders, turn vs. promotions
} Un-kept volume commitments for shipments, especially for unique and retailer-branded merchandise
} In-store non-compliance with display/promotion on-floor set-up and program duration
} Limited in-store labor for shelf re-stocking, especially for high-volume turn and promotional items
Manufacturer Breakdowns
} Ineffective selection criteria for programs (e.g., in-scope formats, hurdle requirements)
} Insufficient collaboration across manufacturer customer teams, sales & marketing and supply chain
} Poor forecasting for sales and orders, turn vs. promotions
} Low service levels from manufacturers, co-packers, other suppliers (e.g., fill-rate, on-time delivery)
} Product returns and unsaleables due to wrong product/volume shipped, damaged items, etc.
Key Findings

11 Winning through Shelf-Centered Collaboration
Exhibit 9: How Customization Programs are Initiated
0 20 40 60 80 100%
Given the tactical, bottom-up nature of how programs are initiated, it is not surprising that all too often collaboration between manufacturer and retailer falls well short of their desired practices, such as having a highly standardized process for making customization requests or driving decision-making aboutcustomization programs through multi-functional teams. Even the highest scorer on an index for such key elements of collaboration earned only seven out of 10 points on our collaboration index.
Exhibit 10: Collaboration Index
Customization programs based on jointly made strategic decisions tend to work much better than those based on ad hoc decisions. Manufacturers who scored higher on our survey on a number of key dimensions for collaboration outperformed those who followed fewer of those best-practices by significant margins.
How Are Your Customization Programs Initiated?
(Manufacturer Perspective)Manufacturer Brand Team
Developments
Annual Planning Process
Category & Channel
Management Strategies
Manufacturer Customer Team
Requests
Often Always
Direct RetailerRequests
Proliferation of Customization Programs
} Growing number of customization requests originating across a broad range of touch-points between manufacturers and retailers…
} …Resulting in heightened complexity to manage the category, e.g.,– SKU rationalization efforts– Managing extended supply chain (e.g.,
graphics, co-packers, contract warehouse)
– Order/replenishment cycles– Picking/assembly– Shelf re-stocking (and rotation
for perishables)
} …And adding complexity to delivery of supply chain services (e.g., lead times, process changes, warehouse andin-store labor)
21%
40%
58%
72%
8%
8%17%
4%
4%
4%
40%
54%
68%
Manufacturer Collaboration Index(Score out of 100% Total Index Points)
Collaboration Index Definition
Composite measure of how well manufacturers collaborate to initiate, evaluate and pursue customization programs with retailers – based on following survey questions:
} How are your customization programs initiated?– Category/channel management
strategies– Annual planning process– Manufacturer customer team requests– Manufacturer brand team
developments– Direct requests from customers
} How formalized is your process for evaluating customization requests?– Ad hoc– Highly standardized
} How do you decide which customization programs to pursue?– Unilateral decision– Multi-functional team
0
20
40
60
80
100%
Higher Collaboratio
n Index Score
(>50%)
Lower Collaboratio
n Index Score
(<50%)
A B C D E F G H I J K L M N O P Q R S T U V W X Y Z
Manufacturer Survey Respondents
Lesson #5: Focus resources on the
most promising strategic opportunities.
One company sought to meet or exceed its national
accounts’ customer service expectations by targeting specific improvements in its unit fill rate and on time
delivery. By creating a single point of contact for each customer, and then making adjustments to fit
theretailers’ projected needs,
through added safety stock levels, use of the retailers’
preferred carriers, and customer-specfic service
level tracking and monitoring, unit fill rates
rose from 85 percent to98 percent, earning the
company the vendor of the year award with two of its largest and fastest
growing national accounts. This good will in turn translated into faster
growth and higher profits.
Key Findings

12 Creating Value through Customization
For example, better collaboration led to a 92 percent success rate for display customization, compared to 55 percent for respondents who ranked in the bottom half. The results were even starker for unique formulation, where75 percent of high-collaborators succeeded in creating shared value from customization programs, compared to only 25 percent for low-collaborators. And in unique size, 73 percent of high collaborators succeeded compared to 45 percent of the low collaborators.
Exhibit 11: High vs. Low Collaborators for Products and Services
The lesson is clear: to create mutually positive, sustainable results, strategies for collaboration need to be shelf-centered. By shelf-centered, we mean programs that encourage both shelf-forward consumer response and greater shelf-back efficiencies. Part of that holistic view is learning to see customization not as an exceptional event, but as a regular activity, and just one tool in a larger tool kit that manufacturers can use to create shared value with their retail partners.
This is far from how most customization programs are executed today. Typically, customization efforts are either shelf-forward, focused on a market opportunity, or shelf-back, in which case the supply chain is the main concern. Only rarely are the two considered in a single context, although almost every serious customization program must have an impact on the other side of whatis ultimately, after all, a single program.
There are a number of reasons this tends to be the case. Manufacturers’ customer teams, the place where many customization requests originate, often lack the depth of supply chain expertise to assess a request’s impact on the supply chain. Often, capability programs – projects within which customization is a supporting strategy or which address key issues that intersect with customization choices – are typically managed by distinct groups within the organization, such as the trade promotion or category management teams.Also, company-to-company dialogs typically still occur along functional lines, with category managers meeting retail merchandisers, or retail supply chain teams meeting manufacturer’s supply chain teams.
Product Customization Programs
Display Unit Unique Formulation
Supply Chain Services Customization Programs
Unique Size
Special PalletsCollaborative Planning Dedicated In-Store Support
% Benefits Both
Both% Benefits 60
High Collaboration Index
Low Collaboration Index
92%
55%
75%
25%
73%
45%
88%75% 80%
62%
33%
13%
60
40
20
0
100%
80
0
20
40
80
100%
Lesson #6: Require
commitments for off-menu
exceptions.
A CPG company won the right to participate in a
special cross- manufacturer display in the health/
wellness section of a major retailer that conducts an
auction where manufacturers bid for
end-cap displays. To help build program commitment
for its unique size and package product, the
manufacturer worked with the retailer’s buyer
to agree on order and shipment volumes and
review display design elements. While the
company met the retailer’s desire for compelling
product differentiation, the retailer shipped only 50
percent of factory orders, leaving the manufacturer stuck with the remaining
unique inventory.
Key Findings

13 Winning through Shelf-Centered Collaboration
Finally, true cross-functional, Shelf-Centered Collaboration is simply hard to do in a large organization, for analytical, political, and staffing reasons. Theanalytical challenges are daunting, in that Shelf-Centered Collaboration requires building a new and more precise fact base. It requires creating more precise metrics, such as ensuring that an SKU is not marked “in-stock” when its really sitting on a pallet in the back room. It requires more careful hurdle rates and it demands more systematic research to assess whether a program is meeting its objective, whether to encourage trials, up-sells, or up-selling or cross-selling.
Politically, cross-functional management involves prescribing the decision rights of various departments. Staffing challenges are not insignificant either, since executives in a truly cross-functional organization need to be available to weigh the facts and make the right decision. Especially at first, reaching a useful level of insight requires a number of people to step back from day-to-day pressures and focus solely on the issue at hand.
Fortunately, although the problems consumer product manufacturers and retailers face might seem daunting, addressing these challenges yields significant benefits. In a cross-industry study of 50 product and service companies, Booz Allen found that the set of companies we identified as “Smart Customizers” outperformed industry peers two-to-one in revenue growth and had profit margins five to 10 percent above competitors.
Value Levers
Cost
Shelf- Back
Shelf- Forward
Revenue
Exhibit 12: Shared Value Through Shelf-Centered Collaboration
Strategic Capability Choices
Cross-Functional Customization Programs
Sources of Value
} SKU Rationalization} Network Optimization} Demand Segmentation} Collaborative Planning} Rapid Replenishment} Packaging Standardization
} Right Assortment} Right Price-Value
Trade-offs} Display Effectiveness} Shelf Shop-ability} In-store Communications} Funding Approach
Make vs. Buy Consumer Driven Supply
Menu Pricing
Category Management
Trade Promotions
Shopper Marketing
Innovation
Shelf- Centered
Collaboration
Capital
Fees(e.g.,
co-pack, graphics)
Inventory
Labor
Freight
Trade-Up
Trial
Stock-Outs
Cross-Sell
Walk Away From Shelf
Key Findings
14 Creating Value through Customization
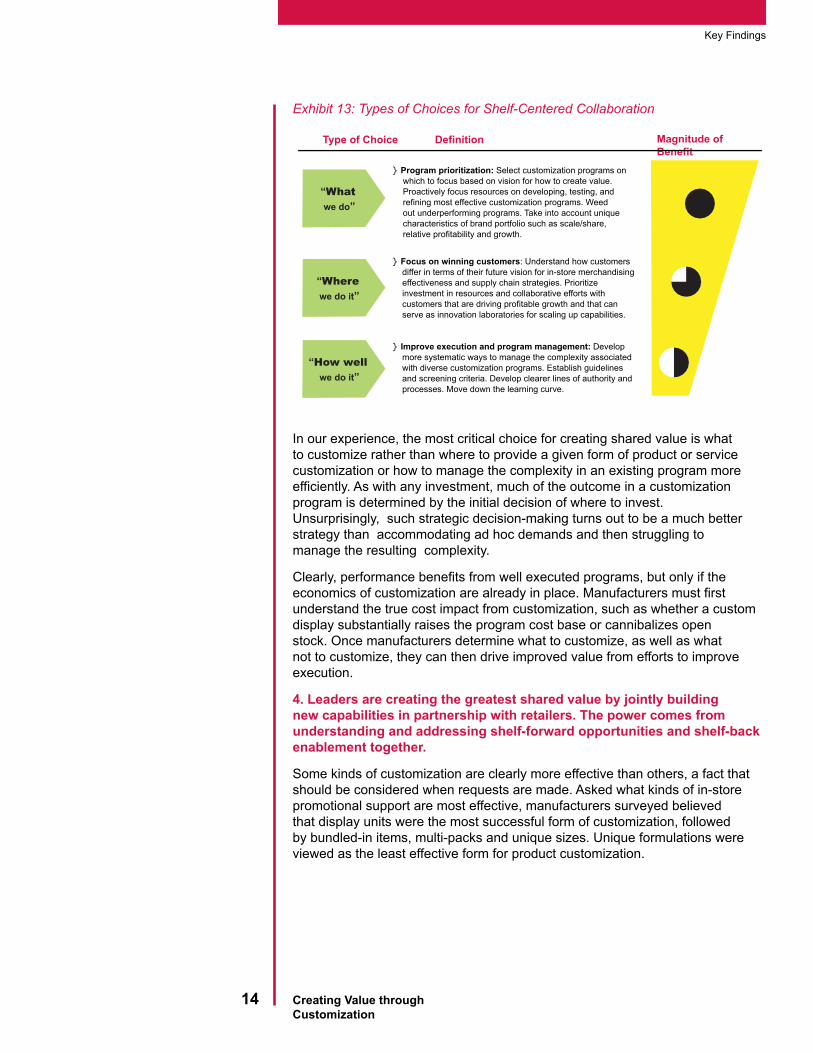
Exhibit 13: Types of Choices for Shelf-Centered Collaboration
Type of Choice Definition
In our experience, the most critical choice for creating shared value is what to customize rather than where to provide a given form of product or service customization or how to manage the complexity in an existing program more efficiently. As with any investment, much of the outcome in a customizationprogram is determined by the initial decision of where to invest. Unsurprisingly, such strategic decision-making turns out to be a much better strategy than accommodating ad hoc demands and then struggling to manage the resulting complexity.
Clearly, performance benefits from well executed programs, but only if the economics of customization are already in place. Manufacturers must first understand the true cost impact from customization, such as whether a custom display substantially raises the program cost base or cannibalizes openstock. Once manufacturers determine what to customize, as well as what not to customize, they can then drive improved value from efforts to improve execution.
4. Leaders are creating the greatest shared value by jointly building new capabilities in partnership with retailers. The power comes fromunderstanding and addressing shelf-forward opportunities and shelf-back enablement together.
Some kinds of customization are clearly more effective than others, a fact that should be considered when requests are made. Asked what kinds of in-store promotional support are most effective, manufacturers surveyed believedthat display units were the most successful form of customization, followed by bundled-in items, multi-packs and unique sizes. Unique formulations were viewed as the least effective form for product customization.
Magnitude of Benefit
} Program prioritization: Select customization programs on which to focus based on vision for how to create value.Proactively focus resources on developing, testing, and refining most effective customization programs. Weed out underperforming programs. Take into account unique characteristics of brand portfolio such as scale/share, relative profitability and growth.
} Focus on winning customers: Understand how customers differ in terms of their future vision for in-store merchandising effectiveness and supply chain strategies. Prioritize investment in resources and collaborative efforts with customers that are driving profitable growth and that can serve as innovation laboratories for scaling up capabilities.
} Improve execution and program management: Develop more systematic ways to manage the complexity associated with diverse customization programs. Establish guidelines and screening criteria. Develop clearer lines of authority and processes. Move down the learning curve.
“Whatwe do”
“Wherewe do it”
“How wellwe do it”
Key Findings

15 Winning through Shelf-Centered Collaboration
Case Example: Winning Through Focused Product Customization
In supply chain services, manufacturers believe that collaborative planning, dedicated in-store support and inventory management are the three best tools while at the other end of the scale, special handling rated last. In addition, retailers agree with manufacturers about what works best – an indication that manufacturers and retailers share similar perceptions about which kinds of customization work and which do not.
Retailer survey respondents reported the same rank orderings1,
DisplayUnit
Bundled-InItems
Multi-Packs
Unique Sizes
Unique Formulations
Exhibit 14: Manufacturer Perceptions for Products Customization
Relative Effectiveness of Product Customization Programs Creating Value1 (Indexed to Most Effective Form)
Overview of Custom Displays
} Opportunity to gain incremental in-store points of presence and weeks of display
} Often linked to new launches, though also used to create more unique events or respond to retailer-specific opportunities (e.g., auctions)
} Multiple objectives include building consumer awareness, incenting trial and cross-promoting brands
} Often leveraging unique packaging (e.g., twin packs, bundled-in items)
} …Using an array of display formats (e.g., end-cap, sidekicks, pallet displays, shelf-ready displays)
} Sometimes linked to retailer category merchandising objectives (e.g., all items are $9.99, “health/wellness” theme)
100
90
84
81
indicating a stable hierarchy across forms of product customizationNote: (1) Middle-tier customization forms shift rank order based on manufacturer segmentation and retailer perceptions of value delivered to manufacturers vs. retailers
78
0 20 40 6080 100
Winning Through Focused Product Customization
At one diversified CPG company, management discovered that each of its product divisions had a different process for selecting product customization programs, with varying degrees of effectiveness. Many approved programs failed to meet retail customer needs and/or deliver satisfactory financial results due to high discount usage and a poor understanding of total cost-to-serve.
Company executives decided to develop a new product customization approach that improved upon past inefficiencies and delivered better overall results. Management selected one of their household products divisions to pilot this new approach, and established a task force across sales, marketing, finance and supply chain to support the initiative.
The team developed a targeted list of key issues to solve, and identified three major improvement opportunities: 1) develop a new corporate governance process that separated product customization from new product development; 2) create category-specific decision guidelines with clear selection parameters that reduce ambiguity and inefficiencies; and 3) streamline corporate design-to-fulfillment processes into common platforms in order to lower costs, improve quality, enable speed to market and drive scale.
A key element of the new approach was the creation of a tiered menu of product customization offerings designed to meet a broad range of customer needs while simultaneously improving the manufacturer’s financial returns. The team identified four tiers of customization vehicles with varying benefit levels to better address retailer needs. Next, they instituted specific requirements for lead times, order volumes, packaging/design elements and discount usage to help keep costs in line with expected program value.
These tiered offerings were limited to only strong performing brands within the category in order to ensure program results. The team eliminated inefficient offerings based on category-specific cost, profitability and sales lift parameters, and offered the product customization menu as a pre-approved option that retailers could select for use of existing trade funds. Lastly, the manufacturer instituted economic-value based metrics for continued pre-screening and post-program performance review.
The result: a clear set of pre-approved customization vehicles that the manufacturer could confidently offer its retail partners, and with improved financial success. Retailers were also empowered to make the right trade-offs regarding how to best use their trade funds against product customization vs. othervalue-add initiatives.
Lesson #7: Sustain dialog
throughout the program.
Poor communication at each link of the value chain
led to costly mistakes for one manufacturer
launching a promotion for five new SKUs with a major
retailer in a customized display. Given the
complexity of the event, the SKUs
needed to be shipped from multiple locations to a
co-packer and then shipped on to the retailer. One day
before the scheduled start of the program, the vendor
discovered a graphics error resulting in seven days’lost
service and a $150,000 expediting charge. Packs
were delivered late, and then poor in- store compliance exacerbated late delivery.
Some displays were on the floor for four to six weeks
instead of the agreed eight weeks while others were
broken down to shelf.
Key Findings

16 Creating Value through Customization
Exhibit 15: Manufacturer Perceptions for Services Customization
Relative Effectiveness of Services Customization Programs Creating Value1 (Indexed to Most Effective Form)
Yet these general areas of agreement mask considerable variability in specifics. In particular situations, some forms of customization that have lower than average effectiveness do quite well. In general, customization programs need to reflect both the needs of the retailer and those of the manufacturer, along with the insights regarding the shoppers of that particular category. For example, for a manufacturer with a greater mix of a low-impulse purchase product, custom displays are much more likely to cannibalize sales in the open stock.
Case Example: Winning Collaboration for Supply Chain of the Future
CollaborativePlanning
Dedicated In-Store Support
Inventory Management
Unique Routes
Pre-MixedPallets
Special Pallet Sizing
Special Handling
Overview of Supply Chain Services
} Taking a more consumer-driven approach to forecasting and replenishment
} Segmenting demand to standardize the routine and focus collaboration on root causes of demand variability(e.g., promotional events, new launches)
} Rationalizing SKUs for improved category management
} Improving business results via better service levels and increased on-shelf availability
} Driving more scaleable solutions across retailer and supplier partners (e.g., co-packers, other vendors)
100
95
85
58
Retailer survey respondents report the same rank orderings1, indicating a stable hierarchy across forms of services customizationNote: (1) Middle-tier customization forms shift rank order based on manufacturer segmentation and retailer perceptions of value delivered to manufacturers vs. retailers
38
35
13
0 20 40 6080 100
Winning Collaboration for Supply Chain of the Future
Executives at one CPG manufacturer were already evaluating whether to make some major changes to their distribution system when executives of a key retail partner asked them if they would consider teaming up to create a next-generation supply chain.
The retailer had experienced substantial process inefficiencies and high costs due to problems of poor forecasting, high inventory count for low-turn SKUs, high out-of-stocks and high damage and loss rates – problems the manufacturer’s executives also needed to solve. The manufacturer jumped on the offer.
Together, senior teams from both the retailer and the manufacturer developed a vision of what they called “the supply chain of the future” – a consumer-driven supply chain that separated the flow of SKUs with stable “turns” from those that were more promotion-driven. By taking this step, they hoped to reduce current inventory levels while simultaneously improving service levels – and at the same time, reduce cycle time from 14 days to less than 24 hours. Moving forward, they hoped to create a scalable template that would help other partners of the retailer and the manufacturer and their suppliers.
These high-level goals were only the beginning. To create some more concrete plans, the two companies each provided dedicated, cross-functional teams to work on the project. Together, the teams mapped an end-to-end supply chain, examining places where there were inefficiencies and noting where improvements could be made. They developed a process that reduced order-to-receive time to 13 hours, as well as automated turns, and separated promotional volume. Finally, they agreed on a scorecard to track key performance metrics, which they later used to quantify their success.
The result: a win for the manufacturer, a win for the retailer – and a win for the shopper. The supply chain program successfully improved sales and order forecast accuracy, lowered inventory levels andreduced warehouse-to-store out-of-stocks. Overall, both the manufacturer and retailer achieved sustained share growth that has continued to outpace the market, and are currently expanding the program to include other customers and suppliers.
Lesson #8: Measure compliance
proactively.
A manufacturer launching a new product approached a retailer to participate in a custom display promotion to secure additional points of presence throughout the
store. Compliance was ensured through an
aggressive sell-in program to individual
store managers and, where available through a
concurrently running pilot program, an RFID tag that could verify if the display
was actuallyin place. The result: 60
percent in-store compliance, nearly double
the baseline rate of 33 percent compliance. Some
stores evenleft the display up several additional weeks beyond the
agreed display period.
Key Findings

17 Winning through Shelf-Centered Collaboration
The next most important factor is making a strategic decision about which customers are the right candidates for customization. This sounds simple, but in many cases, such prioritization efforts must take into account the relative growth and the true profitability of different products and customers. Creating that segmentation requires a clear understanding of the full costs of complexity, and a focus on rooting out some of those costs.
Leadership in customization is not just a question of deciding where not to customize – that is just a good way to avoid failure. As the case example above shows, creating a customization program that has a potentially transformational impact demands proactively picking partners who will be good to collaborate with not only on a given project, but on an entire new generation of shelf- forward and shelf-back capabilities. Executed well, such strategic partnerships then become a new source of innovation in themselves, and their insights can eventually be shared among a wider range of customers.
Ultimately, capturing the full potential for mutual benefit requires first paying attention to the strategic issues. It also requires close attention to execution detail. In fact, a number of lessons can be drawn from the cases of CPG manufacturers’ customization projects that were analyzed for this report:
Exhibit 16: Lessons Learned
Today, too many manufacturers remain focused on “doing incrementally better.” Trying to solve the problem through a shelf-forward or shelf-backward approach, they typically fail to set rigorous metrics, or to understand the true value they have created. Nor have they attempted more than limited coordination of programs across their full portfolio. Instead, they focus almost exclusively on the project management that accommodates complexity rather than the underlying causes and value of that complexity.
WH
AT
HO
WW
HER
E
Lessons Learned Sample Elements Lessons Learned (cont’d) Sample Elements
1 Understand all costs and value from end-to-end
} Breakeven volume} Cannibalizatio
n of base volume
2 Manage trade-offs jointly} One fund} Clear menu
options} Aligned incentives
} “Hidden” costs
3 Establish effective gating criteria
} Selection guidelines
} Hurdle requirements
} Scorecard metrics
4 Weed out losing programs} Post-event analysis
Focus resources on the5 most promising
strategic opportunities
} Tiering} Menu pricing} Exclusivity
guidelines
6 Require commitments for off-menu exceptions
} Negotiated commitments
} Joint teams} Scorecard metrics
7 Sustain dialog throughout the program
} Joint program teams
} Scorecard metrics 8 Measure compliance proactively
10 Learn from your mistakes
} Audits} Investment
s in technology(e.g., RFID)
9 Make-to-order for customized products
} Demand segmenting (e.g., turn vs. promo)
} I/T investments
} Design to value} Root cause
analysis
Lesson #9:
Make-to-order for customized
products.
One CPG company won an end-cap display with a major
retailer. One of the ground rules for participation was
that the manufacturer had to create a larger package size with higher unit margins for the retailer. As a result, the
manufacturer counted on higher volume. Problems
arose when the retailer placed a request for the promotional
order, then ended up shipping only
50 percent of its initial order, leaving the manufacturer
stuck with unique, branded inventory as unsaleables
that required further markdowns.
Key Findings

18 Creating Value through Customization
Meanwhile, some manufacturers are proactively engaging retailers in jointly developing improved merchandising and supply chain strategies. As complex as their strategies are, however, these companies do share three common best practices:
Exhibit 17: Emerging Best Practices
Approach Examples
Conclusion
John Wannamaker, the department store pioneer, quipped more than a centuryago that he knew half the money he spent on advertising was wasted – he just did not know which half. The same might be said of customization. The difference, however, is that we do know which half is wasted – it is the half inwhich the manufacturer did not collaborate closely with the retailer, and did not really think through either what needed to be customized or how to do it.
There are a lot of reasons why many programs deliver poor results, most of which stem from the fact that the challenge of customization is a new one for manufacturers and retailers alike. Yet, as this report shows, it is not necessary for the CPG industry to continue this way. There is a viable, tested alternative.
Clearly, the current customization boom will end in two ways – success and failure. Companies that continue on their present path of customizing without any effort to create a more systematic, analytical approach will generally succeed and fail in equal measures – a track record that will crowd out other opportunities in which to invest in the as complexity increases and eats up whatever gains are made. For those companies that learn how to collaborate and plan their customization strategies, however, successes will become much more common than failures. And over time, such Shelf-Centered Collaboration is bound to become not just a generator of new revenue now but a profound new source of innovation to create shared value across with retail partners.
} Establish consistent governance process for customization programs} Build simple rules for what forms of customization are on menu} Limit some forms of customization based on investment criteria} “Weed the garden” of win-lose customization programs through
upfront analysis and ongoing pre/post event analysis
Tiered Approach to On/Off
Menu Customization
} Focus on fewer forms of customization (e.g., displays, unique sizes, unique formulation)
} Leverage company-wide governance and development of metrics around this narrower set of customization priorities
} Build centrally managed capabilities to achieve greater scale and maximize learning curve benefits
Focused Customization
Strategy
} Build centrally managed “R&D” capability to manage select retailer partnerships for use as test beds to then scale-up across brands, categories, divisions
} Goal to scale up successful customization programs more broadly, but have multiple models continue to co-exist
Customization Centers of Excellence
Lesson #10: Learn from your
mistakes.
One manufacturer found, upon closer
examination, that one of its customization
programswould require more than
double the average sales lift it usually achieved from
customized displays, when taking into account all
incremental costs, price discounts, and
cannibalization of open stock. However, the shipper was viewed as important to meeting brand goals. Rather
than discontinuing the program however, the
company identified opportunities to take
60 percent of the costs out of the original design.
The new and improved shipper exceeded its
break-even sales lift hurdle, which is now below the
average of othercustomized displays.
Key Findings

19 Winning through Shelf-Centered Collaboration
Selected Booz Allen Hamilton publications on Smart Customization:
– “Custom Fit: One Size Does Not Fit All” Advertising Age, Fall 2005;
– “Virtual Scale” Strategy & Business, Fall 2005;
– “The Five Principles of Smart Customization” Booz Allen Viewpoint, Spring 2005;
– “The Challenge of Customization: Bringing Operations and Marketing Together”joint Strategy & Business and Knowledge@Wharton white paper, Summer 2004;
– “Smart Customization” Strategy & Business, Fall 2003
– GMA Brands - www.gmabrands.com
Selected References
Selected References
