winning percentage and attendance in the nhl
TRANSCRIPT
St. John Fisher College St. John Fisher College
Fisher Digital Publications Fisher Digital Publications
Sport Management Undergraduate Sport Management Department
Fall 2011
Winning Percentage and Attendance in the NHL Winning Percentage and Attendance in the NHL
Daniel Peters St. John Fisher College
Follow this and additional works at: https://fisherpub.sjfc.edu/sport_undergrad
Part of the Sports Management Commons
How has open access to Fisher Digital Publications benefited you?
Recommended Citation Recommended Citation Peters, Daniel, "Winning Percentage and Attendance in the NHL" (2011). Sport Management Undergraduate. Paper 23.
Please note that the Recommended Citation provides general citation information and may not be appropriate for your discipline. To receive help in creating a citation based on your discipline, please visit http://libguides.sjfc.edu/citations.
This document is posted at https://fisherpub.sjfc.edu/sport_undergrad/23 and is brought to you for free and open access by Fisher Digital Publications at St. John Fisher College. For more information, please contact [email protected].

Winning Percentage and Attendance in the NHL Winning Percentage and Attendance in the NHL
Abstract Abstract This research extends the analysis of winning on attendance, looking specifically at its prevalence in the National Hockey League. Data was collected from 2005-2006 through the 2010-2011 season for the each of the league’s 30 teams. Each club’s winning percentage at the midway point of each year was noted, and attendance at each of the remaining home games was analyzed. Statistical analysis revealed that the only season in which there was a significant relationship between midpoint winning percentage and second half attendance was 2010-2011. This study also explored patterns of attendance across the league over this six-year span.
Document Type Document Type Undergraduate Project
Professor's Name Professor's Name Emily Dane-Staples
Subject Categories Subject Categories Sports Management
This undergraduate project is available at Fisher Digital Publications: https://fisherpub.sjfc.edu/sport_undergrad/23

Running Head: WINNING PERCENTAGE AND NHL ATTENDANCE 1
Winning Percentage and Attendance in the NHL
Daniel Peters
St. John Fisher College

WINNING PERCENTAGE AND NHL ATTENDANCE 2
Abstract
This research extends the analysis of winning on attendance, looking specifically at its
prevalence in the National Hockey League. Data was collected from 2005-2006 through the
2010-2011 season for the each of the league’s 30 teams. Each club’s winning percentage at the
midway point of each year was noted, and attendance at each of the remaining home games was
analyzed. Statistical analysis revealed that the only season in which there was a significant
relationship between midpoint winning percentage and second half attendance was 2010-2011.
This study also explored patterns of attendance across the league over this six-year span.

WINNING PERCENTAGE AND NHL ATTENDANCE 3
Winning Percentage and Attendance in the NHL
The devoted sports fan is an influential part of modern society throughout the world.
Individuals can consume virtually any sport, as well as follow their favorite teams through
various print and electronic mediums if they choose not to attend games. According to the 1993
U.S. Census Bureau, both sporting event attendance and media coverage enjoyed steady
increases over the previous ten years (as cited in Laverie & Arnett, 2000). Upon reviewing
existing literature on the topic, however, most studies on success and attendance have been
conducted with respect to a few world renowned sports: baseball, soccer, and American football.
Upon observing previous works by various authors in terms of attendance practices,
there exists only a small amount of consideration that has been paid to professional hockey
(specifically the National Hockey League), one of North America’s premier sports. Anecdotal
observations from those working in hockey claim that team success is a major factor on whether
or not fans come out to game. According to Warren Kosel, Manager of Communications for the
American Hockey League’s Rochester Americans, the biggest reason that fans cite for not
attending the club’s games is due to lack of success on the ice (W. Kosel, personal
communication, February 11,2011). The National Hockey League’s Florida Panthers also
experience fan attendance deficiencies, which has been referenced to be mostly due to lack of
success as well (the team has missed the playoffs for 10 straight seasons). As the organization’s
Event Marketing Manager Jill Waldman explained, “Our biggest problem in attracting people to
attend games is not due to technology; however, it comes down to team performance. If the
team is winning people will come. When the team is losing it is increasingly difficult to get
people to come out” (J. Waldman, personal communication, November 16, 2010).
WINNING PERCENTAGE AND NHL ATTENDANCE 4
After hearing each of these testimonials, it appears as if winning percentage can have a
substantial weight on fans’ aspirations to make the trip out to the stadium/arena for the game.
Raymond Williams, a socialist and novelist in the mid 1900s, (1961) pointed out that if customer
wants are not met and they are not satisfied, they will probably take their money and invest it in
alternative options, and possibly decide to tune into the television/radio, or simply not at all (as
cited in Giulianotti, 2002). The purpose of this study is to extend previous research and look in
terms of how attendance can impact a specific team over the course of a season.
Literature Review
Trail, Anderson, and Lee (2006) (cited in Kwon, Trail, & Lee, 2008) said that scholars
have been interested in factors such as team identification, sport fan motivations, enjoyment, and
others that influence fan behaviors in spite of team success/failure. Such behaviors seem to be
principal determinants of peoples’ attitudes toward their respective club, including their
willingness to make their association publically-known. Other factors include whether or not
they will continue to support the team and attend games (a trait known as conative loyalty),
which has significant relevance to sport organizations by showing the relative importance of
success on the playing surface ranks in the minds of fans. In turn, this has been shown to be a
rather effective predictor of attendance, as well as consumption of team-related merchandise and
media (Trail et al., 2006 as cited in Kwon et al., 2008).
Fan responses to team performance
In a study which analyzed the relationship between team success and MLB attendance,
Davis (2007) found that winning was significantly important to the fans. For teams above.500,
each win was shown to add between 138 and 350 fans (Davis 2007). Further, Lemke, Leonard,
and Tlhokwane (2007) used data collected from box score information reported by the MLB and

WINNING PERCENTAGE AND NHL ATTENDANCE 5
determined that attendance behavior only changes in September (the final stretch of the season)
based on playoff chances and contention, while no difference was found in April through
August. Upon the arrival of September, results showed that attendance is expected to increase
by 4,353 when the home team is leading its division and by 2,512 when leading its wild card race
(Lemke, Leonard, & Tlhokwane, 2007). In terms of the home team’s probability of winning
each game specifically, attendance was shown to be positively correlated with the chances of
winning (Lemke et al., 2007). Based on such relationships, sport psychologists have extensively
looked at the degree to which an individual feels a psychological connection to a particular team
or athlete can be used to predict the way in which they react to their team’s performance (Wann
& Branscombe, 1990). Campbell, Aiken, and Kent (2004) present that external fan behavior can
be linked to internal tactics of managing one’s image to both themselves and others.
Basking In Reflected Glory, also known as BIRGing, is an identity-management
phenomenon presenting that sport fans often highlight their connection with their respective team
following a victory (Assollant, Lacassagne, & Braddock II, 2007). Throughout analysis of
significant literature on BIRGing, a classic study conducted by Cialdini et al., (1976) was
referenced as the basic foundation of the theory itself (as cited in Assollant et al., 2007). The
investigation itself found that after victory by a university football team, students were more
likely to wear affiliate attire and use the term “we” to reference themselves as part of the
victorious group following a win as opposed to a loss (Cialdini et al., 2007 as cited in Assollant
et al., 2007). Wann & Branscombe (1990) explored this topic more extensively, finding that fans
with high levels of team identification were more likely to BIRG after a victory than fans with
low levels. Additionally, the duo established that such individuals with high levels of
identification would maintain their association even after a poor performance. Wann, Hamlet,

WINNING PERCENTAGE AND NHL ATTENDANCE 6
Wilson, & Hodges (1995) described BIRGing as an “ego enhancement function” and sought to
further test the validity of BIRGing behaviors. The group did so in a political atmosphere,
examining whether or not those aligned with a successful party were more likely to wear badges
identifying group membership rather than those of the less successful party (Wann et al., 1995).
Results demonstrated that persons belonging to the successful group were less likely to
publically make their affiliation known, and it was also confirmed that those individuals who
maintained their association with the unsuccessful group were higher in group identification
(Wann et al., 1995). In turn, this supports the theory evaluated by this study of fans increasing
their support, affiliation, and attendance with a winning team.
Weiler and Higgs (1997) extended the application of this theory by examining the
background profile of the committed sports fan to the All American Girls Professional Baseball
League (AAGPBL), which existed in the 1940’s. After taking many previous theories into
perspective, the authors found that BIRGing was the most significant factor in determining fan
commitment with particular teams (Weiler & Higgs, 1997). Based on a questionnaire distributed
to fans of the AAGPBL, the conclusion was drawn that people sought to enhance their own
image by associating themselves with winners (Weiler & Higgs, 1997). This tendency was also
connected to individuals seeking achievement, stating that some identification with a certain
team was in effort to be able to share in its outcomes, including taking credit for victories
(Weiler & Higgs, 1997). A study by Murrell and Dietz (1992) revealed another element of
BIRGing, related to college athletics. The authors discovered that when fans believe that their
respective college/university is perceived by others as high in status, they formulate behaviors
and attitudes that strengthen their association with its sports teams (Murrell & Dietz, 1992). This

WINNING PERCENTAGE AND NHL ATTENDANCE 7
discovery may also have implications for professional sports, because it could lead to the same
behaviors if fans of a certain team recognize that their team is perceived as high in status.
Contrary to their test on fan reactions to success, Weiler and Higgs (1997) decided to
look at how individuals would respond to failure of associated groups. Through their study, the
two authors discovered a tendency for fans to avoid blame if failure (losing) occurred within
their team, an extension to the aforementioned BIRGing . The explanation which was found in
previous literature to this conduct has been termed Cutting Off Reflected Failure, or CORFing
(Koenigstorfer, Groeppel-Klein, & Schmitt, 2010). CORFing behaviors lead individuals to
decrease their association with an unsuccessful group (Wann et al., 1995). According to
Koenigstorfer et al. (2010), this tactic serves to prevent one’s self esteem or image from harm.
Rather than experience the consequences of a weakened position in the social environment, fans
will distance themselves through this process (Campbell et al., 2004). Consequently, Wann,
Tucker, and Schrader (1996) established that a lack of team success is the most important reason
for individuals ceasing to follow a once-favorite team.
The work of Kwon et al. (2008) revealed a previously unproven relationship between
CORFing and people who have a high need for achievement which they choose to fulfill through
external experiences. The results noted that individuals characterized by such factors will detach
themselves from groups seen as unsuccessful in attempt to protect their self-esteem (Kwon et al.,
2008). Vicarious achievement is another branch which has been tied into CORFing (Kwon,
Trail, Lee, & Anderson, 2007). Kwon et al. (2007) stated that vicarious achievement refers to
the need for achievement which an individual may choose to fulfill through association with a
successful other. If this “other” becomes unsuccessful, however, this need for vicarious
achievement is no longer met. As a result, some individuals may be forced to cut off the existing
WINNING PERCENTAGE AND NHL ATTENDANCE 8
reflected failure (CORF) when their identity as a fan of the team does not allow them to build or
maintain self-esteem (Kwon et al., 2007). Conversely to BIRGing tendencies, a higher level of
identification as a fan of the particular team decreases one’s likelihood to CORF (Wann &
Branscombe, 1990). A specific example of CORFing behavior is provided by Campbell et
al.(2004), who cited many franchises such as the NBA’s Golden State Warriors, the NFL’s
Detroit Lions, and the NHL’s Toronto Maple Leafs, all of which have maintained a large, loyal
fan base despite poor winning percentages over extended periods.
In opposition to these widely studied and prevalent responses to winning and losing,
Campbell et al. (2004) presented two newly discovered concepts, CORSing and BIRFing.
Cutting Off Reflected Success (CORSing) is a behavior in which fans cut off ties with successful
teams (Campbell et al., 2004). Cited reasons for such actions have included fans becoming
resentful towards seemingly greedy owners/managers/players, team conduct issues, as well as
teams that simply buy the best players (Campbell et. al, 2004). Further, Campbell et al. (2004)
stated that others may rebel toward an earlier era, previous style of play, of a previous
coach/management team because of a high preference for consistency. In connection with self-
image, certain people may need individuality, and to stand apart from the crowd which can come
from associating with a winning team (Campbell et al., 2004). When a team begins to display
success and attracts new fans, the uniqueness of following that club is replaced by the feeling of
just being “part of the crowd” (Campbell et al., 2004). This may also cause individuals to resent
bandwagon jumpers, fans who haven’t been loyal and join the crowd as the team becomes
successful (Campbell et al., 2004). To others who cut off ties with a successful team, the
exhilaration of associating with the underdog may cause them to move on to following a less
successful club (Campbell et al., 2004).
WINNING PERCENTAGE AND NHL ATTENDANCE 9
According to Campbell et al. (2004), Basking In Reflected Failure (BIRFing) occurs
when fans remain loyal to a team in the face of failure. It is presented that sticking with their
team may be seen a means of expressing uniqueness (as talked about earlier in CORSing as well)
because this type of behavior would be seen as less common (Campbell et al., 2004). Perhaps
the most interesting fact pointed out by Wann et al. (2006) was that BIRFing can be considered a
distinct method of self-image management. Because society views loyalty as a positive trait,
people treat it as a “badge of honor” worn to display their loyalties in the face of hardship (Wann
et al., 2006). Some individuals may also believe that their loyalties through the tough times will
pay off someday and they will be rewarded, which would also result in strengthening social ties
amongst the true diehard fans (Campbell et al., 2004).
Self and Group Identity
Researchers within the fields of psychology and sociology have explored the identity and
affiliation aspect of sports fans, relating fandom to one’s social/psychological manner. It has
been presented that sport team identification facilitates social psychological well being by
increasing social connection with others.
Social identity theory focuses on the connection between one’s sense of self and society
(Dhurup, Dubihlela, & Surujlal, 2010), and also explains that people strive to maintain/enhance
personal and group identity through multiple outlets (Murrell & Dietz, 1992). This need for
association causes people to form emotional attachments to physical possessions, places, people,
and groups (Dhurup et al., 2010). Wann, Keenan, & Page (2006) stated that when someone
shows a high level of identification with a specific group, it comes as a result of positive
emotions, high feelings of self-esteem, and high levels of satisfaction which the particular group
provides. In addition, this can lead to a strong sense of attachment to a group as a result of
WINNING PERCENTAGE AND NHL ATTENDANCE 10
enhanced feelings of belongingness and connection, and are often times facilitated by identifying
with sports teams (Wann et al., 2006). Through a study conducted in Pittsburgh, Pennsylvania,
Kraszewski (2003) discovered that “football bars” have emerged in cities such as Pittsburgh,
Green Bay and Buffalo (and virtually all NFL team cities), where fans gather on game-days to
watch their respective clubs play on satellite television feeds. This can be seen as a way for
individuals to experience feelings of collective unity with those other fans whom support the
same team. It was also found that such alliances and groups can also apply to distance fans
(those away from the geographical center of their team). This includes people who have moved
from their area of origin who will meet up with others from their former region. Such factions
have provided individuals with the opportunity to watch their team play and while also
reconnecting with their "home". According to Kraszewski, he himself joined a club of Steelers
fans from Western Pennsylvania while living in Forth Worth, Texas. He specifically indicates
that when he joined the club, it had been in existence for four years and grown in membership
from a few people to well over 20 (Kraszewski, 2003).
Previous research has also demonstrated that sport teams serve as a distinct source of
group identity and are becoming more popular as a source for a “community” and extended
social network that people can become a part of (Heere & James, 2007). These external groups
can be formed on the basis of many factors, including gender, ethnicity, geography, sexuality,
and social class (Heere & James, 2007). For example, sport organizations such as Historically
Black Colleges and Universities (African-American) and the Boston Celtics (Irish American)
appeal to fans who share a common ethnicity. Further, Heere & James (2007) found that
members of a group seek to feel a degree of exclusivity with their association to the team.
Therefore, they present that if a citizen of New York perceives the Yankees as having more of a
WINNING PERCENTAGE AND NHL ATTENDANCE 11
national identity (not representing the local community), identification with the Mets might be
greater because of the club’s affiliation with New York City itself (Heere & James, 2007).
Fans that form an identity to a team may experience strong feelings associated with their
team and may feel the sense of attachment previously described (Laverie & Arnott, 2000). As a
result, this increases the relative importance of their identity as a fan to their sense of self, which
in turn was found to be highly correlated to attendance in Laverie and Arnett’s study. These
types of individuals, whom form a bond with their respective team and become “true fans”, are
not dissuaded from attending games based on the outcome and thus are prepared to attend every
event (Hall, O’Mahony, & Vieceli, 2009). Hall et al. (2009) also follows up by stating that these
fans demonstrate the highest degree of loyalty towards their clubs and display intense emotional
responses to the team and its players.
On the other hand, there are those who may follow a specific team in a more casual
sense. In a study which examined fans of Africa's Nippon Professional Baseball League, it was
discovered that attendance increased at games between better teams and also for those which the
home team was more likely to win (Leeds & Sakata, 2011). Hall et al. (2009) claimed that
“casual fans” attendance behaviors are influenced by advertisements/promotions, as well as
alternative events to the game. Fans as such look for entertainment and satisfaction when
making a trip to the stadium or arena, and a report by Wann et al. (2008) showed that
entertainment was the strongest motivational factor for fans of the thirteen major target sports
which were examined. Additionally, many fans who felt satisfied upon attending felt so because
the home team came out victorious in the contest (Wann et al., 2008). Zhang, Pease, Lam,
Bellerive, Pham, Williamson, and Wall (2001) also analyzed fan attendance at minor league
hockey games, finding that achievement seeking was a major determinant of the decision to
WINNING PERCENTAGE AND NHL ATTENDANCE 12
attend. Such individuals are people that wish to express prestige and accomplishment through
identifying with sport game winners, which in turn leads to an increased likelihood of attending
if their team is expected to win (Zhang et al., 2001). All of these previous findings exhibit that
the success of a particular team can indeed impact whether or not fans attend, because if fans
perceive a high probability of victory, their intentions to come to the game are much higher.
NHL fan behavior and recent trends
Paul (2003) conducted a study related to variations in NHL game-to-game attendance,
looking at the impact of scoring, violence, and regional rivalries, as well as team success. In the
years preceding this research, there were many policies implemented by the league in attempt to
increase scoring, reduce violence, and put more games in the schedule against regional rivals. In
hopes to raise offensive output, the National Hockey League has instructed referees to enforce
tighter rules in terms of players obstructing one another, while also reducing the size of goalie
equipment, and increasing the size of the attacking zone/space behind the net. In terms of
violence, an instigator rule has been put in which results in a penalty/ejection to any player
whom blatantly starts a fight. In addition, officials have cracked down on hits to the head and
suspensions for harmful conduct. Divisions have also been realigned over the years with respect
to regions, and the schedule has increased the number of games between closely-proximate foes
(Paul, 2003).
Evidence from this analysis of NHL attendance found that increased scoring actually
decreased attendance when compared to the previous season’s goal total and current season’s
goal per game average (Paul, 2003). Further, violence was found to be highly significant and
positively related to attendance, which was tested using fighting as the representative variable
(Paul, 2003). Paul (2003) also revealed that divisional rivals in the United States attracted larger

WINNING PERCENTAGE AND NHL ATTENDANCE 13
crowds, whereas fellow Canadian opponents did so for Canadian franchises. In terms of team
success, it was discovered that making the playoffs but not advancing has a negative relationship
to attendance the following year, however winning at least one round negates this connection
(Paul, 2003). Upon reviewing previous studies to theirs, Leadley and Zigmont (2006) also
argued that team performance was found to be a significant determinant of attendance in nearly
all of the existing literature which they examined.
Annual National Hockey League marketing statistics were summarized by Miller and
Washington following the 2007, 2008, and 2010 seasons. The documents highlighted various
points of data including franchise valuations, annual revenues, fan loyalty, and attendance,
amongst other things. According to Miller and Washington (2011), average league wide
attendance has increased across the league since the lockout (2004-2005) from 16,954 to 17,070
(2009-2010). The Montreal Canadiens have finished in the top two in terms of attendance over
the three years, averaging 21,273 per game, while the Detroit Red Wings and Philadelphia Flyers
have been amongst the league leaders as well (19,494 and 19,458, respectively). The Red Wings
have also led the NHL in fan loyalty from 2008-2010, with the Flyers, New Jersey Devils, and
Boston Bruins have all been within the top five (Miller and Washington, 2008, 2009, 2011).
The purpose of this study is to extend previous research and look in terms of how
attendance can impact a specific team over the course of a season. This will be conducted using
all 30 National Hockey League teams upon the conclusion of each examined season, looking at
each particular club’s winning percentage at the midway point and the impact of such factors on
second-half attendance. Various long-developed theories of psychology and sociology are
integrated to help interpret the study’s results, in addition to the exploration of various factors
WINNING PERCENTAGE AND NHL ATTENDANCE 14
that have been found to impact attendance frequency. The following are the research questions
that are addressed in this project:
1. What are the trends of attendance for each particular team and the league as a whole over
the span of examined years, as well as within each individual season?
2. Does attendance increase over the second half of the season for a team whose record is
over .500 at the midway point?
3. Does attendance decrease over the second half of the season for a team whose record is
under .500 at the midway point?
Method
Sample Section
The subjects of this particular study were all 30 NHL teams in each of the six examined
seasons (n=30), with the research itself being exploratory in nature. Using content analysis, the
investigation first looked at each team’s winning percentage through the first 41 games of the
following seasons: 2005-2006, 2006-2007, 2007-2008, 2008-2009, 2009-2010, and 2010-2011,
while also noting first and second half attendance as well as final winning percentage.
Data Collection and Measurement
To access the necessary information, the NHL’s official game sheet/box score (via
NHL.com/team websites) for each game was consulted. Consequently, the result of each contest
(win/loss/overtime loss/shootout loss) was noted, as well as the attendance at each home game.
After gathering the required game statistics for the first half, each individual attendance figure
was averaged to come up with each particular team’s average through the first 41 games. Upon
completion, these steps described above were repeated for the second half of each examined
teams’ season. Furthermore, instead of analyzing each individual game over the last 41 games,
WINNING PERCENTAGE AND NHL ATTENDANCE 15
official league standings at the end each season were utilized to determine final winning
percentage. Subsequent attendance figures provided the ability to calculate average attendance
for the second half and compare this to their first half average. In terms of operations of
measurement, winning percentage will be calculated at two points, all games after each team’s
41st contest and also upon the conclusion of each season. Winning percentage is calculated as a
team’s number of wins divided by the total number of games played.
Along the way, it was discovered that determining the capacity of each NHL team’s
arena would also be useful in looking at the results from a different perspective. Through this,
the ability arose to identify the capacity percentage of each club in addition to simply the raw
attendance numbers.
Data Examination
This research looks at six NHL seasons, ranging from 2005-2006 to 2010-2011. After
the entire 2004-2005 season was cancelled due to a lockout of the players and owners, many
changes were implemented into the rulebook across the league. Perhaps the most drastic
adjustment was the insertion of a league-wide salary cap for the first time in its history.
Additionally, the league tightened the rules with respect to obstruction, increased the number of
games with divisional rivals, eliminated the two-line pass rule, and increased the size of the
offensive zone (Paul, 2003). All of the on-ice adjustments were geared towards increasing
scoring and creating more excitement, thus attracting more fans (Paul, 2003. These
implementations changed the face of the game both on and off the ice, and as a result serve as a
sufficient benchmark year to begin assessment. By examining data over six separate years, this
ensures an adequate sample size to be sure that the results are accurate and not just a coincidence
(Gratton & Jones, 2010).
WINNING PERCENTAGE AND NHL ATTENDANCE 16
By analyzing the relationship between first half success and subsequent attendance, this
study follows an experimental design (Gratton & Jones, 2010). The two specific questions
presented include whether or not an unsuccessful first half has an impact on subsequent
attendance for teams in last place, and whether or not having a successful first half influences
subsequent attendance for the first place team. The dependant variable in this case is represented
by attendance, while winning percentage/position in the standings is the independent variable.
Trends of attendance for each individual team since the lockout will also be disclosed over the
six-year span, as well as within each specific season.
Data was compiled into an excel spreadsheet (one for each individual season) upon being
gathered. The categories created included: season examined (year), team, first half winning
percentage, first half average attendance, second half attendance, final winning percentage.
These figures were in turn inserted into IBM SPSS Statistics 19 for analytic analysis. The two
statistical analysis tools utilized in this study were regression and descriptive statistics.
Correlation is used to determine how much of a relationship exists between two varaibles and the
impact of a predictor variable on a dependent variable (Gratton & Jones, 2010). In this case,
winning percentage will serve as the predictor variable, with attendance (over the second half)
representing the outcome variable.
Results
Statistics and Data Analysis
NHL overall from 2005-2006 season through 2010-2011 season
Attendance
As demonstrated in Table 1 the league average attendance capacity from 2005-2011 was
92%. There have been a handful of teams who have averaged perfect attendance figures (100%)
WINNING PERCENTAGE AND NHL ATTENDANCE 17
over this span, and this unique group includes the following: Calgary Flames, Edmonton Oilers,
Minnesota Wild, Montreal Canadiens, New York Rangers, Philadelphia Flyers, Toronto Maple
Leafs, and Vancouver Canucks. On the other hand, those with the worst attendance capacity
numbers since the lockout are the New Jersey Devils and New York Islanders, both of whom
average 79%.
Descriptive statistics of the league’s attendance from 2005-2011 showed that the range
between the highest and lowest raw attendance numbers across the league actually fell over the
second half with respect to the range in the first half in all examined seasons but one (2005-
2006), with that range being 1,068. It should be pointed out, however, that this range from 2005-
2006 through 2008-2009 was just 365 people but jumped to 2,123 over the final two seasons. In
addition, the highest attendance average for the entire league came in the 2008-2009 second half
(17,678), while the lowest was in the first half of 2009-2010 (16,748). Over this span, the
highest average belonged to the Chicago Blackhawks in the second half of 2008-2009 (21,953)
and the lowest to the New York Islanders during the first half of the 2010-2011 season (9,962).
The average percentage change in attendance from the midway point to the end of the
season for all teams from 2005-2011 was + 3.60%. Further, an impressive statistic worth noting
is that the NHL’s league-wide average capacity percentage has experienced a positive change
over the second half in comparison to the first.
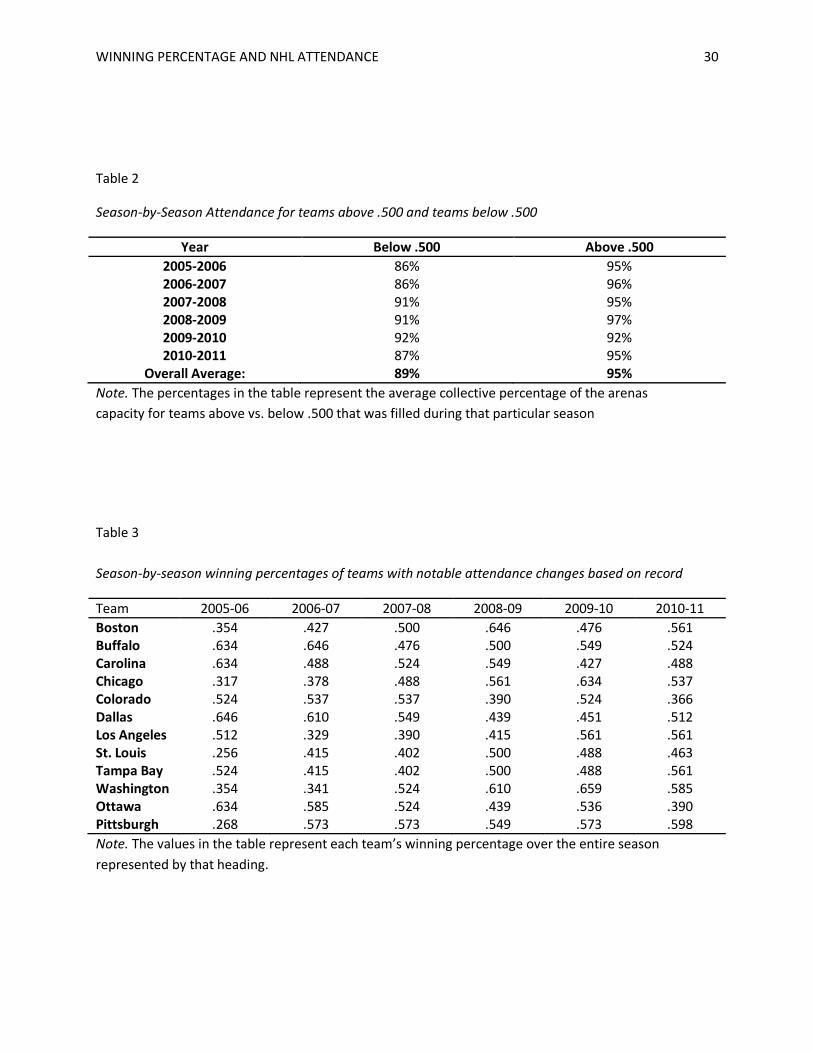
Table 2 displays the average capacity percentage for teams above and below the .500
mark over each season from 2005-2006 through 2010-2011. As it portrays, those teams with a
record above .500 overall for the entire season had a mean capacity of 95%, while those below
.500’s was fairly lower at 89%.

WINNING PERCENTAGE AND NHL ATTENDANCE 18
The following teams experienced changes in attendance patterns over the years examined
since the lockout that appeared to be change in relation to success: Boston Bruins, Buffalo
Sabres, Carolina Hurricanes, Chicago Blackhawks, Colorado Avalanche, Dallas Stars, Los
Angeles Kings, St. Louis Blues, Tampa Bay Lightning, Pittsburgh Penguins, Washington
Capitals, and Ottawa Senators. These patterns were then compared to changes in the each
club’s record with respect to .500. The attendance figures of each of the teams being looked at
with respect to their record are shown in Table 1, while the winning percentages of each of those
teams over that span are portrayed in Table 3.
As Tables 3-8 portray, twelve teams over the course of the examined period had at least
100% attendance capacity for at least one year. Conversely, ten teams recorded average
attendances of less than 85% of capacity at least once over the six seasons.
Attendance Change for Teams based on Winning Percentage relative to .500
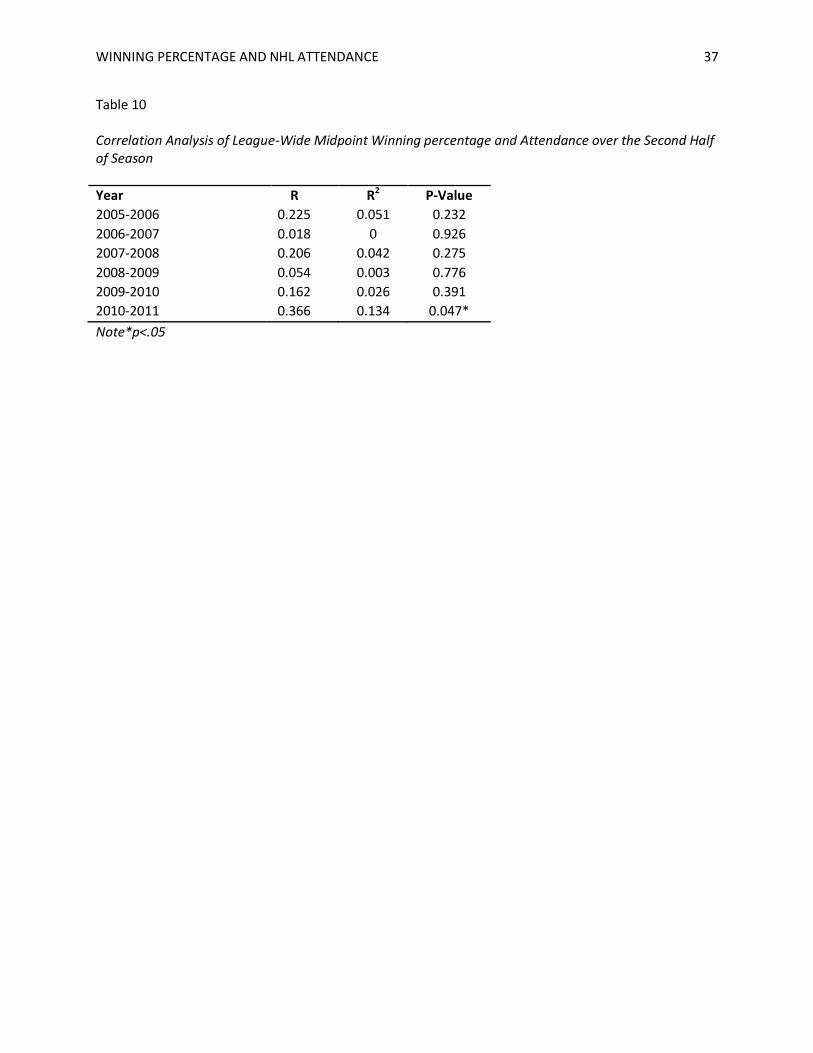
A linear regression test was conducted to examine the relationship between winning
percentage at the midway point and subsequent second half attendance (see Table 9). It was
discovered that no significant relationship existed in the first five seasons analyzed; however
there was indeed one for the 2010-2011 season. The relationship was indeed significant in this
particular year (r=0.366, p<0.05).
Discussion
The purpose of this study is to extend previous research and look in terms of how
attendance can impact a specific team over the course of a season. This was conducted using all
30 National Hockey League teams upon the conclusion of each examined season, looking at each
particular club’s winning percentage at the midway point and the impact of such factors on
WINNING PERCENTAGE AND NHL ATTENDANCE 19
second-half attendance. Further, the attendance figures for the league as a whole, as well as each
individual club were analyzed.
The study revealed that the only season in which the relationship between a team’s record
at the midway point and subsequent attendance over the second half is significant was 2010-
2011. With this, it can be determined that there is a 36.6% correlation between winning
percentage and attendance across the league, as well as 13.4% of that correlation being due to
actual winning percentage. The fact that the p =.047 (p<.05) we are able to state that with 95%
certainty, the change in attendance for that season was due to winning percentage being above or
below .500. Because the data shows that it was only significant in one of the seasons, that
particular season still did not have a strong correlation between the two.
With this in mind, however, the unique trends of attendance that were pointed out for
individual teams over the six years is worth noting. Despite no true relationship between
attendance and winning percentage (or performance), a handful of teams seemed to have patterns
that could possibly provide an argument for success influencing attendance patterns. These
teams have been broken down into three groups: those who have increased their success over the
span, those who have decreased over the span, and those who have experienced both ups-and-
downs throughout the span.
1. Teams that have consistently increased:
- Boston Bruins: The Bruins’ record has improved overall since 2005-2006 (all the way to
being the Stanley Cup Champions in 2010-2011) and their attendance has also increased
with each passing year since 2006-2007.
- Buffalo Sabres: Prior to the lockout, the Sabres had had five straight seasons of missing
the playoffs. Since the lockout, the organization has had the potential to be a legitimate

WINNING PERCENTAGE AND NHL ATTENDANCE 20
playoff contender during the first half of 2005-2006 (eventually ended up coming within
one game of the Stanley Cup Finals) and their attendance has thus skyrocketed since then
as compared to what is was before the lockout. It presently remains near the top of the
league, averaging out at almost 100% since the second half of 2005-2006.
- Chicago Blackhawks: Perhaps the most unique case of all, the Blackhawks have had by
far the largest attendance change over these six years. They were near the bottom of the
league standings from 2005-2007, but have gotten immensely better since and made the
Western Conference Finals in 2009 and eventually won the Stanley Cup in 2010. After
averaging less than 70% capacity over the first three years examined, they have since
averaged 97% capacity.
- Los Angeles Kings: The Kings qualified for the playoffs in 2009-2010 and 2010-2011
for the first time in six seasons, with their attendance figures also rising over those two
seasons. Over the first four examined years, they averaged just over 93% and that has
since jumped to 96% and 100% over the final two, respectively.
- Washington Capitals: The Capitals have seen a consistent increase in attendance since
2006-2007. After missing the playoffs in the first two season after the lockout (as well as
two of the three years leading up to the lockout) and being near the bottom of the
standings, the Caps have been one of the league’s better teams since 2007-2008, and their
attendance has gone from 79% over the first three analyzed seasons to basically 100% in
the last three.
- Pittsburgh Penguins: The Penguins came out of the lockout having missed the playoffs
for two consecutive seasons and also failed to qualify in 2005-2006 (in which they
averaged 92% attendance capacity). The following season, the club began a string of
WINNING PERCENTAGE AND NHL ATTENDANCE 21
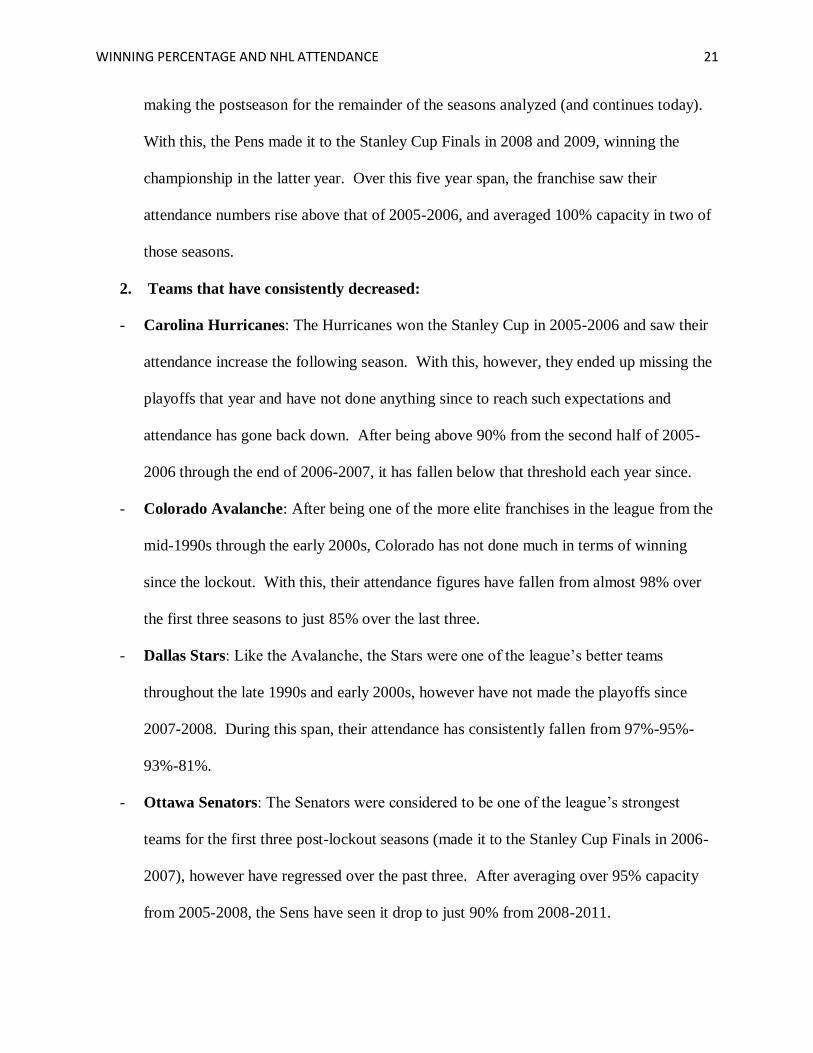
making the postseason for the remainder of the seasons analyzed (and continues today).
With this, the Pens made it to the Stanley Cup Finals in 2008 and 2009, winning the
championship in the latter year. Over this five year span, the franchise saw their
attendance numbers rise above that of 2005-2006, and averaged 100% capacity in two of
those seasons.
2. Teams that have consistently decreased:
- Carolina Hurricanes: The Hurricanes won the Stanley Cup in 2005-2006 and saw their
attendance increase the following season. With this, however, they ended up missing the
playoffs that year and have not done anything since to reach such expectations and
attendance has gone back down. After being above 90% from the second half of 2005-
2006 through the end of 2006-2007, it has fallen below that threshold each year since.
- Colorado Avalanche: After being one of the more elite franchises in the league from the
mid-1990s through the early 2000s, Colorado has not done much in terms of winning
since the lockout. With this, their attendance figures have fallen from almost 98% over
the first three seasons to just 85% over the last three.
- Dallas Stars: Like the Avalanche, the Stars were one of the league’s better teams
throughout the late 1990s and early 2000s, however have not made the playoffs since
2007-2008. During this span, their attendance has consistently fallen from 97%-95%-
93%-81%.
- Ottawa Senators: The Senators were considered to be one of the league’s strongest
teams for the first three post-lockout seasons (made it to the Stanley Cup Finals in 2006-
2007), however have regressed over the past three. After averaging over 95% capacity
from 2005-2008, the Sens have seen it drop to just 90% from 2008-2011.
WINNING PERCENTAGE AND NHL ATTENDANCE 22
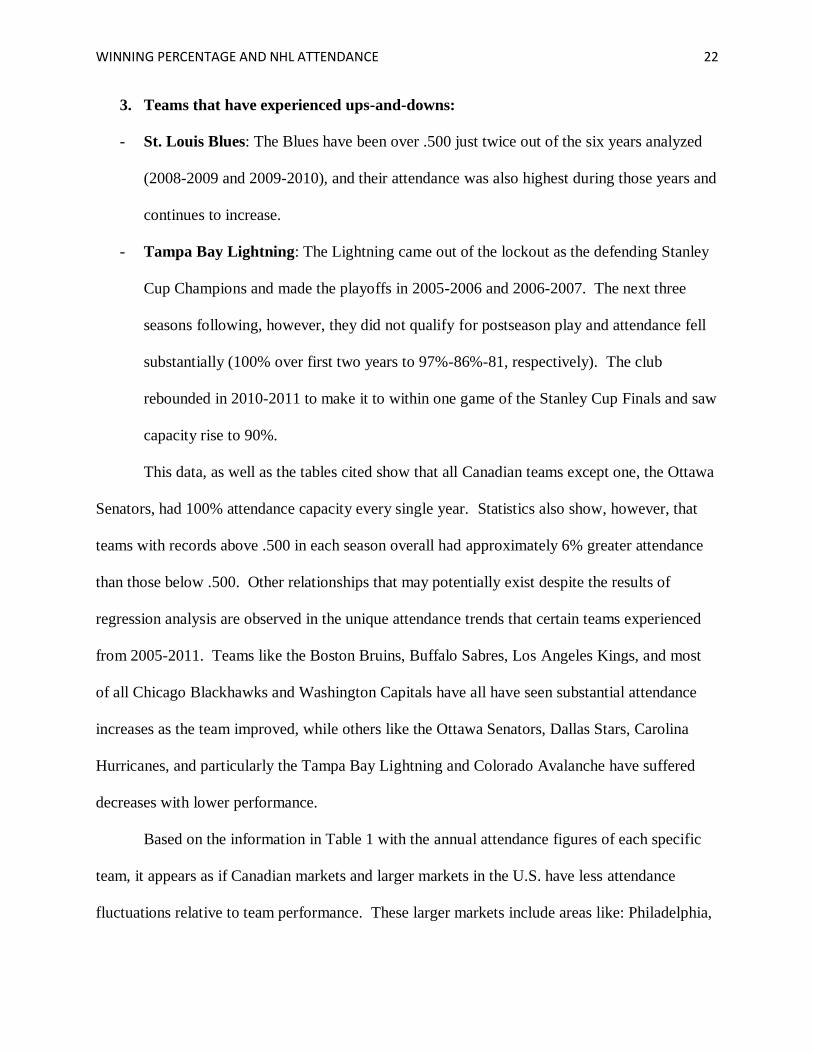
3. Teams that have experienced ups-and-downs:
- St. Louis Blues: The Blues have been over .500 just twice out of the six years analyzed
(2008-2009 and 2009-2010), and their attendance was also highest during those years and
continues to increase.
- Tampa Bay Lightning: The Lightning came out of the lockout as the defending Stanley
Cup Champions and made the playoffs in 2005-2006 and 2006-2007. The next three
seasons following, however, they did not qualify for postseason play and attendance fell
substantially (100% over first two years to 97%-86%-81, respectively). The club
rebounded in 2010-2011 to make it to within one game of the Stanley Cup Finals and saw
capacity rise to 90%.
This data, as well as the tables cited show that all Canadian teams except one, the Ottawa
Senators, had 100% attendance capacity every single year. Statistics also show, however, that
teams with records above .500 in each season overall had approximately 6% greater attendance
than those below .500. Other relationships that may potentially exist despite the results of
regression analysis are observed in the unique attendance trends that certain teams experienced
from 2005-2011. Teams like the Boston Bruins, Buffalo Sabres, Los Angeles Kings, and most
of all Chicago Blackhawks and Washington Capitals have all have seen substantial attendance
increases as the team improved, while others like the Ottawa Senators, Dallas Stars, Carolina
Hurricanes, and particularly the Tampa Bay Lightning and Colorado Avalanche have suffered
decreases with lower performance.
Based on the information in Table 1 with the annual attendance figures of each specific
team, it appears as if Canadian markets and larger markets in the U.S. have less attendance
fluctuations relative to team performance. These larger markets include areas like: Philadelphia,
WINNING PERCENTAGE AND NHL ATTENDANCE 23
Minnesota, Pittsburgh, and San Jose, while the smaller markets are places such as: St. Louis,
Nashville, Atlanta, Columbus, and Florida.
Threats of data, Implications, & future directions
Upon evaluating this study, certain threats to the validity of the data must be taken into
account. First, every specific club is located in a unique market, some of which may have more
loyal fans or even a larger fan base in general. Qualities as such can more or less impact the
amount of capacity an arena fills when they are winning or losing. Second, certain streaks
always may arise, for instance a “bottom feeder” may make a push in the second half towards the
playoff race, while a team near the top of the standings may struggle and significantly drop in the
standings throughout their final 41 outings. This can lead to large-scale variations in the
attendance over the first or second half. Further, some teams might make a “blockbuster” trade
at any point during the season that brings in a new face that has a huge impact on attracting fans.
Such an instance occurred in the 2009-2010 season, as the New Jersey Devils acquired Ilya
Kovalchuk from the Atlanta Thrashers at the trade deadline, which despite not having a real
influence on attendance figures, brought a world-class dynamic player to New Jersey. It may
also occur that a team who finishes near the bottom of the standings drafts a player thought to be
a “generational talent”, and thus garners additional fan interest (i.e. the Pittsburgh Penguins and
Sidney Crosby). Lastly, management or coaching changes may also play a role in drawing more
people to come to games if they had resentful feelings toward the staff being replaced.
One aspect of the population that should be noted is that the Atlanta franchise being
observed has relocated to Winnipeg since the conclusion of last season. Although this does not
have any impact on research because it only examines through 2010-2011, readers should be
made aware of the change.

WINNING PERCENTAGE AND NHL ATTENDANCE 24
In the future, additional research can build off this study by using the data collected and
predicting future attendance for each organization. For a different perspective on winning
percentage’s overall impact, it could also be examined as to how much additional revenue each
win adds for every team, which in turn could present an “optimal” number of wins for a profit-
maximizing owner.
This investigation determined that no significant relationship between winning
percentage and attendance can be determined from the past six NHL seasons with the exception
of 2010-2011. Additionally, even the relationship during this particular year was not particularly
strong. There are, however, trends among individual teams over this time period that contradict
the results of the study. The statistics put forth can also still be useful to ownership/management
of individual NHL franchises as well as the league as a whole because of the fact that it presents
in-depth details of overall attendance since the lockout. This would allow them to possibly
discover the areas in need of change and be of assistance in all aspects of business operations.

WINNING PERCENTAGE AND NHL ATTENDANCE 25
References
Assollant, I. B., Lacassagne, M. F., & Braddock II, J. H. (2007). Basking in reflected glory and
blasting: Differences in identity-management strategies between two groups of highly
identified soccer fans. Journal of Language and Social Psychology, 26(4), 381-388. doi:
10.1177/0261927X07306981.
Campbell Jr., R. M., Aiken, D., & Kent, A. (2004). Beyond BIRGing and CORFing:
Continuing the exploration of fan behavior. Sport Marketing Quarterly, 13, 151-157.
Davis, M. C. (2009). Analyzing the relationships between team success and MLB attendance
with GARCH effects. Journal of Sports Economics, 10(1), 44-58. doi:
10.1177/1527002508327387.
Dhurup, M., Dubihlela, J., & Surujlal, J. (2010). Dimensions of attachment among fans within
the South African Premier Soccer League (PSL) and the relationships with attendance.
African Journal for Physical, Health Education, Recreation and Dance, 16(3), 491-509.
Giulianotti, R. (2002). Supporters, followers, fans, and flaneurs: A taxonomy of spectator
identities in football. Journal of Sport and Social Issues, 26(1), 25-46. doi:
10.1177/0193723502261003.
Gratton, C. & Jones, I. (2010). Research Methods for Sports Studies (2nd
ed.). Oxon, England:
Routledge.
Hall, J., O’Mahony, B., & Vieceli, J. (2009). A model of predictors of attendance at major
sporting events. Paper presented at ANZMAC Conference, Melbourne, Australia.
Heere, B. & James, J. D. (2007). Sports teams and their communities: Examining the influence
of external group identities on team identity. Journal of Sport Management, 21, 319-337.
WINNING PERCENTAGE AND NHL ATTENDANCE 26
Koenigstorfer, J., Groeppel-Klein, A., & Schmitt, M. (2010). You’ll never walk alone—How
loyal are soccer fans to their clubs when they are struggling against relegation. Journal of
Sport Management, 24, 649-675.
Kraszewski, J. (2008). Pittsburgh in Fort Worth: Football bars, sports television, sports fandom,
and the management of home. Journal of Sport and Social Issues, 32(2), 129-157.
Kwon, H. H., Trail, G. T., Anderson, D. F., & Lee, D. (2007). The relationships among
vicarious achievement, team identification, and BIRGing/CORFing on viewers of the World
Series. Paper presented at NASSM Conference, Ft. Lauderdale, Florida.
Kwon, H. H., Trail, G. T., & Lee, D. (2008). The effects of vicarious achievement and team
identification on BIRGing and CORFing. Sport Marketing Quarterly, 17, 209-217.
Laverie, D. A. & Arnett, D.B. (2000). Factors affecting fan attendance: The influence of
identity salience and satisfaction. Journal of Leisure Research, 32(2), 225-246.
Laverie, D. A. & Arnett, D. B. (2001). Fan characteristics and sporting event attendance:
Examining variance in attendance. International Journal of Sports Marketing and
Sponsorship, 2, 219-238.
Leadley, J. C. & Zygmont, Z. X. (2006). When is the honeymoon over? National Hockey
League attendance, 1970-2003. Canadian Public Policy Analyse de Politiques, 32(2), 213-
232.
Leeds, M. & Sakata, S. (2011). Take me out to the Yakyushiai: Determinants of attendance at
Nippon Professional Baseball games. Journal of Sports Economics, 000(00), 1-19. doi:
10.1177/1527002510394294.
Lemke, R. J., Leonard, M, & Tihokwane, K. (2010). Estimating attendance at Major League
Baseball games for the 2007 season. Journal of Sports Economics, 11(3), 316-348. doi:
WINNING PERCENTAGE AND NHL ATTENDANCE 27
10.1177/1527002509337212.
Miller, R. K. & Washington, K. (2008). Chapter 21: National Hockey League (Sports
Marketing 2008).
Miller, R. K. & Washington, K. (2009). Chapter 22: National Hockey League (Sports
Marketing 2009).
Miller, R. K. & Washington, K. (2011). Chapter 25: National Hockey League (Sports
Marketing 2011).
Murrell, A. J. & Dietz, B. (1992). Fan support of sport teams: The effect of a common group
identity. Journal of Sport & Exercise Psychology, 14, 28-39.
Paul, R. J. (2003). Variations in NHL attendance: The impact of violence, scoring, and regional
rivalries. American Journal of Economics and Sociology, 62(2), 345-364.
Wann, D. L. & Branscombe, N. R. (1990). Die-hard and fair-weather fans: Effects of
identification on BIRGing and CORFing tendencies. Journal of Sport and Social Issues,
14(2), 103-117.
Wann, D. L., Hamlet, M. A., Wilson, T. M., & Hodges, J. A. (1995). Basking in reflected glory,
cutting off reflected failure, and cutting off future failure: The importance of group
identification. Social Behavior and Personality, 23(4), 377-388.
Wann, D. L., Keenan, B., & Page, L. (2006) Testing the team identification-social
psychological health model: Examining non-marquee sports, seasonal differences, and
multiple teams. Journal of Sport Behavior, 32(1), 112-124.
Wann, D. L., Grieve, F. G., & Pease, D. G. (2008) Motivational profiles of sport fans of
different sports. Sport Marketing Quarterly, 17, 6-19.
Weiler, K.H. & Higgs, C. T. (1997). Fandom in the 40's: The integrating functions of All
WINNING PERCENTAGE AND NHL ATTENDANCE 28
American Girls Professional Baseball League. Journal of Sport Behavior, 20(2), 211-231.
Zhang, J. J., Pease, D. G., Lam, E. T. C., Bellerive, L. M., Pham, U. L., Williamson, D. P., . . .
Wall, K. A. (2001). Sociomotivational factors affecting spectator attendance at minor
league hockey games. Sport Marketing Quarterly, 10(1), 43-54.

WINNING PERCENTAGE AND NHL ATTENDANCE 29
Table 1
Team-by-team attendance figures from 2005-06 through 2010-11
Team 2005-06 2006-07 2007-08 2008-09 2009-10 2010-11 Team Average
Anaheim 88% 95% 100% 99% 88% 86% 93%
Atlanta 84% 88% 85% 79% 73% 73% 80%
Boston 92% 84% 88% 97% 99% 100% 93%
Buffalo 90% 100% 100% 99% 99% 99% 98%
Calgary 100% 100% 100% 100% 100% 100% 100%
Carolina 83% 93% 89% 89% 82% 88% 87%
Chicago 65% 62% 82% 100% 95% 96% 83%
Colorado 100% 98% 94% 86% 77% 82% 89%
Columbus 93% 90% 82% 86% 85% 75% 85%
Dallas 96% 96% 97% 95% 93% 81% 93%
Detroit 100% 100% 94% 99% 97% 98% 98%
Edmonton 100% 100% 100% 100% 97% 100% 100%
Florida 94% 90% 91% 92% 89% 92% 91%
Los Angeles 98% 93% 92% 91% 96% 100% 95%
Minnesota 100% 100% 100% 100% 100% 100% 100%
Montreal 100% 100% 100% 100% 100% 100% 100%
Nashville 84% 89% 87% 88% 88% 94% 88%
New Jersey 75% 74% 82% 83% 82% 78% 79%
NY Islanders 78% 79% 84% 85% 78% 68% 79%
NY Rangers 100% 100% 100% 100% 99% 99% 100%
Ottawa 95% 94% 97% 92% 89% 90% 93%
Philadelphia 100% 100% 100% 100% 100% 100% 100%
Phoenix 91% 88% 87% 87% 70% 71% 82%
Pittsburgh 92% 96% 100% 99% 100% 99% 98%
San Jose 96% 100% 100% 100% 100% 100% 99%
St. Louis 74% 65% 92% 97% 99% 100% 88%
Tampa Bay 100% 100% 97% 86% 81% 90% 92%
Toronto 100% 100% 100% 100% 100% 100% 100%
Vancouver 100% 100% 100% 100% 100% 100% 100%
Washington 76% 76% 85% 99% 100% 100% 89%
League Average:
91% 92% 93% 94% 92% 92% 92%
Note. The percentages in the table represent the average percentage of each arena’s
capacity that was filled during that particular season
WINNING PERCENTAGE AND NHL ATTENDANCE 30
Table 2
Season-by-Season Attendance for teams above .500 and teams below .500
Year Below .500 Above .500
2005-2006 2006-2007 2007-2008 2008-2009 2009-2010 2010-2011
86% 86% 91% 91% 92% 87%
95% 96% 95% 97% 92% 95%
Overall Average: 89% 95%
Note. The percentages in the table represent the average collective percentage of the arenas
capacity for teams above vs. below .500 that was filled during that particular season
Table 3
Season-by-season winning percentages of teams with notable attendance changes based on record
Team 2005-06 2006-07 2007-08 2008-09 2009-10 2010-11
Boston .354 .427 .500 .646 .476 .561 Buffalo .634 .646 .476 .500 .549 .524 Carolina .634 .488 .524 .549 .427 .488 Chicago .317 .378 .488 .561 .634 .537 Colorado .524 .537 .537 .390 .524 .366 Dallas .646 .610 .549 .439 .451 .512 Los Angeles .512 .329 .390 .415 .561 .561 St. Louis .256 .415 .402 .500 .488 .463 Tampa Bay .524 .415 .402 .500 .488 .561 Washington .354 .341 .524 .610 .659 .585 Ottawa Pittsburgh
.634
.268 .585 .573
.524
.573 .439 .549
.536
.573 .390 .598
Note. The values in the table represent each team’s winning percentage over the entire season
represented by that heading.
WINNING PERCENTAGE AND NHL ATTENDANCE 31
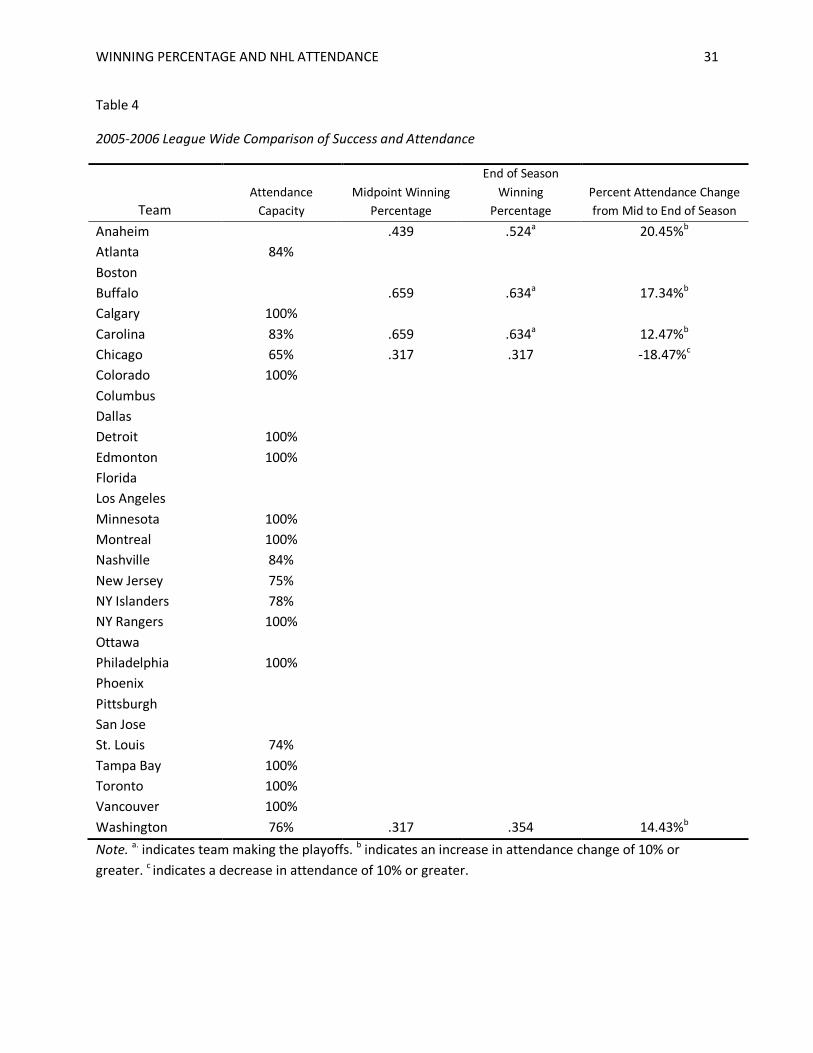
Table 4
2005-2006 League Wide Comparison of Success and Attendance
Team Attendance
Capacity
Midpoint Winning
Percentage
End of Season
Winning
Percentage
Percent Attendance Change
from Mid to End of Season
Anaheim .439 .524a 20.45%b
Atlanta 84%
Boston
Buffalo .659 .634a 17.34%b
Calgary 100%
Carolina 83% .659 .634a 12.47%b
Chicago 65% .317 .317 -18.47%c
Colorado 100%
Columbus
Dallas
Detroit 100%
Edmonton 100%
Florida
Los Angeles
Minnesota 100%
Montreal 100%
Nashville 84%
New Jersey 75%
NY Islanders 78%
NY Rangers 100%
Ottawa
Philadelphia 100%
Phoenix
Pittsburgh
San Jose
St. Louis 74%
Tampa Bay 100%
Toronto 100%
Vancouver 100%
Washington 76% .317 .354 14.43%b
Note. a. indicates team making the playoffs. b indicates an increase in attendance change of 10% or
greater. c indicates a decrease in attendance of 10% or greater.

WINNING PERCENTAGE AND NHL ATTENDANCE 32
Table 5
2006-2007 League Wide Comparison of Success and Attendance
Team Attendance
Capacity
Midpoint Winning
Percentage
End of Season
Winning
Percentage
Percent Attendance Change
from Mid to End of Season
Anaheim .683 .585a 13.95%b
Atlanta
Boston 84% .488 .427 11.51% b
Buffalo 100%
Calgary 100%
Carolina
Chicago
Colorado
Columbus
Dallas
Detroit 100%
Edmonton 100%
Florida
Los Angeles
Minnesota 100%
Montreal 100%
Nashville
New Jersey 74% .585 .598 a 14.13% b
NY Islanders 79% .463 .488 a 16.36% b
NY Rangers 100%
Ottawa
Philadelphia 100%
Phoenix .463 .378 13.74% b
Pittsburgh 100%
San Jose 100%
St. Louis 65% .317 .415 20.84% b
Tampa Bay
Toronto 100%
Vancouver 100%
Washington 76% .415 .341 11.90%b
Note. a. indicates team making the playoffs. b indicates an increase in attendance change of 10% or
greater. c indicates a decrease in attendance of 10% or greater.

WINNING PERCENTAGE AND NHL ATTENDANCE 33
Table 6
2007-2008 League Wide Comparison of Success and Attendance
Team Attendance
Capacity
Midpoint Winning
Percentage
End of Season
Winning
Percentage
Percent Attendance Change
from Mid to End of Season
Anaheim 100%
Atlanta 85%
Boston
Buffalo
Calgary 100%
Carolina
Chicago 82% .463 .488 40.72%b
Colorado
Columbus 82% .463 .415 15.50% b
Dallas
Detroit
Edmonton 100%
Florida .463 .463 10.58% b
Los Angeles
Minnesota 100%
Montreal 100%
Nashville
New Jersey 82%
NY Islanders 84%
NY Rangers 100%
Ottawa
Philadelphia 100%
Phoenix .537 .463 11.74% b
Pittsburgh 100%
San Jose 100%
St. Louis
Tampa Bay
Toronto 100%
Vancouver 100%
Washington 85% .390 .524 a 11.90%b
Note. a. indicates team making the playoffs. b indicates an increase in attendance change of 10% or
greater. c indicates a decrease in attendance of 10% or greater.
WINNING PERCENTAGE AND NHL ATTENDANCE 34
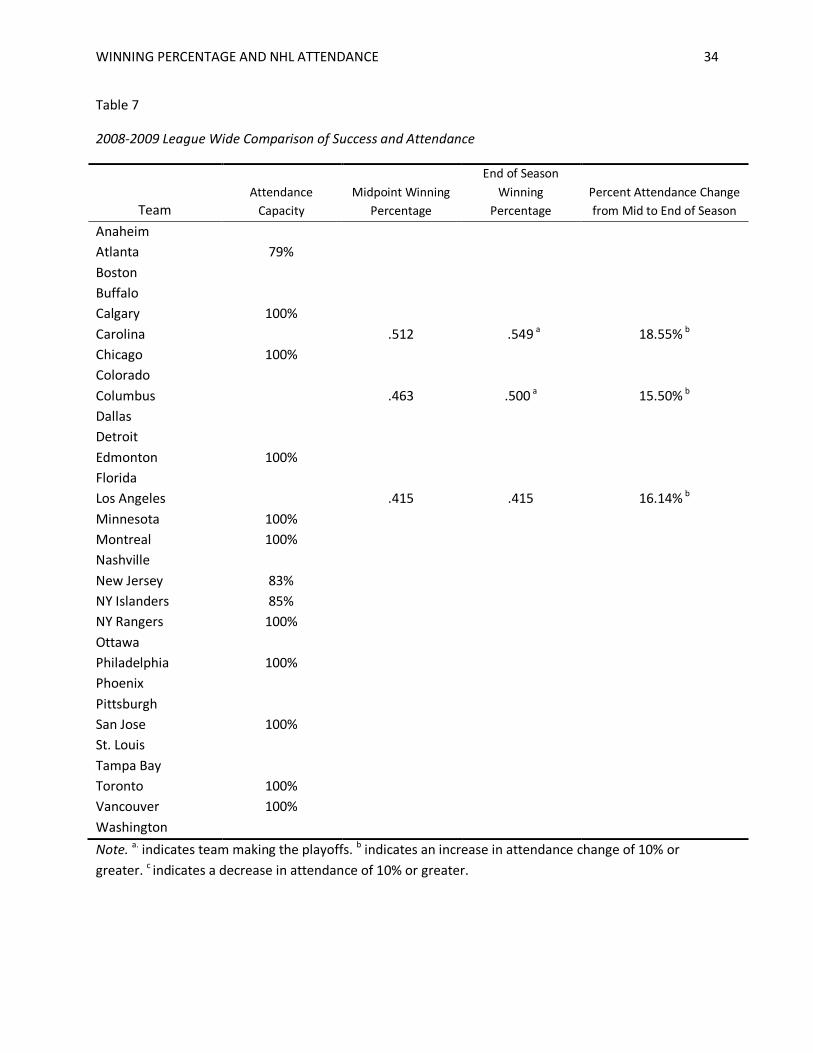
Table 7
2008-2009 League Wide Comparison of Success and Attendance
Team Attendance
Capacity
Midpoint Winning
Percentage
End of Season
Winning
Percentage
Percent Attendance Change
from Mid to End of Season
Anaheim
Atlanta 79%
Boston
Buffalo
Calgary 100%
Carolina .512 .549 a 18.55% b
Chicago 100%
Colorado
Columbus .463 .500 a 15.50% b
Dallas
Detroit
Edmonton 100%
Florida
Los Angeles .415 .415 16.14% b
Minnesota 100%
Montreal 100%
Nashville
New Jersey 83%
NY Islanders 85%
NY Rangers 100%
Ottawa
Philadelphia 100%
Phoenix
Pittsburgh
San Jose 100%
St. Louis
Tampa Bay
Toronto 100%
Vancouver 100%
Washington
Note. a. indicates team making the playoffs. b indicates an increase in attendance change of 10% or
greater. c indicates a decrease in attendance of 10% or greater.
WINNING PERCENTAGE AND NHL ATTENDANCE 35
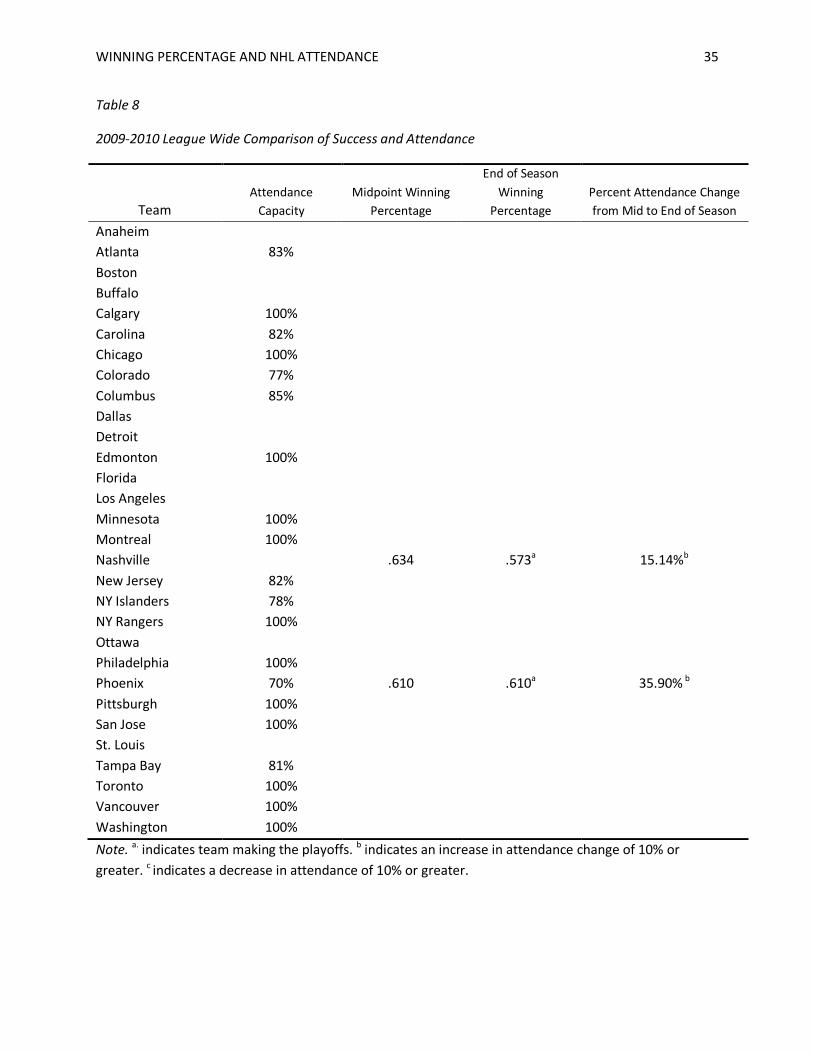
Table 8
2009-2010 League Wide Comparison of Success and Attendance
Team Attendance
Capacity
Midpoint Winning
Percentage
End of Season
Winning
Percentage
Percent Attendance Change
from Mid to End of Season
Anaheim
Atlanta 83%
Boston
Buffalo
Calgary 100%
Carolina 82%
Chicago 100%
Colorado 77%
Columbus 85%
Dallas
Detroit
Edmonton 100%
Florida
Los Angeles
Minnesota 100%
Montreal 100%
Nashville .634 .573a 15.14%b
New Jersey 82%
NY Islanders 78%
NY Rangers 100%
Ottawa
Philadelphia 100%
Phoenix 70% .610 .610a 35.90% b
Pittsburgh 100%
San Jose 100%
St. Louis
Tampa Bay 81%
Toronto 100%
Vancouver 100%
Washington 100%
Note. a. indicates team making the playoffs. b indicates an increase in attendance change of 10% or
greater. c indicates a decrease in attendance of 10% or greater.
WINNING PERCENTAGE AND NHL ATTENDANCE 36
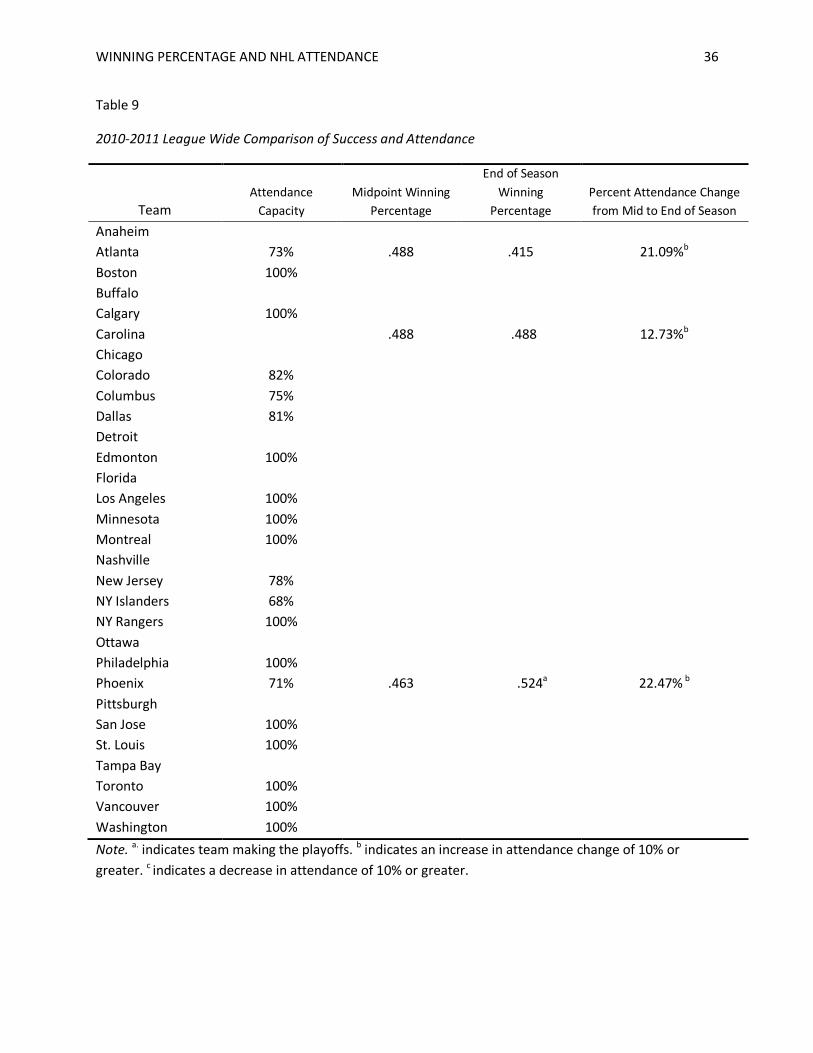
Table 9
2010-2011 League Wide Comparison of Success and Attendance
Team Attendance
Capacity
Midpoint Winning
Percentage
End of Season
Winning
Percentage
Percent Attendance Change
from Mid to End of Season
Anaheim
Atlanta 73% .488 .415 21.09%b
Boston 100%
Buffalo
Calgary 100%
Carolina .488 .488 12.73%b
Chicago
Colorado 82%
Columbus 75%
Dallas 81%
Detroit
Edmonton 100%
Florida
Los Angeles 100%
Minnesota 100%
Montreal 100%
Nashville
New Jersey 78%
NY Islanders 68%
NY Rangers 100%
Ottawa
Philadelphia 100%
Phoenix 71% .463 .524a 22.47% b
Pittsburgh
San Jose 100%
St. Louis 100%
Tampa Bay
Toronto 100%
Vancouver 100%
Washington 100%
Note. a. indicates team making the playoffs. b indicates an increase in attendance change of 10% or
greater. c indicates a decrease in attendance of 10% or greater.
WINNING PERCENTAGE AND NHL ATTENDANCE 37
Table 10
Correlation Analysis of League-Wide Midpoint Winning percentage and Attendance over the Second Half of Season
Year R R2 P-Value
2005-2006 0.225 0.051 0.232
2006-2007 0.018 0 0.926
2007-2008 0.206 0.042 0.275
2008-2009 0.054 0.003 0.776
2009-2010 0.162 0.026 0.391
2010-2011 0.366 0.134 0.047*
Note*p<.05