wings to your thoughts….. preventive measures … measures for failure of power... · the problem...
TRANSCRIPT
www.ijaret.org Vol. 1, Issue III, April 2013 ISSN 2320-6802
INTERNATIONAL JOURNAL FOR ADVANCE RESEARCH IN
ENGINEERING AND TECHNOLOGY WINGS TO YOUR THOUGHTS…..
Page 52
Preventive Measures for Failure of Power Electronics
Component 1Rahul U. Kale,
2Pavan M. Ingale,
3Rameshwar T. Murade
Shaaz College of Engineering, Hyderabad1,2,3
India
[email protected], [email protected]
2
Abstract— The assessment of the useful lifetime of equipment has been a focus of intense interest of electric utilities, especially
since the industry-wide restructuring and competition have imposed tightening of the operation and maintenance budgets. An
accurate model of power apparatus life time should contain a large number of operational and environmental factors, most of
which are not practical for monitoring - like the history of exposure to moisture, electrical stress, mechanical stress, and for many
other factors whose only partial information is available e.g. installation dates and amounts, as well as failure and replace ment
rates. A novel approach of prediction of failure of electrical equipment based on the past data is proposed in the present research
work. In today’s competitive market, production costs, lead time and optimal machine utilization are crucial values for
companies. Since machine or process breakdowns severely limit their effectiveness, methods are needed to predict products’ life
expectancy. This work will be simulated on PC and the results will be validated using appropriate metrics. Information about the
remaining life of products and their components is crucial for their disassembly and reuse, which in turn leads to a more efficient
and environmentally roundly usage of products and resources. Development of the Watchdog Agent answers the aforementioned
needs through enabling multi-sensor assessment and prediction of performance of products and machines.
Keywords—IGBT, Watchdog Agent, TFC
1. INTRODUCTION
The problem of resource management has long been
recognized as one of the burning issues in electric utilities.
Knowing how much to invest in creating a reliable and
successfully performing resource pool (i.e . power equipments,
distribution cable network), when to repair or rep lace, and
what human financial resources are needed from year to year
in order fo r such a network to operate successfully, the
answers to those question may represent substantial savings
for the utility .
The purpose of proposed work is to propose a methodology
for identification of failure performance of electrical
equipments from past data. It is assumed that a population of
equipments of the same type is being tracked over a sufficient
period, with knowledge of time of installation, and failure
record is available. If a large amount of statistical information
about equipment failu re rate performance is availab le (which it
is usually), then it is possible to develop a predictive strategy.
Industry invests more money on Electrical & Control
Equipments. A failure of any equipment affects on the
production & consumes time. Avoid Failure & Fix
Mechanism. Power electronics devices must have reliab ility,
lifetime, and health monitoring & predict ive maintenance.
Power semiconductor devices are the main components of
power electronic systems, as well as one of their most critical
parts in terms of reliability. Considering the increasing role of
power electronic converters in crit ical functions, particularly
in human transport applications with significant safety
requirements, features such as reliability, lifet ime, health
monitoring, and predict ive maintenance become increasingly
important. In addition, in this application context, the
operating conditions often induce stress, particularly high
ambient temperatures and strong temperature variations . In
first section we have see the what is effect aging in IGBT.
Second section present system which used to diagnosis the
failure of equipment. Third section what is the prognostic
method how it is beneficial. Fourth section examples to how
benefit the prognostic method
2. AGEING AND FAILURE MODES OF
IGBT
Thermal Cycling and Power Cycling in High Temperature
Thermal stresses have two origins in power electronics. The
first origin is power cycling, obtained when using converters
subject to load variations due to mission profiles that induce
loss variations in the power devices. The second origin is the
thermal cycling due to the variations of the surrounding
thermal environment in which the converters are placed.

www.ijaret.org Vol. 1, Issue III, April 2013 ISSN 2320-6802
INTERNATIONAL JOURNAL FOR ADVANCE RESEARCH IN
ENGINEERING AND TECHNOLOGY WINGS TO YOUR THOUGHTS…..
Page 53
Power converters used in transport applications typically
undergo both cycling modes, with different levels of
temperature swings and frequency. In ground or air transport
applications, converters operate under intermittent and/or
variable-load conditions that create power cycling. Thus, the
temperature range on chips is typically situated between 30 ◦C
and 60 ◦C, leading to lifet imes greater than one million cycles.
In addition, the power module can be submitted for a few
thousand cycles with ambient temperatures that can vary over
a very broad range (−40 ◦C to −55 ◦C in co ld ground zones
and 120 ◦C near engines).
Main Effects on Semiconductor Power Devices At this time,
the main effects of thermal and power cycling on IGBT power
modules have been quite well known for about ten years.
These effects are thermo mechanical and main ly concern the
layer assembly under the chips and the connections.
A. Study Goals
Different methods are investigated on the topic related to the
reliability and failure modes of power devices and the
consequences on converters and systems. A first main
direction is the analysis and modeling of ageing mechanisms
in order to estimate lifetimes or improve technologies. The
resulting works are based on thermo mechanical
considerations and are frequently sustained by the use of
fin ite-element (FE) simulation tools. These models must be
validated for any components or systems by experimental
results, which are very difficult and very time consuming to
obtain. [1]
Other considerations to be addressed are the consequences and
management of fau lts during converter operation. In this
respect, it is essential to consider redundancy options
or degraded operating modes. This concerns many
applications for which availab ility and/or safety are critical,
such as embedded power systems for human transport, which
are typical in this area. Health monitoring is another important
point of study. It is an essential step for developing efficient
approaches to predictive maintenance.
B. Context-Tested Devices
Different kinds of power-cycling tests were used on various
power modules. The orig inality of this work arises from the
particular test conditions applied to the power devices
(switching under nominal conditions and pulse width
modulation (PWM) operating mode) from high thermal stress
values (up to 90 ◦C for the base plate temperature and up to
170 ◦C on chips) and from the high number of tested samples.
The tested IGBT power modules were chosen because they
represent current technologies. The general aim is not to
characterize these specific devices in part icular, but to obtain
as many generic results as possible. Modules include three
inverter legs and use the most current assembly technology,
alumina-copper DBC, and aluminum wire bonds. Further
connection technologies have been developed and seem more
robust, but wire bonds still represent the most frequently used
technology.
Figure 1: Interio r view of the tested module.
Typical electrical ratings are 600 V and 200 A, which are
specifications in accordance with the target context, and the
maximal junction temperature is 175 ◦C. The three-phase
structure allows ageing four or six IGBTs simultaneously.
C. Connections-Metallization-Acceleration Factor
Conversely to the results usually provided by power cycling in
long term cycle operations, the ageing modes here mainly
concern the connections (wire bonds) and metallization, while
the DBC and solders are lightly damaged by the hardest
cycles.[11]
The following damage modes were observed on the wire
bonds
1) Heel crack and fractures (mechanical constraints in the
wires and fatigue phenomenon due to the deformation
related to temperature swings);
2) W ire bond liftoff (mechanical stress on Al–Si joints due to
the difference in the thermal expansion coefficient between Al
and Si);
3) Metallurgic damage due to the thermo mechanical stress on
aluminum resulting in part from the difference in the thermal
expansion coefficient between Al and Si.
The previous order gives the predominant mode appearing in
the different protocols from the least to the most severe stress.

www.ijaret.org Vol. 1, Issue III, April 2013 ISSN 2320-6802
INTERNATIONAL JOURNAL FOR ADVANCE RESEARCH IN
ENGINEERING AND TECHNOLOGY WINGS TO YOUR THOUGHTS…..
Page 54
Figure 2: Examples of bonding damages. (a) Metallurg ic
damage. (b) Heel crack. (c) Fracture. (d) Liftoff.
Figure 3: Examples of bonding damage cartographies.
3. PRESENT MAINTAINS SYSTEM
Figure 4: Maintains System
Maintenance management is a systematic process. Here all
activities are involved in keeping a system working. Fig.
shows the structure of maintenance management.
Work identification: - It is the first step of maintenance work
cycle. It is necessary to know on which equipment
maintenance has to be done. For this maintenance manager
first sets some criteria to select the equipment. Depending
upon those criteria , equipment can be selected.
Prioritising: - Maintenance manager should develop a prio rity
system, which will be applied to all p lanned and scheduled
work according to the importance of the job. The main
objective of priority system is to ensure that the most needed
work orders are scheduled first. It will also help to allocate the
resources in suitable proportion. (Lawrence Mann, 1982)
Planning : - “Maintenance planning is the administrative
preparation of selected major jobs in advance so that upon
execution they can be completed more efficiently”
(Tomlingson, 1993) Planning determines the resource
requirements such as labour, materials etc. for each job. It
helps to do the work more efficiently and with less downtime.
Scheduling: - It is the next step of planning. It determines the
best time to do the job so that there will be least interruption of
operations. It must consider the job prio rity, resources and
labour etc before scheduling any job. It also helps to use the
maintenance resources effectively. In other words good
planning and scheduling improves the quality of work.

www.ijaret.org Vol. 1, Issue III, April 2013 ISSN 2320-6802
INTERNATIONAL JOURNAL FOR ADVANCE RESEARCH IN
ENGINEERING AND TECHNOLOGY WINGS TO YOUR THOUGHTS…..
Page 55
Reporting : - Here all the activit ies are recorded and are
closely monitored. Then report is made for evaluation and to
determine further improvements that are necessary.
Evaluation: - In this step the evaluation of maintenance
activities are done. Then if necessary maintenance manager
can make changes such as selection of another maintenance
policy etc.
D. Comparison for Preventive & Predictive Maintains
Figure 5: Comparison of Breakdown, preventive and
predictive maintenance policies
In Predictive Maintenance, inspection depends upon the
condition of machine. This is the main difference between
preventive maintenance and predictive maintenance.
Preventive maintenance works on time-scheduled basis
regardless of machine conditions while predictive maintenance
works on condition-based in which inspection is carried out
after checking the machine condition. It uses the diagnostic
equipment for checking the machine condit ion. When
indicator reaches a specified level, work is undertaken to
repair or replace the part. It means that part is repaired only
when diagnostic equipment gives the proof that part is not
working to its standard. In predictive maintenance some
special sensor devices are connected to machines to detect
changes in the different parameter like temperature, v ibration
etc related with the normal operation of the machines. These
devices generate the signals. When some of these values are
out of control limit, it is possible to predict the number of
hours expected for the machine to perform properly, before the
predicted breakdown. This continuous analysis helps the
maintenance person to check the equipment condition to avoid
the failu re to happen.
Implementing pred ictive maintenance is a long process. It
includes many steps, [5]
Monitoring the parameter: The first thing is to decide
which parameters have to be monitored, hence all the
critical parameters have to be listed.
A schedule of the activities: After deciding the
parameters, then it is necessary to decide the schedule
of activit ies, which act ivities are to be carried out first
etc.
Diagnostics to identify problems: Pred ictive
maintenance uses the diagnostic equipment to
monitor the parameters.
A record of monitored values: Diagnostic equipment
generates the signals and these signals have to be
converted into values.
Data analysis and corrective actions: It is important to
analyse the data (values) so that if any value is going
out of control limit, maintenance person can take the
corrective action to correct the problem.
4. SMART PROGNOSTICS AGENTS
For different industries or sectors, the performance of
machines or processes degrades due to aging and wear, which
decreases their reliab ility and increases the potential of failure
and downtime. On the other hand, highest possible quality of
products and services is indispensable for attain ing or
retaining market domination. Therefore, to achieve near-zero
downtime and optimal quality of products and services,
prognostics is increasingly needed to predict future failures.
And the proactive Predict and Prevent (PAP) maintenance
paradigm will consequently replace the currently prevalent
Fail and Fix (FAF) parad igm, which reactively addresses and
fixes failures once they occur.
E. Watchdog Agent for multi-sensor performance
assessment & prediction
The Watchdog Agent bases its degradation assessment on the
readings from multiple sensors that measure critical propert ies
of the process, or machinery that is being considered. It is
expected that the degradation process will alter the sensor
readings that are being fed into the Watchdog Agent, and thus
enable it to assess and quantify the degradation through
www.ijaret.org Vol. 1, Issue III, April 2013 ISSN 2320-6802
INTERNATIONAL JOURNAL FOR ADVANCE RESEARCH IN
ENGINEERING AND TECHNOLOGY WINGS TO YOUR THOUGHTS…..
Page 56
quantitatively describing the corresponding change of sensor
signatures. In addition, a model of the process or piece of
equipment that is being considered, available application
specific knowledge, or prior h istorical records of equipment
behavior can be used to aid the degradation process
description, provided that such a model, expert knowledge or
historical records exist. The prognostic function of the
Watchdog is realized through trending and modeling of the
dynamics of the observed process performance signatures
and/or model parameters. This allows one to predict the future
behavior of these patterns and thus forecast the behavior of the
process, or piece of machinery that is being considered.
Furthermore, the Watchdog Agent also has the diagnostic
capabilit ies through memorizing the significant signature
patterns in order to recognize situations that have been
observed in the past, or be aware of the situation that was
never observed before. Thus, the Watchdog Agent has
elements of intelligent behavior that enable it to answer the
questions: When the observed process, or equipment is going
to fail, or degrade to the point when its performance becomes
unacceptable. Why the performance of the observed process,
or equipment is degrading, or in other words, what is the cause
of the observed process or machinery degradation. The answer
to the first question enables the prognostic Watchdog function
and the answer to the second question enables its diagnostic
function. Thus, in essence, the functionality of the Watchdog
Agent can be summarized in the following three tasks:
† Quantitative mult i-sensor assessment of performance
degradation.
† Forecasting of performance degradation.
† Diagnosis of the reasons of the current or predicted
performance degradation. The prognostic and diagnostic
outputs of Watchdogs mounted on all the processes and
machinery of interest can then be fed into a decision support
tool (DST) that addresses the question:
† What is the most crit ical object or process in the system with
respect to maintenance, or repair. The answer to this question
is obtained through taking into account the risks of taking, or
not taking the maintenance action at a given t ime, and then
optimizing the costs associated with the maintenance
operation if the decision to perform maintenance is made, or
the cost of downtime and repair if the maintenance is omitted
and the process or machine fails. Thus, the output of the DST
module is an optimal maintenance policy for a number of
objects in the system. Those objects are tradit ionally processes
and/or equipment, and the system could be a manufacturing
line, or a p lant. However, there is no reason why an object
could not be a hardware, or software component of a vehicle,
and the associated system can be the vehicle itself, or the
population of similar vehicles in the field .Therefore, the
operation of an IMS can be summarized in answering the
previously described ‘when’, ‘why’ and ‘what’ questions in
order to postulate an optimal maintenance/ repair set of
decisions that facilitate an optimal set of maintenance/repair
actions that enable near zero downtime of the
production/service system and maximizes the cost benefits of
the predictive machine-level informat ion. Such a system of
Watchdogs integrated by a DST thus enables maintenance that
is in the same t ime condition based, as well as predictive and
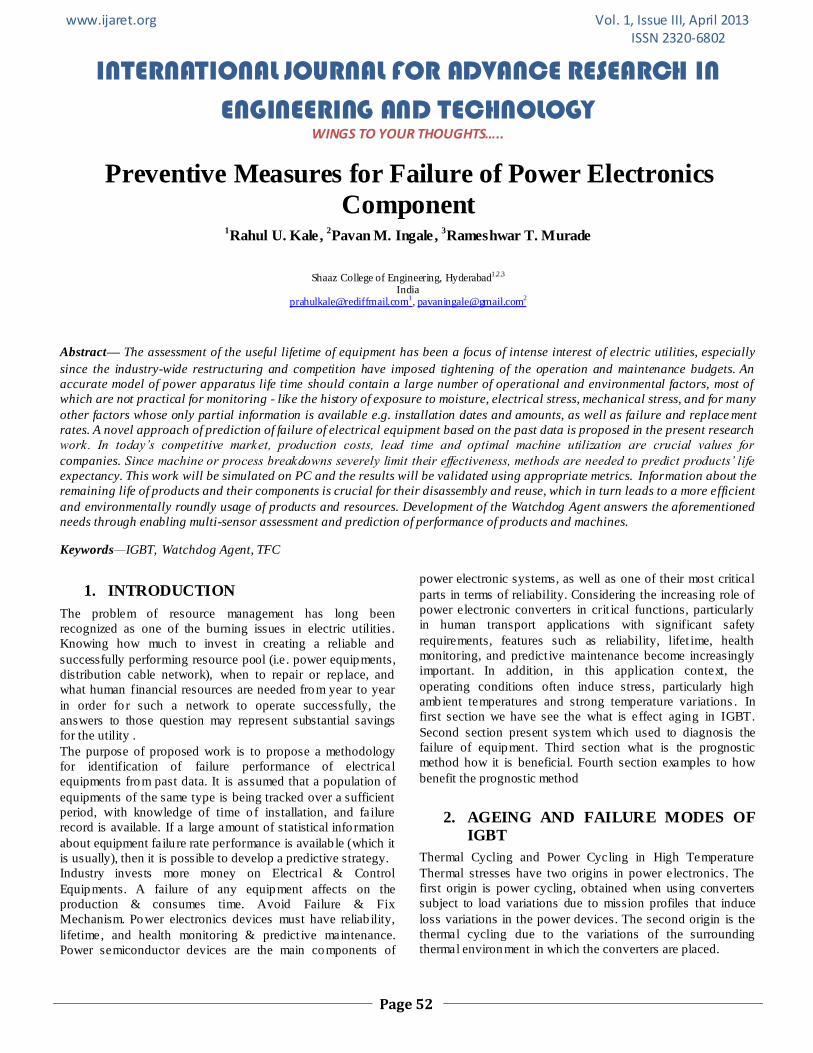
proactive. Furthermore, as indicated in Fig. , information
about current and predicted performance degradation of
components in a product is indispensable in assessing
remain ing life of those components and possibility of their
cost-effective and safe disassembly and reuse in other
products.
Figure 6: Schematic representation of an intelligent
maintenance system
Schemat ic representation of the structure of IMS operations
and the use of predictive performance-related informat ion is
illustrated in Fig. The three main functionalit ies of the
Watchdog Agent are accomplished through several functional
modules, as schematically illustrated in Fig. 3. Assessment of
performance degradation is accomplished through a module
performing processing of multiple sensory inputs and
extraction of features relevant to description of product’s
performance, fo llowed by a module executing the
multisensory performance assessment based on the extracted
signal features, with the multi-sensor assessment component
being realized through the feature- level, or decision-level
sensor fusion, as defined by the Joint Directors of Laboratories
(JDL) standard of mult i-sensor data fusion . Performance
prediction function is realized through extract ion of
performance-related features and application of tools capable
of capturing dynamic behavior of the extracted performance-
related features and extrapolating it over time in order to
www.ijaret.org Vol. 1, Issue III, April 2013 ISSN 2320-6802
INTERNATIONAL JOURNAL FOR ADVANCE RESEARCH IN
ENGINEERING AND TECHNOLOGY WINGS TO YOUR THOUGHTS…..
Page 57
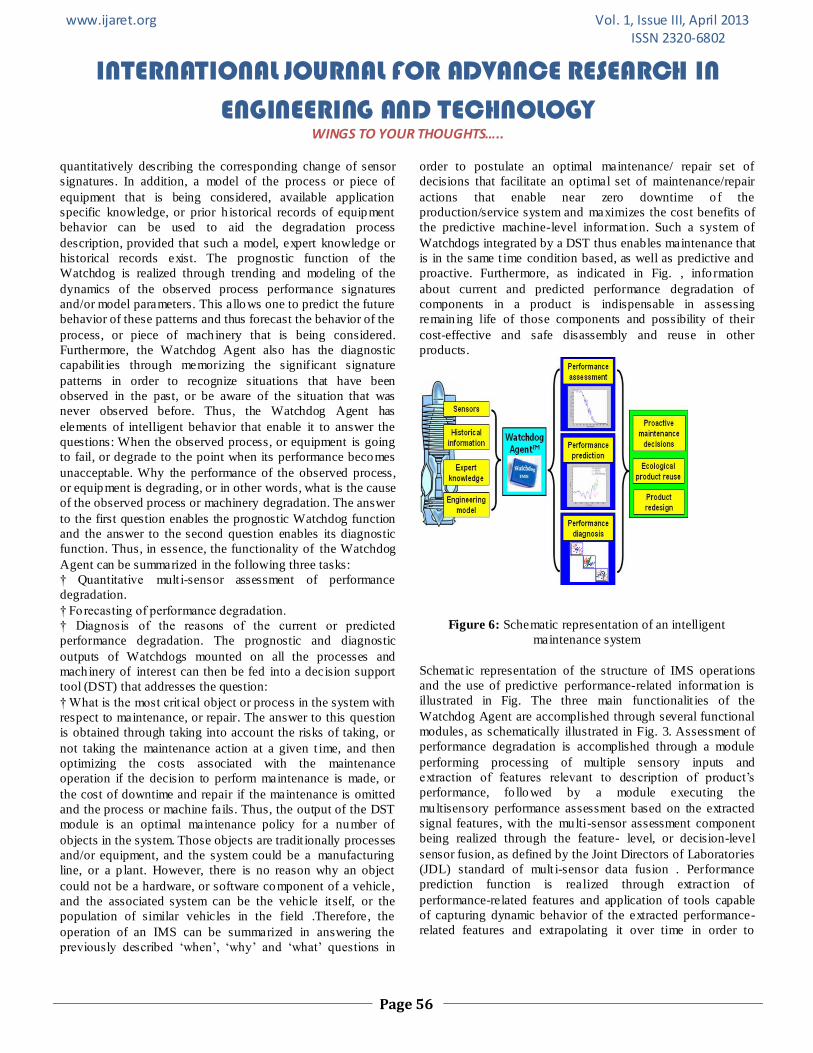
predict their future behavior and future behavior of the
underlying process.
Finally, performance diagnosis function of the Watchdog is
realized through matching of the currently ext racted or
predicted performance-related features with signatures
describing different modes (healthy or faulty) of process
behavior. Thus, condition diagnosis is a step relevant to both
the health assessment functionality (pertaining to the present
performance of the monitored process of piece of Equipment)
and the performance forecasting functionality (pertain ing to
the predicted performance of the monitored process of piece of
equipment). The mult i-sensor performance assessment,
diagnosis and prediction functionalities of the Watchdog
Agent could be even further enhanced if Watchdog Agents
mounted on identical products operating under similar
conditions could exchange informat ion and thus assist each
other in building the world model. Furthermore, this
communicat ion can be used to benchmark the performance of
‘brother-products’ and thus rapidly and efficiently identify
under-performing units before they cause any serious damage
and losses.
This paradigm of communication and benchmarking between
identical products operating in similar conditions is referred to
as the ‘peer-to-peer’ (P2P) paradigm. Furthermore, as
mentioned earlier, engineering mode of the monitored process,
application specific expert knowledge about the process as
well as historical records of process behavior over t ime can be
utilized to improve all functional modules of the Watchdog
Agent (sensory signal [12] processing and feature extraction,
health assessment, condition diagnosis and performance
prediction). One can now easily observe a parallel between the
Watchdog Agent structures illustrated in Fig. 3 with the well-
known open system architecture for condition-based
maintenance (OSA-CBM) standard, according to which a
typical CBM system consists of the following seven layers:
† Sensor module
† Signal p rocessing
† Condition monitoring
† Health assessment
† Prognostics
† Decision-making support
† Presentation
Figure 7: Flow chart Functionality of the Watchdog
5. EXAMPLES FOR WATCHDOG
AGENT
F. Signal processing & features watchdog agent
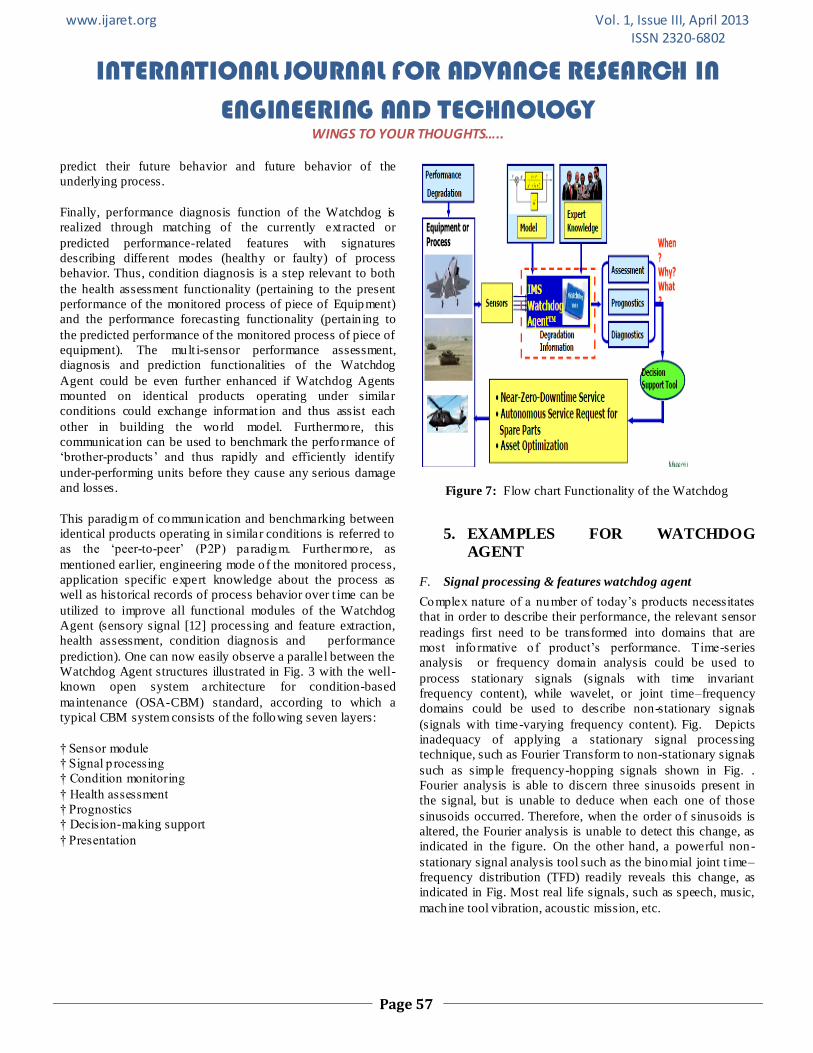
Complex nature of a number of today’s products necessitates
that in order to describe their performance, the relevant sensor
readings first need to be transformed into domains that are
most informative o f product’s performance. Time-series
analysis or frequency domain analysis could be used to
process stationary signals (signals with time invariant
frequency content), while wavelet, or joint time–frequency
domains could be used to describe non-stationary signals
(signals with time-varying frequency content). Fig. Depicts
inadequacy of applying a stationary signal processing
technique, such as Fourier Transform to non-stationary signals
such as simple frequency-hopping signals shown in Fig. .
Fourier analysis is able to discern three sinusoids present in
the signal, but is unable to deduce when each one of those
sinusoids occurred. Therefore, when the order o f sinusoids is
altered, the Fourier analysis is unable to detect this change, as
indicated in the figure. On the other hand, a powerful non-
stationary signal analysis tool such as the binomial joint t ime–
frequency distribution (TFD) readily reveals this change, as
indicated in Fig. Most real life signals, such as speech, music,
machine tool vibration, acoustic mission, etc.
www.ijaret.org Vol. 1, Issue III, April 2013 ISSN 2320-6802
INTERNATIONAL JOURNAL FOR ADVANCE RESEARCH IN
ENGINEERING AND TECHNOLOGY WINGS TO YOUR THOUGHTS…..
Page 58
Figure 8: TFD Signal
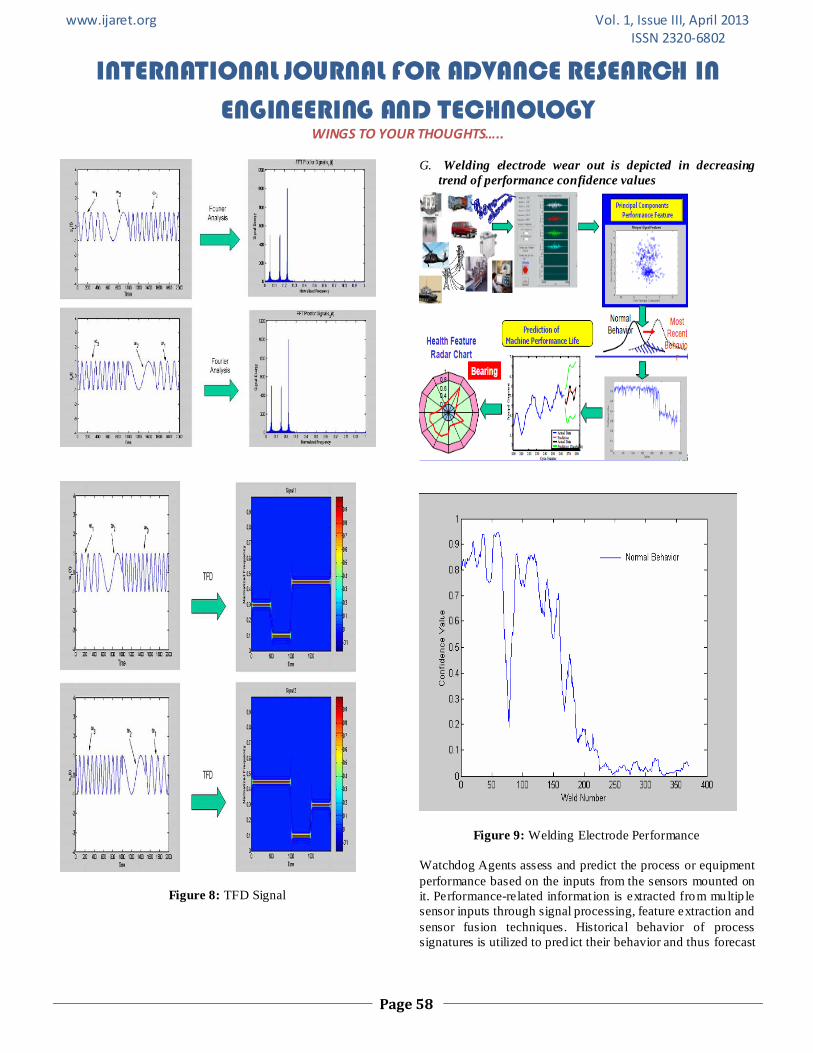
G. Welding electrode wear out is depicted in decreasing
trend of performance confidence values
Figure 9: Welding Electrode Performance
Watchdog Agents assess and predict the process or equipment
performance based on the inputs from the sensors mounted on
it. Performance-related informat ion is extracted from multip le
sensor inputs through signal processing, feature extraction and
sensor fusion techniques. Historical behavior of process
signatures is utilized to pred ict their behavior and thus forecast
www.ijaret.org Vol. 1, Issue III, April 2013 ISSN 2320-6802
INTERNATIONAL JOURNAL FOR ADVANCE RESEARCH IN
ENGINEERING AND TECHNOLOGY WINGS TO YOUR THOUGHTS…..
Page 59
the process or machine performance. Based on the forecasted
performance, proactive maintenance can be facilitated through
the prediction of potential failure before it occurs.
Furthermore, this proactive maintenance infrastructure can be
supported by the information learnt at Watchdog and this Peer
to Peer (P2P) parad igm will be utilized to improve diagnos tic
and forecasting functionalities of the Watchdog.
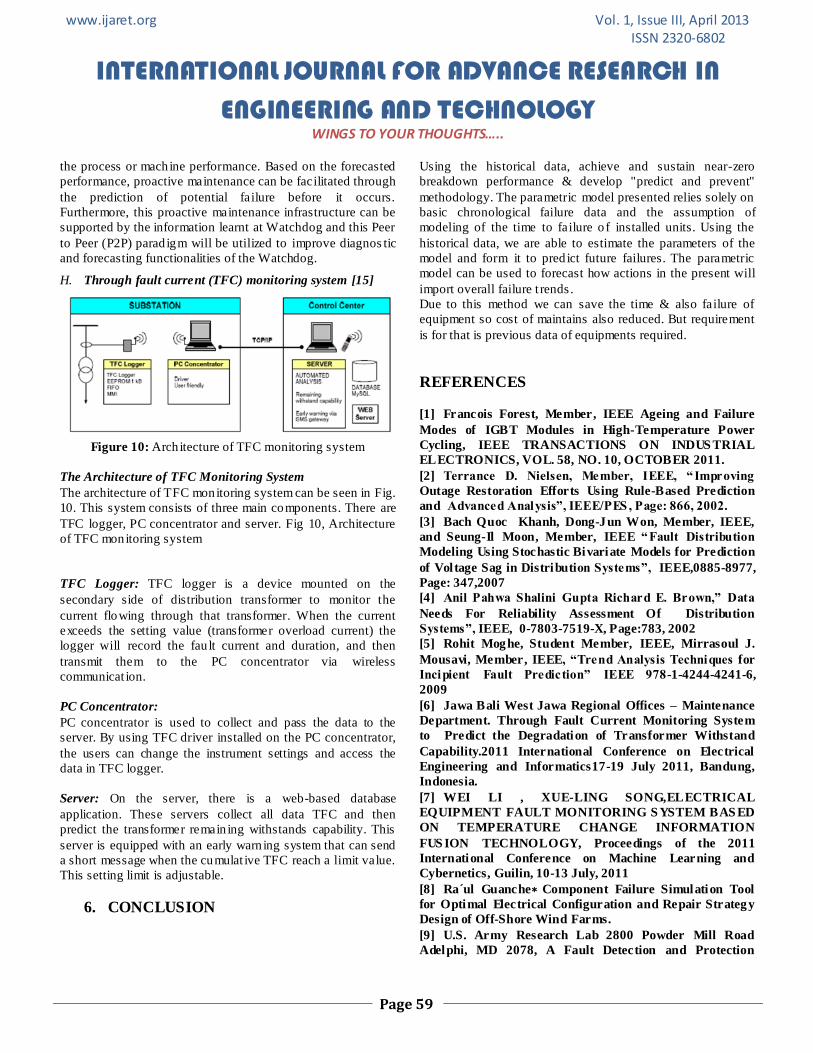
H. Through fault current (TFC) monitoring system [15]
Figure 10: Architecture of TFC monitoring system
The Architecture of TFC Monitoring System
The architecture of TFC monitoring system can be seen in Fig.
10. This system consists of three main components. There are
TFC logger, PC concentrator and server. Fig 10, Architecture
of TFC monitoring system
TFC Logger: TFC logger is a device mounted on the
secondary side of distribution transformer to monitor the
current flowing through that transformer. When the current
exceeds the setting value (transformer overload current) the
logger will record the fau lt current and duration, and then
transmit them to the PC concentrator via wireless
communicat ion.
PC Concentrator:
PC concentrator is used to collect and pass the data to the
server. By using TFC driver installed on the PC concentrator,
the users can change the instrument settings and access the
data in TFC logger.
Server: On the server, there is a web-based database
application. These servers collect all data TFC and then
predict the transformer remain ing withstands capability. This
server is equipped with an early warn ing system that can send
a short message when the cumulat ive TFC reach a limit value.
This setting limit is adjustable.
6. CONCLUSION
Using the historical data, achieve and sustain near-zero
breakdown performance & develop "predict and prevent"
methodology. The parametric model presented relies solely on
basic chronological failure data and the assumption of
modeling of the time to failure o f installed units. Using the
historical data, we are able to estimate the parameters of the
model and form it to pred ict future failures. The parametric
model can be used to forecast how actions in the present will
import overall failure t rends.
Due to this method we can save the time & also failure of
equipment so cost of maintains also reduced. But requirement
is for that is previous data of equipments required.
REFERENCES
[1] Francois Forest, Member, IEEE Ageing and Failure
Modes of IGBT Modules in High-Temperature Power
Cycling, IEEE TRANSACTIONS ON INDUS TRIAL
ELECTRONICS, VOL. 58, NO. 10, OCTOBER 2011.
[2] Terrance D. Nielsen, Member, IEEE, “Improving
Outage Restoration Efforts Using Rule-Based Prediction
and Advanced Analysis”, IEEE/PES , Page: 866, 2002.
[3] Bach Quoc Khanh, Dong-Jun Won, Member, IEEE,
and Seung-Il Moon, Member, IEEE “Fault Distribution
Modeling Using Stochastic Bivariate Models for Prediction
of Voltage Sag in Distribution Systems”, IEEE,0885-8977,
Page: 347,2007
[4] Anil Pahwa Shalini Gupta Richard E. Brown,” Data
Needs For Reliability Assessment Of Distribution
Systems”, IEEE, 0-7803-7519-X, Page:783, 2002
[5] Rohit Moghe, Student Member, IEEE, Mirrasoul J.
Mousavi, Member, IEEE, “Trend Analysis Techniques for
Incipient Fault Prediction” IEEE 978-1-4244-4241-6,
2009
[6] Jawa Bali West Jawa Regional Offices – Maintenance
Department. Through Fault Current Monitoring System
to Predict the Degradation of Transformer Withstand
Capability.2011 International Conference on Electrical
Engineering and Informatics17-19 July 2011, Bandung,
Indonesia.
[7] WEI LI , XUE-LING SONG,ELECTRICAL
EQUIPMENT FAULT MONITORING S YSTEM BAS ED
ON TEMPERATURE CHANGE INFORMATION
FUS ION TECHNOLOGY, Proceedings of the 2011
International Conference on Machine Learning and
Cybernetics, Guilin, 10-13 July, 2011
[8] Ra´ul Guanche∗ Component Failure Simulation Tool
for Optimal Electrical Configuration and Repair Strategy
Design of Off-Shore Wind Farms.
[9] U.S. Army Research Lab 2800 Powder Mill Road
Adelphi, MD 2078, A Fault Detection and Protection

www.ijaret.org Vol. 1, Issue III, April 2013 ISSN 2320-6802
INTERNATIONAL JOURNAL FOR ADVANCE RESEARCH IN
ENGINEERING AND TECHNOLOGY WINGS TO YOUR THOUGHTS…..
Page 60
Scheme for Three-Level DC-DC Converters Based on
Monitoring Flying Capacitor Voltage .
[10] Jay Lee, Ohio Eminent Scholar and L.W. Scott Alter
Chair Professor Univ. of Cincinnati, Intelligent
Maintenance S ystems (IMS ), www.imscenter.net
[11] Francois Forest, Member, IEEE Ageing and Failure
Modes of IGBT Modules in High-Temperature Power
Cycling, IEEE TRANSACTIONS ON INDUS TRIAL
ELECTRONICS, VOL. 58, NO. 10, OCTOBER 2011.
[12] Terrance D. Nielsen, Member, IEEE, “Improving
Outage Restoration Efforts Using Rule-Based Prediction
and Advanced Analysis”, IEEE/PES, Page: 866, 2002.
[13] Bach Quoc Khanh, Dong -Jun Won, Member, IEEE,
and Seung-Il Moon, Member, IEEE“Fault Distribution
Modeling Using Stochastic Bivariate Models for Prediction
of Voltage Sag in Distribution Systems”, IEEE,0885-8977,
Page: 347,2007
[14] Jay Lee, Ohio Eminent Scholar and L.W. Scott Alter
Chair Professor Univ. of Cincinnati, Intelligent
Maintenance S ystems (IMS ), www.imscenter.net
[15] “Through fault monitoring system predict the
degradation of transformer withstand capability “
H.Muhlis, M.N. Nugraha, H. Maryano , H.I. Septiyono,
2011 International conference Electrical Engineering