wine trends & sales at lcbo - wgao · shari mogk-edwards vice-president, products, sales &...
TRANSCRIPT
SHARI MOGK-EDWARDSVice-President, Products, Sales & Merchandising
INSIGHTS Conference
March 1, 2016
Wine Trends & Sales at LCBO

Market
Overview

REST OF
CANADA
Source: Statistics Canada
ONTARIO
$4.2B
$2.2B
TOTAL
$6.4B
SALES OF WINE IN CANADA
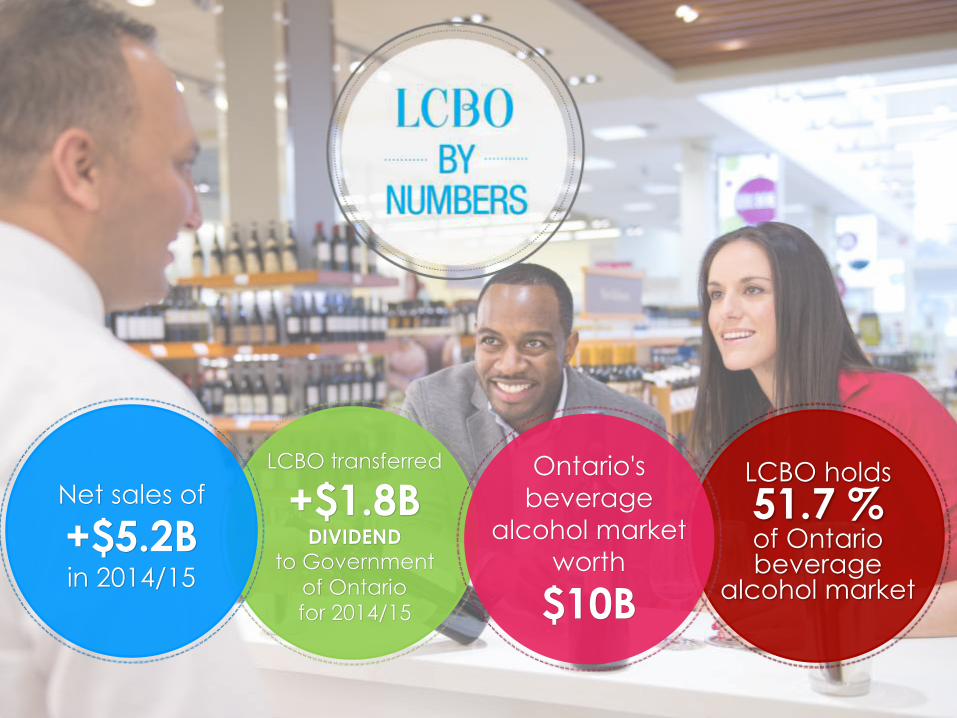
LCBO holds
51.7 %of Ontario beverage
alcohol market
LCBO transferred
+$1.8B DIVIDEND
to Governmentof Ontariofor 2014/15
Ontario's
beverage
alcohol market
worth
$10B
Net sales of
+$5.2Bin 2014/15

7,850Employees
654Stores across
Ontario
+130 Million
Transactions
Annually
3,200Suppliers
7.8Million Shoppers
each Year

150,000+
Followers
1M+ Visits to
LCBO.com
15,000+
Followers

MERCHANDISING
STRATEGYBe the retailer of choice for
beverage alcohol for
customers of Ontario – with
a focus on Spirits, VINTAGES
and Craft Beer, while LCBO
Wines and Beer drive turns
and traffic.

Sales
Trends

+3.9%+2.2%
+4.3%+6.1%
+4.7%
$0.0
$1.0
$2.0
$3.0
$4.0
$5.0
$6.0
$7.0
2012/13 2013/14 2014/15 2015/16 (P) 2016/17 (F)
Annual
Sales
Growth in
Billions

51%
36%
29%
2006 2007 2008 2009 2010 2011 2012 2013 2014 2015
LCBO
Retail
Grocery
Retail in
Ontario

$2.1B
+5.1%
$1.2B
+10.2%
$1.5B
+4.1%
$0.5B
+7.2%
Spirits
Wine
Beer &
Cider
VINTAGES
+6.1%
Total
$5.2B
R13 P11
Sales by
Business
Unit

1,482
1,023
1,634
4,248
Spirits
Wine
Beer & Cider
VINTAGES
Total
8,387
Snapshot: January 4, 2016

Total Wine Sales
R13 P11
VINTAGES
$0.5B, 26%,
+7.2%
LCBO
Wines
$1.4B, 74%,
+4.1%
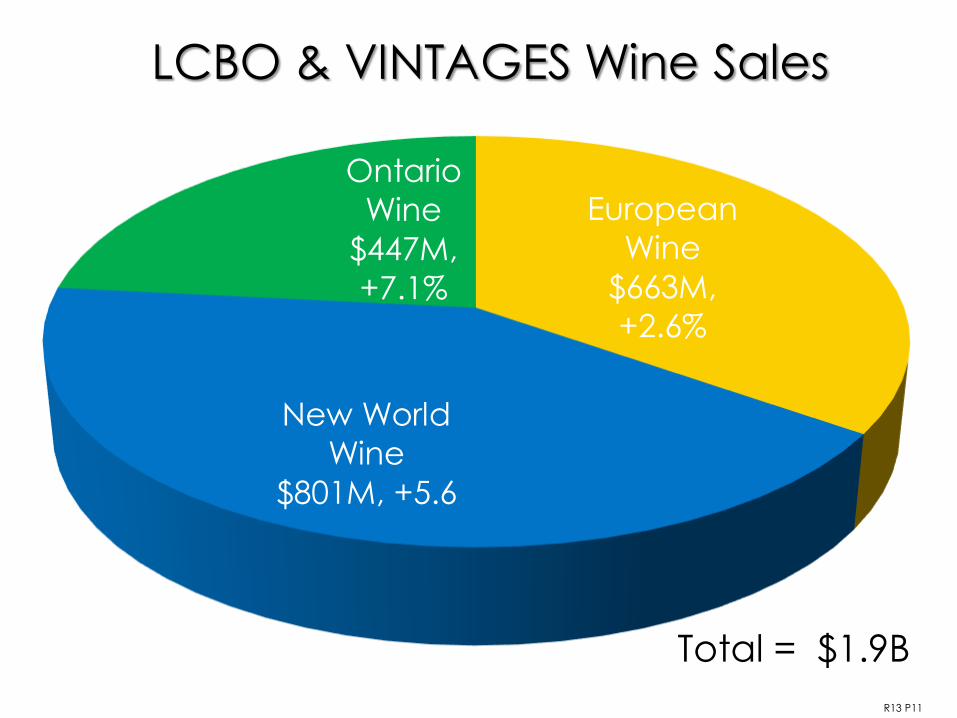
European
Wine
$663M,
+2.6%
New World
Wine
$801M, +5.6
Ontario
Wine
$447M,
+7.1%
LCBO & VINTAGES Wine Sales
R13 P11
Total = $1.9B

Ontario 30%
Italy 17% California
13%
Australia 12%
France 8%
Chile6%
Argentina 4%
Spain 2%
South Africa 2%
Portugal 2%New
Zealand 1.7%Germany 2%
Other 1%
LCBO Wines
Market Share Breakdown
R13 P11

LCBO Wine Sales by Type
R13 P11
White Wine
$613M, +5%
Red Wine
$700M, +3%
Rosè Wine
$45M, +8.5%

R13 P11
White Wine
$138M, +6.9%
Red Wine
$323M, +7.7%
Rosè Wine
$8.8M, +20%
VINTAGES Wine Sales by Type
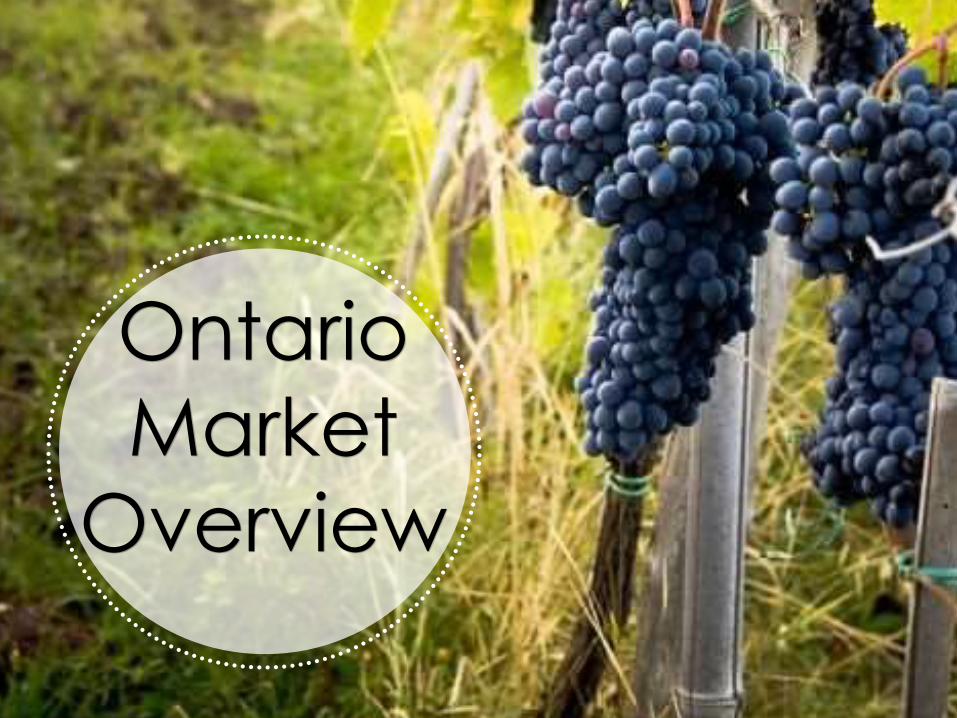
Ontario
Market
Overview
R13 P11
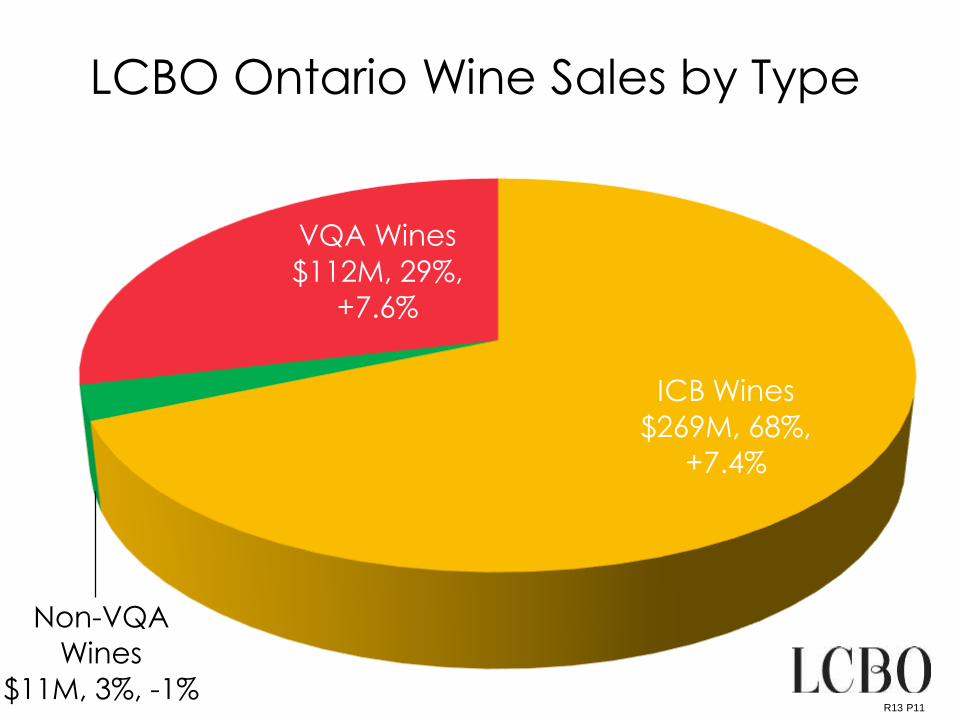
LCBO Ontario Wine Sales by Type
ICB Wines
$269M, 68%,
+7.4%
Non-VQA
Wines
$11M, 3%, -1%
VQA Wines
$112M, 29%,
+7.6%
R13 P11
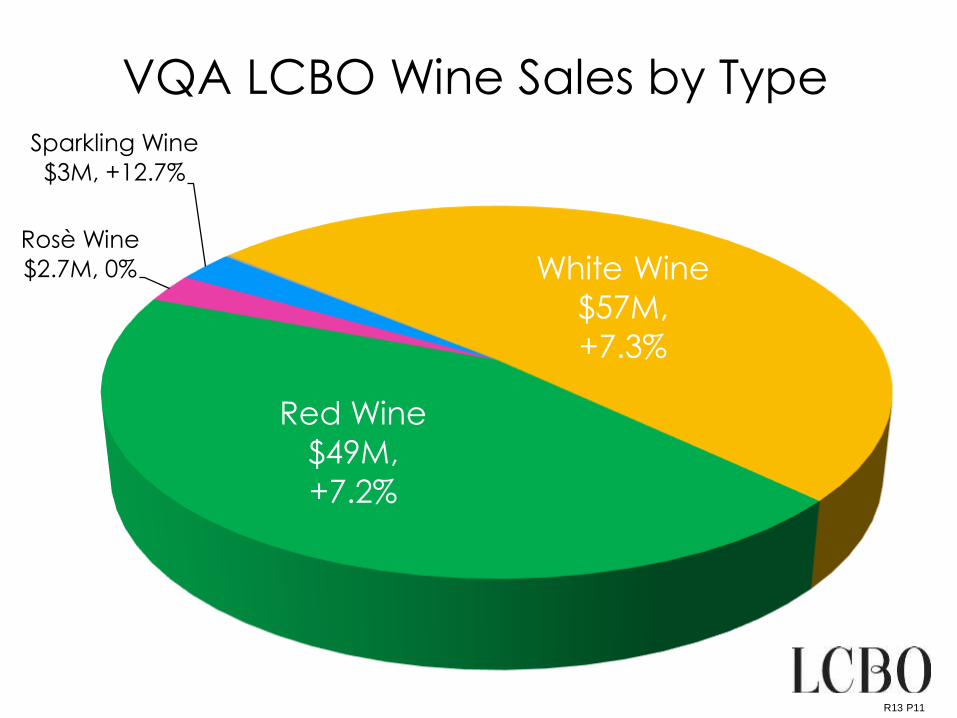
VQA LCBO Wine Sales by Type
White Wine
$57M,
+7.3%
Red Wine
$49M,
+7.2%
Rosè Wine
$2.7M, 0%
Sparkling Wine
$3M, +12.7%

R13 P11
Icewine
$6.2M, 27%,
+3.4%
VINTAGES VQA
Red
$7.2M, 31%,
+2.9%
VINTAGES VQA
White
$7.3M, 32%,
-3.5%
VINTAGES VQA
Rosè
$1.5M, 7%,
+10.5%
VINTAGES VQA
Sparkling
$0.7M, 3%,
+9.9%
VQA VINTAGES Wine Sales by Type

VQA Wines Category Growth
R13 P11
$0
$20
$40
$60
$80
$100
$120
2010/2011 2011/2012 2012/2013 2013/2014 2014/2015 2015/2016
(F)
2016/2017
(P)
+17.3%
+14.4% +9.8% +4.9%+0.6%
+4.4%+3.8%
Mill
ion
s
+7.5%

ICB Wines Category Growth
R13 P11
$0
$50
$100
$150
$200
$250
$300
2010/2011 2011/2012 2012/2013 2013/2014 2014/2015 2015/2016
(F)
2016/2017
(P)
+0.5%+3.2%
+3.5%+6.9%
+6.4%+6.3%
+5.6%
Mill
ion
s
+7.7%
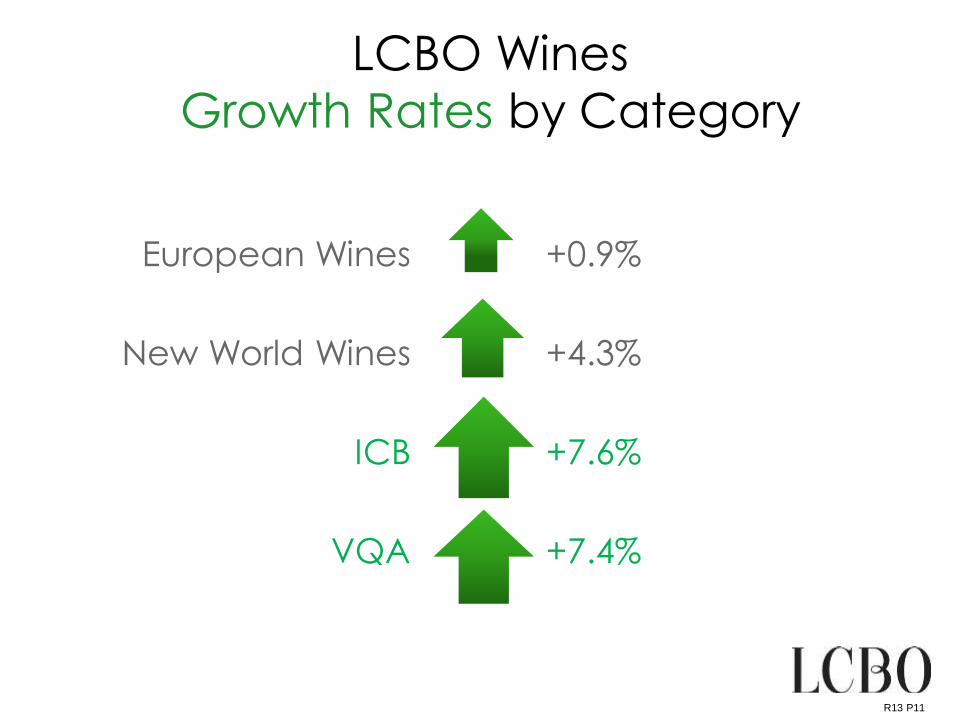
European Wines
New World Wines
ICB
VQA
LCBO Wines
Growth Rates by Category
+0.9%
+4.3%
+7.6%
+7.4%
R13 P11

LCBO Wines Sales Trends by Type
Rosé
White
Red
R13 P11
-5% 0% 5% 10% 15% 20%
VQA
Imported
ICB

VINTAGES Wines Sales Trends by Type
Rosé
Red
White
0% 5% 10% 15% 20% 25% 30%
VQA
Imported
R13 P11
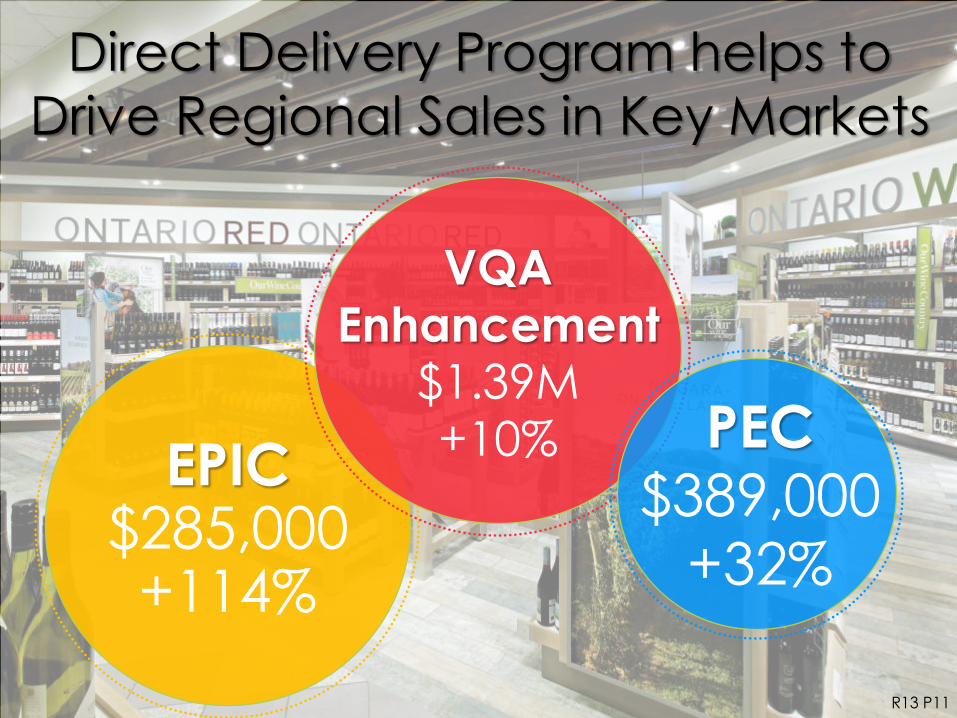
Direct Delivery Program helps to
Drive Regional Sales in Key Markets
EPIC$285,000+114%
VQA Enhancement
$1.39M+10% PEC
$389,000+32%
R13 P11

OWC Boutique VQA Sales
Total OWC Boutiques
+6.4%
Total
LCBO
+5.8%
R13 P11

+7.7%
ICB
+7.5%
VQA WINES
+7.4%
VQA
VINTAGES
Ontario Wines are Expected to Finish 2015-16 +$31M
TOTAL ONTARIO WINES NET SALES $430M,+7.6%

+5.6%
ICB
+2.2%
NON-VQA
+3.0%+3.8%
VQA WINESVQA
VINTAGES
2016-17 Sales OutlookVQA is Poised for Continued Growth!
TOTAL ONTARIO WINES NET SALES $449.8M, +4.8%

Price
Bands
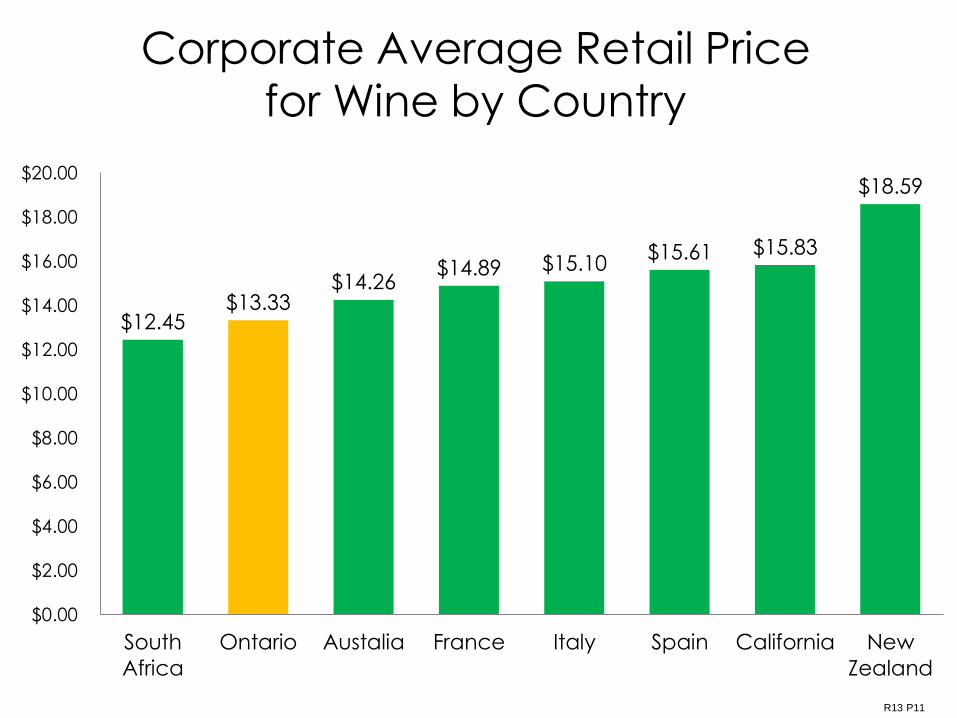
Corporate Average Retail Price for Wine by Country
R13 P11
$12.45 $13.33
$14.26 $14.89 $15.10
$15.61 $15.83
$18.59
$0.00
$2.00
$4.00
$6.00
$8.00
$10.00
$12.00
$14.00
$16.00
$18.00
$20.00
South
Africa
Ontario Austalia France Italy Spain California New
Zealand
R13 P11
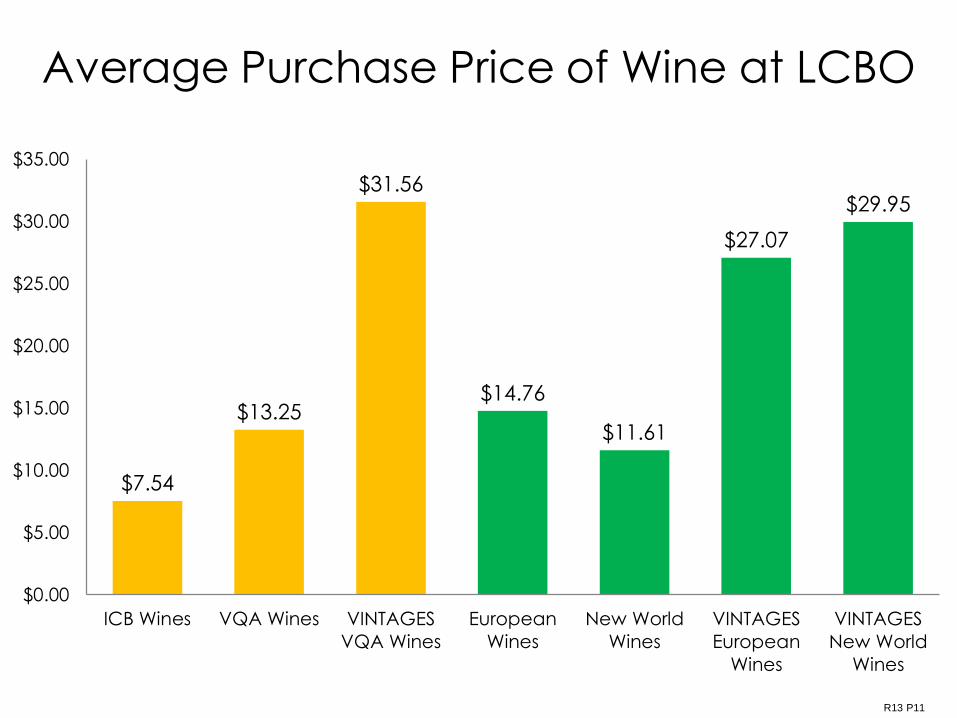
Average Purchase Price of Wine at LCBO
$7.54
$13.25
$31.56
$14.76
$11.61
$27.07
$29.95
$0.00
$5.00
$10.00
$15.00
$20.00
$25.00
$30.00
$35.00
ICB Wines VQA Wines VINTAGES
VQA Wines
European
Wines
New World
Wines
VINTAGES
European
Wines
VINTAGES
New World
Wines
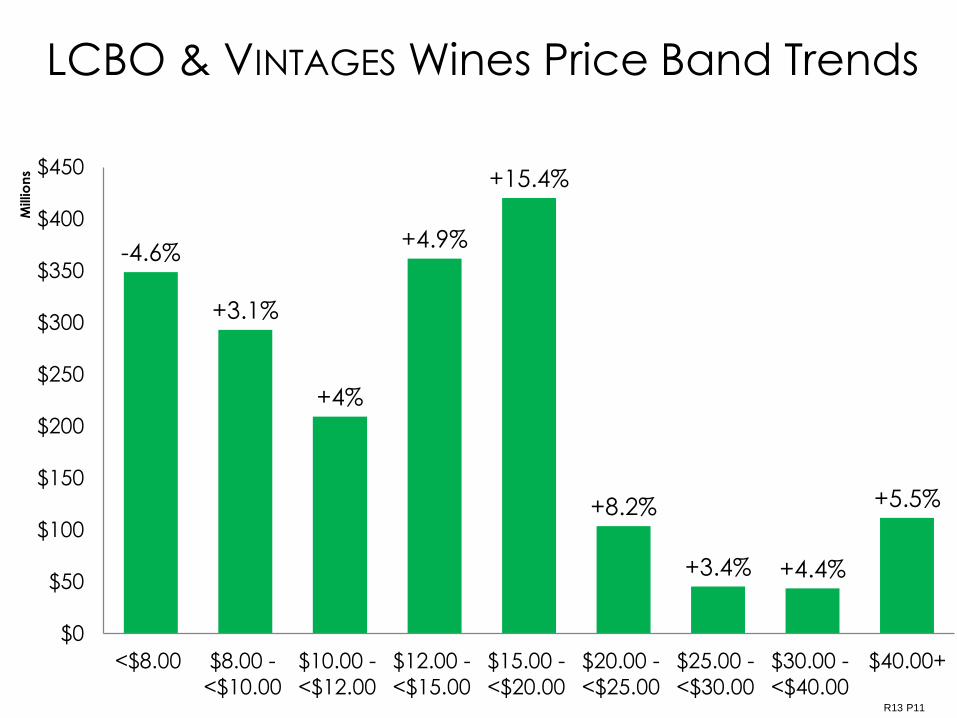
LCBO & VINTAGES Wines Price Band Trends
R13 P11
-4.6%
+3.1%
+4%
+4.9%
+15.4%
+8.2%
+3.4% +4.4%
+5.5%
$0
$50
$100
$150
$200
$250
$300
$350
$400
$450
<$8.00 $8.00 -
<$10.00
$10.00 -
<$12.00
$12.00 -
<$15.00
$15.00 -
<$20.00
$20.00 -
<$25.00
$25.00 -
<$30.00
$30.00 -
<$40.00
$40.00+
Mill
ion
s
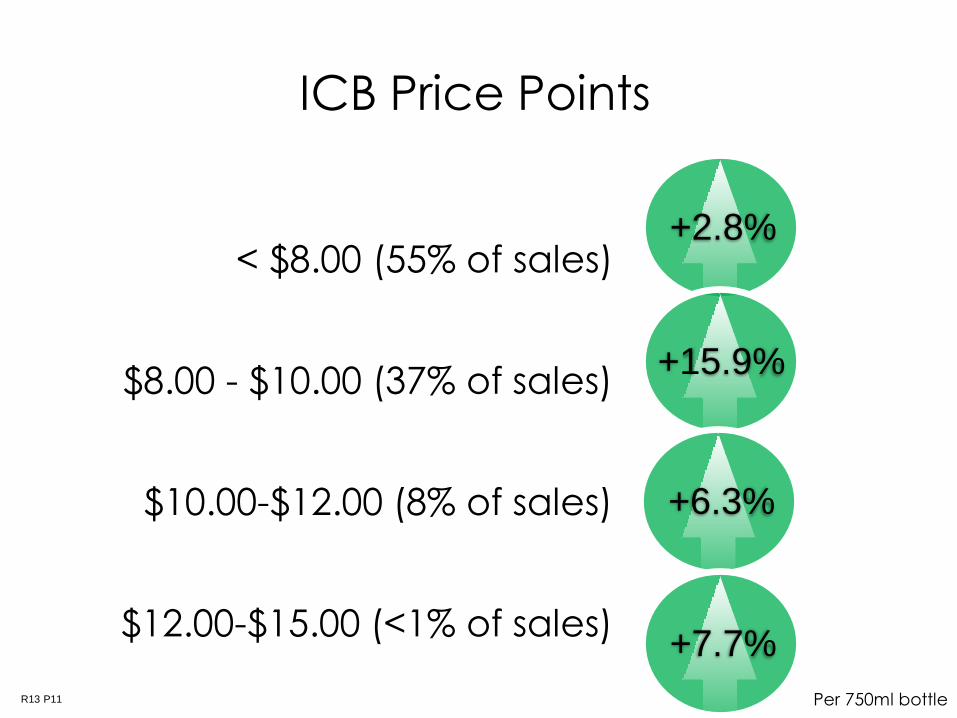
ICB Price Points
< $8.00 (55% of sales)
$8.00 - $10.00 (37% of sales)
$10.00-$12.00 (8% of sales)
$12.00-$15.00 (<1% of sales)
Per 750ml bottle
+2.8%
+15.9%
+6.3%
+7.7%
R13 P11

LCBO VQA Price Points
$8.00-$10.00 (5% of sales)
$10.00-$12.00 (18% of sales)
$12.00-$15.00 (65% of sales)
$15.00-$18.00 (10% of sales)
$18.00-$20.00 (2% of sales)Per 750ml bottle
+13.7%
+15.4%
+16.1%
+3.4%
-8.0%
R13 P11

VINTAGES VQA Price Points
< $18.00 (28.9% of sales)
$18.00-$20.00 (21.3% of sales)
$20.00-$25.00 (13% of sales)
$25.00-$30.00 (3% of sales)
+ $30.00 (34% of sales)Per 750ml bottle
+4.4%
+17%
+1.5%
+12.8%
-8.5%
R13 P11

Trends &
Insights

Red
$56M, 42%
White
$70M, 52%
Rosé
$4.3M, 3%
Sparkling
$3.4M, 3%
The Ontario Customer’s Preferences
R13 P11
+1% Share
-2% Share

Customer VQA Favourites!
Chardonnay
+5.3%
$14M
Pinot Noir
+7%
$7M
Baco Noir
+15%
$7.3M
Riesling
+3.5%
$18M
R13 P11

Shopping for “My Wine”
Know where it is in the store, like the
taste, no surprises
Plan to buy some of their intended
wine here but usually not all of it The Wine
Shopping
Experience
EYE-TRACKING SHOPALONGS

Exploring Other Wines Close By
Within the same country section will briefly
look for additional wines
Influenced by price, our customer loyalty
program, or other feature tags but must
be similar to the type of wine they
usually buyThe Wine
Shopping
Experience
EYE-TRACKING SHOPALONGS

Exploring New Wine
Outside of their “My Wine” section, many
wanted to explore new wines that they
had read about, seen at a restaurant or
had recommended to them by friends
The label style, the section and the
promotional suggestions were helpful
here
The Wine
Shopping
Experience
EYE-TRACKING SHOPALONGS

The Wine
Shopping
Experience
Exploring New Wine
Many preferred to do this exploration in
Vintages because there was more
information available
Many lacked confidence in exploring
new wine regions as it was
expensive and they had made
mistakes in the past
EYE-TRACKING SHOPALONGS

Diversity Health & Wellness
Five Game-Changing Trends
Premiumization Fragmentation Flavours
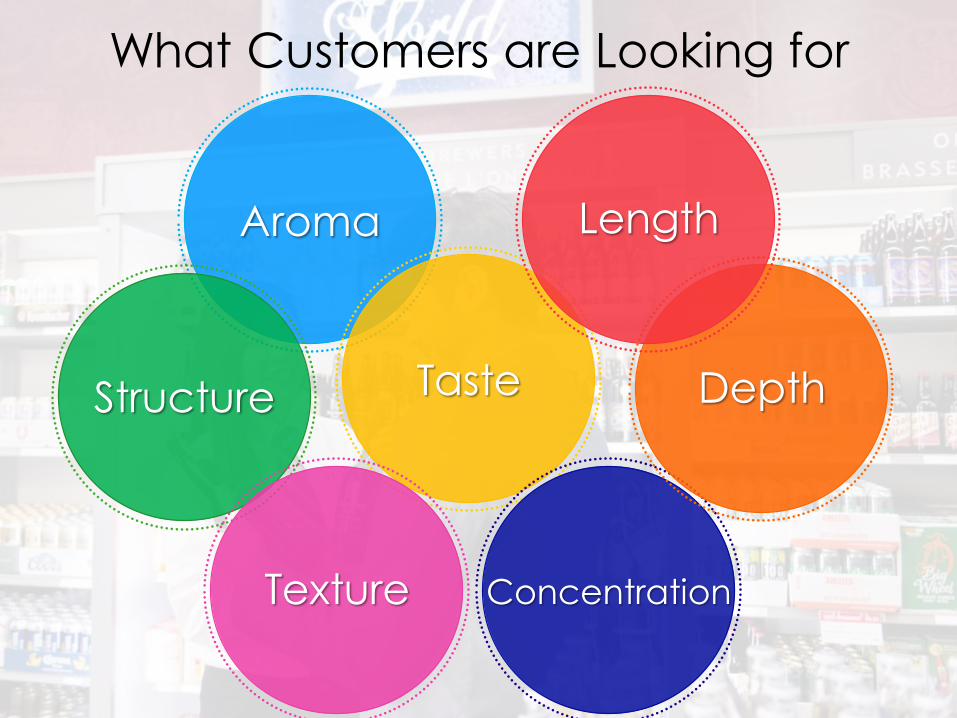
Aroma
TasteStructure
What Customers are Looking for
Texture Concentration
Depth
Length
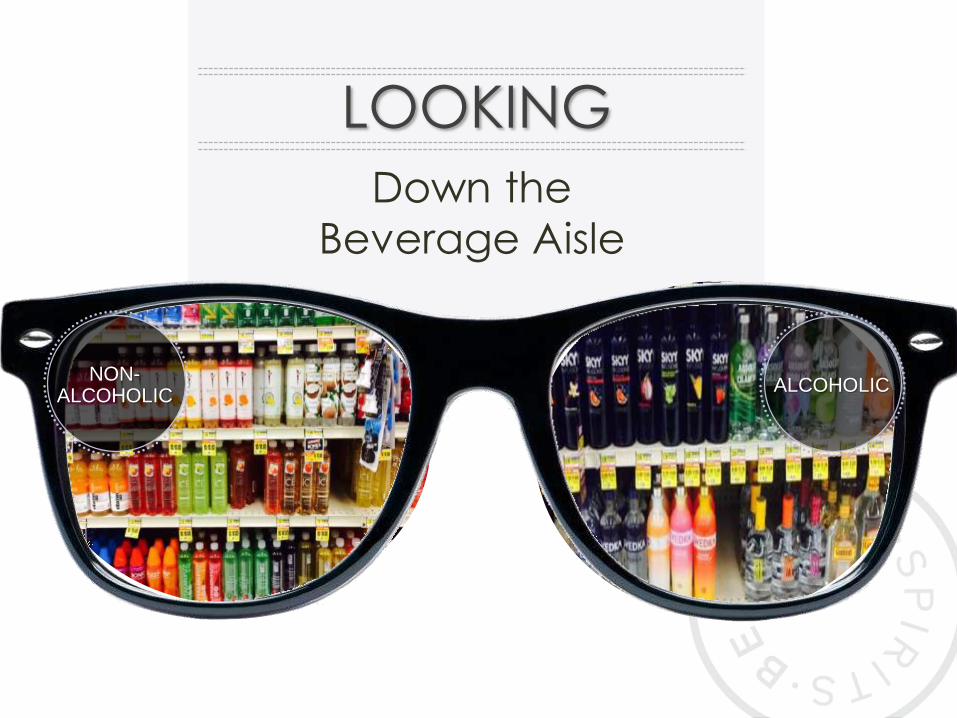
LOOKING
Down the
Beverage Aisle
NON-ALCOHOLIC
ALCOHOLIC
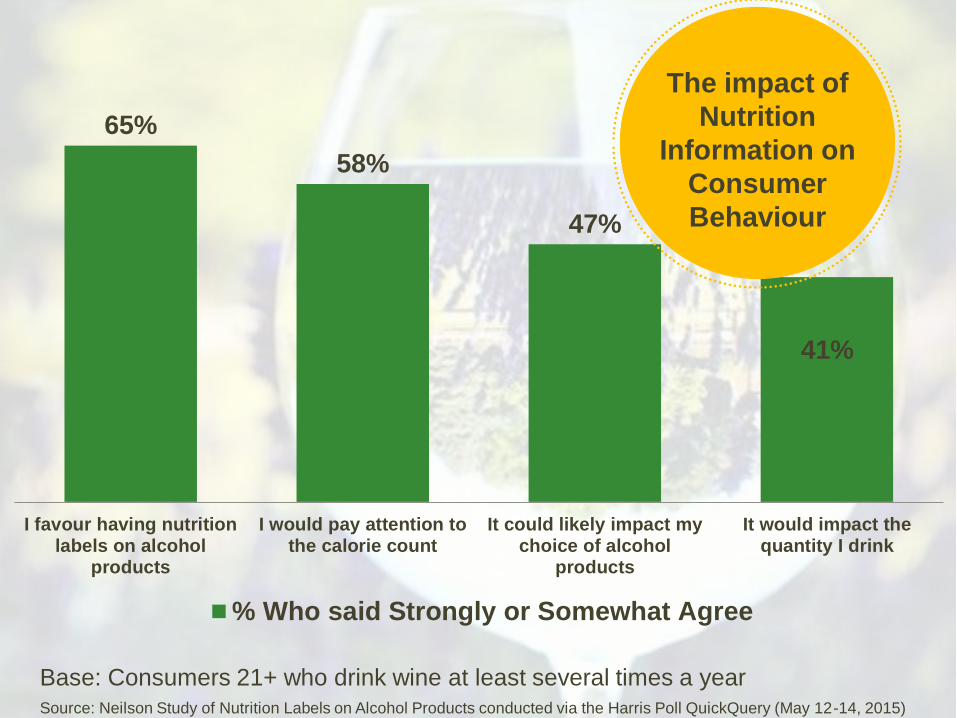
65%
58%
47%
41%
I favour having nutritionlabels on alcohol
products
I would pay attention tothe calorie count
It could likely impact mychoice of alcohol
products
It would impact thequantity I drink
% Who said Strongly or Somewhat Agree
Source: Neilson Study of Nutrition Labels on Alcohol Products conducted via the Harris Poll QuickQuery (May 12-14, 2015)
The impact of
Nutrition
Information on
Consumer
Behaviour
Base: Consumers 21+ who drink wine at least several times a year

13.4%
5.6% 6.2%
26.6%
18.5%
15.0%
Beer Wine Spirits
Percentage of Category Volume Percentage of Category Items
Fragmentation will
continue as “new”
continues to explode
concurrent with
(younger) consumer
interest in
exploration
~3,600
new items
~4,600
new items
~2,200
new items
Source: Neilson

Age Matters– Particularly for Wine & Beer“Approximately how many different brands have you purchased in the last year?”

The “High End” leads the way in Growth
Average Price Change
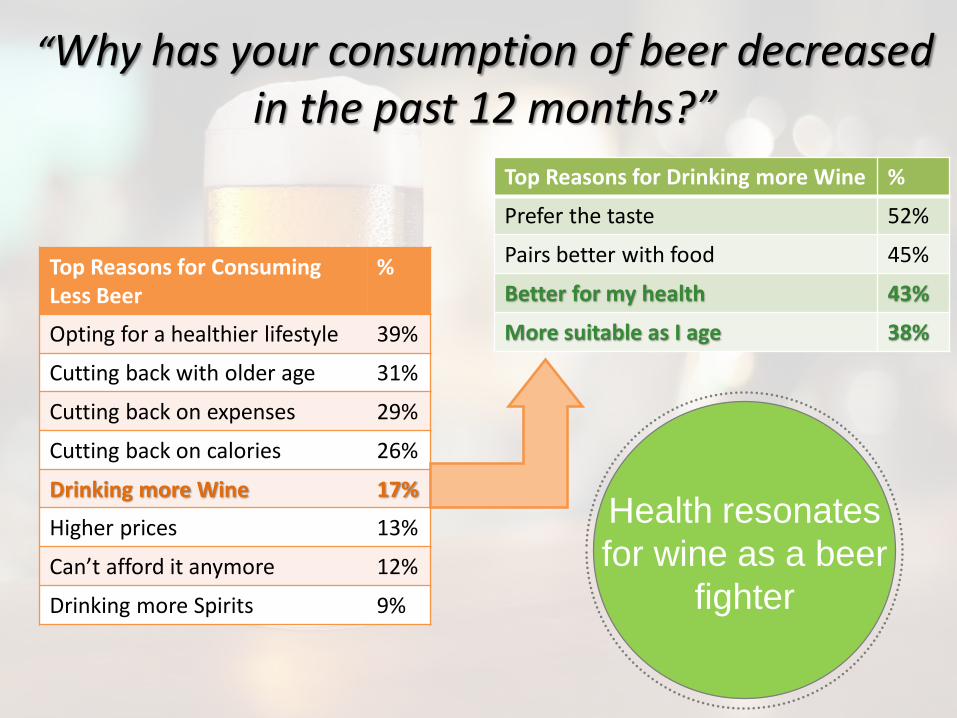
“Why has your consumption of beer decreased in the past 12 months?”
Top Reasons for Consuming Less Beer
%
Opting for a healthier lifestyle 39%
Cutting back with older age 31%
Cutting back on expenses 29%
Cutting back on calories 26%
Drinking more Wine 17%
Higher prices 13%
Can’t afford it anymore 12%
Drinking more Spirits 9%
Top Reasons for Drinking more Wine %
Prefer the taste 52%
Pairs better with food 45%
Better for my health 43%
More suitable as I age 38%
Health resonates
for wine as a beer
fighter
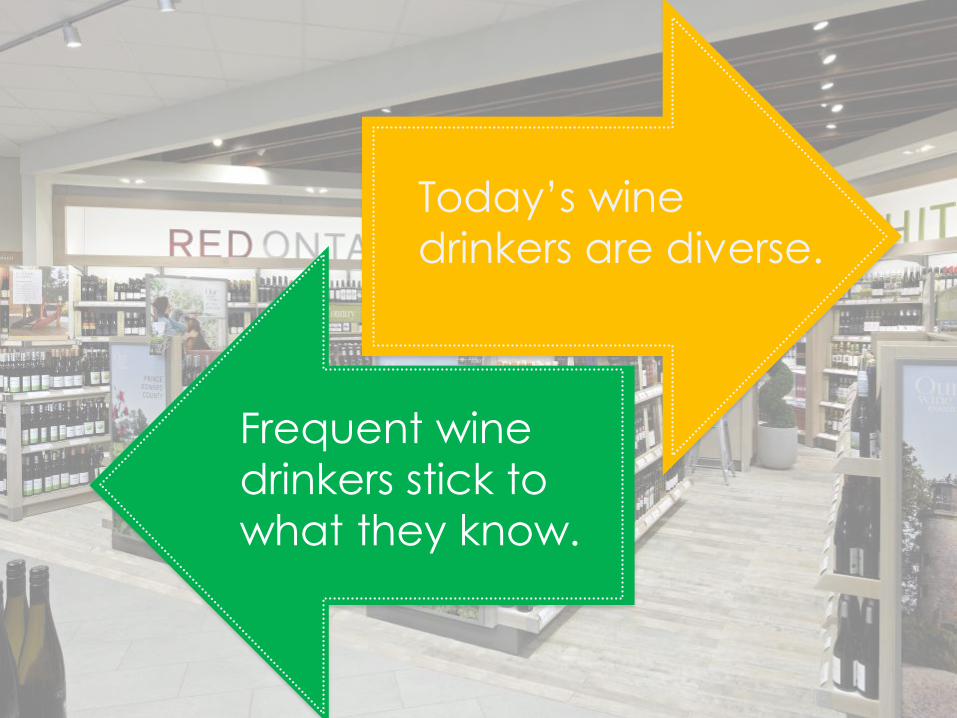
Today’s wine
drinkers are diverse.
Frequent wine
drinkers stick to
what they know.
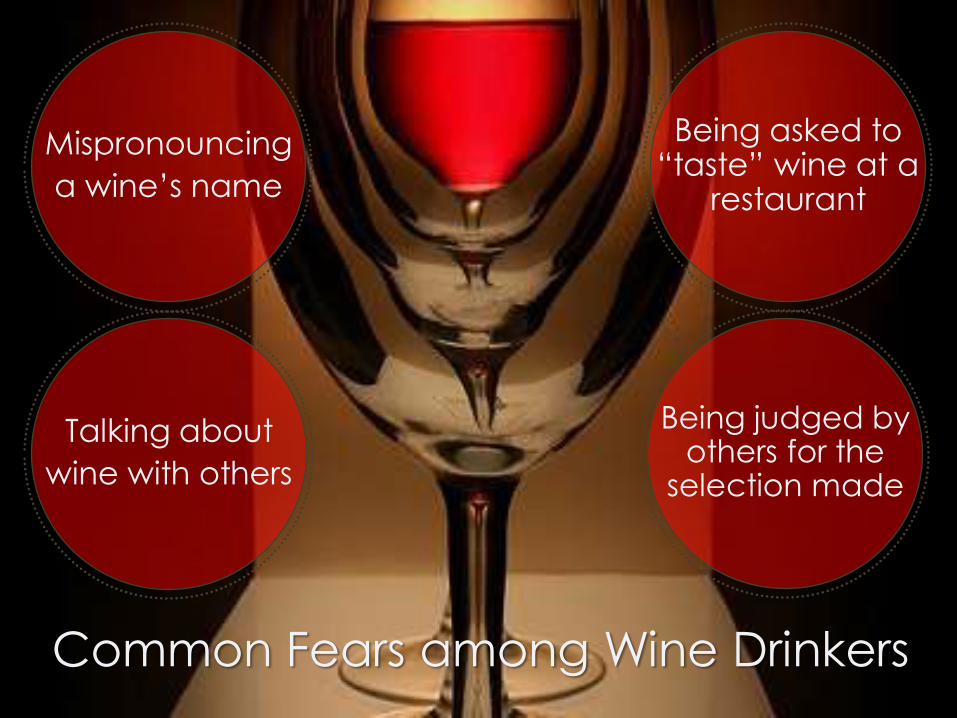
Common Fears among Wine Drinkers
Mispronouncing
a wine’s name
Being asked to “taste” wine at a
restaurant
Being judged by others for the
selection made
Talking about
wine with others

Ban Baffling Wine Language
Source: 14 Dec 2015, By Matthew Lyons, Harpers UK
Between 10-20% use “quaffable,
tart, nose, or bouquet” to
describe wine
Less than 5% of people use
“vegetal, hollow, herbaceous,
unctuous, terroir,
or legs” to describe wine
Primary reasons for
reluctance to
experiment with wine:
Lack of Inspiring
Products &
Knowledge of How it
Tastes

Wine Drinkers use of Beer & Spirits
Wine Only
19%
Wine &
Spirits
19%
Wine & Beer
20%
Wine &
Spirits & Beer
42%
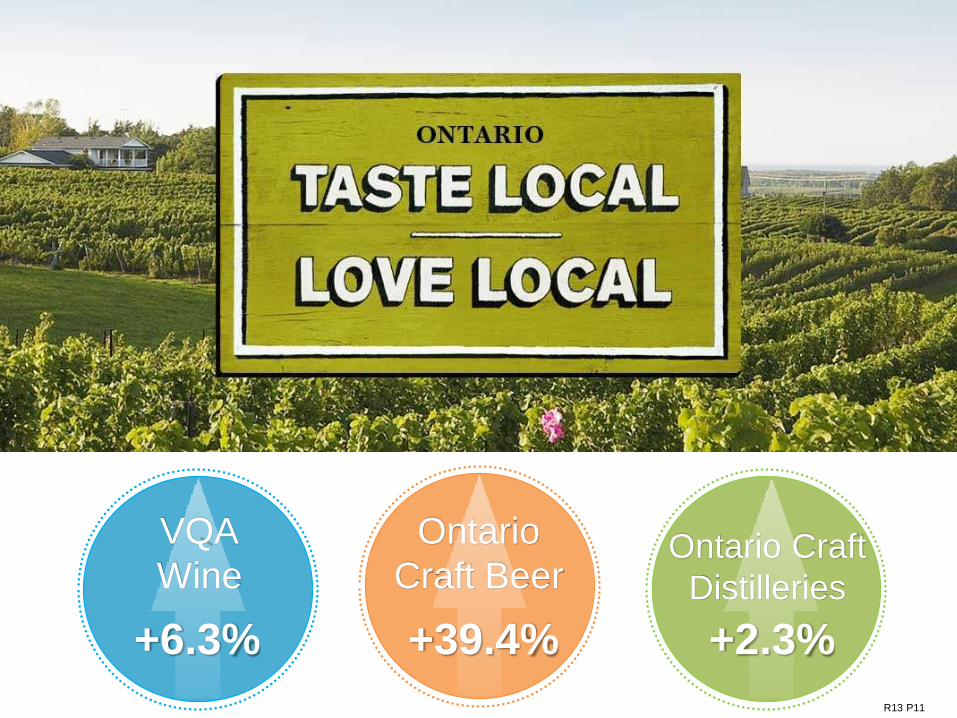
Ontario Craft
Distilleries
VQA
Wine
Ontario
Craft Beer
+2.3%+6.3% +39.4%
R13 P11
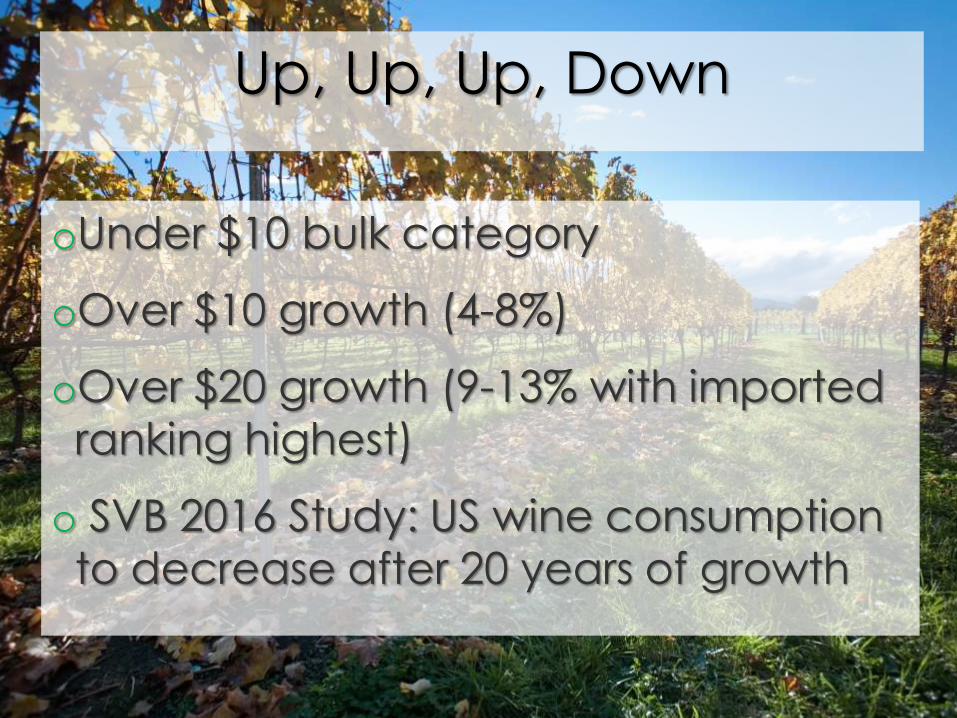
oUnder $10 bulk category
oOver $10 growth (4-8%)
oOver $20 growth (9-13% with imported ranking highest)
o SVB 2016 Study: US wine consumption to decrease after 20 years of growth
Up, Up, Up, Down
Aging: Colour Matters

Closures Matter

Demographics
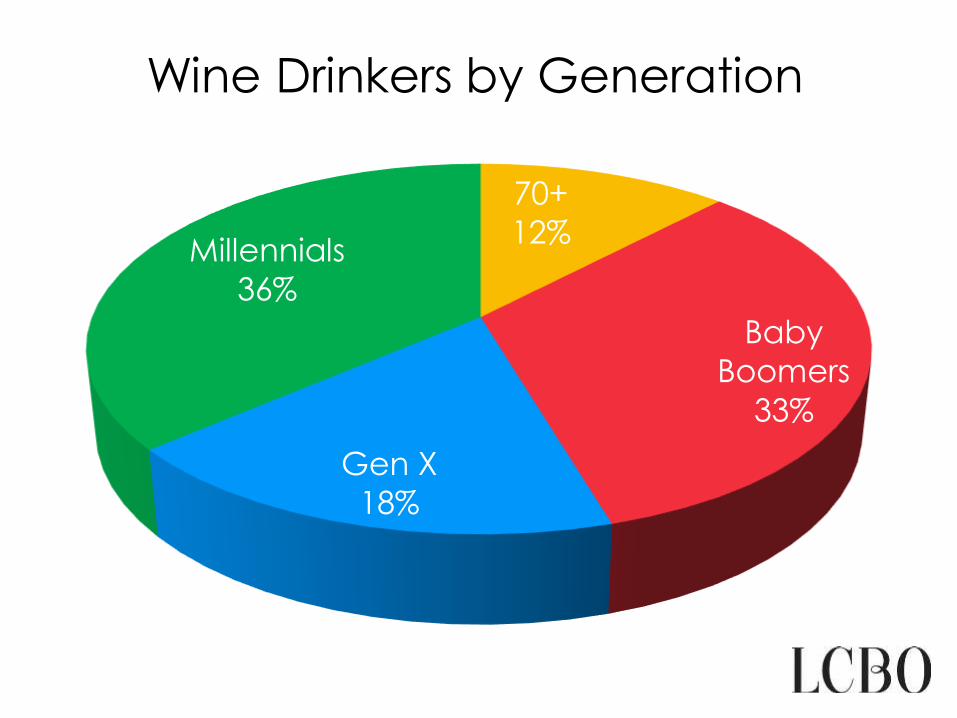
70+
12%
Baby
Boomers
33%
Gen X
18%
Millennials
36%
Wine Drinkers by Generation

Millennials
versus Baby
Boomers

Rosé
Any Day

Men versus
Women

The increase in time spent
with digital media in the US
between 2013 and 2015
49%
Source: Trend Watching Premium Trend Report 2016
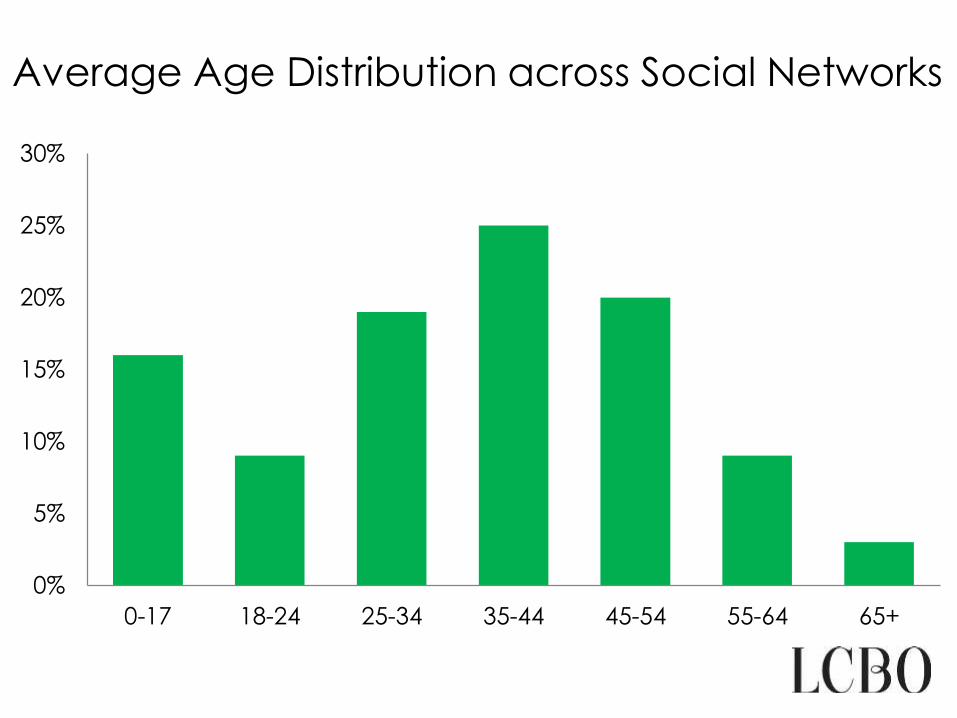
0%
5%
10%
15%
20%
25%
30%
0-17 18-24 25-34 35-44 45-54 55-64 65+
Average Age Distribution across Social Networks

In the US, reservations for solo
diners have grown by 62% in
the past two years, making
dining solo the fastest growing
table party size
62%
Source: Trend Watching Premium Trend Report 2016

WHAT
WENEED
FROM
YOU
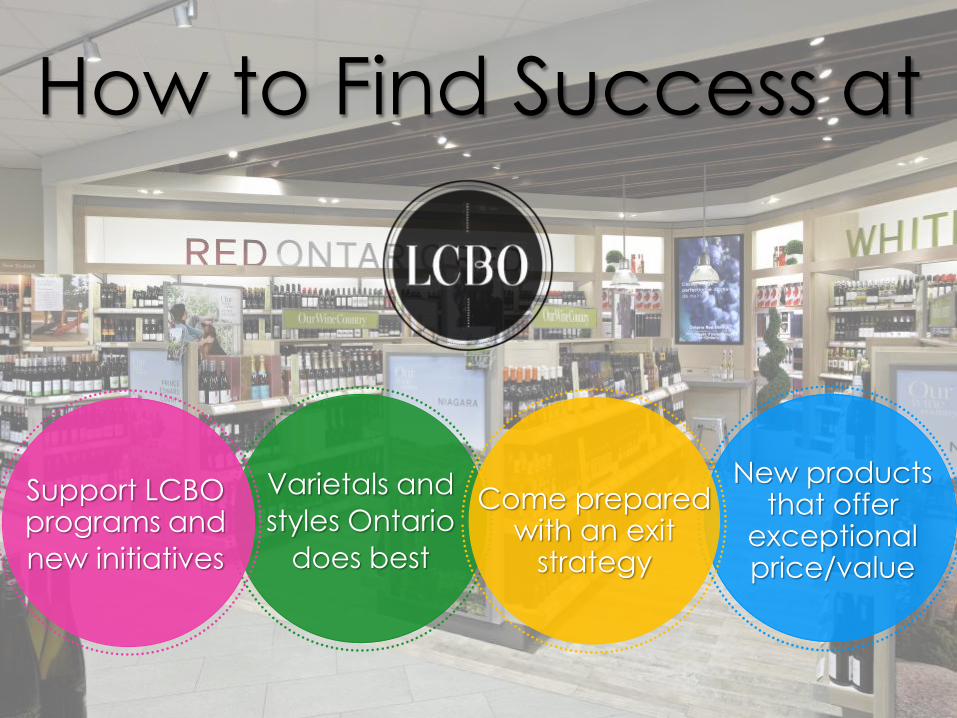
Varietals and
styles Ontario
does best
Support LCBO programs and
new initiatives
New products that offer
exceptional price/value
Come prepared with an exit
strategy
How to Find Success at

Ripe, round
Ontario Reds!
Continue to grow share in
premium price bands
Increased opportunities
for smaller production
wines
Opportunities for Great VQA Wines
321
Top 3 Things to Remember
VQA GROWTH
is an LCBO priority!
ENGAGE CUSTOMERS
through an
enhanced
in-store customer
experience!
OPPORTUNITIES
for quality wines in
LCBO and VINTAGES
that over deliver!

Target
&
Engage
Persistence &
Relevance
It’s a hard market-
don’t give up!
Smart Phone
Smarts
Strategies that Work

“Price is what you pay,
value is what you get.”-Warren Buffet
Source: Trend Watching Premium Trend Report 2016

Thank you!