wine intelligence compass...
TRANSCRIPT

1© Wine Intelligence 2014
Wine Intelligence Compass 2015
Strategic planning tools for selling in the global wine market
Report Brochure
REPORT PRICE • GBP 1,000 • 2 Report Credits

2
Introduction
Executive summary
Market attractiveness: Top 50 global wine markets
Market classification: Understanding categories of attractiveness
Selected market profiles
Relevance for your business: Customized analysis
References: Example measures used to calculate attractiveness
Appendix
3
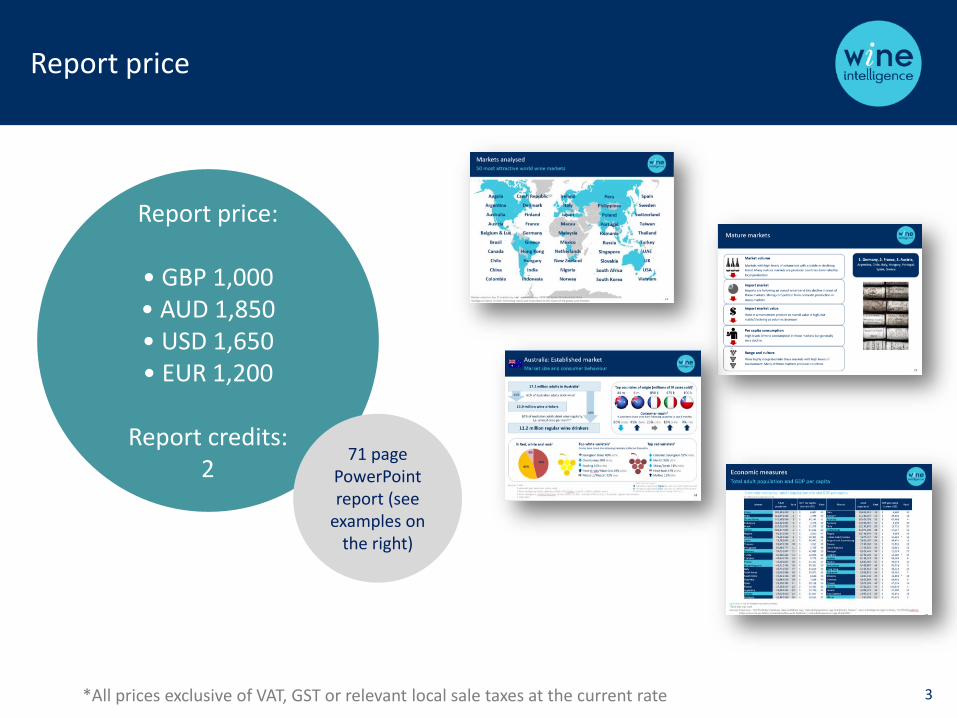
Report price
Report price:
• GBP 1,000 • AUD 1,850• USD 1,650 • EUR 1,200
Report credits: 2
*All prices exclusive of VAT, GST or relevant local sale taxes at the current rate
71 page PowerPoint report (see
examples on the right)

4
At Wine Intelligence our mission is to help wine businesses around the world to make more informed decisions, supported by our consumer and supply chain insight. Over the past decade global trade in wine has increased, and new markets have emerged. In light of this more complex, globalised industry, nowadays a lot of our discussions go beyond which label to use, what consumer group to target and how. They often extend to which market to invest in, what product to offer in each one and how to tackle the supply chain.
With these challenges in mind, we have developed a set of strategic planning tools to help all organisations connected with the wine category – companies, trade associations and governments – understand the opportunities and challenges inherent in key world wine markets. Underpinning this report is a proprietary model which builds on a comprehensive set of economic and wine measures to assess wine markets attractiveness. We then rank the globally most interesting markets and group them into distinctive categories based on their characteristics to be able to better explain them. We lay out a cohesive global picture of wine markets to allow business leaders to compare and contrast the opportunities in 50 of the world’s most important wine markets.
Introduction

5
Introduction
Last year we published the findings from our first market model in Wine Intelligence Compass 2013. Since then we have revised and honed the model to incorporate more sophisticated measures. Using this new model as a base, we have developed a new, expanded version of the report, including updates with the most recent data on countries’ economic and wine performance, tracked changes from last year and explanations of how some markets have become more or less attractive, and some have changed characteristics. We have revised the list of our 50 most attractive wine markets as well, to reflect the current reality.
In addition, this year we are publishing our attractiveness scores for all markets and demonstrate how wine markets are driven by general economic as well as wine performance. We have included some raw data into the report to support these results. In response to client requests we have added more individual market profiles, and in that section supplemented the generic wine measures with consumer reported data from our Vinitrac Global omnibus consumer survey. You can now learn not only how many consumers drink wine in each market, but also what they drink in terms of wine colour, country of origin and varietals. If the profile of a market you are interested in is not included, contact us for more details.
6
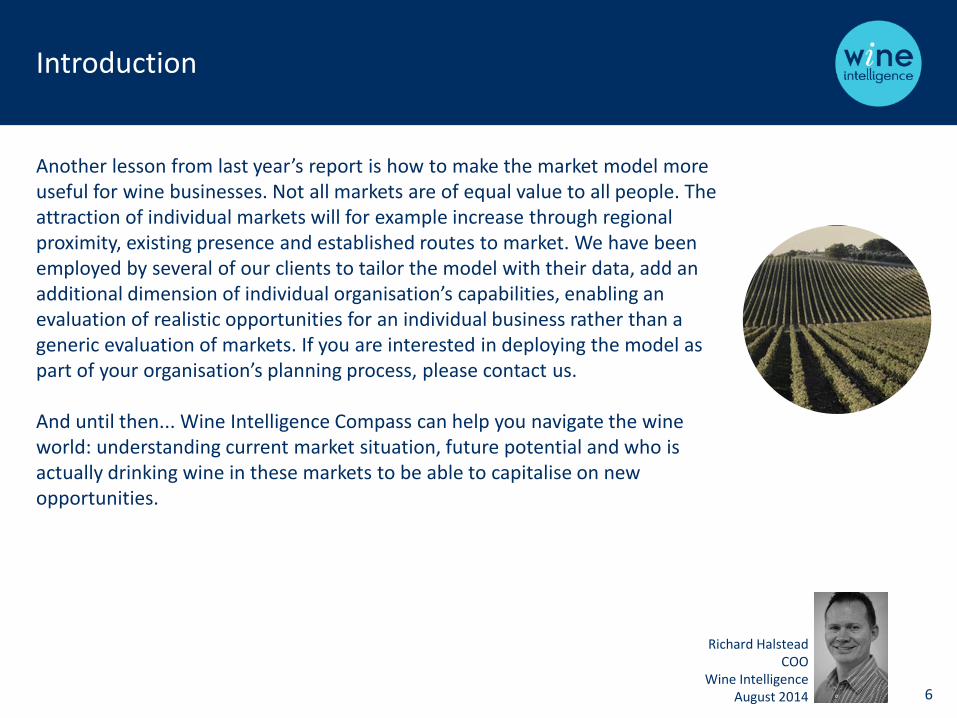
Another lesson from last year’s report is how to make the market model more useful for wine businesses. Not all markets are of equal value to all people. The attraction of individual markets will for example increase through regional proximity, existing presence and established routes to market. We have been employed by several of our clients to tailor the model with their data, add an additional dimension of individual organisation’s capabilities, enabling an evaluation of realistic opportunities for an individual business rather than a generic evaluation of markets. If you are interested in deploying the model as part of your organisation’s planning process, please contact us.
And until then... Wine Intelligence Compass can help you navigate the wine world: understanding current market situation, future potential and who is actually drinking wine in these markets to be able to capitalise on new opportunities.
Introduction
Richard HalsteadCOO
Wine Intelligence August 2014

7
Market type
Markets with strong
historical growth
which is tailing off
Markets
Switzerland (2)
*Australia (6)
*United Kingdom (10)
*Netherlands (11)
Belgium and
Luxembourg (18)
Denmark (19)
New Zealand (21)
Ireland (30)
Finland (33)
Romania (40)
South Africa (47)
Market type
Markets where wine
is becoming a
mainstream product
and experiencing
growth
Markets
*United States (1)
Canada (4)
*Japan (7)
Norway (9)
Sweden (13)
Market type
Markets where wine
is experiencing rapid
growth from a
relatively low base
Markets
*China (5)
Macau (8)
Singapore (12)
Russia (14)
South Korea (16)
Hong Kong (17)
Brazil (22)
*Poland (23)
Czech Republic (24)
*Mexico (25)
Taiwan (34)
Slovakia (43)
Market type
Markets where wine
is still a relatively new
and unknown
beverage, but
showing potential
Markets
UAE (26)
Malaysia (28)
Thailand (32)
Turkey (35)
Indonesia (36)
Philippines (37)
*India (38)
Vietnam (43)
Colombia (45)
Peru (45)
Angola (49)
*Nigeria (50)
New EmergingHigh Growth
EmergingGrowthEstablished
Major Result:Global Wine Market classification
Mature
Market type
Markets where wine
has reached its
potential with stable
or declining volumes
Markets
*Germany (3)
France (15)
Austria (20)
Argentina (27)
Chile (29)
Italy (31)
Hungary (39)
Portugal (40)
Spain (42)
Greece (48)
(#) = market ranking in top 50
* Markets profiled in the report

8
Wine Intelligence global markets classification is based on a combination of
Quantitative data measuring market attractiveness and
Wine intelligence qualitative judgements based on industry knowledge and experience
Firstly we collected data on a number of variables combining economic and wine market measures to assess market attractiveness
For each measure countries were given a score from 1-10 based on their performance
Each measure was assigned a weighting based on its importance
To test the reliability of the model a factor analysis was run on the measures using a Cronbach’s Alpha test resulting in a score of 0.70 suggesting an acceptable level of association
This combined factor was used to classify the markets into groups (along with detailed market information) and rank the potential of the markets within each classification group
Research Methodology:Overview

9
Quantitative data for market attractiveness was collected on several measures to classify the wine markets
The data originated from 2 main groups:
Economic measures: Used to asses the stability and future potential of the market as a whole
Wine market measures: Used to identify the current and future potential for wine in the market
Data was collected from both secondary and primary Wine Intelligence sources. Wherever possible a single source was used for each measure with a second source only utilised in the absence of data
Research Methodology:Quantitative data

10
The following economic measures were used; sources noted in the parenthesises: Adult population size (World Bank / CIA Factbook)
GDP per capita (World Bank / CIA Factbook)
GDP per capita trend 5yrs (World Bank / CIA Factbook)
GDP per capita trend 10yrs (World Bank / CIA Factbook)
National income (World Bank)
Purchasing power parity (World Bank)
Corruption (Transparency International)
Unemployment (World Bank / CIA Factbook)
Starbucks – measure of globalisation (The Economist / Loxcel Geomatics)
Research Methodology:Economic measures

11
The following wine market measures were used; sources noted in the parenthesises: Market volume (IWSR)
Market volume trend 5yrs (IWSR)
Imported wine volume (IWSR)
Imported wine volume trend 5yrs (IWSR)
Imported wine volume trend 2yrs (IWSR)
Per capita consumption (IWSR)
Per capita consumption trend 5yrs (IWSR)
Market value (UN Comtrade Database)
Market value trend 5yrs (UN Comtrade Database)
Market value trend 2yrs (UN Comtrade Database)
Average unit price (UN Comtrade Database)
Wine drinking population (Wine Intelligence calibration studies)
Growth potential (Wine Intelligence calibration studies)
Market accessibility (Qualitative judgements based on market experience)
Research Methodology:Wine market measures

12
Additional Wine Intelligence data and the knowledge accumulated over the years was used to support the classification of the markets into groups
Calibrations studies determining the percentage of total and regular wine drinkers within each market
Wine Intelligence Vinitrac® studies: Quantitative studies now running in over 25 countries across the globe enabling us to have collected the views of more than 80,000 respondents about wine over the past year
Focus groups, accompanied shopping and consumer interviews in various markets which bring an in-depth understanding of wine consumer attitudes and behaviours
Trade interviews offering insights directly from individual markets about the current status and future opportunities of the wine industry
Secondary sources
Research Methodology:Qualitative judgements

13
Market profile data for this report was gathered via Wine Intelligence’s Vinitrac® online surveys from 2011-2014
Vinitrac® samples are quota-based to be fully representative of the wine drinking population in each country and have typically 1,000 respondents per market (2,000 respondents in the USA)
Representative sample quotas are established using regular calibration studies in each market
The wine drinking population in each market is consumers who drink red, white or rosé wine at least once per month (regular wine drinkers), with the exception of China, where we survey drinkers of imported wine who are urban upper/middle class residents. For Mexico we choose selected cities and the base is imported wine drinkers.
Data processing:
Invalid responses (those who completed the survey too quickly, or who “straight-lined” through selected questions) were removed from the sample
Research Methodology:Vinitrac®

14
WHY IS VINITRAC® NOT A PANEL?
Invitations to participate in Vinitrac® are distributed to adult consumers in each market Consumers interested in a wine survey are directed to an URL address, which welcomes them to the
online survey Wine Intelligence monitors incoming completed responses to build a sample representative of the
wine drinking population of the target market When a representative sample of at least 1,000 (US: 2,000) is logged, the survey is closed
Panels are good for monitoring detailed purchase activity but require regular input from exactly the same complete group of respondents
This requires more time from respondents, for which they are paid, and panels are therefore more heavily skewed towards home-based consumers, e.g. students and home-makers
This group of a country’s wine-drinking population does not fully represent the accurate weighted sample of adult regular wine drinkers on which Vinitrac® insights are based
HOW DOES VINITRAC® WORK?
Research Methodology:Vinitrac® frequently asked questions
15
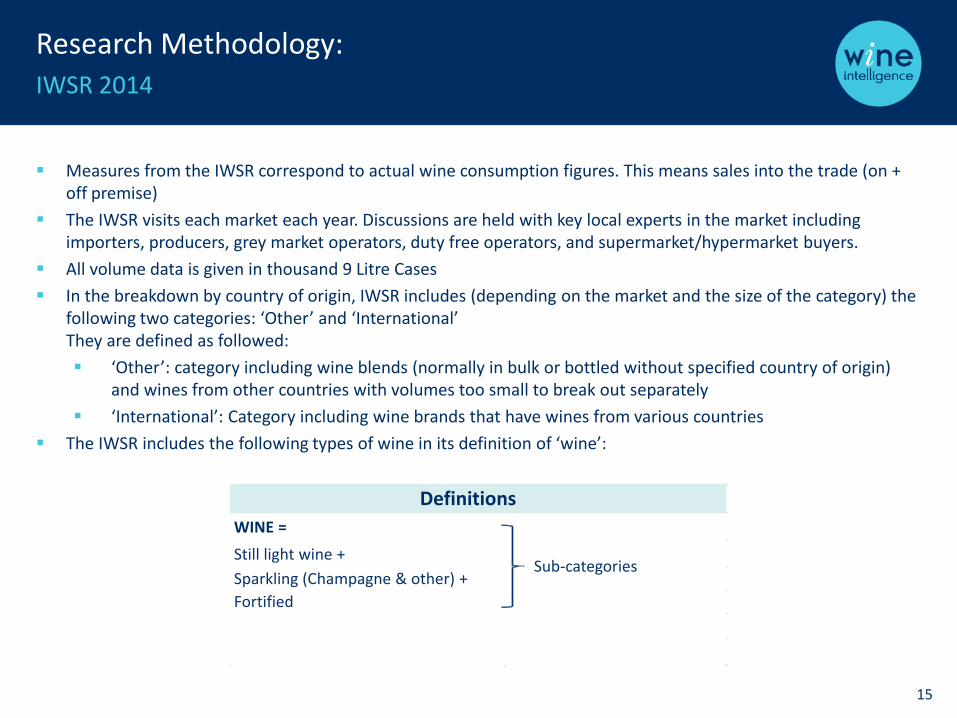
Measures from the IWSR correspond to actual wine consumption figures. This means sales into the trade (on + off premise)
The IWSR visits each market each year. Discussions are held with key local experts in the market including importers, producers, grey market operators, duty free operators, and supermarket/hypermarket buyers.
All volume data is given in thousand 9 Litre Cases
In the breakdown by country of origin, IWSR includes (depending on the market and the size of the category) the following two categories: ‘Other’ and ‘International’They are defined as followed:
‘Other’: category including wine blends (normally in bulk or bottled without specified country of origin) and wines from other countries with volumes too small to break out separately
‘International’: Category including wine brands that have wines from various countries
The IWSR includes the following types of wine in its definition of ‘wine’:
WINE =
Still light wine +
Sparkling (Champagne & other) +
Fortified
Sub-categories
Definitions
Research Methodology:IWSR 2014

16
Format: 71 page PowerPoint (PDF)
Purchase online: http://www.wineintelligence.com/reports-shop/
Contact us directly: [email protected]
If you have any questions, please contact your local Wine Intelligence office:
AVIGNONJean-Philippe Perrouty, Director, Wine Intelligence France | T +33 (0)486 408 417 | Email: [email protected]
BEIJING
Rui Su, Research Manager | T +86 10 6260 2428 | Email: [email protected]
CAPE TOWN
Dimitri Coutras, South Africa Country Manager | T +27 828288866 | Email: [email protected]
DELAWARE
Erica Donoho, USA Country Manager | T +1 973 699 4158 | Email: [email protected]
FRANKFURT
Wilhelm Lerner, Associate Director/Germany Country Manager | T +49 (0)175 5806 151 | Email: [email protected]
LONDON
Emma Barnes-Webb, Project Executive | T +44 020 7378 1277 | Email: [email protected]
SYDNEY
Natasha Rastegar, Australia & NZ Country Manager | T +61 428 755 057 | Email: [email protected]
TRIESTEPierpaolo Penco, Italy Country Manager | T +39 349 424 3371 | Email: [email protected]
REPORT PRICE • GBP 1,000 • 2 Report Credits