windows version 3 -...
TRANSCRIPT
SAMPLE REPORT
NEW!
To order, call 1-800-211-8378,or visit our Web site at www.PsychCorp.com
Windows Version 3.0
Tables and Graphs Report for MicroCog Assessment
Copyright © 2004 by Harcourt Assessment Inc. All rights reserved. Page 1
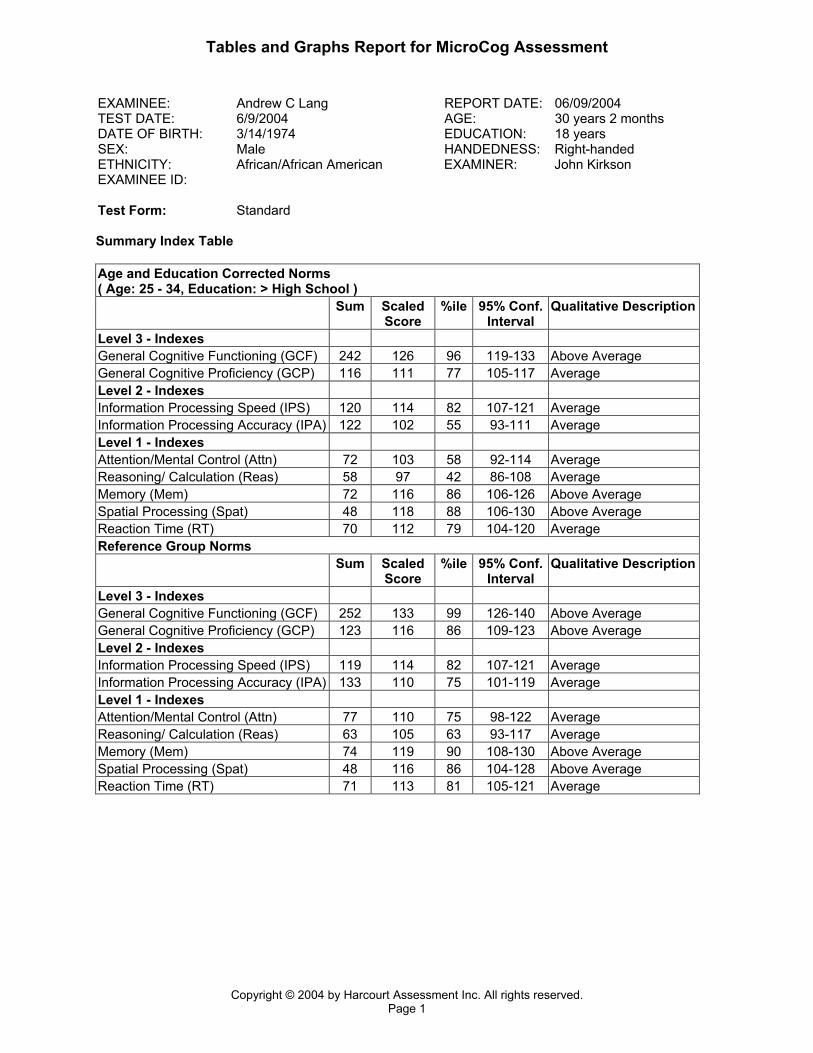
EXAMINEE: Andrew C Lang REPORT DATE: 06/09/2004 TEST DATE: 6/9/2004 AGE: 30 years 2 months DATE OF BIRTH: 3/14/1974 EDUCATION: 18 years SEX: Male HANDEDNESS: Right-handed ETHNICITY: African/African American EXAMINER: John Kirkson EXAMINEE ID: Test Form: Standard Summary Index Table Age and Education Corrected Norms ( Age: 25 - 34, Education: > High School ) Sum Scaled
Score %ile 95% Conf.
Interval Qualitative Description
Level 3 - Indexes General Cognitive Functioning (GCF) 242 126 96 119-133 Above Average General Cognitive Proficiency (GCP) 116 111 77 105-117 Average Level 2 - Indexes Information Processing Speed (IPS) 120 114 82 107-121 Average Information Processing Accuracy (IPA) 122 102 55 93-111 Average Level 1 - Indexes Attention/Mental Control (Attn) 72 103 58 92-114 Average Reasoning/ Calculation (Reas) 58 97 42 86-108 Average Memory (Mem) 72 116 86 106-126 Above Average Spatial Processing (Spat) 48 118 88 106-130 Above Average Reaction Time (RT) 70 112 79 104-120 Average Reference Group Norms Sum Scaled
Score %ile 95% Conf.
Interval Qualitative Description
Level 3 - Indexes General Cognitive Functioning (GCF) 252 133 99 126-140 Above Average General Cognitive Proficiency (GCP) 123 116 86 109-123 Above Average Level 2 - Indexes Information Processing Speed (IPS) 119 114 82 107-121 Average Information Processing Accuracy (IPA) 133 110 75 101-119 Average Level 1 - Indexes Attention/Mental Control (Attn) 77 110 75 98-122 Average Reasoning/ Calculation (Reas) 63 105 63 93-117 Average Memory (Mem) 74 119 90 108-130 Above Average Spatial Processing (Spat) 48 116 86 104-128 Above Average Reaction Time (RT) 71 113 81 105-121 Average

Tables and Graphs Report for MicroCog Assessment
Copyright © 2004 by Harcourt Assessment Inc. All rights reserved. Page 2
Index Score SEM Index Score SEM GCF 126 3.35 Attn 103 5.81 GCP 111 3 Reas 97 5.81 IPS 114 3.35 Mem 116 4.97 IPA 102 4.5 Spat 118 6 RT 112 4.24

Tables and Graphs Report for MicroCog Assessment
Copyright © 2004 by Harcourt Assessment Inc. All rights reserved. Page 3
Subtest Proficiency Table Age and Education Corrected Norms
( Age: 25 - 34, Education: > High School )
Reference Group Norms
Raw Score
Scaled Score
95% Conf.
Interval
Qualitative Description
Scaled Score
95% Conf.
Interval
Qualitative Description
Numbers Forward (NF) 17.3 10 7-13 Average 10 7-13 Average Numbers Reversed (NR) 8.9 7 5-9 Low
Average 7 5-9 Low Average
Story Immediate Recall (SI) 6.5 12 9-15 Average 14 11-17 Above Average
Story Delayed Recall (SD) 16.2 13 11-15 Above Average
15 13-17 Above Average
Clocks (CL) 4.5 11 8-14 Average 12 9-15 Average Tic Tac (TT) 50.4 17 13-19 Above
Average 15 11-19 Above
Average Analogies (AN) 4 9 6-12 Average 10 7-13 Average Math (MT) 3.7 9 7-11 Average 11 8-14 Average Object Match A (OMA) 8.7 14 12-16 Above
Average 14 12-16 Above
Average Object Match B (OMB) 8.6 14 11-17 Above
Average 15 12-18 Above
Average

Tables and Graphs Report for MicroCog Assessment
Copyright © 2004 by Harcourt Assessment Inc. All rights reserved. Page 4
Index Score SEM Index Score SEM NF 10 1.67 TT 17 1.82 NR 7 1.27 AN 9 1.44 SI 12 1.47 MT 9 1.24 SD 13 0.9 OMA 14 1.16 CL 11 1.64 OMB 14 1.53

Tables and Graphs Report for MicroCog Assessment
Copyright © 2004 by Harcourt Assessment Inc. All rights reserved. Page 5
Index Discrepancies Table Age-Education Corrected Norms
( Age: 25 - 34, Education: > High School )
Reference Group Norms
Discrepancy Comparisons Score 1
Score 2
Diff Sig Base Rate
Score 1
Score 2
Diff Sig Base Rate
General Cognitive Functioning - General Cognitive Proficiency
126 111 15 Y 0 133 116 17 Y 0
Information Processing Speed - Information Processing Accuracy
114 102 12 Y 51 114 110 4 N 85
Information Processing Speed - General Cognitive Proficiency
114 111 3 N 84 114 116 -2 N 92
Information Processing Accuracy - General Cognitive Proficiency
102 111 -9 N 35 110 116 -6 N 54
Attention/Mental Control - Reasoning Calculation
103 97 6 N 66 110 105 5 N 71
Attention/Mental Control - Memory
103 116 -13 N 34 110 119 -9 N 47
Attention/Mental Control - Spatial
103 118 -15 N 26 110 116 -6 N 66
Attention/Mental Control - Reaction Time
103 112 -9 N 63 110 113 -3 N 90
Reasoning/Calculation - Memory
97 116 -19 Y 15 105 119 -14 N 23
Reasoning/Calculation - Spatial 97 118 -21 Y 12 105 116 -11 N 37 Reasoning/Calculation - Reaction Time
97 112 -15 Y 33 105 113 -8 N 58
Memory - Spatial 116 118 -2 N 88 119 116 3 N 82 Memory - Reaction Time 116 112 4 N 86 119 113 6 N 76 Spatial - Reaction Time 118 112 6 N 70 116 113 3 N 89 *Significant Difference at .05
Tables and Graphs Report for MicroCog Assessment
Copyright © 2004 by Harcourt Assessment Inc. All rights reserved. Page 6
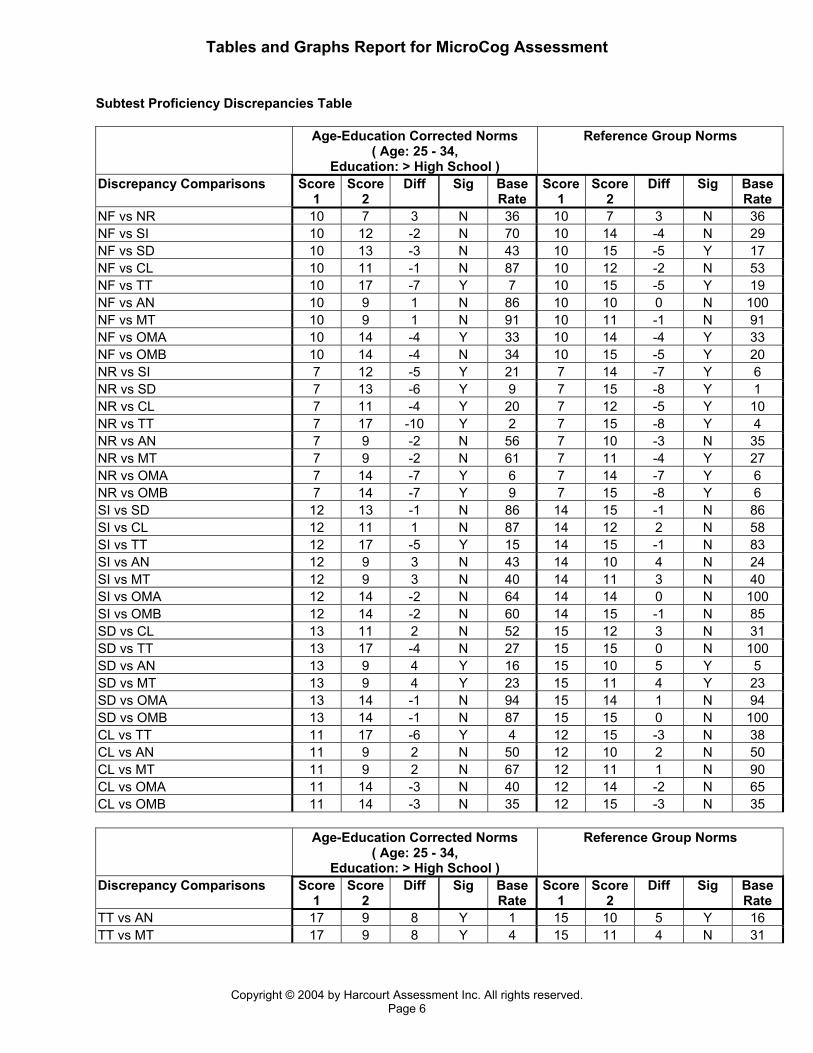
Subtest Proficiency Discrepancies Table Age-Education Corrected Norms
( Age: 25 - 34, Education: > High School )
Reference Group Norms
Discrepancy Comparisons Score 1
Score 2
Diff Sig Base Rate
Score 1
Score 2
Diff Sig Base Rate
NF vs NR 10 7 3 N 36 10 7 3 N 36 NF vs SI 10 12 -2 N 70 10 14 -4 N 29 NF vs SD 10 13 -3 N 43 10 15 -5 Y 17 NF vs CL 10 11 -1 N 87 10 12 -2 N 53 NF vs TT 10 17 -7 Y 7 10 15 -5 Y 19 NF vs AN 10 9 1 N 86 10 10 0 N 100 NF vs MT 10 9 1 N 91 10 11 -1 N 91 NF vs OMA 10 14 -4 Y 33 10 14 -4 Y 33 NF vs OMB 10 14 -4 N 34 10 15 -5 Y 20 NR vs SI 7 12 -5 Y 21 7 14 -7 Y 6 NR vs SD 7 13 -6 Y 9 7 15 -8 Y 1 NR vs CL 7 11 -4 Y 20 7 12 -5 Y 10 NR vs TT 7 17 -10 Y 2 7 15 -8 Y 4 NR vs AN 7 9 -2 N 56 7 10 -3 N 35 NR vs MT 7 9 -2 N 61 7 11 -4 Y 27 NR vs OMA 7 14 -7 Y 6 7 14 -7 Y 6 NR vs OMB 7 14 -7 Y 9 7 15 -8 Y 6 SI vs SD 12 13 -1 N 86 14 15 -1 N 86 SI vs CL 12 11 1 N 87 14 12 2 N 58 SI vs TT 12 17 -5 Y 15 14 15 -1 N 83 SI vs AN 12 9 3 N 43 14 10 4 N 24 SI vs MT 12 9 3 N 40 14 11 3 N 40 SI vs OMA 12 14 -2 N 64 14 14 0 N 100 SI vs OMB 12 14 -2 N 60 14 15 -1 N 85 SD vs CL 13 11 2 N 52 15 12 3 N 31 SD vs TT 13 17 -4 N 27 15 15 0 N 100 SD vs AN 13 9 4 Y 16 15 10 5 Y 5 SD vs MT 13 9 4 Y 23 15 11 4 Y 23 SD vs OMA 13 14 -1 N 94 15 14 1 N 94 SD vs OMB 13 14 -1 N 87 15 15 0 N 100 CL vs TT 11 17 -6 Y 4 12 15 -3 N 38 CL vs AN 11 9 2 N 50 12 10 2 N 50 CL vs MT 11 9 2 N 67 12 11 1 N 90 CL vs OMA 11 14 -3 N 40 12 14 -2 N 65 CL vs OMB 11 14 -3 N 35 12 15 -3 N 35 Age-Education Corrected Norms
( Age: 25 - 34, Education: > High School )
Reference Group Norms
Discrepancy Comparisons Score 1
Score 2
Diff Sig Base Rate
Score 1
Score 2
Diff Sig Base Rate
TT vs AN 17 9 8 Y 1 15 10 5 Y 16 TT vs MT 17 9 8 Y 4 15 11 4 N 31

Tables and Graphs Report for MicroCog Assessment
Copyright © 2004 by Harcourt Assessment Inc. All rights reserved. Page 7
TT vs OMA 17 14 3 N 42 15 14 1 N 88 TT vs OMB 17 14 3 N 42 15 15 0 N 100 AN vs MT 9 9 0 N 100 10 11 -1 N 86 AN vs OMA 9 14 -5 Y 17 10 14 -4 Y 28 AN vs OMB 9 14 -5 Y 10 10 15 -5 Y 10 MT vs OMA 9 14 -5 Y 22 11 14 -3 N 50 MT vs OMB 9 14 -5 Y 21 11 15 -4 N 33 OMA vs OMB 14 14 0 N 100 14 15 -1 N 85 *Significant Difference at .05

Tables and Graphs Report for MicroCog Assessment
Copyright © 2004 by Harcourt Assessment Inc. All rights reserved. Page 8
Subtest Raw Score to Scaled Score Conversion Table Age and Education Corrected Norms
( Age: 25 - 34, Education: > High School )
Reference Group Norms
Raw Score
Scaled Score
95% Conf.
Interval
Qualitative Description
Raw Score
Scaled Score
95% Conf.
Interval
Qualitative Description
Attention/Mental Control Numbers Forward TS 33 10 6-14 Average 33 10 6-14 Average Numbers Forward RT 6 9 6-12 Average 6 11 8-14 Average Numbers Forward HL 7 9 6-12 Average 7 10 7-13 Average Numbers Reversed TS 24 7 4-10 Low Average 24 9 6-12 Average Numbers Reversed RT 11 12 10-14 Average 11 10 8-12 Average Numbers Reversed HL 6 8 6-10 Average 6 9 7-11 Average Alphabet TS 45 10 8-12 Average 45 12 11-13 Average Wordlist 1 TS 16 11 9-13 Average 16 12 10-14 Average Wordlist 1 FP 0 12 8-16 Average 0 12 8-16 Average Wordlist 1 RB 0 5 NA Low Average 0 6 NA Low Average Wordlist 1 DI 100 12 8-16 Average 100 13 9-17 Above AverageWordlist 2 TS 16 11 10-12 Average 16 12 11-13 Average Wordlist 2 FP 0 12 9-15 Average 0 11 8-14 Average Wordlist 2 RB 0 2 NA Below Average 0 4 NA Below AverageWordlist 2 DI 100 12 8-16 Average 100 12 8-16 Average Memory Story Read/Memorize Time 57 13 10-16 Above Average 57 12 9-15 Average Address Read/Memorize Time 26 9 5-13 Average 26 8 4-12 Average Story Immediate Recall TS 10 10 6-14 Average 10 12 8-16 Average Story Immediate Recall RT 5 14 11-17 Above Average 5 13 10-16 Above AverageStory Delayed Recall TS 26 13 10-16 Above Average 26 14 11-17 Above AverageStory Delayed Recall RT 5 12 10-14 Average 5 12 10-14 Average Percent Retention 90 10 6-14 Average 90 11 7-15 Average Spatial Processing Clocks TS 7 12 8-16 Average 7 12 8-16 Average Clocks RT 6 11 9-13 Average 6 11 9-13 Average Tic Tac TS 96 12 9-15 Average 96 13 10-16 Above AverageTic Tac RT 2 13 10-16 Above Average 2 12 9-15 Average Reasoning Analogies TS 6 6 3-9 Low Average 6 7 4-10 Low Average Analogies RT 8 12 9-15 Average 8 13 10-16 Above AverageMath TS 6 7 4-10 Low Average 6 9 5-13 Average Math RT 19 11 8-14 Average 19 11 8-14 Average Object Match A TS 12 12 9-15 Average 12 12 9-15 Average Object Match A RT 5 13 10-16 Above Average 5 13 10-16 Above AverageObject Match B TS 10 9 5-13 Average 10 10 6-14 Average Object Match B RT 4 13 10-16 Above Average 4 13 10-16 Above Average Age and Education Corrected Norms Reference Group Norms Raw
Score Scaled Score
95% Conf.
Interval
Qualitative Description
Raw Score
Scaled Score
95% Conf.
Interval
Qualitative Description

Tables and Graphs Report for MicroCog Assessment
Copyright © 2004 by Harcourt Assessment Inc. All rights reserved. Page 9
Reaction Time Timers 1 - Auditory RT 0.298 14 12-16 Above Average 0.298 14 12-16 Above AverageTimers 1 - Visual RT 0.267 11 9-13 Average 0.267 12 10-14 Average Timers 1 - A/V RT 0.252 12 8-16 Average 0.252 12 8-16 Average Timers 1 - Total RT 0.272 13 11-15 Above Average 0.272 13 11-15 Above AverageTimers 2 - Auditory RT 0.295 13 11-15 Above Average 0.295 13 11-15 Above AverageTimers 2 - Visual RT 0.290 10 8-12 Average 0.290 10 8-12 Average Timers 2 - A/V RT 0.265 10 6-14 Average 0.265 10 6-14 Average Timers 2 - Total RT 0.283 12 10-14 Average 0.283 12 10-14 Average

Tables and Graphs Report for MicroCog Assessment
Copyright © 2004 by Harcourt Assessment Inc. All rights reserved. Page 10
Significant Difference and Base Rate Table Age - Education
Based Norms (Age: 25 - 34, Education: > High School)
Reference Group Norms
Score Diff.
Base Rate
Score Diff.
Base Rate
Index Score Pairs Information Processing Speed - Information Processing Accuracy 12 51 4 85 Information Processing Speed - General Cognitive Functioning -12 27 -19 6 Information Processing Speed - Reasoning/Calculation 17 16 9 48 Information Processing Accuracy - General Cognitive Functioning -24 3 -23 3 Information Processing Accuracy - Memory -14 26 -9 50 Information Processing Accuracy - Spatial Processing -16 19 -6 61 General Cognitive Functioning - Attention/Mental Control 23 4 23 4 General Cognitive Functioning - Reasoning/Calculation 29 0 28 1 General Cognitive Functioning - Memory 10 27 14 14 General Cognitive Functioning - Spatial Processing 8 45 17 9 General Cognitive Functioning - Reaction Time 14 38 20 26 General Cognitive Functioning - General Cognitive Proficiency 15 0 17 0 Reasoning/Calculation - Memory -19 15 -14 23 Reasoning/Calculation - Spatial Processing -21 12 -11 37 Reasoning/Calculation - Reaction Time -15 33 -8 58 Reasoning/Calculation - General Cognitive Proficiency -14 13 -11 23 Attention/Mental Control Subtest Score Pairs Numbers Reversed TS - Alphabet TS -3 45 -3 45 Numbers Reversed TS - Wordlist 1 Discriminability Index -5 21 -4 32 Numbers Reversed ART - Numbers Reversed TS 5 37 1 90 Memory Subtest Score Pairs Address Read/Memorize Time - Story Delayed Recall TS -4 40 -6 23 Reasoning Subtest Score Pairs Analogies TS - Analogies ART -6 25 -6 25 Analogies TS - Object Match A TS -6 12 -5 25 Math TS - Object Match A TS -5 19 -3 31 Reaction Time Subtest Score Pairs Timers 2 Auditory ART - Timers 2 Visual ART 3 26 3 26 Information Processing Speed Score Pairs Numbers Forward ART - Story Immediate Recall ART -5 17 -2 63 Numbers Forward ART - Object Match A ART -4 24 -2 56 Information Processing Accuracy Score Pairs Numbers Reversed TS - Wordlist 1 Discriminability Index -5 21 -4 32 Numbers Reversed TS - Story Delayed Recall TS -6 8 -5 17 Age - Education
Based Norms (Age: 25 - 34, Education: > High School)
Reference Group Norms
Score Base Score Base
Tables and Graphs Report for MicroCog Assessment
Copyright © 2004 by Harcourt Assessment Inc. All rights reserved. Page 11
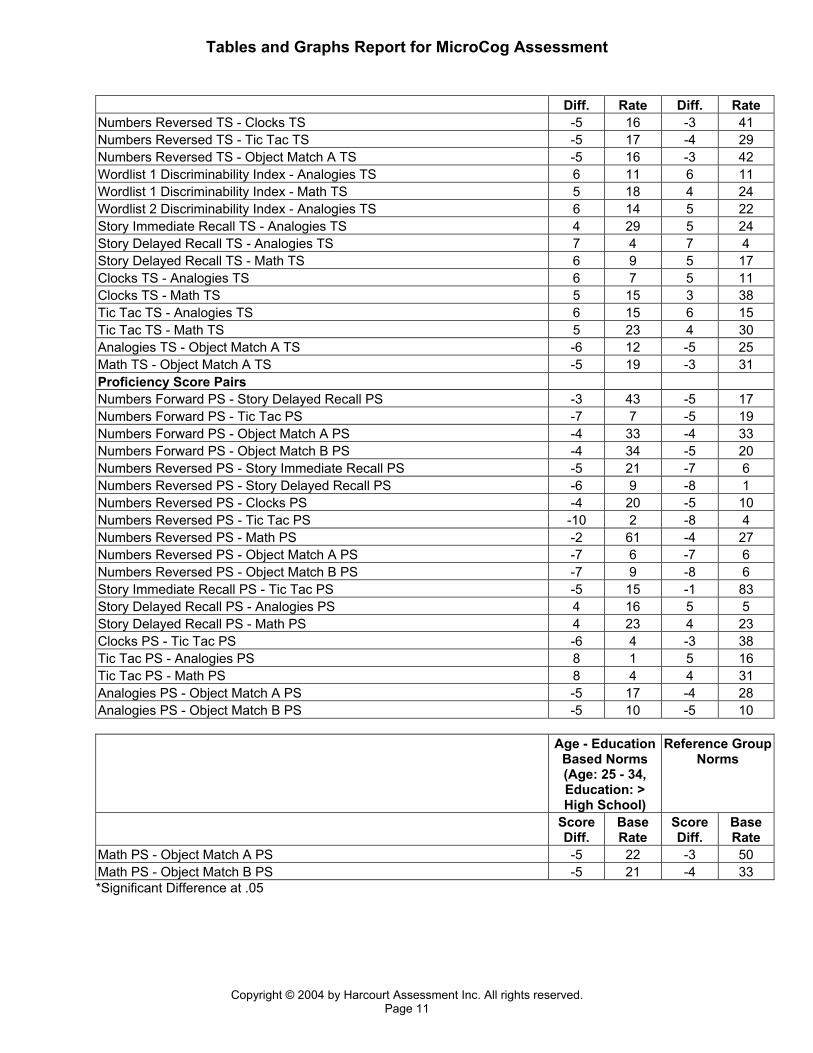
Diff. Rate Diff. Rate Numbers Reversed TS - Clocks TS -5 16 -3 41 Numbers Reversed TS - Tic Tac TS -5 17 -4 29 Numbers Reversed TS - Object Match A TS -5 16 -3 42 Wordlist 1 Discriminability Index - Analogies TS 6 11 6 11 Wordlist 1 Discriminability Index - Math TS 5 18 4 24 Wordlist 2 Discriminability Index - Analogies TS 6 14 5 22 Story Immediate Recall TS - Analogies TS 4 29 5 24 Story Delayed Recall TS - Analogies TS 7 4 7 4 Story Delayed Recall TS - Math TS 6 9 5 17 Clocks TS - Analogies TS 6 7 5 11 Clocks TS - Math TS 5 15 3 38 Tic Tac TS - Analogies TS 6 15 6 15 Tic Tac TS - Math TS 5 23 4 30 Analogies TS - Object Match A TS -6 12 -5 25 Math TS - Object Match A TS -5 19 -3 31 Proficiency Score Pairs Numbers Forward PS - Story Delayed Recall PS -3 43 -5 17 Numbers Forward PS - Tic Tac PS -7 7 -5 19 Numbers Forward PS - Object Match A PS -4 33 -4 33 Numbers Forward PS - Object Match B PS -4 34 -5 20 Numbers Reversed PS - Story Immediate Recall PS -5 21 -7 6 Numbers Reversed PS - Story Delayed Recall PS -6 9 -8 1 Numbers Reversed PS - Clocks PS -4 20 -5 10 Numbers Reversed PS - Tic Tac PS -10 2 -8 4 Numbers Reversed PS - Math PS -2 61 -4 27 Numbers Reversed PS - Object Match A PS -7 6 -7 6 Numbers Reversed PS - Object Match B PS -7 9 -8 6 Story Immediate Recall PS - Tic Tac PS -5 15 -1 83 Story Delayed Recall PS - Analogies PS 4 16 5 5 Story Delayed Recall PS - Math PS 4 23 4 23 Clocks PS - Tic Tac PS -6 4 -3 38 Tic Tac PS - Analogies PS 8 1 5 16 Tic Tac PS - Math PS 8 4 4 31 Analogies PS - Object Match A PS -5 17 -4 28 Analogies PS - Object Match B PS -5 10 -5 10 Age - Education
Based Norms (Age: 25 - 34, Education: > High School)
Reference Group Norms
Score Diff.
Base Rate
Score Diff.
Base Rate
Math PS - Object Match A PS -5 22 -3 50 Math PS - Object Match B PS -5 21 -4 33 *Significant Difference at .05

Tables and Graphs Report for MicroCog Assessment
Copyright © 2004 by Harcourt Assessment Inc. All rights reserved. Page 12
Numbers Forward Subtest Scores Summary Items Administered Item Response Response Time
(s.ms) Item Score
(0-9 or D) 1. 32891 12389 4.236 0 2. 1792 1792 4.169 4 3. 98523 98523 3.649 5 4. 428195 428195 10.503 6 5. 2193847 2193827 9.485 0 6. 562791 526751 8.953 0 7. 42975 42975 3.066 5 8. 287931 287931 3.965 6 9. 6859431 6859431 8.271 7 Total Score 33
Average Response Time (s) 6
Highest Level Achieved 7
Start Time: 09:47:15 Elapsed Time: 00:02:13
End Time: 09:49:28 Pause not allowed.
Tables and Graphs Report for MicroCog Assessment
Copyright © 2004 by Harcourt Assessment Inc. All rights reserved. Page 13
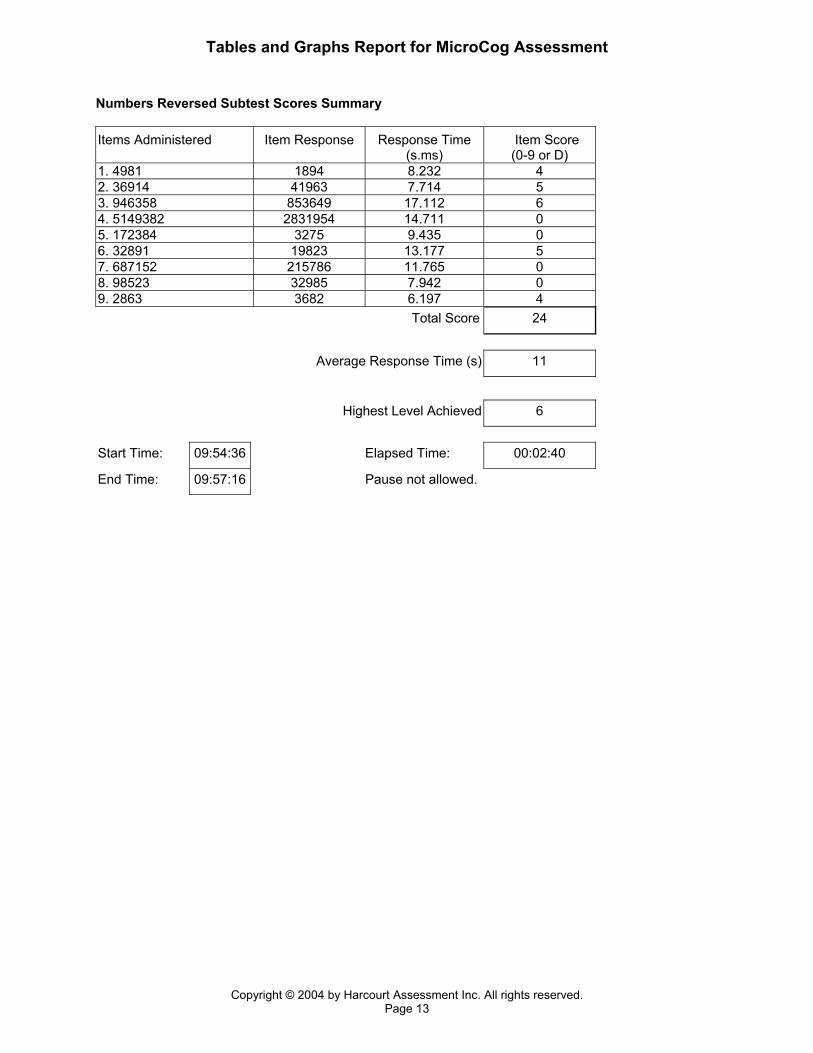
Numbers Reversed Subtest Scores Summary Items Administered Item Response Response Time
(s.ms) Item Score
(0-9 or D) 1. 4981 1894 8.232 4 2. 36914 41963 7.714 5 3. 946358 853649 17.112 6 4. 5149382 2831954 14.711 0 5. 172384 3275 9.435 0 6. 32891 19823 13.177 5 7. 687152 215786 11.765 0 8. 98523 32985 7.942 0 9. 2863 3682 6.197 4 Total Score 24
Average Response Time (s) 11
Highest Level Achieved 6
Start Time: 09:54:36 Elapsed Time: 00:02:40
End Time: 09:57:16 Pause not allowed.
Tables and Graphs Report for MicroCog Assessment
Copyright © 2004 by Harcourt Assessment Inc. All rights reserved. Page 14
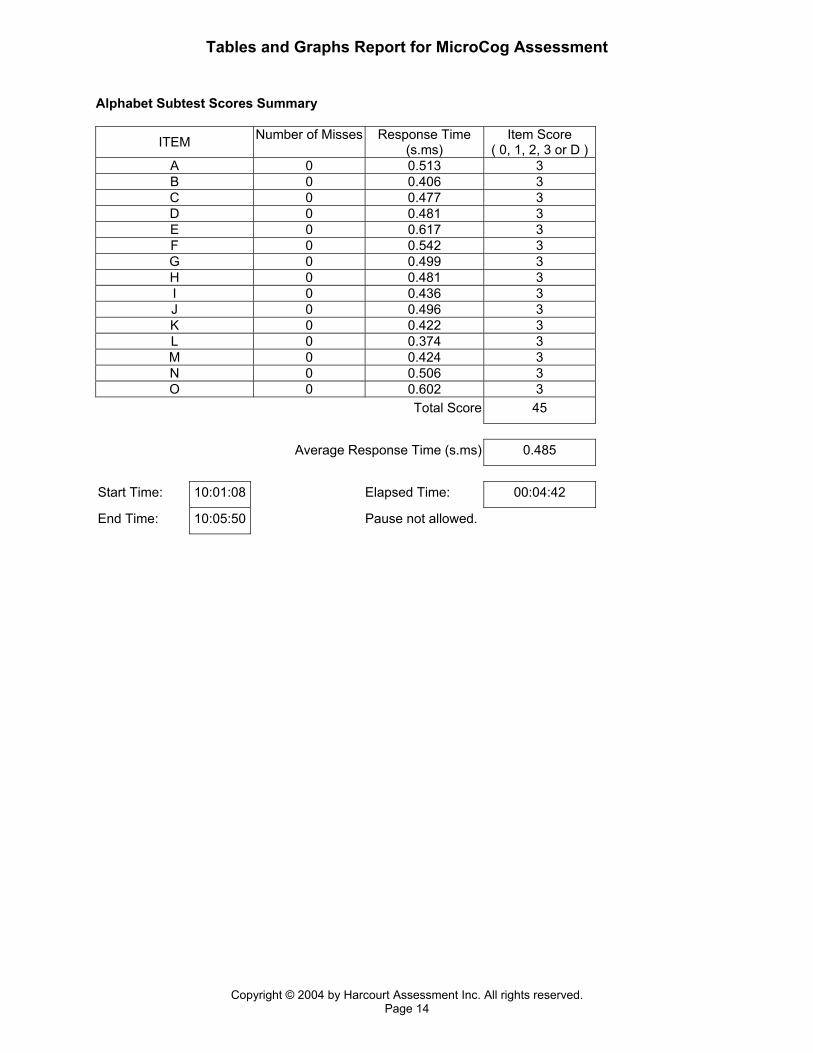
Alphabet Subtest Scores Summary
ITEM Number of Misses Response Time (s.ms)
Item Score ( 0, 1, 2, 3 or D )
A 0 0.513 3 B 0 0.406 3 C 0 0.477 3 D 0 0.481 3 E 0 0.617 3 F 0 0.542 3 G 0 0.499 3 H 0 0.481 3 I 0 0.436 3 J 0 0.496 3 K 0 0.422 3 L 0 0.374 3 M 0 0.424 3 N 0 0.506 3 O 0 0.602 3
Total Score 45
Average Response Time (s.ms) 0.485
Start Time: 10:01:08 Elapsed Time: 00:04:42
End Time: 10:05:50 Pause not allowed.

Tables and Graphs Report for MicroCog Assessment
Copyright © 2004 by Harcourt Assessment Inc. All rights reserved. Page 15
Wordlist 1 Subtest Scores Summary List 1 Clothing
Response Time (s.ms)
Jobs Response Time
(s.ms)
‘S’ Response Time
(s.ms)
Vowel Response Time
(s.ms) Stockings 0.857 0.398 Eagle 0.593 Pilot 0.622 Magnolia Underwear 0.629 0.464 Willow Fireman 0.515 School 0.365 Salmon 0.391 Carpenter 0.687 Shawl 1.154 0.530 Iron 0.482 Palm Overcoat 0.679 0.537 Mechanic 0.617 Birch
Total Score 16 False Positives: 0
Discriminability Index 100 Response Bias (-1 to +1): 0
Average Response Time (s.ms) 0.595

Tables and Graphs Report for MicroCog Assessment
Copyright © 2004 by Harcourt Assessment Inc. All rights reserved. Page 16
Wordlist 2 Subtest Scores Summary Recognize words on previous list List 2 Response Time
(s.ms) List 2 Response Time
(s.ms) Maple Iron 0.593 Violin Mechanic 0.639 Fireman 0.554 Bookkeeper Diamond Birch 0.695 Shawl 0.566 Stone Underwear 0.589 Eagle 0.696 Sofa Redwood Pine Stockings 0.762 Teacher Baseball Panda Cedar Magnolia 0.653 Lamp Hat Willow 0.527 Pillow Needle Pilot 0.638 Ink Salmon 0.601 School 0.618 Pants Palm 0.654 Carpenter 0.627 Juice Arrow Overcoat 0.599
Total Score 16 False Positives: 0
Discriminability Index 100 Response Bias (-1 to +1): 0
Average Response Time (s.ms) 0.626 Start Time: 09:51:07 Elapsed Time: 00:03:27
End Time: 09:54:34 Pause not allowed.

Tables and Graphs Report for MicroCog Assessment
Copyright © 2004 by Harcourt Assessment Inc. All rights reserved. Page 17
Address Subtest Scores Summary Presentation Read/Memorize Time: 26 Start Time: 09:38:04 End Time: 09:38:40 Delayed Recall Delayed Interval: 00:19:04 Item Item Response
(1-4) Response Time
(s.ms) Item Score
(0-1) 1. Title 3 4.361 1 2. Name 1 3.983 1 3. Address 2 9.257 1 4. City/State 4 5.162 1 Start Time: 09:57:17 Elapsed Time: 00:00:23
End Time: 09:57:40 Paused Time: 0.000

Tables and Graphs Report for MicroCog Assessment
Copyright © 2004 by Harcourt Assessment Inc. All rights reserved. Page 18
Story 1 & 2 Immediate Recall Subtest Scores Summary Story 1 Read/Memorize Time: 62 Item Item Response
(1-4) Response Time
(s.ms) Item Score ( 0, 1, D)
1. Name 3 6.481 1 2. Symptom 2 3.890 1 3. Location 1 4.178 1 4. Mechanic 2 5.086 1 5. Customer 3 4.198 1 Start Time: 09:39:34 Elapsed Time: 00:01:35
End Time: 09:41:09 Paused Time: 0.000
Story 2 Read/Memorize Time: 52 Item Item Response
(1-4) Response Time
(s.ms) Item Score ( 0, 1, D)
1. Name 3 4.540 1 2. Location 4 3.299 1 3. Sell 2 6.205 1 4. Start bid 4 3.251 1 5. Expect. bid 1 14.919 0 6. Alternative 1 2.470 1 Start Time: 09:49:29 Elapsed Time: 00:01:31
End Time: 09:51:00 Paused Time: 0.000
Tables and Graphs Report for MicroCog Assessment
Copyright © 2004 by Harcourt Assessment Inc. All rights reserved. Page 19
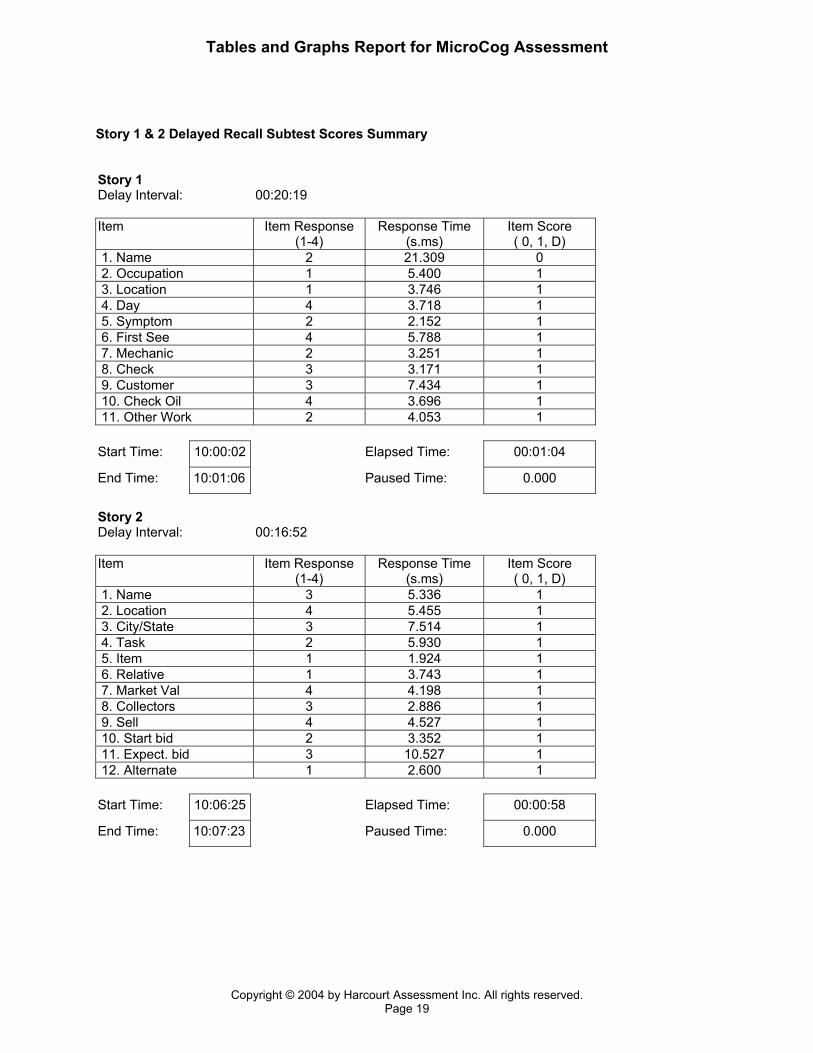
Story 1 & 2 Delayed Recall Subtest Scores Summary Story 1 Delay Interval: 00:20:19 Item Item Response
(1-4) Response Time
(s.ms) Item Score ( 0, 1, D)
1. Name 2 21.309 0 2. Occupation 1 5.400 1 3. Location 1 3.746 1 4. Day 4 3.718 1 5. Symptom 2 2.152 1 6. First See 4 5.788 1 7. Mechanic 2 3.251 1 8. Check 3 3.171 1 9. Customer 3 7.434 1 10. Check Oil 4 3.696 1 11. Other Work 2 4.053 1 Start Time: 10:00:02 Elapsed Time: 00:01:04
End Time: 10:01:06 Paused Time: 0.000
Story 2 Delay Interval: 00:16:52 Item Item Response
(1-4) Response Time
(s.ms) Item Score ( 0, 1, D)
1. Name 3 5.336 1 2. Location 4 5.455 1 3. City/State 3 7.514 1 4. Task 2 5.930 1 5. Item 1 1.924 1 6. Relative 1 3.743 1 7. Market Val 4 4.198 1 8. Collectors 3 2.886 1 9. Sell 4 4.527 1 10. Start bid 2 3.352 1 11. Expect. bid 3 10.527 1 12. Alternate 1 2.600 1 Start Time: 10:06:25 Elapsed Time: 00:00:58
End Time: 10:07:23 Paused Time: 0.000

Tables and Graphs Report for MicroCog Assessment
Copyright © 2004 by Harcourt Assessment Inc. All rights reserved. Page 20
Story 1 & 2 & Address Subtest Summary Average Read/Memorize Time, Story 1 & 2 (s) 57 Immediate Recall Total Score Story 1 & 2 10 Average Response Time, Immediate Recall, Story 1& 2 (s) 5 Delayed Recall Total Score, Story 1 & 2 & Address 26 Average Response Time, Delayed Recall, Story 1 & 2 & Address (s) 5 Percent Retention, Delayed Recall, Story 1 & 2 90%
Tables and Graphs Report for MicroCog Assessment
Copyright © 2004 by Harcourt Assessment Inc. All rights reserved. Page 21
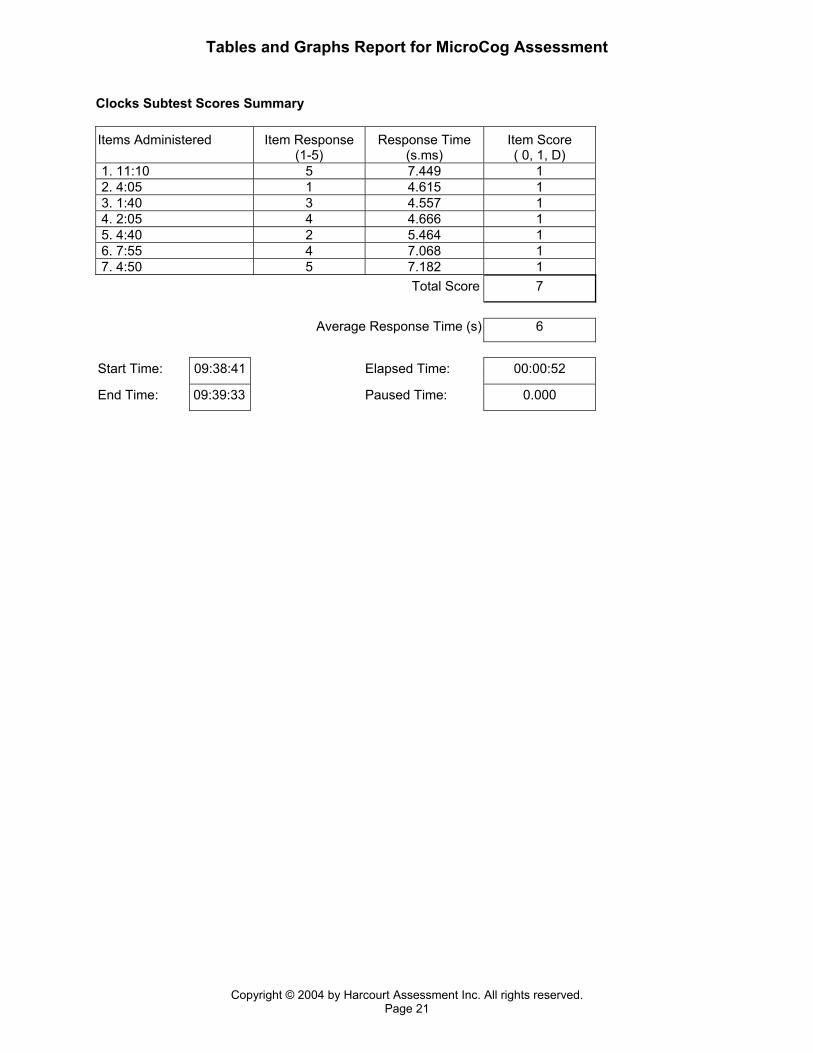
Clocks Subtest Scores Summary Items Administered Item Response
(1-5) Response Time
(s.ms) Item Score ( 0, 1, D)
1. 11:10 5 7.449 1 2. 4:05 1 4.615 1 3. 1:40 3 4.557 1 4. 2:05 4 4.666 1 5. 4:40 2 5.464 1 6. 7:55 4 7.068 1 7. 4:50 5 7.182 1 Total Score 7
Average Response Time (s) 6
Start Time: 09:38:41 Elapsed Time: 00:00:52
End Time: 09:39:33 Paused Time: 0.000

Tables and Graphs Report for MicroCog Assessment
Copyright © 2004 by Harcourt Assessment Inc. All rights reserved. Page 22
Tic Tac 1 Item Item Response Response Time
(s.ms) Item Score
(0, 3, 4, 5, N, D) 1. 9-2-1 129 1.819 3 2. 6-1-8 861 1.690 3 3. 4-3-6 463 2.608 3 4. 3-5-7 N 5. 7-6-2-1 7612 2.047 4 6. 9-8-4-3 3489 1.531 4 7. 7-6-5-2 7562 1.263 4 8. 9-7-3-1 N 9. 9-7-6-5-2 79562 1.836 5 10. 9-8-4-2-1 98412 1.700 5 11. 8-7-6-4-2 87426 1.815 5 12. 9-7-5-3-1 N Start Time: 09:43:54 Elapsed Time: 00:01:23
End Time: 09:45:17 Pause not allowed.
Tic Tac 2 Item Item Response Response Time
(s.ms) Item Score
(0, 3, 4, 5, N, D) 1. 7-3-2 723 1.274 3 2. 8-4-3 843 1.908 3 3. 6-4-1 146 1.371 3 4. 7-5-3 N 5. 9-4-3-2 3249 1.415 4 6. 8-7-6-1 7861 1.924 4 7. 8-5-4-1 8541 1.271 4 8. 9-7-3-1 N 9. 9-8-5-4-3 98543 1.470 5 10. 8-7-6-3-2 78632 1.508 5 11. 8-6-4-2-1 86412 1.481 5 12. 9-7-5-3-1 N Start Time: 10:05:52 Elapsed Time: 00:00:32
End Time: 10:06:24 Pause not allowed.
Total Score Tic Tac 1 & 2
96 Average Response TimeTic Tac 1 & 2 (s)
2
Tables and Graphs Report for MicroCog Assessment
Copyright © 2004 by Harcourt Assessment Inc. All rights reserved. Page 23
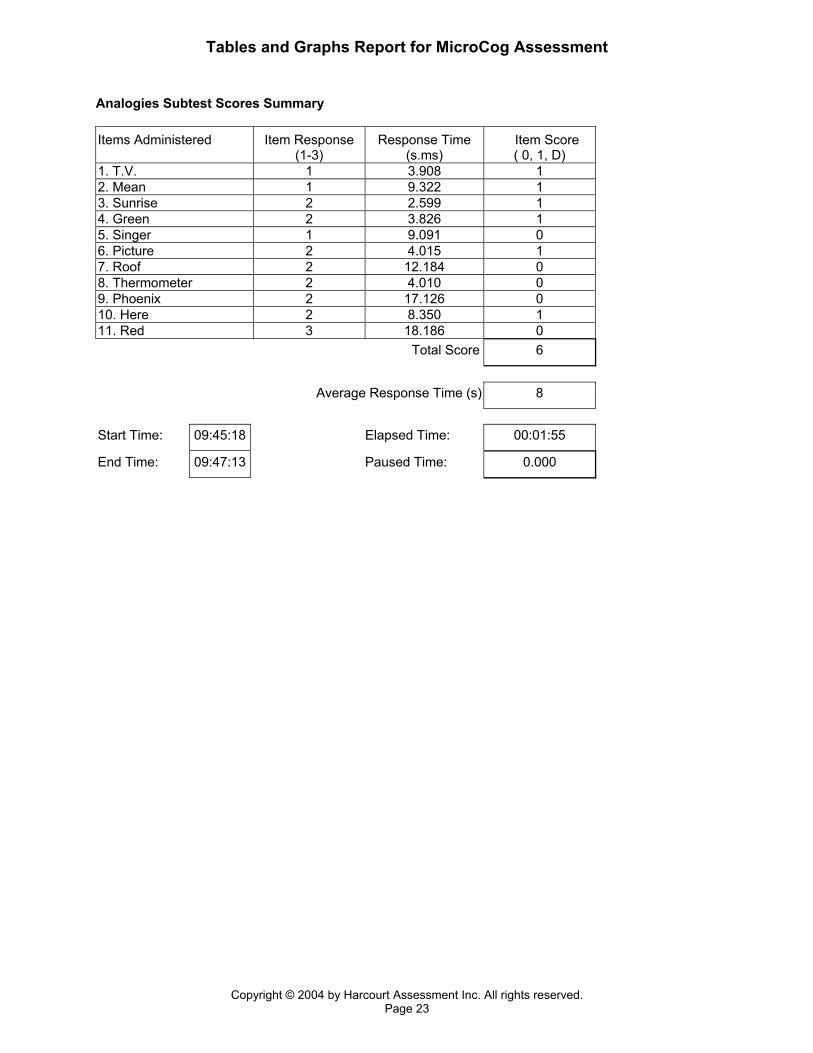
Analogies Subtest Scores Summary Items Administered Item Response
(1-3) Response Time
(s.ms) Item Score
( 0, 1, D) 1. T.V. 1 3.908 1 2. Mean 1 9.322 1 3. Sunrise 2 2.599 1 4. Green 2 3.826 1 5. Singer 1 9.091 0 6. Picture 2 4.015 1 7. Roof 2 12.184 0 8. Thermometer 2 4.010 0 9. Phoenix 2 17.126 0 10. Here 2 8.350 1 11. Red 3 18.186 0 Total Score 6
Average Response Time (s) 8
Start Time: 09:45:18 Elapsed Time: 00:01:55
End Time: 09:47:13 Paused Time: 0.000
Tables and Graphs Report for MicroCog Assessment
Copyright © 2004 by Harcourt Assessment Inc. All rights reserved. Page 24
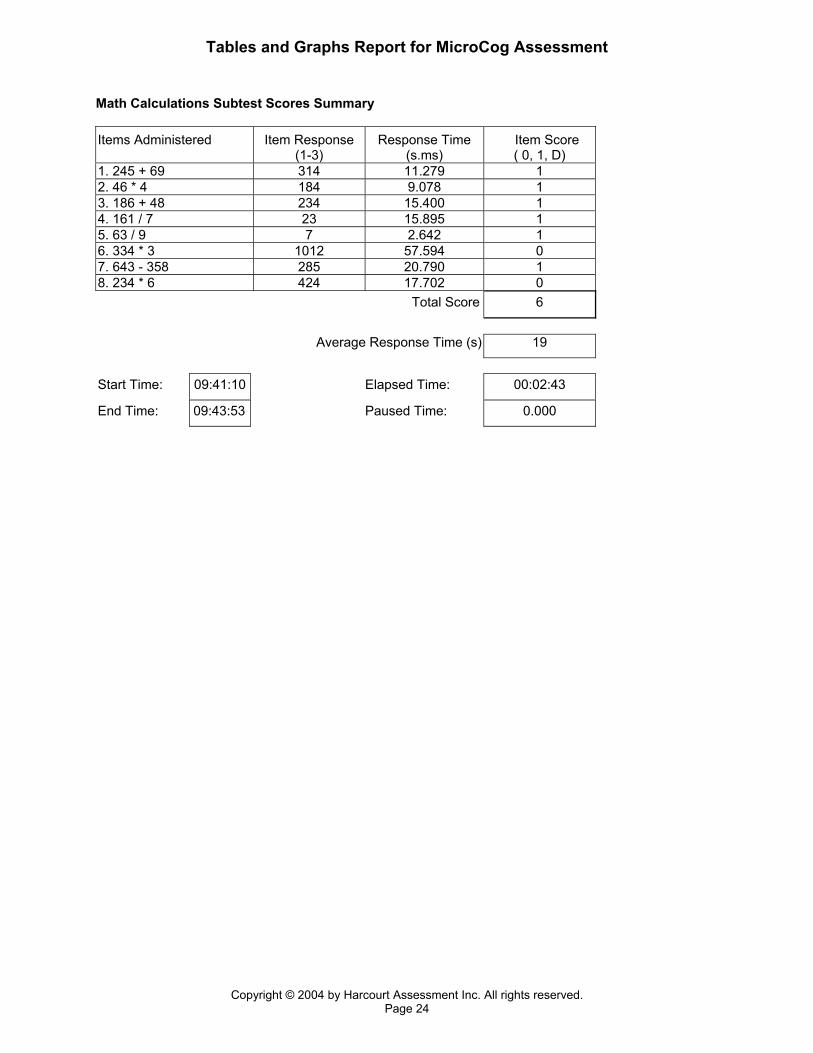
Math Calculations Subtest Scores Summary Items Administered Item Response
(1-3) Response Time
(s.ms) Item Score
( 0, 1, D) 1. 245 + 69 314 11.279 1 2. 46 * 4 184 9.078 1 3. 186 + 48 234 15.400 1 4. 161 / 7 23 15.895 1 5. 63 / 9 7 2.642 1 6. 334 * 3 1012 57.594 0 7. 643 - 358 285 20.790 1 8. 234 * 6 424 17.702 0 Total Score 6
Average Response Time (s) 19
Start Time: 09:41:10 Elapsed Time: 00:02:43
End Time: 09:43:53 Paused Time: 0.000

Tables and Graphs Report for MicroCog Assessment
Copyright © 2004 by Harcourt Assessment Inc. All rights reserved. Page 25
Object Match Trial A Trial B Item Item
Response (1-4)
Item Score ( 0, 1, D)
Response Time (s.ms)
Item Response (1-4)
Item Score ( 0, 1, D)
Response Time (s.ms)
1. 2 1 10.374 3 1 4.271 2. 2 1 2.541 4 1 0.868 3. 1 1 2.190 4 1 0.525 4. 3 1 4.212 1 1 1.964 5. 2 1 3.087 3 1 1.390 6. 4 1 3.221 3 1 2.435 7. 1 1 3.286 2 1 1.018 8. 2 1 6.768 3 0 12.273 9. 2 1 7.120 4 0 11.931 10. 1 1 5.198 4 1 0.863 11. 2 1 7.080 4 1 4.572 12. 1 1 5.922 3 1 1.929 12 5 10 4 Total Score Average
Response Time (s)
Total Score Average Response Time
(s)
Start Time: 09:57:41 Elapsed Time: 00:02:19
End Time: 10:00:00 Paused Time: 0.000

Tables and Graphs Report for MicroCog Assessment
Copyright © 2004 by Harcourt Assessment Inc. All rights reserved. Page 26
Timers 1 Subtest Scores Summary Item Response Time (s.ms) 1. 0.308 2. 0.215 3. 0.268 4. 0.238 5. 0.315 6. 0.242 7. 0.207 8. 0.269 9. 0.252 10. 0.217 Premature Response Time (s.ms) 11. 0.241 12. 0.233 13. 0.205 14. 0.202 15. 0.232
Average Simple Response Time Auditory, Items 1-5 (s.ms) 0.298
Average Simple Response Time Visual, Items 6-10 (s.ms) 0.267
Average Cued Response Time Items 11-15 (s.ms) 0.252
Average Total Response Time Items 1-15 (s.ms) 0.272
Start Time: 09:36:16 Elapsed Time: 00:01:47
End Time: 09:38:03 Pause not allowed.

Tables and Graphs Report for MicroCog Assessment
Copyright © 2004 by Harcourt Assessment Inc. All rights reserved. Page 27
Timers 2 Item Response Time (s.ms) 1. 0.406 2. 0.187 3. 0.206 4. 0.230 5. 0.299 6. 0.210 7. 0.206 8. 0.295 9. 0.267 10. 0.325 Premature Response Time (s.ms) 11. 0.235 12. 0.269 13. 0.230 14. 0.234 15. 0.207
Average Simple Response Time Auditory, Items 1-5 (s.ms) 0.295
Average Simple Response Time Visual, Items 6-10 (s.ms) 0.290
Average Cued Response Time Items 11-15 (s.ms) 0.265
Average Total Response Time Items 1-15 (s.ms) 0.283
Start Time: 10:07:25 Elapsed Time: 00:02:01
End Time: 10:09:26 Pause not allowed.

.

.

"MicroCog" is a trademark of The Risk Management Foundation of the Harvard Medical Institutions, Inc."Windows" is a registered trademark of Microsoft Corporation. Copyright © 2005 by Harcourt Assessment, Inc.
19500 Bulverde Road, San Antonio, Texas 78259-3701
To find out more, call 1-800-211-8378,or visit our Web site at www.PsychCorp.com
In Canada, call 1-800-387-7278In Australia, call (Toll Free) 1800 882 385
In New Zealand, (Free call to Australia) 0800 942 722