wind wave attenuation over saltmarsh surfaces: preliminary
TRANSCRIPT
,Journal of Coastal Research 1009-1016 Fort Lauderdale, Florida Fall 1996
Wind Wave Attenuation over Saltmarsh Surfaces:Preliminary Results from Norfolk, EnglandI. Moellert, T. Spencerj, and j. R. French']
"Department of GeographyUniversity of CambridgeDowning PlaceCambridge CB2 3ENEngland
[Department of GeographyUniversity College London26 Bedford WayLondon WC1H OAPEngland
,tllllllll:.~euus-- ¢ ,.,
..., .
ABSTRACT _
MOELLER, 1.; SPENCER, T., and FRENCH, J. R, 1997. Wind wave attenuation over salt.marsh surfaces; preliminaryresults from Norfolk, England. Journal of Coastal Research, 12(41, 1009-1016.Fort Lauderdale (Florida), ISSN 0749-0208.
An array of'three bottom-mounted pressure transducers (placed approximately 200 metres apart along a shore-normaltransect centred on the sandflat/saltmarsh transition) was used to measure changes in wave characteristics acrosssandflat and saltmarsh on the Norfolk coast, UK. Pressure readings were taken at a frequency of 5Hz over periodsof 5 and 7 minutes at different times during the tidal cycle over a range of tides between September 1994 and May1995. The time-series were corrected to offset attenuation with depth ofthe high frequency fluctuations. Acomparisonof surface waves computed in this way with observations made using a video camera showed a significant positivecorrelation. Analysis of all 54 records showed a consistent energy decrease of between 47.4 rk and effectively 100';;across the salt.marsh section of the transect. This differed significantly from the much lower wave energy reduction(1.9 to 55.:3'/, ) across the sandflat section of the transect. Reduction in wave energy and significant wave heights wasonly weakly related to water depth across the sandflat, but more strongly related to water depth across the salt.marsh.The results suggest that saltmarshes are extremely effective in buffering wave energy over the range of water depthsand incident wave energies investigated here. The increased surface roughness of saltmarshes is likely to be mosteffective in reducing wave energy at low to intermediate water depths or during conditions of high incident waves.
ADDITIONAL INDEX WORDS: Coastal defence, wave energy, wave recording. marsh surface hydrodynamics.
INTRODUCTION
A large proportion of European saltmarshes (approximately38'/r; DI,JKEMA, 19R71 are exposed to significant incident energyfrom wind-generated waves. Recent monitoring of intertidal profiles on foreland coasts with extensive mudflats and more landward saltmarshes suggests that they can be usefully viewed asa low-energy analogue of beach profile adjustment to varyingnearshore energy conditions (PETHICK, 1992). This energy-buffering function, and its manifestation in the reduction of waveheights across marsh surfaces, has engineering significancesince it permits the relaxation of design criteria for flood defenceembankments where these are fronted by saltmarsh (BRAMPTON, 1992l. Concern over near-future accelerated sea level riseand the potential costs of raising and strengthening existinglines of coastal defence has stimulated interest in mechanismsby which mudflat and saltrnarsh surfaces dissipate wave energyand the efficiency with which they do so. Better understandingof the physical effect of saltrnarshes upon wave hydrodynamicsis necessary in order to (i) inform policies of 'coastal setback' (or'managed retreat' I, where an expanded intertidal zone is createdbetween existing and newly constructed landward defences(Bunn, 1995); and (ii) provide design criteria for the restorationof degraded marsh systems or the creation of new protectivemarshes in front of threatened defences.
Scale physical model experiments undertaken in the UK dur-
95150 received 30 Augu«! 1995; accepted in revision 1 February 1996.
ing the 1980s suggest a wave height reduction of approximately40% over an 80 m wide saltmarsh from shoaling and breakingprocesses and from frictional losses (BRAMPTON, 1992) but theseresults were not validated by complementary field observations.There have been remarkably few such studies. WAYNE'S (1976)work on a Florida saltmarsh indicates a substantial reductionof wave height and total energy (71% and 92%, respectively)over a 20 m transect, although it is difficult to reconstruct themethods and tidal sampling strategy employed. KNUTSON et al.(1982) reported similarly large reductions within the marshesof Chesapeake Bay; virtually all the incident wind-wave energywas removed at the end of a 30 m transect. Both these studieswere conducted in densely vegetated stands of tall Spartina alterniflora (cordgrass), under very low incident wave energies.We know of no comparable published work on wave energytransformations within European locations subject to a stormwave climate. This paper reports preliminary findings on themodification of wave characteristics across a sandflat to saltmarsh transect on the marshland coast of eastern England overa range of tidal flooding events.
STUDY LOCATION
The North Norfolk coast of eastern England is an area ofextensive backbarrier and open coast saltmarshes whichhave developed behind offshore bars, spits, or shallow slopingsandflats. Local isostatic subsidence and eustatic sea levelrise appear to contribute roughly equally to a relative sea
1010 Moelle r, Spencer and French
b
BrancasterBay
~~• • i r, -era
/-fo l ri) ItCI) "caII) "'e" Or " l) 'vei l Ster
e Sea eXI a",
HUNSTANTON
oSHER INGHAIv',
CJ'- - '
o•@±]~
~
(J1 <;bl
&
..a
Wave rec ord ing s tation
Unveget ated in te rucatsa nd. sh ing le a nd m ud
Barri er
Sa ltm a rsh
Rec laimed marsh
Degraded c li ff line
/ / §c
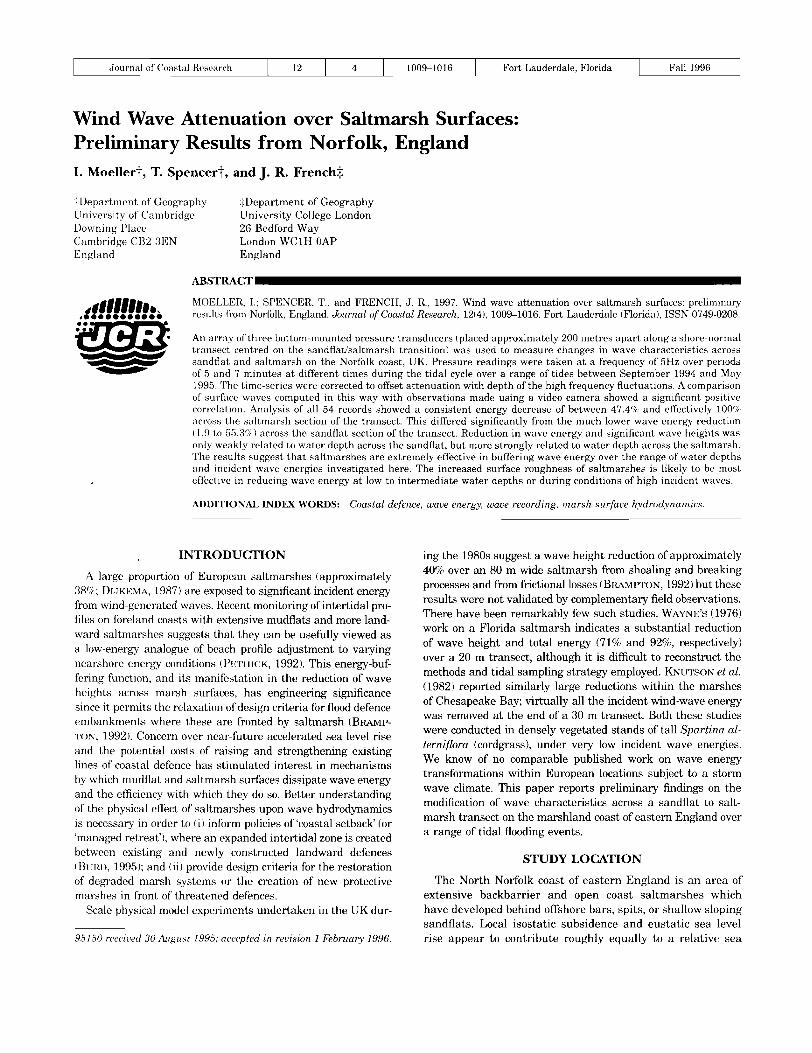
Figure 1. Location and coastal environments. a: North Norfolk coast, eastern England ; b: Intertidal, barri er and back-banier environments (after Spencer andFrenc h, 1992); c: Stiflkey Marshes (source: 1:25,000 Ordnance Surv ey ma p, 1984) with location of wave recording sta tions (6). For section A-A' see Figure 2.
level rise of ju st un der 2 mm yr - l (FRENCH, 1993). The coastis just ma crotidal with a semi-diurnal regim e; mean springtidal range var ies from 6.6 m at Hunstanton in th e west to4.7 m in the east at Cromer (HYDROGRAPHER TOTHE NAVY,1994) . Th e southern North Sea is, however, susceptible tostorm surges which can raise wate r levels considerably abovepre dicte d tid al levels , and at tim es well in excess of the Highest Astronomical Tide. Water levels reached 4.91 m and 5.13m above Ordnance Datum (O.D. = mean sea -level) at WellsQuay in th e storm surges of 1978 and 1953 respectively(STEERS et al ., 1979 ).
Th e field site for th is study was at Stiftkey (Figure 1).
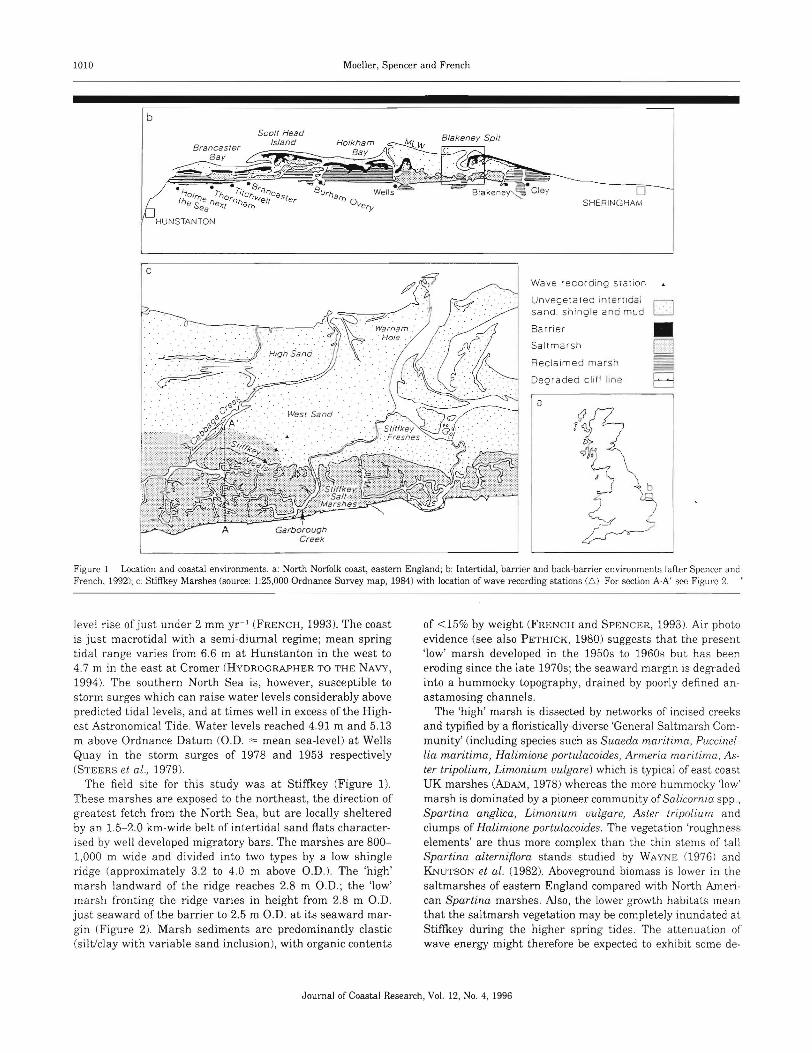
The se ma rshes are exposed to th e northea st , th e direction ofgreatest fet ch from th e North Sea, but are locally shelteredby an 1.5-2.0 km-wide belt of intertidal sand flat s cha racter ised by well developed migratory bars. The marshes are 8001,000 m wide and divided into tw o types by a low shingleridge (a pproximately 3.2 to 4.0 m above O.D.). Th e 'high'marsh landward of the rid ge reaches 2.8 m a.D .; the 'low'marsh fronting the ridge varies in height from 2.8 m a .D.just sea wa rd of the barrier to 2.5 m a .D. at its seaward margin (Figure 2). Marsh sediments are predominantly clastic(silt/clay with variable sa nd inclusion), with organic contents
of <15% by weight (FRENCH and SPENCER, 1993). Air photoevid ence (see also PETHICK, 1980) sugge sts that th e present'low' marsh develop ed in the 1950s to 1960s but has beeneroding since the la te 1970s; th e seaward margin is degradedinto a hummocky topogra phy, dr ained by poorly defined anastamosing channels.
The 'high' marsh is dissected by networks of incised creeksand typ ified by a floristi cally-diverse 'General Saltmar sh Community' (including species such as S uaeda maritima, Puccinellia maritima, Halimione portulacoides, Arme ria ma ritima , Aster tripolium, Limonium vulgare) which is typical of east coastUK marshes (ADAM, 1978) whereas the more humm ocky 'low'marsh is dominated by a pioneer community ofSalicornia spp.,Spartina angl ica, Limonium vulgare, Aster tripolium andclumps of Hali m ione portu lacoides. The vegetati on 'roughnesselements' are thus more complex th an the thin ste ms of tallSp artina alterniflora sta nds studied by WAYNE (976) andKNuTSON et al. (1982). Aboveground biomass is lower in thesa ltma rshes of eastern England compared with Nort h Amer ican Spartina marshes. Also, th e lower growth habi tats meanthat th e sa ltmarsh vegetation may be complete ly inu ndated atStiftkey during the higher spring tides. The attenuation ofwave energy might therefore be expected to exhibit some de-
Journal of Coastal Research, Vol. 12, No.4, 1996
Wav e Att enuation in Sa lt Marshes 1011
A A'
1200
me tre s
1000
---=-:-:-:-:-:---- -
800
~ Si lt and sand
60 0
Majo r Creek
[J Sand
400
o Shing le
20 0
Sh ingle Sandridge flat
_ --- - ----"Hig h " ma rsh --------.....-1y \_ "Low 'iV1ar sh _ \ y
Deg radedc liff lin e
.cOlQ)
I
cioE
Figure 2. Gen era lized cross-section thro ugh the Stiffkey marshes. For locat ion see Fi gure L
pendence on mean wate r level, as well as on th e width of saltmarsh and the inciden t wave energy .
METHODS
Sampling Design
Information on wave per iods, wave heigh ts and mean water level was obtained at three locations along a transect (orientated 44.5° from N) from the shingle ridge across th e 'low'marsh and the sa ndflat a t Stiffkey (F igure 1). Th e middlewave record ing station was located on th e 'low' ma rsh at thernarsh/sandflat tr an siti on, 197 m land ward of th e oute rmostrecord ing stat ion on the tida l fla t. The distance between the
middle sta t ion and the inner station just seaward of the shingle ridge was 180 m. The sandflat betw een th e oute r and themiddle sta tion is un veget ated a nd characte ri sed by sm allscale bedforms developed in res ponse to tidal curre nts an dwaves. Th e 'low' marsh between the middle an d th e innerstation is domin ated by a linear rid ge/mud mound topography. Data were collected over a ran ge of spring tides betweenSepte mber 1994 and May 1995.
Wave Recording and Signal Processing
Wave measurements utilised a 'Dru ck' pr essu re tra ns ducer(series PDCR380) mounted 5 to 10 em above the sa ndflat or
15
~ ~ ~. ~ ~ ~ ~ ¢ ~ ~ 00 ~ ~ N ~ 00 ~ ~ N ~ 00 ~ 7N r~ ~ ~ 0 ~ 00 ~ 0 ~ M ¢ ~ 0 ~ 00 ~
-.----~------------------------------------__. 2015
,.-.. 10 -E{j'-'
'"::0 5'':~;><II
0)
'" 0<II.....::lC.
E0
-5U
-10N0
Time (seconds)
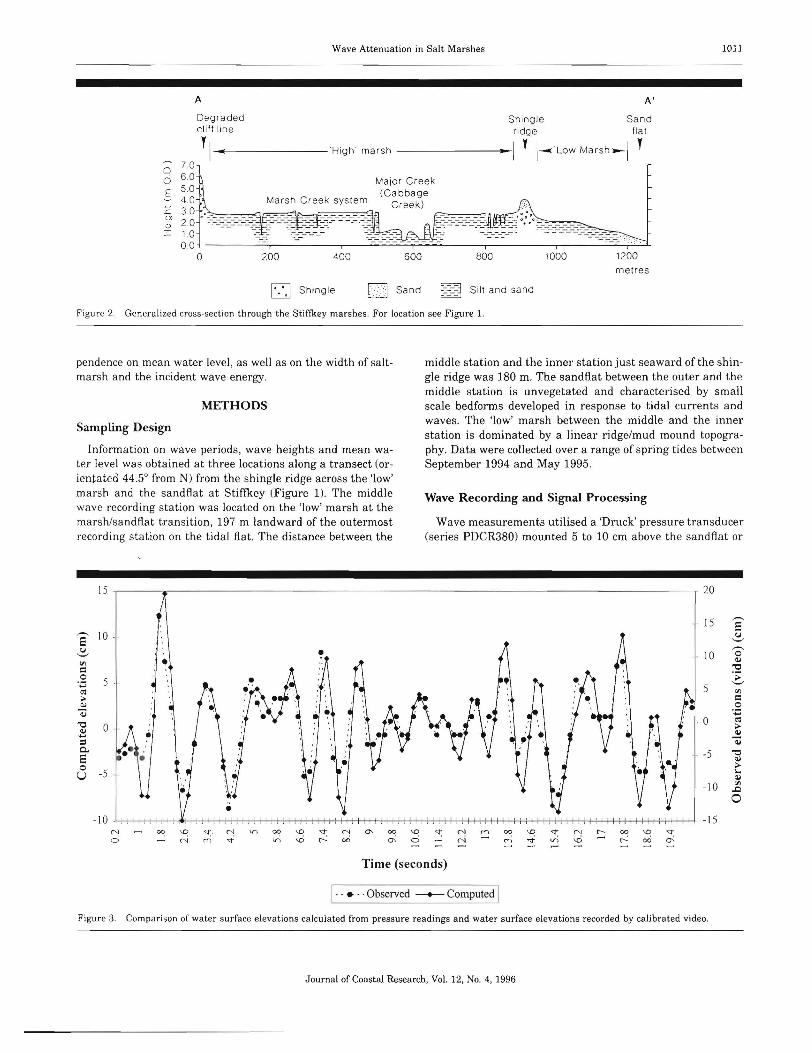
I--• -.Observed -+- Computed IFigu re 3. Comparison of wa ter surfac e elevat ions ca lcula ted from pressure readings an d water surface elevati ons recorded by calibra ted video.
Journal of Coastal Research, VoL 12, No. 4, 1996
1012 Moeller, Spencer and French
a) am tide .bl.Im1..tideouter outer
Nr-.1O r-. 18
.§ 9 ~16'" 8 '"(l) ~ 14:; 7 :::s0 ~ 1236 -
';;::10,£ 5'~ 8'"c 4 c
(l) (l)6"0 3 "0
fD 2g 4...
(l) 1 (l) 2 .,c c~ o · ~ o ·
(") .... '" 00 '" (") '" '" (") .... co 00 '" (") '" '"a N (") .... a "- 00 m a a N (") .... a "- 00 m Cla a a a a a a a a a a a a a a aFrequency (Hz) Frequency (Hz)
middle middle
r-. 10 r-. 18
N~N
9 E 168 'Vi
~ ~ 14:::s 7 :::s0 0 12~ 6 ~
.~ Co 105 'V; 8
c 4 c(l) (l) 6"0 3 "0
>02
>0 4CJ) CJ)... ...
2(l) 1 (l)
c cl.<l 0 l.<l 0
(") .... '" 00 '" t: (") '" so 0 (") .... '" <0 '" r:. (") '" '"a N co .... a <0 m Cl N (") .... a 00 m aa a a a a a a a a a a a a a a a
Frequ ency (Hz) Frequency (Hz)
inner inner
10 · 18r-. r-.N
9~E 16
'Vi 8 ·~
(l) 14:::s 7 :;0 0 12~ 6 ~
101Co 5 .~' V;
8 1c 4 c(l) (l)
6 ·"0 3 "0
>0 >0 4CJ) 2 CJ)... ...(l) 1
(l) 2c cl.<l o . , l.<l o f+;
0 (") -e '" 00 '" co '" '" 0 ('") .... '" 00 '" ('") co '"N ('") .... a r-, 00 m a N (") .... a t-; 00 m aa a a a a a a a a a a a a a a a
Frequency (Hz) Frequen cy (Hz)
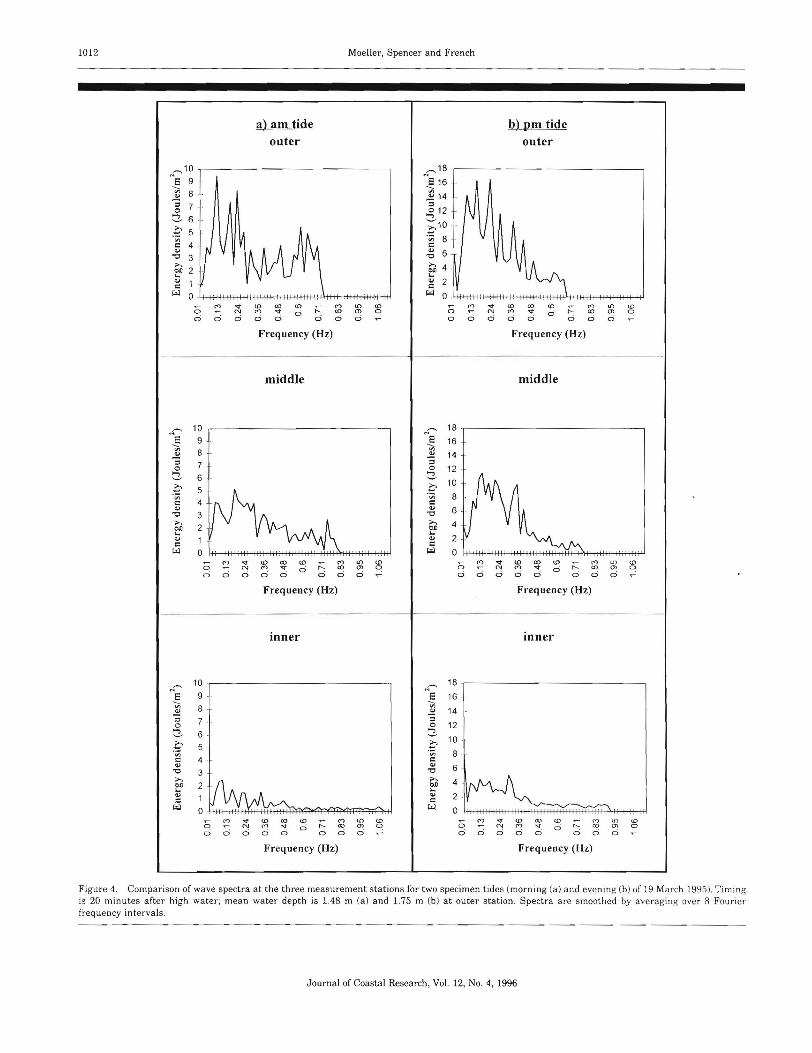
Figure 4. Comparison of wave spectra a t the thr ee measu reme nt stations for two spec imen tid es (morning (a ) an d evening (b) of 19 March 19951. Timingis 20 min utes after hig h water; mean water depth is 1.48 m (a) an d 1.75 m (b) at outer station . Spe ct ra are smoothed by ave raging over 8 Fourierfrequen cy int erv a ls.
J ournal of Coast.al Research, Vol. 12, No. 4, 1996
Wave Attenu at ion in Salt Marsh es 1013
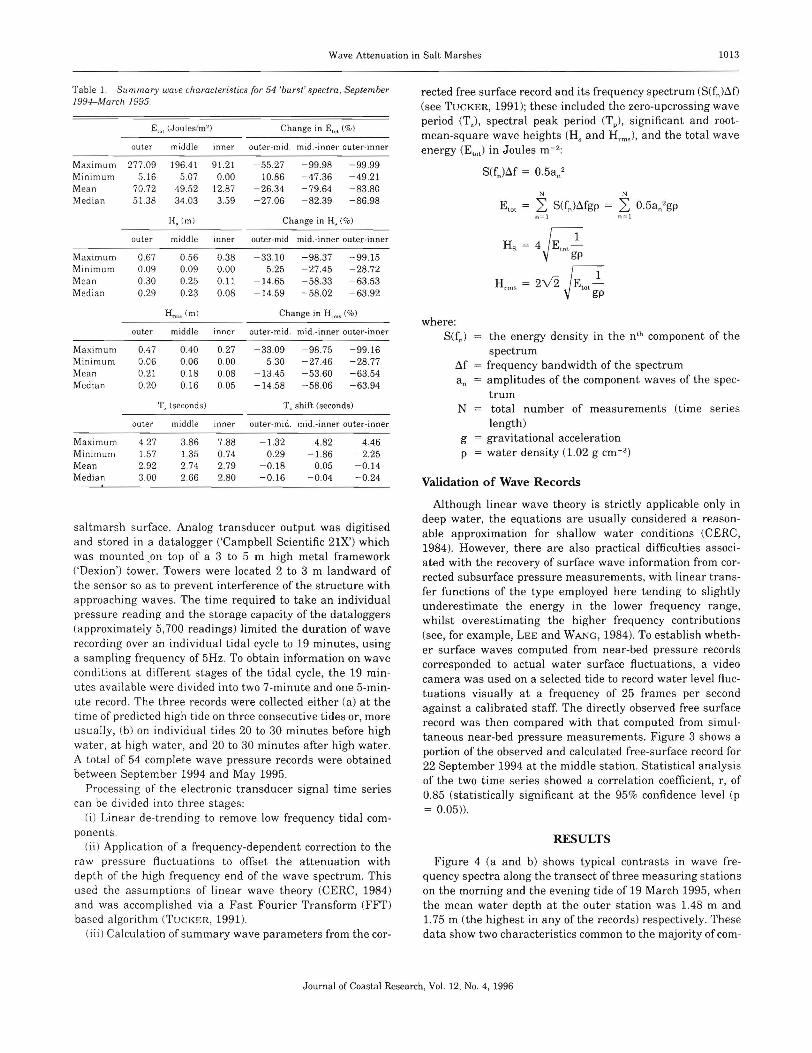
Ta ble 1. Summary wave characteristics (or 54 'burst' spectra, Septem ber1994- March 1995.
E,", (Jo ules/m") Change in E,o' (% )
outer middle inner outer-m id . mid.-inner outer-inner
Maximum 277.09 19641 91.21 - 55.27 -99.98 - 99.99Minimum 5.16 5.07 0.00 10.86 -47.36 - 49.21Mean 70.72 49.52 12.87 - 26.34 -79.64 -83 .80Median 5138 34.03 3.59 -27.06 - 82.39 - 86.98
H,(m ) Change in H. (% )
outer middle inner outer-mid mid.-inne r outer-in ner
Max imum 0.67 0.56 0.38 - 33.10 -98.37 - 99.15Minimu m 009 0.09 0.00 5.25 -27 .45 - 28.72Mean 0.30 0.25 0.11 -14 .65 - 58.33 -63.53Median 0.29 0.23 0.08 -14 .59 - 58.02 -63.92
Hn". (m) Cha nge in H~, (%)
outer middle inn er outer -mid. mid.-inn er outer -inne r
Maximum 04 7 040 0.27 - 33.09 - 98.75 - 99.16Minimum 0.06 0.06 0.00 5.30 -27.46 -28 .77Mean 0.21 0.18 0.08 - 13.45 - 53.60 -63.54Median 0.20 016 0.05 -14 .58 - 58.06 -63.94
T, (seconds) T, shift.(seconds)
outer middle inner outer- mid. mid .-inner oute r-inne r
Maximu m 4.27 3.86 788 - 1.32 4.82 4.46Mini mum 1.57 1.35 0.74 0.29 -1.86 - 2.25Mean 2.92 2.74 2.79 -0.18 0.05 -0.14Median 3.00 2.66 2.80 -0.16 - 0.04 - 0.24
sa ltmarsh surface. Analog transducer output was digitisedand stored in a datalogger ('Ca mpbell Scientific 21X') whichwas mounted on top of a 3 to 5 m high metal framework('Dexion ') tower. Towers were located 2 to 3 m landward ofthe sensor so as to prevent interference of the structure withapproaching waves. The tim e required to take an individualpressure reading and the storage capac ity of the dataloggers(approximately 5,700 readings) limited the duration of waverecord ing over an individual tidal cycle to 19 minutes, usinga sampling frequency of 5Hz . To obtain information on waveconditions at different stages of the tidal cycle, the 19 minutes availabl e were divided into two 7-minute and one 5-minute record. The three records were collected either (a) at thetime of predicted high tide on three consecutive tides or , moreus ua lly, (b) on individual tide s 20 to 30 minutes before highwater, at high water , and 20 to 30 minutes after high water.A tota l of 54 complete wave pressure records were obtainedbet ween September 1994 a nd May 1995.
Pr ocessin g of the electronic transducer signal time seriescan be divided into three stages:
(i) Linear de-trending to remove low frequency tidal components.
( i i) Application of a frequen cy-dependent correction to theraw pressure fluctu ati ons to offset the at tenuation withdepth of the high frequency end of the wave spectrum. Thisused the assumptions of linear wave theory (CERC, 1984)a nd was accomplished via a Fast Fourier Transform (FFT)based algorithm (TUCKER, 1991).
(iii) Calcu lat ion of summa ry wave parameters from the cor-
rected free surface record and its frequency spectrum (S(fn)~f)
(see TUCKER, 1991); these included the zero-upcrossing waveperiod (Tz) , spectral peak per iod (Tpl, significant and rootmean-square wave heights (H, and H,ms), and the total wav eenergy (Eto l ) in Joules m- 2 :
S(fn)M = 0.5a /
N N
Elo l = 2: S(fnlMgp = 2: 0.5an2gp
0 = 1 n ~ l
n, = 4jEl o l 1gp
H~,. = 2\1'2 jEw l 1gp
where:S(fn) = the energy density in the n'" component of the
spect ru mM = frequency bandwidth of the spectruman = amplitudes of the component waves of the spec
trumN = total number of mea surements (tim e series
length )g = gr avitational accelerationp = water density (1.02 g cm- 3 )
Validation of Wave Records
Although linear wave theory is strictly applicable only indeep water, th e equations are usually consid ered a reasonable approximation for sh allow water conditions (CERC,1984). However, there are also practical difficulties associated with the recovery of sur face wave information from corrected subsurface pressure measurements, with lin ear transfer functions of the type employed here tending to slightlyunderestimate the energy in the lower frequency range,whil st overestimating the higher frequency contributions(see, for example, LEE and WANG, 1984). To establish whether surface wave s computed from near-bed pressure recordscorresponded to actual water surface fluctuations, a videocamera was used on a selected tide to record water level fluctuations visually at a frequency of 25 frames per secondagainst a calibrated staff. The directly observed free surfacerecord was then compared with that computed from simultaneous near-bed pressure mea surements. Figure 3 shows aportion of the observed and calculated free -surface record for22 September 1994 at the middle station. Statistical analysisof the two time series showed a correla t ion coefficient, r , of0.85 (sta t ist ically significant at th e 95% confidence level (p= 0.05)).
RESULTS
Figure 4 (a and b) shows typical contrasts in wave frequency spectra along the transect of three measuring sta t ionson the morning and the evening tide of 19 March 1995, whenthe mean water depth at the outer station was 1.48 m and1.75 m (th e high est in an y of th e records) respectively. The sedata show two characteristics common to the majority of com-
Journal of Coastal Research, Vol. 12, No.4, 1996
1014 Moeller , Spencer and French
250.00 .---- - - - - - - - - - - - - - - - - - - - - - - - - - - - - - - -
i· outer
l' mmiddle
Dinner
50.00 -t-t-_ _ I ,--- _ __, - 0 1 t - _ _- 1 ...~ - I-55 I
~
[-97 I~ _ ;gt=J _ Mi
I -,- ......,.E E ~ E ~ E (;;' .---,
.D0. 0. 0. 0. ~ V;en en en en en en <Jlo, o-. c- o-: o, o- ::; ::;'" '" '" '" N ;; .D e0 0 0 0 0 ......,o-: 0 00 '" 00 -o
EN - 0 - 0~oj
'!" -e-~ o-.o- o-.0 0
Date and time of tideN NN N
200.00
rr-;
~] 150.00::so
2.>.eo1-<
;g 100.00v-;
1-<
t5v0..if)
"2o
f-<
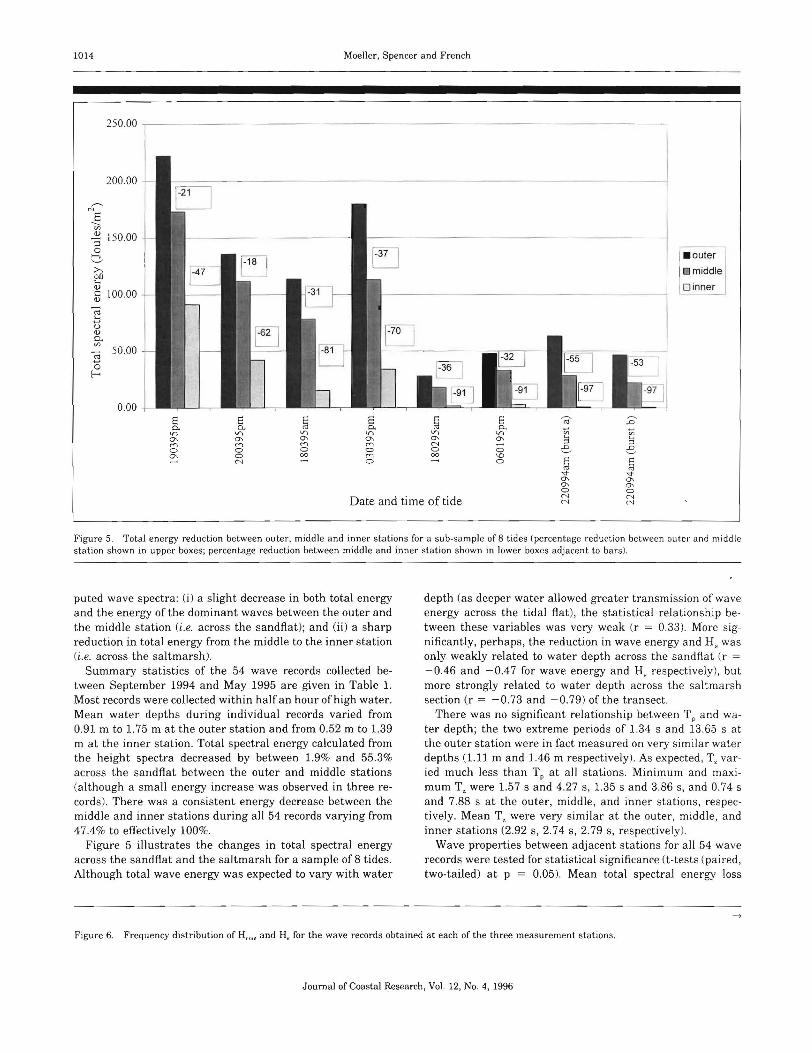
Figu re 5. Total energy reduct ion betw een outer , middle and inne r stations for a sub-sam ple of 8 ti des (percen tage re duct ion betw een oute r an d midd lesta tion shown in upper boxes; per centage reduction bet ween middl e and inner station shown in lower boxes adja cent to ba rs ).
puted wave spectra: (i) a slight decrease in both total energyand the energy of the dominant waves between th e outer andthe middle station (i .e. across th e sandfiat); and (ii) a shar preduct ion in total energy from the middl e to the inner sta tion(i .e. across th e sa ltma rs h ),
Summary sta t isti cs of th e 54 wave records collected between September 1994 and May 1995 are given in Table 1.Most records were collected within half an hour of high water.Mean water depths during individual records varied from0.91 m to 1.75 m at th e outer station and from 0.52 m to 1.39m at th e inn er station . Total spect ra l energy calculate d fromthe height spectra decreased by between 1.9% and 55.3 %across the sandflat between the outer and middle sta t ions(although a small energy increase was observed in three records) . There was a consiste nt ene rgy decrease between themiddl e and inn er stations du ring all 54 records varying from47.4% to effectively 100%.
Figure 5 illu strates the chan ges in total spectral energyacross th e sa ndflat and th e saltmarsh for a sample of 8 tides.Alth ough total wave energy was expected to vary with water
depth (as deeper water allowed grea te r transmission of waveenergy across th e tidal flat), th e statistical relationshi p between th ese variabl es was very weak (r = 0.33). More significantly, perhaps, the reduct ion in wave energy and H, wasonly weakly related to water depth across the sand flat (r =-0.46 and -0.47 for wave ene rgy and H, respe ctively), butmore strongly related to water depth across the sal tmarshsection (r = -0.73 and -0.79) of the tran sect .
Th ere was no sign ificant relationship between T p and water depth; th e two extreme periods of 1.34 s and 13.65 s a tthe outer station were in fact measured on very sim ilar waterdepths (1.11 m a nd 1.46 m respectively ). As expected, 'I', varied much less than 'I', at all sta tions . Minimum an d maximum 'I', were 1.57 s and 4.27 s, 1.35 sand 3.86 s, and 0.74 sand 7.88 s at th e outer , middl e, and inn er sta tions, respectively. Mean T, were very simila r at th e outer , middl e, a ndinner stat ions (2.92 s, 2.74 s, 2.79 s, respectively).
Wave prop erties between adjacent sta t ions for all 54 waverecords were tested for sta t ist ical sign ificance (t-tes ts (pai red,two-tailed) a t p = 0.05 ). Mean total spect ra l energy loss
->
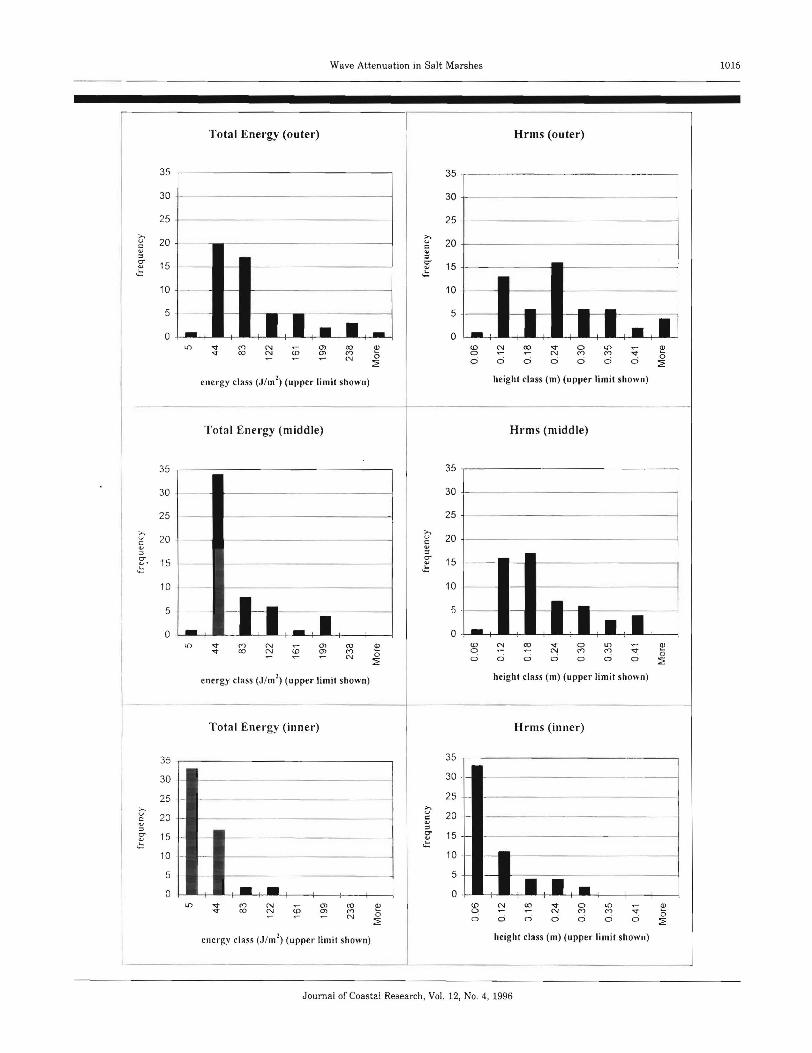
Figure 6. Frequ ency distribution of H,m, and H, for th e wave recor ds obta ined a t each of th e three mea surement sta tio ns .
J ournal of Coastal Resea rch , Vol. 12, No.4, 1996
Wave Attenuation in Salt Mar shes
Total Energy (outer)
1015
35
30 -
25
>.'-' 205:::l
:if 150::
10
5
0ll) ..;- '" N <0 (J) co ~-sr co N (J) '"N 0
:2
en ergy class (Jim') (upper limit sh own )
Total Energy (middle)
35 -
30
25
>.'-' 20c:
'":::l:if, 15.::
10
5
co
'"Nenergy class (Jim ') (upper limit shown)
Total Energ y (inner)
- -- -
- -
35
30
25C 20c:
'":::l:if 150::
10
5
0C'1co N
N(J)(J)
coC'1N
ene rgy clas s (Ji m' ) (upper lim it shown)
J ournal of Coasta l Research, Vol. 12, No.4, 1996
1016 Moeller, Spencer and French
across the sandflat (approximately 26%) differed significantlyfrom that across the saltmarsh (approximately 79%). The reduction in H, across the sandflat (mean reduction 13.5%) differed significantly from that across the saltmarsh (53.6%).H"n>< reduction across the sandflat (14.6%) also differed significantly from that across the saltmarsh (58.3%). Frequencyhistograms of these height parameters are given in Figure 6.
CONCLUSIONS
The dataset reported here represents the first comprehensive quantitative investigation of wind wave attenuation overa European saltmarsh. A relatively low-cost data acquisitionsystem proved reliable in all conditions and, with carefulpost-processing of the raw pressure series, yielded a good correspondence between calculated and independently observedsurface wave parameters.
Large reductions in both wave height parameters and totalwave energy occur across the instrumented intertidal profile.The wide tidal flat at Stiftkey is clearly important in reducingthe wave energy incident upon the marsh edge, and measurable attenuation of wave energy occurred even over the upper200 m of the flat. The rate of energy and height attenuationwith distance is much higher over the vegetated marsh, however. Because of the different transect lengths studied, it isdifficult to make direct comparisons with the previous fieldobservations in Spar/ina alterniflora marshes (WAYN~~, 1976;KNUTSON et al., 1982) and laboratory model experimentsrBRAMPToN, 1992). The mean wave energy loss of 80% overthe 180 m marsh surface transect, whilst substantial, clearlyimplies a lower rate of attenuation than that observed inSpar/ina alterniflora marshes. Comparison with the scalemodel experiments referred to by BRAMPTON (1992) is complicated by the relative large deepwater wave heights simulated (H, = 1.75 m, compared to the maximum H, of 0.67 mobserved at the outer tidal flat station at Stiftkey).
Further work is needed to examine the changing rate ofwave modification with distance landwards across the saltmarsh surface, and additional data are required under higherincident wave energies in order to derive a more usable setof design criteria for the incorporation of saltmarshes into seadefence works. The increased surface roughness characteristic of saltmarshes is likely to be most effective in attenuatingwaves at low to intermediate water depths or during conditions of high incident waves (i.e. high wave height to waterdepth ratios). This view is supported in this study by themore significant negative correlation between water depthand wave attenuation across the saltmarsh than across thesandflat. Further analysis of the presented dataset (includingmeteorological conditions and information on marsh vegetation) will be carried out to establish the importance of smalldifferences in marsh surface elevation. In contrast to marshsurface elevation, the width of the marsh may be far moreimportant in determining the effectiveness of a saltmarsh inbuffering wave energy.
It is now important to extend these studies to other fieldlocations, and to acquire a larger dataset that allows moreexperimental control over the relative effects of marsh width,height, vegetation characteristics, and incident wave energy.
ACKNOWLEDGEMENTS
We are grateful to the National Trust and English Naturefor permission to work at Stiffkey and to NA Arnold, A Dolphin, AL Murray and G Smith for logistic assistance. Thiswork has been carried out under support from the NaturalEnvironment Research Council (NERC Research StudentshipNo. GT4/93/7/P to 1M) and the National Rivers Authority (Anglian Region Operational Investigation 5G9l.
UTERATURE CITED
AUAM, P., 1978. Geographical variation in British salt marsh vegetation. Journal of Ecology, 66, :3:39-:366.
BRAMPTON, A.H., 1992. Engineering significance of British saltmarshes. In: ALLEN J.RL. and PYI-:, K (cds. I. Salt marshe»: Morphodynamics, conservation and engineering signilicance. Cambridge: Cambridge Uni versity Press, pp. 115-122.
BURD, F., 1995. Managed retreat: 11 practical guide. Peterborough:English Nature, 28 p.
CERC (COASTAL ENGINEEIlIN(; R":SI-:AH('II CI':NTI-:H I, 1984. ShoreProtection Manual (4th editionJ. U.S. Arrny Corp of Engineers:U.S. Government Printing Office: Washington, DC.
DI,JKEMA, K.S., 1987. Geography of salt marshes in Europe. Zeitschri]t fur Geomorphologic, NF. 31, 489-499.
FR~:NCH, J.R, 1993. Numerical modelling of vertical marsh growthand response to rising sea-level, Norfolk, UK Earth Surface Processes & Landforms, 18, 63-81.
FRENCII, J.R and SPENCER, T., 1993. Dynamics of sedimentation ina tide-dominated backbarrier salt marsh, Norfolk, UK. Marine Geology, 110,315-331.
HYDROGRAPHEIl TO TilE NAVY, 1994. Tide Tables. vhlulll" 1: European Waters.
KNUTSON, P.L.; BROCHU, RA.; SEELI(:, W.N., and INSKEIo:I', 'M ..1982. Wave damping in Spartina altern iflora marshes. Wetlands.2, 87-104.
LEE, D-Y. and WANG, H., 1984. Measurement of surface waves fromsubsurface pressure. Coastal Engineering. 272--286.
PETHlCK, J.S., 1980. Saltmarsh initiation during the Holocene transgression: the example of the North Norfolk marshes, England.Journal of Biogeography, 7, 1-9.
PETHICK, J.S., 1992. Saltmarsh geomorphology. In: ALLEN, ,J.RL.and FYE K. (eds.), Saitmarshe«: Morphodvnarnic«. coneercationand engineering significance. Cambridge: Cambridge UniversityPress, pp. 41-62.
SPENCER, T. and FRENCH" J.R, 1992. Geomorphicallv-informcd conservation of coastal depositional landforms and associated habitats. In: STEVENS, C.; GORDON, J.E.; GREEN, C.P. and MACKLI~,
M.G. (eds.), Conserving our landscape. Proceedings or the conference 'Conserving Our Landscape: Ecoloing Landform» and lee-AgeHeritage' (Crewe, UK, May 1992l. Peterborough: English Nature,pp.69-73.
STEERS, J.A.; STODDART, D.R; BAYLISS-SMITH, T.P.: Sl'~:N(,EI(, T..and DURIlHlm;£,:, P.M., 1979. The storm surge of 11 January 1978on the east coast of England. Geographical Journal. 145, 192-205.
TUCKER, M.J., 1991. Wav"s in ocean engineering. Measurement, analysis. interpretation. Chichester: Ellis Horwood, 4:31 p.
W1\ YNE, C.J., 1976. The effects of sea and marsh grass on wave energy. Coastal Research Notes. 14, 6-8.
Journal of Coastal Research, Vol. 12, No.4, 1996