wind river workbench note workbench offers: best-in-class capability at each phase of the...
TRANSCRIPT

Product note
Workbench offers:
Best-in-class capability at each phase of the development process, including hardware bring-up, firmware development, application software development, advanced visualization, system diagnostics, and testBroad availability to support increased standardization across projects
Multiple-target operating system support, including support for VxWorks 5.5, VxWorks 6.x, and Linux Target processor support for ARM, IA/Pentium, MIPS, PowerPC, SH, and XScale processorsPlug-in architecture enables additional target operating system, target processor, and target connection support to be added
An extensible framework, based on Eclipse, to seamlessly integrate third-party and in-house plug-ins for total customization and scalability
Workbench addresses the challenges individual developers and project teams face by increasing productivity, enabling collaboration between hardware and software developers, and meeting diverse development needs across an enterprise. The development suite is backed by Wind River’s 20+ years of device software industry experience, a world-class support organization, and a specialized professional services team.
new in wind river workbench 2.5Workbench 2.5 includes significant new capabilities in support of increased development team productivity:
General Workbench enhancementsUpdated to Eclipse 3.1.2Flexible managed build supportTeam-sharing of static analysis dataSupport for C/C++ code templates in the editorvi-compatible mode in the editor
VxWorks platform integrationExpanded VxWorks 6.x processor supportEdit, compile, and debug support for VxWorks 5.5 for PowerPC targets on Windows hostsImproved kernel configuration editor
•
•
-
-
-
•
•-----
•--
-
Linux platform integrationExpanded processor supportImproved project setupEnhanced kernel configuration toolsUser space configuration tool for RPM configurationCore file debuggingUser mode debug over USBCore file analysisTighter integration of ScopeTools with Linux kernel and file system configuration
On-chip debuggingWind River TraceScriptingAuto-attach to core; workflow enhancementLinux kernel debug on ARM 9 and 11 via on-chip debuggingExpanded processor support, including the following new architectures, new processor families, and new processors:
Atmel; AMCC PPC44x additions; ARM 11; Broadcom BCM 11xx, 74xx, and 73xx additions; Freescale i.MX36, MPC83xx, MPC85xx, and MCF5xxx additions; Intel IOP 3xx additions; Marvell MV88F5181; Philips PNX additions
New Workbench productsWorkbench Unit Tester support for VxWorks 5.5Workbench Diagnostics for Linux and VxWorks 5.5
included in wind river workbench
Application ComponentsWind River Workbench 2.5 offers the following capabilities and components:
Eclipse frameworkProject SystemBuild SystemEditorSource Code AnalyzerWind River Compilers
Wind River Compiler (for VxWorks 6.x and other target operating systems)Wind River GNU Compiler (for VxWorks and Wind River Linux platforms)
Wind River Debugger
•--------
•-----
•
•--
••••••
-
-
•
wind river workbench
Wind River Workbench is the device software industry’s premier open, standards-based development suite. Through its powerful combination of capabilities, integration, and availability, Workbench enables organizations to standardize on a common environment for device software development, helping developers, project teams, and enterprises improve their effectiveness.
rev. 06/2006
Wind River World Headquarters, 500 Wind River Way, Alameda, CA 94501 Toll-Free: 1-800-545-9463 Phone: 1-510-748-4100 Fax: 1-510-749-2010 [email protected] NASDAQ: WIND © 2006 Wind River Systems, Inc. 2
Wind River shell environmentsScopeTools
StethoScope for data analysisMemScope for memory analysisProfileScope for performance analysisCoverageScope for code coverage analysisTraceScope for code execution flow analysis
Wind River System Viewer for system event visualizationWorkbench Unit Tester for unit and integration testWorkbench Diagnostics for dynamic instrumentation and root-cause analysisWind River on-chip debuggers
Wind River ICEWind River ProbeWind River Trace
Eclipse FrameworkBecause of its openness, capability, and strong community support, Eclipse was chosen as the framework for the Wind River Workbench development suite. The Eclipse 3.1.2 framework supplies the necessary infrastructure to graphically and functionally integrate the components of Workbench. Open, extensible, and backed by a strong community of commercial and open-source developers, the Eclipse framework provides developers using Workbench with a wide range of additional integrated functionalities.
Eclipse integrated capabilities are provided by commercial development tool providers (such as IBM, Hewlett-Packard, and Borland) and an active developer community. As a result, developers have access to a wide range of value-added plug-ins from third-party and in-house sources that can be used to extend the capabilities of Wind River Workbench. Examples include Eclipse-integrated configuration management (CM) systems and editors, which offer simple plug-in integration with Wind River Workbench through standard Eclipse interfaces.
••
-----
•••
•---
More information on Eclipse and available third-party plug-ins is available from the Community Projects and Plug-Ins section of the Eclipse website, among other resources:
http://www.eclipse.org http://www.eclipse-plugins.info/eclipse/index.jsp http://www.eclipseplugincentral.com
In many cases, users will need to validate the utility and compatibility of these plug-ins with Wind River Workbench.
Project SystemThe Workbench Project System allows developers to organize and manage the primary components in a device software development project, including source files and target systems. By design, Workbench enables users to manage multiple projects simultaneously.
Features of the Project System include:
Drag-and-drop manipulation of projects to increase speed and enhance simplicityWizards and templates to accelerate setup of common project types, including downloadable kernel modules (DKMs) and real-time processes (RTPs) for VxWorks 6.xThe ability to import projects from existing Tornado 2.2 and SNiFF+ 4.x application projects to DKM or RTP projects, saving the time that would be needed to manually re-create them; this includes the ability to migrate toolchains (Wind River GNU to Wind River Compiler or vice versa) at the same timeThe ability to share projects among team members, enabling parallel development; each team member can work in one or more workspaces with local copies of source files, builds, and debuggingThe ability to work with multiple projects in a workspace simultaneously, reducing redundant setup and configuration and eliminating wasted time between projectsThe ability to provide project types to create native applications for executables, libraries, DLLs, and shared librariesAutomatic version control to keep track of changes, reduce errors, and allow restoration of previous project environmentsUse of structured projects that reflect the build hierarchy by linking subprojects to multiple parents, so you can easily see the relationship between the project and the way it is builtThe ability to provide and associate different build rules with different components of a projectEasy identification, visualization, and management of changes to the hierarchy of files, folders, and projectsAbility to update workspace and project data via the command line
•
•
•
•
•
•
•
•
•
•
•
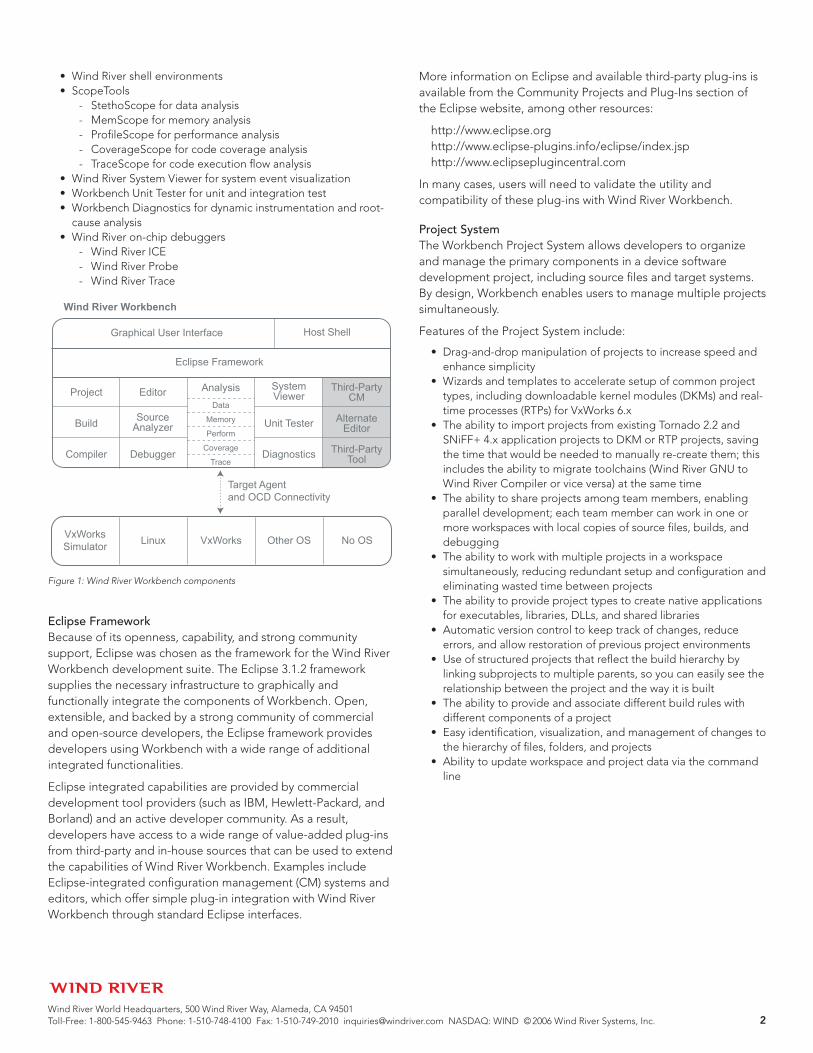
Target Agent and OCD Connectivity
Wind River Workbench
VxWorks Simulator VxWorks Linux Other OS No OS
Graphical User Interface Host Shell
Eclipse Framework
Project
Build
Compiler
Editor
SourceAnalyzer
Debugger
Analysis SystemViewer
Unit Tester
Diagnostics
Third-PartyCM
AlternateEditor
Third-PartyTool
Data
Memory
Perform
Coverage
Trace
Figure 1: Wind River Workbench components

Wind River World Headquarters, 500 Wind River Way, Alameda, CA 94501 Toll-Free: 1-800-545-9463 Phone: 1-510-748-4100 Fax: 1-510-749-2010 [email protected] NASDAQ: WIND © 2006 Wind River Systems, Inc. �
Build SystemThe Workbench Build System specifies the tools, options, and parameters to use when building device software projects, enabling you to set build parameters easily from the project level down to the individual file level. The Build System allows for use of simple global build-setting, fine-grained control at the level of an individual file, and everything in between.
Features of the Build System include:
Managed application build process, based on make, is simplified through a series of wizards and self-guided dialogs—through the build system, you can specify how you want to generate Makefiles specific to a projectAutomatic generation of dependencies (compiler-dependent)The capability to generate include search paths through source code analysisGUI configuration of build tools and build specifications that can be designated at the project, folder, or file level, with property sheets for advanced customizationCompiler configuration GUI that allows custom compiler target and optimization settings to be specified at the project, folder, or file level; GUI supports both Wind River Compiler and Wind River GNU CompilerEasy switching between build specificationsMultiple targets supported per project, including specific build settings, selective objects list, and custom link ordering for each targetCommand line build capability for scripted and nightly buildsDefault settings, which shorten the time to an initial build; the most frequently used settings are set as defaultsShared Library build supportCustom link order, file-level build, settings, and multiple build targets give you expert-level control and customizabilityWizards to create new projects, such as shared libraries, VxWorks file system, downloadable modules, bootable ROMs, and RTPsOption for user-defined builds using existing MakefilesSupport for remote builds
•
••
•
•
••
••
••
•
••
EditorThe Workbench Editor provides state-of-the-art editing capabilities, including a number of performance-enhancing features—such as code completion, parameter hinting, and syntax highlighting for source files—that serve to speed the development process and make the edit-compile-debug cycle less frustrating and prone to error.
Since the Workbench Editor is fully integrated with the Project System, Build System, Source Code Analyzer, and Debugger, you can use it to perform all source-code-oriented tasks.
Features of the Workbench Editor include:
Code completion enabled by source code analysis:Provides reasonable proposals for code symbols (macros, functions, methods, variables) that could be used at the given locationTakes the current scope into accountReduces typos and repetitive typingIncludes parameter hinting that provides visual help, identifying the parameters expected in the argument list, including VxWorks 6.x and external API calls
Code foldingAbility to perform active vs. inactive code analysis in the editor by highlighting code disabled by macrosSyntax highlighting, which identifies language keywords and constructs, including comments, strings, and constantsExtremely configurable, so you can change key bindings, font type, font size, color scheme, and syntax coloringOther editor views include:
Line numbersNon-printable charactersDebugger breakpoints and program counter
Symbol highlighting with integrated navigation capability:Symbols can be filtered by file, type, and nameSymbols can be searchedSymbols are an entry point to the editor and provide a way to navigate within the editorNavigation is allowed between different types of symbols (e.g., definition and declaration, base and derived objects, overloaded and overridden symbols, defined and instantiated objects)
•-
---
••
•
•
•---
•---
-
Figure 2: Wind River Workbench
Figure 3: Workbench Build System

Wind River World Headquarters, 500 Wind River Way, Alameda, CA 94501 Toll-Free: 1-800-545-9463 Phone: 1-510-748-4100 Fax: 1-510-749-2010 [email protected] NASDAQ: WIND © 2006 Wind River Systems, Inc. �
Editor emulationsComplete vi emulation mode, including keyboard shortcuts and command line modeEmacs keyboard shortcuts
Support for third-party editors through use of Eclipse plug-insSupport for large source filesSupport for multiple-byte characters
Source Code AnalyzerTo improve productivity and reduce costs, organizations strive to reuse as much legacy code as possible, incorporate significant third-party code into their products, integrate software components from multiple developers into a single application or system, and increase developer understanding of code components to reduce integration and debug time.
The ability to quickly and completely understand code written by someone else—or to assess the impact of a change under consideration—is vital to development productivity. Wind River Workbench source-code analysis capabilities enable this function. Integration of these capabilities into the editing and debugging functions of Workbench speed both code creation and debugging.
Features of the Source Code Analyzer include:
Proven and mature source-code analysis technology from SNiFF+ (no compilation required)Fault-tolerant source-code parsing that accurately analyzes incomplete source code and source code that cannot be compiledPrecise evaluation of macros and complex C/C++ constructs using the context of the current build settingsSource-code completion and parameter hinting for C/C++, even for source code not loaded into the development environment, such as OS header filesSymbol-based source navigation based on static analysis of codeSymbol highlighting in the editor based on static analysis of codeHigh-quality cross-referencing, including:
•-
-•••
•
•
•
•
•
•
•
Support for any type of code symbol, including functions, variables, method, and macrosRefers-to and referred-by informationComplete and accurate cross-reference data, including external declarationsNavigation between references in the source codeAbility to look up symbol definitions from within any part of the development environmentDisplaying the file to which a reference belongsIdentity of symbol reference type for any variable (read, write, read and write)Tool tips for symbols to show symbol declarationsVirtual methods (object-oriented languages) included in the list of references for a variable
C/C++ parser support for pre-processing source code and handling various dialectsAbility to perform active vs. inactive source-code analysis in editorBackground parsing without blocking the development environmentVisualization of source and header file include diagramsDependency trees that aid in analyzing the impact of code changesClass hierarchy browsing:
Inheritance relationships (derived from)Class contents (data members, member functions)Ability to filter the hierarchy tree
Symbol definition lookup and quick source-code navigation to reduce comprehension time of less familiar codeFilters and collapsible or expandable views to avoid information overloadSource browsing features with local C/C++ symbols (e.g., local variables)Ability to parse the entire source of the Linux and VxWorks kernels, providing increased visibility into system operationSupport for C, C++, Assembler, and AdaSource-code analysis features that are directly accessible within the Workbench Debugger, providing additional perspective during debugHigh-speed text search-and-replace tool (Retriever)Improved accuracy of parsing during source-code analysis using build settingsRefactoring support for symbol rename
-
--
--
--
--
•
••
••
•---
•
•
•
•
••
••
•
Figure 4: Workbench Editor
Figure 5: Workbench Source Code Analyzer
Wind River World Headquarters, 500 Wind River Way, Alameda, CA 94501 Toll-Free: 1-800-545-9463 Phone: 1-510-748-4100 Fax: 1-510-749-2010 [email protected] NASDAQ: WIND © 2006 Wind River Systems, Inc. 5
Wind River CompilersWind River provides two compilers for use in Wind River Workbench when developing with VxWorks 6.x: Wind River Compiler and Wind River GNU Compiler. Both compilers are included and supported as part of Wind River Workbench for VxWorks 6.x.
Wind River CompilerWind River Compiler is the default C/C++ compiler configured for building the VxWorks 6.x kernel, libraries, board support packages, and applications in Wind River Workbench. It also supports stand-alone (no RTOS) development. This compiler’s optimization capabilities are based on and extend the industry-hardened Diab compiler technology, and it produces robust, tight, and fast-executing code.
Features of Wind River Compiler include:
Superior optimization technology to generate fast, compact, high-quality code100 percent compatibility with the latest ANSI C++ specs (ISO/IEC 14882:1998(E) C++ standard) and the ANSI C spec (X3.159-1989)Standards conformance (ANSI and EABI) for maximum tool interoperabilityComplete control of code and data memory allocationPosition independent code (PIC) and position independent data (PID) supportProven performance with VxWorks
Wind River Compiler also supports run-time error-checking that detects and corrects hard-to-find problems, such as memory leaks and out-of-bounds pointers, to aid in producing higher-quality code.
For more detailed information, please see the Wind River Compiler Product Note.
Wind River GNU CompilerWind River GNU Compiler is based on the Free Software Foundation (FSF) distribution of gcc and g++. It provides support for VxWorks 6.x and Linux. Wind River has modified an off-the-net version of gcc specifically for use with VxWorks 6.x. The primary areas of modification deal with support for RTPs and shared libraries.
Features of Wind River GNU Compiler include:
cpp, the C preprocessorgcc, the C and C++ compilerld, the programmable static linkeras, the portable assemblerbinary utilities
Wind River DebuggerThe Wind River Debugger addresses the common and unique needs of developers involved with hardware bring-up, firmware/driver/BSP development, kernel development, and application development. It incorporates the feature set of best-in-class on-chip debugging environments, source-level debuggers, and target OS-aware development environments.
•
•
•
••
•
•••••
The Wind River Debugger combines the power of a direct hardware on-chip debug connection and a target agent connection, providing the ability to debug complex environments and complex device software applications. Innovative multi-context debugging capabilities allow developers to debug code running in multiple contexts simultaneously. Multiple contexts means any of the following:
Multiple coresMultiple tasks/processes/threadsMultiple physical processorsMultiple processor typesMultiple boardsMultiple target operating systems
With support for on-chip-debugging-based and target-agent-based debugging in the same environment, Workbench gives you access to a wider range of debugging options than any single debug method can provide. For example, you can use the Wind River Debugger connection to on-chip debugging to bring up new hardware designs and develop board initialization code, code for ISRs, code for device drivers for the kernel, and code for bootloader applications. You can use the Wind River Debugger target agent to task mode debug a user application—and also be able to switch to the JTAG connection and determine the state of the target, if it suddenly crashes and takes the target agent down with it.
Wind River also allows you to connect to a target running VxWorks 6.x using Transparent Mode Driver technology, in which a virtual connection is made to the target agent through the on-chip debugging hardware and connection. Workbench includes the ability to debug VxWorks 6.x targets via full kernel, task, and real-time process (RTP) debugging, including visibility and synchronous control of tasks associated to an RTP, as well as full kernel and user mode debugging of Linux targets.
Tracking down kernel and interrupt handler bugs is difficult and time-consuming. A solid kernel mode debugging solution can save days or weeks in comparison to printf/printk, which requires multiple edit-compile-debug cycles. Workbench offers both on-chip debugging and software debugging capabilities for Linux kernel debug.
User applications (both VxWorks and Linux) involve multiple interacting tasks/processes, so debugging these applications is greatly enhanced if more than one process or task can be debugged concurrently. The Wind River Debugger offers best-in-class kernel and user application debugging for both VxWorks 6.x and Linux.
Other Eclipse-based development environments allow only one view of each type to be present within the perspective at one time, forcing you either to view relevant data for one processor, process, or thread at a time, or to place the data from multiple debug targets into a single view. Wind River has created colored differentiated instances of each debugger view, allowing up to eight instances of each view.
••••••

Wind River World Headquarters, 500 Wind River Way, Alameda, CA 94501 Toll-Free: 1-800-545-9463 Phone: 1-510-748-4100 Fax: 1-510-749-2010 [email protected] NASDAQ: WIND © 2006 Wind River Systems, Inc. �
Wind River Debugger administration features enable:
Multiple-window instantiation, with user-defined labeling/color, user-controlled manual/automatic updateColor highlighting of changed value in any displaySaved workspace settings by saving and restoring the state of the debugging environmentOption to disable window updates on breakpoints or when execution stopsData tip support when in an appropriate stopped mode
C++ debugging capabilities include:
Ability to debug code containing namespacesSupport resolution of ambiguous namespacesDebugging of derived classesBreakpoint support for a single in-line functionSupport for stepping in-line functionsDebugging of templatesBreakpoint supportIn-lined template functionsDebug implicit and explicit instantiations
To provide additional debugging capabilities, Wind River has taken object browsing and inspection capabilities from earlier Wind River products and focused them on the key areas necessary to provide world-class support for debugging VxWorks 6.x and Linux-based applications. With the object browsing capability, Wind River Debugger can inspect:
RTPsObjectsTasksShared librariesSemaphoresWatchdog timersMessage queuesMemory partitionsModulesSymbolsISR objectsTriggersFile descriptorsI/O devices
Features of Wind River Debugger include:
Basic execution control (step into, step over, step out, go, and stop)Advanced execution control (go all, stop all)Full-featured source-level, assembly-level, and mixed-mode debuggingComprehensive debugging views:
Watch viewBreakpoint view
Software breakpointsHardware breakpointsNumber of software breakpoints limited only by host and target resourcesCounted breakpoints
Global variable viewLocal variables viewRegister viewStack view
•
••
•
•
•••••••••
••••••••••••••
•
••
•--
•••
•----
Task viewMemory viewFunction viewModules view
Target selector facility/target connection dialog/wizardsSpecific support for debugging multiple execution paths or contextsWind River Debugger target agent (see details below)Debug multiple processors, multiple threads/tasks, and multiple processes simultaneously, without having to detach and reattach to different execution pathsAttach to and debug multiple VxWorks 6.x RTPs and tasksDebug code in shared librariesSeparate debug views for each execution path within the same debugger pane; each view can be organized for ease of comprehensionTrue multiple-context debugger with simultaneous viewing and control of real-time data relevant to each entity being debuggedDebugging via multiple simultaneous target connections to processors and target boards, each of which can be using a different operating system
Wind River Target Debug Agents for Linux Wind River Workbench and Wind River Linux platforms together provide extensive debugging capabilities for the kernel, kernel modules, and user mode applications. User mode applications are supported using an advanced agent based on the ptrace API. Advances in Linux 2.6 kernel multiple-threading enable developers to debug individual threads reliably inside processes without stopping the entire process. Because ptrace is applicable only with the debugging of applications in user mode, another method is required for debugging the kernel.
Kernel debugging for Linux 2.6 kernels, including device drivers, kernel modules, and interrupt handlers, is achieved by using the open-source “KGDB-2” agent, or the kernel-debugging version of GDB. With standard debugging tools, this would be an issue, as connecting to KGDB is not typically performed using the same debugger as the one used for user mode applications. Workbench’s multiple-context technology allows multiple simultaneous target connections, allowing a simultaneous
----
••
••
•••
•
•
Figure 6: Wind River Debugger

Wind River World Headquarters, 500 Wind River Way, Alameda, CA 94501 Toll-Free: 1-800-545-9463 Phone: 1-510-748-4100 Fax: 1-510-749-2010 [email protected] NASDAQ: WIND © 2006 Wind River Systems, Inc. �
connection to KGDB-2 and the target agent through the same interface. Workbench provides the synchronization necessary to debug a multiple agent connection in a synchronized manner, despite the fact that multiple target debugger agents are in use.
Wind River Target Debug Agent for VxWorksVxWorks 6.x requires a robust debugging agent capable of debugging one or more tasks within one or more real-time processes. The debug agent must be able to provide this functionality across multiple memory boundaries protected by hardware MMUs. Wind River has extended the capabilities of the wdb agent used in previous versions of VxWorks to include debugging and controlling one or more tasks contained within an RTP or multiple RTPs. At a high level, RTPs can be selected and controlled with specific actions: For example, issuing a “run” or a “stop” command results in the overall control of each task state within the RTP. Tasks can also be individually selected within an RTP and debugged without stopping any other tasks. Breakpoints can be created that are only detected when code is executed within the context of a specific task or RTP, greatly simplifying the debugging of a complex device design.
Additional capabilities of Wind River Debugger include:
Kernel and user debuggingMulti-process debugging through a single debuggerAbility to debug a task or thread independent of a process (Linux) or real-time process (VxWorks 6.x)Process-qualified breakpoints that can stop a single process or a specified group of processesForked-process debuggingAbility of the wdb agent to stop the entire system when it panics, allowing attachment of Workbench to track the cause of the panic (typically, memory access error in a kernel thread or interrupt handler)Process fatal exception debug: The agent can attach to a process before it generates a core file, and the debugger can display all process and stack back trace informationKernel fatal exception debug: The agent can remain in system mode after the exception occurs, allowing the debugger to display kernel stack trace and other useful informationDebugging of “stripped” target applications in which symbolic information only exists in the host copy (in order to save target memory resources)Support for hardware and software breakpointsNo impact on the behavior of the schedulerProven stability and robustness through 20+ years of use as the debug agent for VxWorks in all major processor architectures
Wind River Shell EnvironmentsTo enhance developers’ work environment and improve their effectiveness in developing VxWorks 6.x–based device software applications, Wind River Workbench provides three command line environments, or shells:
VxWorks Host ShellLinux Host ShellVxWorks Kernel Shell
•••
•
••
•
•
•
•••
•••
VxWorks Host ShellThe VxWorks Host Shell, previously known as WindSh, provides a command line interface that lets you download application modules and invoke both VxWorks 6.x and application module subroutines. This facility has many uses:
Interactive exploration of the VxWorks 6.x operating system by calling any VxWorks routine and APIInteractive exploration of VxWorks 6.x RTPsDebug and monitor processesPrototypingNew to VxWorks 6.x:
Interactive development by calling any application (RTP) routinesVxWorks 6.x application (RTP) and kernel testingError management support through the output of error dumping; the ability to turn on/off error management on a per-task or per-RTP basisWind River Architecture for Messaging Protocol (WRAMP) support through text dump of the message traffic
The Host Shell executes on the development host, not the target—but it enables you to spawn tasks, look at RTPs, read from or write to target devices, and exert full control over the target. The Host Shell receives your commands, executes them locally on the host, and dispatches requests to the target server for any action involving the symbol table or target-resident programs or data.
Because the shell executes on the host system, you can use it with minimal intrusion on target resources. As with other VxWorks 6.x tools, only the target agent is required on the target system. Thus, the Host Shell can always remain available; you can use it to maintain a production system, as well as to experiment and test during development. Since you do not need to rebuild the VxWorks 6.x image, the Host Shell is useful on targets with restricted memory and permits system-mode debugging, which is helpful for debugging drivers.
Capabilities of the VxWorks Host Shell include:
RTP debuggingKernel task debuggingTask-specific breakpointsTask-specific single-steppingSymbolic disassemblerTask and system information utilitiesAbility to call user routinesAbility to create and examine variables symbolicallyAbility to examine and modify memoryException trappingUses wdb agent to access the target through three connection types: network, serial, or a pipe connectionSupports four interpreters (C, CMD, Tcl, GDBmi)Supports Tcl scripting and is backward compatible with Tcl 8.0GDB command line modeCommand mode (CMD)
•
••••
-
--
-
•••••••••••
••••
Wind River World Headquarters, 500 Wind River Way, Alameda, CA 94501 Toll-Free: 1-800-545-9463 Phone: 1-510-748-4100 Fax: 1-510-749-2010 [email protected] NASDAQ: WIND © 2006 Wind River Systems, Inc. �
Combined with the currently supported modes (C interpreter mode and Tcl interpreter mode), the Host Shell now supports four key command modes to increase the effectiveness of device software developers. The C mode enables the interpretation of simple C language expressions. Within C mode, most C operators can be executed, symbolic data references resolved, and subroutines invoked. This mode gives developers a prototyping and debugging tool to use within the kernel space. Users have access to the Tcl interpreter. The WTX Tcl API and all Tcl commands can be accessed from within Host Shell’s Tcl mode.
Command mode follows a UNIX-style model that allows arguments to be specified by flags such as –f <arg>, with a flexible order and number of arguments. Command mode also allows the passing of string parameters without having to delimit with quotation marks. This mode lets users attach to RTPs and essentially provides a monitoring and debugging mode for a VxWorks 6.x–based device software application.
GDB mode enables users to debug the system using GDB commands by directly interfacing with the Wind River Workbench debugging server. The GDB mode provides an extended subset of the GNU GDB/CLI set of commands, such as file, run, attach, continue, interrupt, break, print, list, frame, up, down, next(i), step(i), disas, x, source, info functions, args, regs, locals, path, and cd. In addition, the three command modes (C, GDB, and CMD) can be accessed from within Tcl mode, allowing users to exploit Tcl’s complex scripting capabilities.
Linux Host ShellThe Linux Host Shell, similar to the VxWorks Host Shell, provides a command line interface that lets you download, invoke, and debug user processes. The Linux Host Shell executes on the development host, not the target, but it enables you to spawn processes, read from or write to target devices, and exert full control over the target. The Linux Host Shell receives your commands, executes them locally on the host, and dispatches requests to the debugger framework for any action involving the symbol table or target-resident programs or data.
Because the shell executes on the host system, you can use it with minimal intrusion on target resources. As with other tools, only the target agent is required on the target system. Thus, the Host Shell can always remain available; you can use it to maintain a production system, as well as experiment and test during development. Since you do not need to rebuild the kernel image, the Linux Host Shell is useful on targets with restricted memory and permits system mode debugging, which is helpful for debugging drivers.
Host Shell capabilities include:
Kernel debuggingBreakpointsSymbolic disassemblerProcess and system information utilitiesThe ability to examine and modify memoryException trapping for the debugged processes
••••••
Access to the target through network for process debug, serial, or network for kernel debugSupports two interpreters (Tcl, GDB)Supports Tcl scripting and is backward compatible with Tcl 8.0GDB command mode
The Linux Host Shell supports two key command modes to increase the effectiveness of device software developers: GDB and Tcl. Users have access to the Tcl interpreter from the command line, allowing all Tcl commands to be accessed from within the Linux Host Shell’s Tcl mode. This includes the ability to access the GDB command mode from within Tcl mode, allowing you to take advantage of the complex scripting capabilities of Tcl.
GDB mode enables users to debug the system using GDB commands by directly interfacing with the Wind River Workbench debugging server. GDB mode provides an extended subset of the GNU GDB/CLI set of commands, such as file, run, attach, continue, interrupt, break, print, list, frame, up, down, next(i), step(i), disas, x, source, info functions, args, regs, locals, path, and cd.
VxWorks Kernel ShellThe VxWorks 6.x Kernel Shell, formerly known as the Target Shell, runs within the VxWorks 6.x kernel and provides direct access to VxWorks 6.x through a console or a network connection, such as Telnet. While the VxWorks Host Shell and VxWorks Kernel Shell have similar capabilities, there are several key differences:
VxWorks Kernel Shell implements fewer commands than are provided in VxWorks Host ShellBoth shells include a C and command mode CMD interpreter; the Host Shell also provides a Tcl and a GDB interpreterHost Shell is always ready to execute, provided the wdb target agent is included in the system; the Kernel Shell, as well as its associated target-resident symbol tables and module loader, must be configured into the VxWorks 6.x image by including the appropriate componentsKernel Shell’s input and output are directed at the same view by default, usually a console connected to the board’s serial port; for the Host Shell, these standard I/O streams are not necessarily directed to the same view as the Host Shell
Features of the VxWorks 6.x Kernel Shell include:
Multiple session support to enable a user to spawn multiple target shells:
Turn this feature on or off statically or dynamicallyUsed for Telnet, rlogin access, and virtual consolesEnables independent and simultaneous interaction with the target from several remote connections and from the consolePossible to create a new shell session redirected to the host computer through the wdb virtual I/ODesign allows an unlimited (except by the target memory size) number of Kernel Shell sessions running at the same time; each session is connected to a different set of I/Os and has its own context information (such as internal parameter of the shell task, default task ID for debugging command, last memory address accessed, and command line history)
•
•••
•
•
•
•
•
---
-
-

Wind River World Headquarters, 500 Wind River Way, Alameda, CA 94501 Toll-Free: 1-800-545-9463 Phone: 1-510-748-4100 Fax: 1-510-749-2010 [email protected] NASDAQ: WIND © 2006 Wind River Systems, Inc. �
Possible to create new Kernel Shell sessions from the host tool wtxConsole using the “-s” optionStill possible to set up a VxWorks 5.5-compatible mode; in this case, only one shell session can be created, and it is shared between the connectionsGlobal standard I/O of VxWorks is set to one of the shells
Multiple interpreter support: You can integrate your own interpreters (Tcl, GDB-like interpreter), dynamically switch between them, and have one interpreter evaluate statements by another oneGeneral shell enhancementsInclusion of the shell in the kernel without spawning an initial shell taskThe length of the input line of the target shell is configurable upon kernel creation and dynamically from a shell taskSymbol name, task name, and path completion are providedConfigurable shell prompt with format strings like the current path, and target name is providedRTP support: The real-time process, a new entity introduced by VxWorks 6.x, is an application in a protected memory context that executes at the user level. The VxWorks kernel lives in its protected memory area and executes at supervisor level. The RTP application is a fully linked module that can be relocated in memory and has no unresolved symbols. The RTP accesses the VxWorks 6.x kernel function through system call, and does not directly access the kernel memory area. The Kernel Shell allows users to monitor and debug the RTP in the following ways:
Launch and delete a RTPList the RTPs and RTP tasksStop/continue an RTP (stop and continue all RTP tasks)Add/remove a breakpoint on an RTP applicationDisassemble/display/modify the RTP memoryList the existing symbols name or modify the existing symbols value of an RTPShared library supportSymbol management supportExecution path settingsEnvironment variable settings
Command interpreter mode: A new UNIX-like interpreter is available to access the RTP; also available in the kernelWRAMP support: Several APIs are available in the shell to give information about WRAMP messagesFault management support: Target shell provides commands to display information reported by the operating system error management capabilities, as well as help debug applications using the fault management capabilitiesSecure target shell: You can protect access to the Kernel Shell with a login and password. This feature is available for remote connections and for a connection over the console/serial line. You can also configure an inactivity timeout delay, after which the shell returns to the login/ password prompt.New C interpreter: The existing C interpreter has been replaced to ease future maintenance and extension of C language supportMultiple line edit mode support: You can integrate your LED modes and dynamically switch between them; there is an “EMACS-like” LED mode, in addition to the traditional “vi-like” LED modeTarget Shell access via a Workbench virtual console
-
-
-•
••
•
••
•
------
----
•
•
•
•
•
•
•
VxWorks Kernel ConfiguratorThe VxWorks 6.x Kernel Configurator is a graphical utility that simplifies and accelerates the task of selecting the operating system components that need to be included in a bootable VxWorks image. The Kernel Configurator is backward compatible with Tornado 2.2 and VxWorks 5.5. A command line utility, vxprj, is available; it enables the ability to perform a kernel build within scripts used as part of nightly builds.
When creating a new bootable kernel image, Workbench analyzes available kernel components and BSP and compiler selections. The Kernel Configurator displays a summary of key configuration data, such as number of selected components or data and text size. A bundle selector allows users to quickly and easily include or exclude dedicated configuration bundles composed of multiple components from a kernel image. Sample configuration bundles include components needed for POSIX compliance, real-time process development, and error management.
Selecting kernel components individually gives you greater flexibility and control over your VxWorks image. The Kernel Configurator analyzes component dependencies and highlights conflicts when components are required but not selected, or if components are not compatible with one another. An AutoScale feature analyzes the entire VxWorks image and removes unused kernel components that may unnecessarily increase the size of a bootable image.
It is also possible to include custom component definitions for specialized purposes or from third parties; the Kernel Configurator verifies if component selections are valid and conflict-free.
Workbench offers the ability to assemble projects in hierarchies as a means of designing the structure of a target system. A bootable kernel project may include a file system project, as well as several RTP projects. Each RTP project may consist of one or several libraries and other source code modules. The advantage of creating a project structure over defining loosely coupled
Figure 7: VxWorks Kernel Shell
Wind River World Headquarters, 500 Wind River Way, Alameda, CA 94501 Toll-Free: 1-800-545-9463 Phone: 1-510-748-4100 Fax: 1-510-749-2010 [email protected] NASDAQ: WIND © 2006 Wind River Systems, Inc. 10
projects is that the build system will create bootable kernel images in a single run, compared to multiple build stages that must each be started individually. It is also a more logical and natural representation of system components.
Features of the VxWorks Kernel Configurator include:
Component bundle selectorImproved system builderAutomatic scaling of the kernel size (AutoScale)Dependency control and conflict resolutionAbility to create project hierarchies to reflect the structure of the final system, including bootable, file system, and RTP projectsCommand line availability of all GUI featuresVxWorks Image Builder
Wind River ICEWind River ICE, our newest BDM/EJTAG/JTAG hardware run-control device, takes serial Ethernet communications coming from the host development platform and transfers them to the appropriate communications protocol required to communicate with the CPU’s on-chip debugging capability.
Through its JTAG server capability, Wind River ICE supports multiple JTAG/EJTAG devices on a single scan chain, as well as multiple debugger connections to these devices. Wind River ICE supports connections for up to eight devices simultaneously in a scan chain of up to 128 individual EJTAG/JTAG devices. Wind River ICE also has the ability to support the internal Trace buffer provided on Freescale’s MPC85xx processor family.
In addition, Wind River ICE has the ability to support externally Trace-buffered SoCs, such as AMCC’s PPC405 and 440 families and Freescale’s MCF5xxx family. This is supported through addition of our Wind River Trace module, an adapter module that plugs into the end of the Wind River ICE cable.
•••••
••
Wind River TraceWind River Trace allows developers better visibility into the hardware/software interaction within their device. It provides a GUI within the development environment to show Trace configuration parameters and display Trace data. Wind River Trace also offers a hardware adapter for Wind River ICE, enabling it to capture and buffer more than 900,000 lines of Trace data from the target.
Wind River ProbeWind River Probe uses on-chip debugging services embedded in a microprocessor and the Wind River JTAG Accelerator technology to provide the industry’s most feature-rich tool for board bring-up, flash programming, and production/test.
Wind River Probe provides a high-speed USB connection between a host debugger and target microprocessor for PC-based development, as well as a high-performance emulation system with quick download speeds, overall debug throughput, and unprecedented debug efficiency.
Wind River ICE also has the ability to support the internal Trace buffer provided on Freescale’s MPC85xx processor family.
For more information on Wind River ICE, Wind River Trace, and Wind River Probe, please see their corresponding Product Notes.
Wind River System ViewerSystem Viewer, formerly known as WIND®VIEW, is the run-time analysis tool for device software developers who need to inspect the dynamic behavior of device software systems to detect run-time problems and improve system performance. System Viewer captures the dynamic interactions of the operating system, device software applications, and target hardware.
System Viewer provides detailed analysis and graphical visualization of system events, revealing the complex interactions of tasks, threads, interrupts, and system objects of applications executing on a target. Context changes are clearly shown, as well as such system events as semaphores, message queues, signals, tasks, timers, and user events. This tool is best suited for use when developers need to diagnose and solve one or more of the following problems:
Task/process/thread scheduling problems, such as deadlocks, starvation, and race conditionsPerformance problems, such as priority setting, resource contention, and mutual exclusionTiming problems arising from the interaction of interrupts and tasks
System Viewer allows device software developers to detect anomalous behavior quickly, then understand the cause and effect by reviewing the complete history of events leading up to the problem, including error management events from VxWorks 6.x. This tool operates independently of the target architecture and can be used with Wind River VxWorks Simulator (for VxWorks 6.x) before hardware is available, and with Wind River Linux
•
•
•
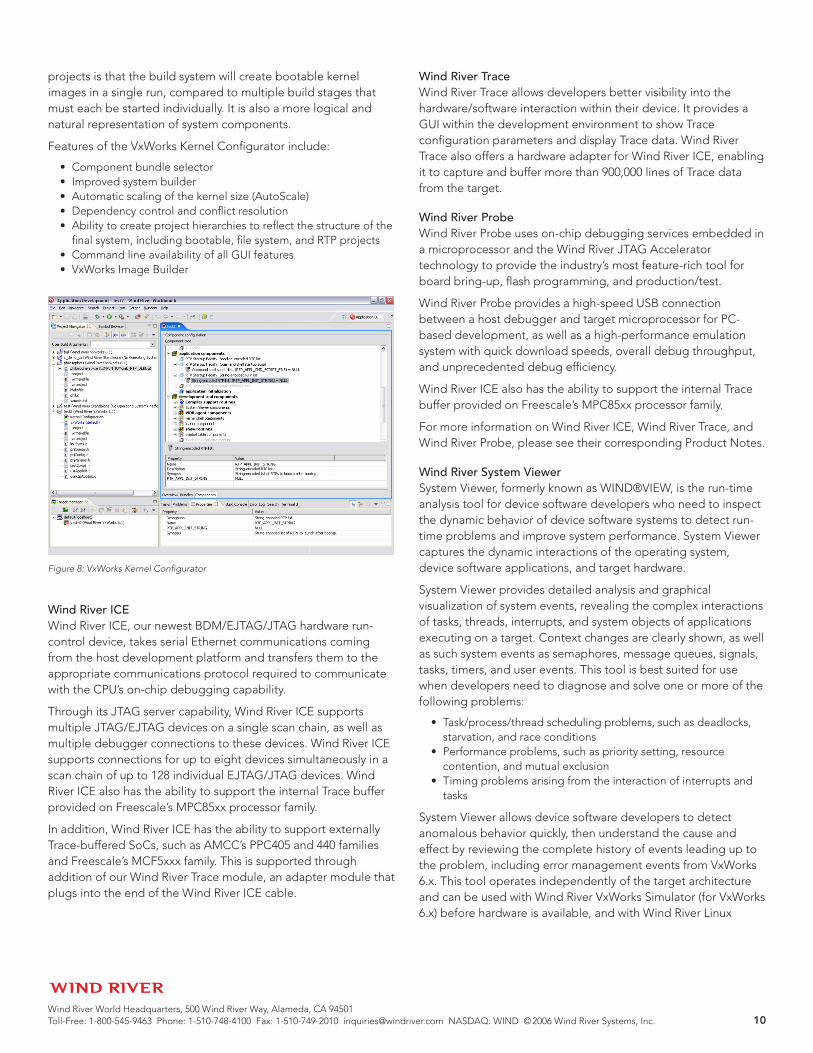
Figure 8: VxWorks Kernel Configurator

Wind River World Headquarters, 500 Wind River Way, Alameda, CA 94501 Toll-Free: 1-800-545-9463 Phone: 1-510-748-4100 Fax: 1-510-749-2010 [email protected] NASDAQ: WIND © 2006 Wind River Systems, Inc. 11
platforms using Linux Trace Toolkit (LTTng) instrumentation. System Viewer comprises Event Log Collection and Event Log Analysis, and it supports the definition of custom events that can be used to identify the occurrence of events manually inserted in the executable. Custom events are supported for VxWorks only.
Event Log CollectionSystem Viewer is instrumentation-based to provide exact timing of information about system events. System Viewer allows specification of the event-logging level (such as logging events from context switches), from tasks-changing state, or from events that operate on objects. This allows developers to control the amount of data collection and balance the intrusion caused by the logging.
For example, users may configure which time-stamp level should be used for event logs, such as sequential, high-resolution, or custom time stamps. This method allows developers to choose the desired level of instrumentation without impacting the edit-compile-debug cycle.
Developers can also use the triggering facility on VxWorks targets to start and stop data collection, so data is collected from a precise interval under precise conditions; and they can manage data upload to the host to optimize system resources. For those unique conditions, developers can create their own application-specific events.
Event Log AnalysisSystem Viewer provides graphical tools to make data analysis efficient and effective. The Event Graph is the main System Viewer display, presenting events as a scrollable graph. For each event, status information—such as parameters, time stamps, and argument values—is shown to aid measurement of the elapsed time between events. When analyzing large amounts of data, you can select from various filtering options to focus on specific tasks and events you want to study. Bookmarks indicate interesting locations in the event log, and icons help identify event types. Stippled lines indicate the state of each task at any given time. VxWorks 6.x real-time processes (RTPs) are supported in the display, allowing the expansion and collapse of RTPs to analyze tasks within their RTP contexts.
Linux applications can also benefit from System Viewer’s graphical analysis presentation. With Linux, data collection and presentation are based on the support of Linux Trace Toolkit (LTTng) data collected from an instrumented Linux kernel.
The System Viewer Radar presents a time-based view of an entire log and provides mechanisms to modify the selected display in the main tool windows. It offers several display modes that are unique ways of visualizing areas of activity within an event log. Device software developers can use the radar to show all events, peak activity, and event intensity, and to quickly zoom into areas of particular interest in the log.
The Event Table presents the events in the log as rows of information. In conjunction with the event container tree, the Event Table displays only events from selected tasks and interrupts.
ScopeToolsScopeTools are powerful and dynamic visualization tools for device software applications. They provide developers with visibility into the entire platform: application code, third-party libraries, and the operating system. You can monitor variables, optimize performance, and find memory problems—all while the system is still running.
An integral part of Workbench, ScopeTools support both VxWorks 6.x and Wind River Linux platforms. Three ScopeTools are included with Workbench: ProfileScope, MemScope, and
Figure 9: Workbench System Viewer—Event Viewer
Figure 10: Workbench System Viewer—Log Viewer

Wind River World Headquarters, 500 Wind River Way, Alameda, CA 94501 Toll-Free: 1-800-545-9463 Phone: 1-510-748-4100 Fax: 1-510-749-2010 [email protected] NASDAQ: WIND © 2006 Wind River Systems, Inc. 12
StethoScope. TraceScope and CoverageScope are optionally available for VxWorks 6.x at an added cost.
Features of ScopeTools include:
Learn where the processor spends its time, so you can focus on optimizing areas that contribute the most to overall performanceAnalyze all the code running in the system, including the kernel and third-party applicationsUnderstand more about the behavior of your platform through clearly diagrammed details of application and system behaviorQuickly uncover and resolve system problems faster through superior data analysis and displayChange variables on the fly, allowing more flexible experimentation and immediate observation of the resultsNo hardware setup or code instrumentation required (except for CoverageScope), allowing easy installation of the tools with minimal system impact
Included with Wind River Workbench:
ProfileScope: Profiling is critical for real-time systems. Once you understand performance bottlenecks, it becomes easier to optimize application code. ProfileScope is a dynamic execution profiler that provides detailed function-by-function performance analysis, specifying individual routines within the program that are consuming the CPU cycles. ProfileScope pinpoints inefficiencies and shows how performance changes over time.
•
•
•
•
•
•
•
MemScope: Ensuring optimal use of memory is a critical activity in device software design. In many applications, memory usage is not fully understood, and a large portion of available memory is wasted. Systems can run for days before failing due to non-characterized memory leaks. MemScope is an instant memory analyzer that provides greater visibility into memory usage. Without any special compilation or instrumentation, you can monitor available memory, detect leaks that occur due to system calls or third-party libraries, and even watch leaks as they happen.
StethoScope: This real-time graphical monitoring tool is used to examine variables, data structures, or memory locations in your system. You can watch any set of variables, see peak values and out-of-range settings you would otherwise miss, trigger collection on specific events, change variables while your program runs, and save collected data to disk. StethoScope presents this live analysis of your program without stopping or slowing your code.
•
•
Figure 11: ScopeTools—ProfileScope
Figure 12: ScopeTools— MemScope
Figure 13: ScopeTools—StethoScope

Wind River World Headquarters, 500 Wind River Way, Alameda, CA 94501 Toll-Free: 1-800-545-9463 Phone: 1-510-748-4100 Fax: 1-510-749-2010 [email protected] NASDAQ: WIND © 2006 Wind River Systems, Inc. 1�
oPtional add-onS for wind river workbench
ScopeTools for Test and ValidationIn addition to the standard ScopeTools included with Wind River VxWorks and Linux platforms, two other tools are available as options:
traceScope: Trace your code execution in real time by providing function call sequences as your code executes. Included with the function call displays are the provided parameters, as well as the returned values, to allow you to identify when function behavior and execution timing change.
coverageScope: Analyze your code to determine which code segments are executed during testing. Visibility into the execution of individual statements, decisions, and conditions enables you to create more thorough test scenarios, ensuring delivery of higher-quality devices. It also becomes easy to identify and remove code that is never executed, thus preventing future problems and reducing your overall memory footprint.
•
•
Workbench On-Chip Debugging (OCD)The Workbench development environment can be enabled for on-chip debugging (OCD). Wind River’s OCD capability, along with Wind River ICE, Wind River Trace, or Wind River Probe hardware, provides access to significant additional capability within Workbench.
In the early stages of hardware and software development, a robust connection to the microprocessor through its run-control port is essential. Workbench OCD provides connectivity between the host development environment and the target device via the JTAG or OCD interface of the microprocessor residing on the device. The OCD interface of most microprocessors enables full control of the microprocessor itself, access to core and peripheral registers, and access to on-chip switch fabrics and memory controllers, along with access to external buses and many devices attached directly to the bus. In addition, some microprocessors support either internal or external Trace buffers, allowing developers to capture information about the exact code that ran on the target and when.
On-chip debugging provides developers with complete system-level control of their environment at all times, enabling more efficient and effective hardware bring-up, firmware development, and device driver and BSP generation. OCD can also be a useful alternative to agent-based debugging in applications where serial, Ethernet, or USB interfaces are not available, or in environments where agent instrumentation of the OS is not desired.
Extended Workbench capabilities offered through the OCD connection include:
OCD target connection managerOCD command shellOCD consoleFlash programmingHardware and memory diagnosticsCF optionsJTAG editorExtensions to register view, including:
Bit-level register detailsAdditional peripheral register support for most processors
Combined register view with agent views and perspectivesOCD user’s perspective within WorkbenchWind River Trace (may require additional hardware, to be purchased separately)Firmware updateCache memory viewStatistical performance analyzer (PFA)OCD reset and download/launchLinux OS awareness via JTAGVxWorks 6.x OS awareness via JTAGVxWorks 5.5 OS Awareness via JTAG
All hostsAll targets with BSP available
ThreadX OS awareness via JTAG
••••••••
--
•••
•••••••
--
•
Figure 14: ScopeTools—TraceScope
Figure 15: ScopeTools—CoverageScope
Wind River World Headquarters, 500 Wind River Way, Alameda, CA 94501 Toll-Free: 1-800-545-9463 Phone: 1-510-748-4100 Fax: 1-510-749-2010 [email protected] NASDAQ: WIND © 2006 Wind River Systems, Inc. 1�
Workbench Unit TesterWorkbench Unit Tester, available at an added cost for use with VxWorks 5.5- and VxWorks 6-based platforms, is an integrated set of tools that allows developers greater efficiency in completing unit testing, integration testing, and code coverage analysis on the tests. The integration between Workbench Unit Tester and the rest of the development suite places these capabilities within easy reach of every developer. Workbench Unit Tester increases software quality, decreases time-to-market, and reduces support costs through better, faster, more automated testing in the development life cycle. For more detailed information, please see the Wind River Workbench Unit Tester Product Note.
Workbench DiagnosticsWorkbench Diagnostics, available at an added cost for use with VxWorks 5.5- and VxWorks 6-based platforms, allows developers to instrument a running system and collect valuable system status and diagnostic information easily. Enabling users to insert code sections into a system without recompiling or reloading the applications on the device, Workbench Diagnostics also offers a valuable new software debugging capability, increasing developer productivity by compressing debug cycles and eliminating unnecessary instrumentation-compile cycles. In the event of a system failure, Workbench Diagnostics lets developers conduct “forensic” analysis on a core file effectively, uncovering system behavior step-by-step prior to the system failure. For more detailed information, please see the Wind River Workbench Diagnostics Product Note.
technical SPecificationS
Workbench 2.5 Host OS SupportRed Hat Enterprise Linux 3, update 5Red Hat Enterprise Linux 4, update 1Solaris 8Solaris 9SuSE Desktop Linux 9.3SuSE Desktop Linux 10Windows 2000 Professional with Service Pack 1Windows XP Professional with Service Pack 2
Workbench 2.5 Target OS SupportVxWorks 6.0, 6.1, 6.2, and 6.3VxWorks 5.5VxWorks 653Linux: Wind River Linux platformsNative Linux development on Red Hat Enterprise Linux (3 and 4)ThreadX 4.0 (Workbench, On-Chip Debugging Edition, only)Customizable target OS awareness capability for Workbench, On-Chip Debugging Edition, enables support for other target operating systems to be added
Workbench 2.5 Target Processor SupportNew processor support is added on a regular basis. Please contact your Wind River Account Manager for the latest information.
••••••••
•••••••
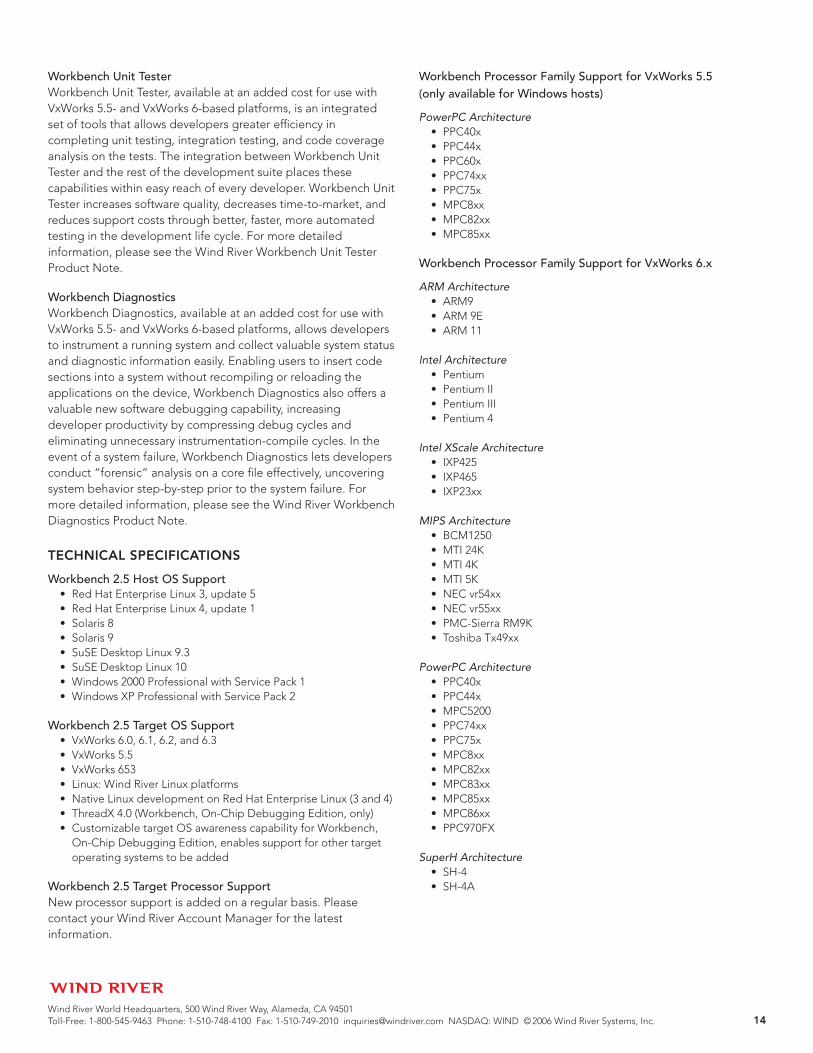
Workbench Processor Family Support for VxWorks 5.5 (only available for Windows hosts)
PowerPC ArchitecturePPC40xPPC44xPPC60xPPC74xxPPC75xMPC8xxMPC82xxMPC85xx
Workbench Processor Family Support for VxWorks 6.x
ARM ArchitectureARM9ARM 9EARM 11
Intel ArchitecturePentiumPentium IIPentium IIIPentium 4
Intel XScale ArchitectureIXP425IXP465IXP23xx
MIPS ArchitectureBCM1250MTI 24KMTI 4KMTI 5KNEC vr54xxNEC vr55xxPMC-Sierra RM9KToshiba Tx49xx
PowerPC ArchitecturePPC40xPPC44xMPC5200PPC74xxPPC75xMPC8xxMPC82xxMPC83xxMPC85xxMPC86xxPPC970FX
SuperH ArchitectureSH-4SH-4A
••••••••
•••
••••
•••
••••••••
•••••••••••
••

Wind River World Headquarters, 500 Wind River Way, Alameda, CA 94501 Toll-Free: 1-800-545-9463 Phone: 1-510-748-4100 Fax: 1-510-749-2010 [email protected] NASDAQ: WIND © 2006 Wind River Systems, Inc. 15
Workbench Processor Family Support for Linux
ARM ArchitectureARM 9 ARM 11
Intel ArchitecturePentium IIPentium IIIPentium 4Pentium MXeonEM64T
MIPS ArchitectureMTI 4KMTI 24KBCM 1480
PowerPC MPC82xxMPC83XXMPC85xxPPC44xMPC74xxPPC75XPPC970FX
XScale ArchitectureIXP465IXP425IXP2850PXA270
Workbench Processor Family Support for VxWorks 653
PowerPC MPC74xxPPC75X
Processor Family Support for Workbench, On-Chip Debugging Edition
ARMARM 9
ColdFireMCF52xx
MIPSBCM11xxBCM33xxBCM47xxBCM 7038BCM71xxBCM73xxRM7900RM9xxx4K5K20K 24K25K
••
••••••
•••
•••••••
••••
••
•
•
•••••••••••••
VR41xxVR54xxVR55xxVR77xxPR19xxPR39xxPR44xxPNX30xxPNX83xxPNX85xxTX49xx
PowerPCPPC40xXilinx X2VPXilinx XC4VFXPPC44xMPC52xxMPC5xxPPC60xPPC7xxMPC 8xxMPC82xxMPC83xxMPC85xxMPC74xxMPC970
XScaleIOP80219IOP80315IOP310IOP321IOP331PXA2xxIXP42xIXP45xIXP465IXP2400IXP2800IXP2325IXP2350
ProfeSSional ServiceSWind River Professional Services enable companies to reduce risk and improve competitiveness. Our team delivers device software expertise within structured engagements that directly address key development challenges and contribute to the success of our clients. Our track record of timely delivery and in-depth understanding of market and technology dynamics makes Wind River a valuable implementation partner for clients worldwide. Based on our commercial-grade project methodology, service offerings include device design, BSP and driver optimization, software system and middleware integration, and legacy application and infrastructure migration.
Workbench ServicesWhether you select Wind River Workbench as a stand-alone product or as part of our platform solutions, Wind River Professional Services knows how to jump-start your development
•••••••••••
••••••••••••••
•••••••••••••

Wind River World Headquarters, 500 Wind River Way, Alameda, CA 94501 Toll-Free: 1-800-545-9463 Phone: 1-510-748-4100 Fax: 1-510-749-2010 [email protected] NASDAQ: WIND © 2006 Wind River Systems, Inc. 1�
efforts. Even if you opt for a non–Wind River platform, Linux distribution, host operating system, or target architecture, we can help. No matter which development environment you use, Wind River Professional Services can extend Workbench to adapt to your needs with the following offerings:
Extend Workbench processor supportExtend Workbench target OS supportValidate Workbench on Linux host environmentValidate Eclipse plug-insIntegrate agents
Installation and OrientationProper installation and orientation of Wind River VxWorks and Linux platforms means you won’t waste time solving easily avoidable problems before you can begin your next development project. Wind River offers an Installation and Orientation Service to ensure that your project starts on time and without hassle by delivering:
on-site installation: Guided install on your hardware and host platform, along with a sample build process, demonstrations, and examples of customizations
hands-on orientation: Architecture, development file system, adding open-source packages, porting drivers, addressing design issues
advice: Introduction to Wind River support channels and processes, additional services, project review, and consultation
The Wind River Installation and Orientation Service will expedite your path to productivity, allow you to rest assured that we have eliminated a common source of user error, and help you realize all of the platform’s potential.
education ServiceSEducation is fundamentally connected not only to individual performance, but also to the success of a project or entire company. Lack of product knowledge can translate into longer development schedules, poor quality, and higher costs. The ability to learn—and to convert that learning into improved performance—creates extraordinary value for individuals, teams, and organizations. To help your team achieve that result, Wind River offers flexible approaches to delivering product education that best fits your time, budget, and skills development requirements.
Personalized Learning ProgramWind River offers a unique solution to minimize the short-term productivity drop associated with the process of adopting new device software technology, and optimize the long-term return on investment in a new device software platform. The Wind River Personalized Learning Program delivers the right education required by individual learners to accomplish their jobs. The program identifies work-related skill gaps, generates development plans, materials, and learning events to address these skill gaps, and quantifies the impact of the development activities for each individual user.
•••••
•
•
•
This programmatic, focused, and project-friendly approach to skills development results in a significant increase in the personal productivity of your team, improved efficiency in the processes they employ, and faster adoption of the technology you have purchased. Personalized Learning Programs deliver improved business performance—customers have reported a return on investment ranging from 18% to 30% over a traditional training approach.
Please consult your local Wind River sales representative for more information on Personalized Learning Programs.
Public CoursesWind River’s public courses are scheduled for your geographical convenience. They are conducted over one to five days, using a mixed lecture and interactive lab classroom format that leverages the experience of Wind River instructors and other course participants. Courses provide a fast, cost-effective way for students to become more productive with Wind River technology.
Benefits of public courses include:
A conceptual introduction that orients students to the subject matterA selective examination of the details, focusing on the most commonly used areas, or on areas with which users tend to be least familiarPersonal guidance and hands-on application of individual tools and course conceptsThe chance to grasp device software concepts, as well as the fundamental issues involved in real-time designThe knowledge needed to develop device drivers, perform hardware porting, or develop applicationsAnswers to specific questions about topics addressed in the course
Please consult your local Wind River sales representative for course schedules and fees.
On-Site EducationIf you have a large project team or a number of new users, you may benefit from custom on-site education. Instructors will consult with you and, based on the workshop series curriculum, determine which topics should be included and emphasized. This type of education offers an opportunity for one-on-one discussions with our instructors about your specific project needs, technical requirements, and challenges—all in the comfort of your own office.
Advantages of on-site education:
The entire team gains a common knowledge baseOn-site education helps ensure that knowledge and skills will transfer from the classroom to the workplaceThe location saves employees both travel expenses and time away from the office
Please consult your local Wind River sales representative for further information.
•
•
•
•
•
•
••
•

Wind River World Headquarters, 500 Wind River Way, Alameda, CA 94501 Toll-Free: 1-800-545-9463 Phone: 1-510-748-4100 Fax: 1-510-749-2010 [email protected] NASDAQ: WIND © 2006 Wind River Systems, Inc. 1�
SuPPort ServiceSWind River provides full technical support for VxWorks 6.x, Wind River Workbench, and Wind River Linux platforms. Our global support organization is staffed with engineers who have extensive experience with Wind River products and device software development. At major support centers worldwide, our local experts can help diagnose problems, provide guidance, or answer “How do I…?” questions. Support is also available 24 hours a day at our Online Support website (www.windriver.com/support) or by email at [email protected].
Visit Wind River Online Support (OLS) for fast access to product manuals, downloadable software, and other problem-solving resources for Wind River Workbench. Additional features, including patches and technical tips for common problems, are available for all customers on subscription. OLS visitors can also access a community of developers to discuss their issues and experiences.
If you cannot find the information you need through Online Support, please contact our global support team for access to the industry’s most knowledgeable and experienced support staff:
North America, South America, and Asia/Pacific [email protected] Toll-free tel.: 800-872-4977 (800-USA-4WRS) Tel.: 510-748-4100 Fax: 510-749-2164 Hours: 6:00 a.m. to 5:00 p.m. (Pacific time)
[email protected] Tel.: +(00)81-3-5778-6001 Fax: +(00)81-3-5778-6003 Hours: 10:00 a.m. to 5:00 p.m. (local time)
Europe, the Middle East, and [email protected] Toll-free tel.: +(00)(800) 4977-4977 France tel.: +33(0) 1 64 86 66 66 France fax: +33(0) 1 64 86 66 10 Germany tel.: +49(0) 899 624 45 444 Germany fax: +49(0) 899 624 45 999 Israel tel.: +972(0) 9741 9561 Israel fax: +972(0) 9746 0867 UK tel.: +44(0) 1793 831 393 UK fax: +44(0) 1793 831 808 Hours: 9:00 a.m. to 6:00 p.m. (local time)
The Wind River logo is a trademark of Wind River Systems, Inc., and Wind River and VxWorks are registered trademarks of Wind River Systems, Inc. Other marks used herein are the property of their respective owners. For further information regarding Wind River trademarks, please visit our website at www.windriver.com/company/terms/trademark.html.