wind power developmentdocuments.worldbank.org/curated/en/705351468149669645/pdf/wps48… · wind...
TRANSCRIPT
Policy ReseaRch WoRking PaPeR 4868
Wind Power Development
Economics and Policies
G. Cornelis van KootenGovinda R. Timilsina
The World BankDevelopment Research GroupEnvironment and Energy TeamMarch 2009
WPS4868P
ublic
Dis
clos
ure
Aut
horiz
edP
ublic
Dis
clos
ure
Aut
horiz
edP
ublic
Dis
clos
ure
Aut
horiz
edP
ublic
Dis
clos
ure
Aut
horiz
ed
Produced by the Research Support Team
Abstract
The Policy Research Working Paper Series disseminates the findings of work in progress to encourage the exchange of ideas about development issues. An objective of the series is to get the findings out quickly, even if the presentations are less than fully polished. The papers carry the names of the authors and should be cited accordingly. The findings, interpretations, and conclusions expressed in this paper are entirely those of the authors. They do not necessarily represent the views of the International Bank for Reconstruction and Development/World Bank and its affiliated organizations, or those of the Executive Directors of the World Bank or the governments they represent.
Policy ReseaRch WoRking PaPeR 4868
This study reviews the prospects of wind power at the global level. Existing studies indicate that the earth’s wind energy supply potential significantly exceeds global energy demand. Yet, only 1 percent of the global electricity demand is currently derived from wind power despite 40 percent annual growth in wind generating capacity over the past 25 years. More than 98 percent of total current wind power capacity is installed in the developed countries plus China and India. It has been estimated that wind power could supply 7 to 34 percent of global electricity needs by 2050. However, wind power
This paper—a product of the Environment and Energy Team, Development Research Group—is part of a larger effort in the department to study climate change and clean energy issues. Policy Research Working Papers are also posted on the Web at http://econ.worldbank.org. The author may be contacted at [email protected].
faces a large number of technical, economic, financial, institutional, market, and other barriers. To overcome these barriers, many countries have employed various policy instruments, including capital subsidies, tax incentives, tradable energy certificates, feed-in tariffs, grid access guarantees and mandatory standards. Besides these policies, climate change mitigation initiatives resulting from the Kyoto Protocol (e.g., CO
2-emission
reduction targets in developed countries and the Clean Development Mechanism in developing countries) have played a significant role in promoting wind power.
Wind Power Development: Economics and Policies
G. Cornelis van Kooten Department of Economics
University of Victoria, Canada
Govinda R. Timilsina† Development Research Group, The World Bank
Washington, DC
Keywords: Wind energy; renewable energy technology; energy policy
† Corresponding author [email protected].
1. Introduction
The global energy supply system faces challenges on three fronts: price volatility,
energy security and the environment, particularly regarding local air pollution and global
warming. A primary cause of these problems is the predominant share of fossil fuels in the
global energy supply mix. Currently, fossil fuels account for more than 80 percent of the
global energy supply and that share is not expected to change over the next 25 years under a
business as usual scenario (IEA, 2008). To address these concerns, there would be a need to
diversify the energy supply portfolio towards cleaner and more sustainable sources of energy,
such as renewable energy (RE) (Ayres, 2008; Anderson and Winne, 2007). RE sources
include large-scale hydro, small-scale run-of-river hydro, wind, tidal, solar, wave, municipal
solid wastes and biomass for the generation of electricity and space heating, and biofuels
(ethanol and biodiesel) for transportation. Some countries have already set targets to increase
the share of RE in their energy supply mix.1 For example, the European Union (EU) has
introduced an overall target of a 20 percent share of RE sources in energy consumption by
2020 (CEC, 2008). In China, RE sources are expected to account for 15 percent of the total
primary energy supply by 2020 (Martinot, 2008).
Although most RE sources have exhibited strong growth recently, the deployment of
wind power has significantly outpaced other RE sources with the exception of large hydro.
During 2001-2007, 70 Gigawatts (GW) of wind generating capacity was installed globally,
which is more than half of the added hydropower capacity (134 GW) and almost seven times
as much as the amount of solar photovoltaic generating capacity installed during the same
period (EPI, 2008). Still, the share of wind power in global energy supply is negligible.
Moreover, the recent world energy outlook published by the International Energy Agency
(IEA) projects that less than two percent of the globe’s energy supply will be met by wind
power by 2030 (IEA, 2008). An obvious question is: Why is the contribution of wind energy
to the global energy supply mix negligible currently and expected to remain very small in the
near future? The answer rests with several factors, including technical, economic, financial
and institutional barriers. To successfully implement wind power on a larger scale, it is
1 RE targets in many countries are presented later in this paper.
2
necessary to focus on policies and strategies to reduce market barriers and promote research
and development to further reduce the costs of wind turbine technology. Advances in climate
change mitigation negotiations also will strengthen the financial picture for wind, as would
include wind strategies in policies addressing energy security.
The purpose of the current review is to examine these issues and provide insights
concerning the future potential of wind power as a renewable energy source. Although there
is a large volume of research in the field of wind power, the existing literature focuses more
on engineering or technological aspects of wind energy. Hence, our review, unintentionally,
has a somewhat engineering or technical flavor although our focus is on economic and policy
issues despite the fact that such peer-reviewed research is still in its infancy.
The outline of the paper is as follows: in the next section, we present the status of
wind power installation, followed by resource potential and future development prospects. We
then discuss wind power generation costs, key barriers to wind power development and policy
options to overcome those barriers. This is followed by discussions on the intermittent nature
of wind energy and grid interconnection issues. The roles of climate change mitigation
initiatives to promote wind power are discussed before we draw key conclusions.
2. Current Status of Wind Power Installations
Installed global wind generating capacity expanded rapidly from only 10 megawatts
(MW) in 1980 to 94,124 MW of installed capacity by the end of 2007 (see Table 1).2 At the
end of 2007, Europe and North America accounted for 80.5% of global wind power capacity.
Overall, developed countries accounted for some 85% of installed wind capacity; upon
including China and India, this increased to 98.3% of global installed capacity. As indicated
in Figure 1, the top ten countries account for more than 86% of total global wind capacity, or
81.1 GW. With the exception of China and India, and a few other countries, very little
electricity is produced from wind in developing countries, and especially in the least
developed countries, although wind is used on a small scale to drive mechanical devices such
as water pumps.
2 Kilo is abbreviated with k and equals 103; Mega (M, 106); Giga (G, 109); Tera (T, 1012).
3
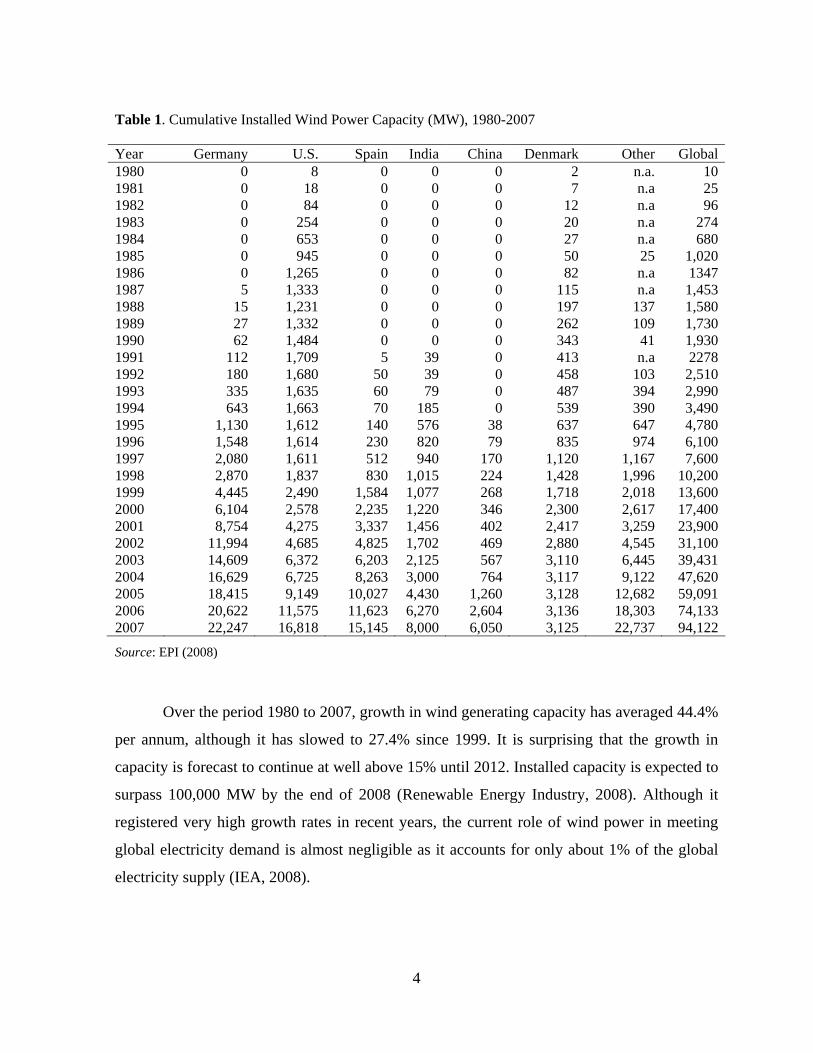
Table 1. Cumulative Installed Wind Power Capacity (MW), 1980-2007
Year Germany U.S. Spain India China Denmark Other Global1980 0 8 0 0 0 2 n.a. 101981 0 18 0 0 0 7 n.a 251982 0 84 0 0 0 12 n.a 961983 0 254 0 0 0 20 n.a 2741984 0 653 0 0 0 27 n.a 6801985 0 945 0 0 0 50 25 1,0201986 0 1,265 0 0 0 82 n.a 13471987 5 1,333 0 0 0 115 n.a 1,4531988 15 1,231 0 0 0 197 137 1,5801989 27 1,332 0 0 0 262 109 1,7301990 62 1,484 0 0 0 343 41 1,9301991 112 1,709 5 39 0 413 n.a 22781992 180 1,680 50 39 0 458 103 2,5101993 335 1,635 60 79 0 487 394 2,9901994 643 1,663 70 185 0 539 390 3,4901995 1,130 1,612 140 576 38 637 647 4,7801996 1,548 1,614 230 820 79 835 974 6,1001997 2,080 1,611 512 940 170 1,120 1,167 7,6001998 2,870 1,837 830 1,015 224 1,428 1,996 10,2001999 4,445 2,490 1,584 1,077 268 1,718 2,018 13,6002000 6,104 2,578 2,235 1,220 346 2,300 2,617 17,4002001 8,754 4,275 3,337 1,456 402 2,417 3,259 23,9002002 11,994 4,685 4,825 1,702 469 2,880 4,545 31,1002003 14,609 6,372 6,203 2,125 567 3,110 6,445 39,4312004 16,629 6,725 8,263 3,000 764 3,117 9,122 47,6202005 18,415 9,149 10,027 4,430 1,260 3,128 12,682 59,0912006 20,622 11,575 11,623 6,270 2,604 3,136 18,303 74,1332007 22,247 16,818 15,145 8,000 6,050 3,125 22,737 94,122
Source: EPI (2008)
Over the period 1980 to 2007, growth in wind generating capacity has averaged 44.4%
per annum, although it has slowed to 27.4% since 1999. It is surprising that the growth in
capacity is forecast to continue at well above 15% until 2012. Installed capacity is expected to
surpass 100,000 MW by the end of 2008 (Renewable Energy Industry, 2008). Although it
registered very high growth rates in recent years, the current role of wind power in meeting
global electricity demand is almost negligible as it accounts for only about 1% of the global
electricity supply (IEA, 2008).
4
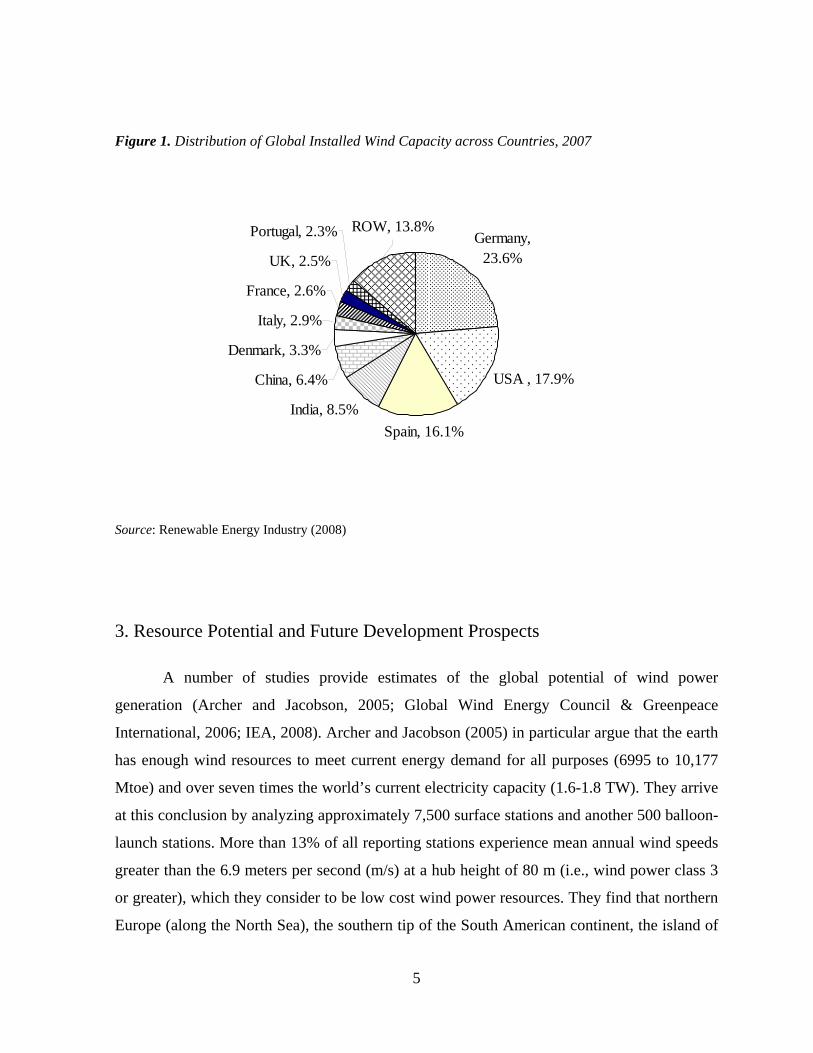
Figure 1. Distribution of Global Installed Wind Capacity across Countries, 2007
Germany, 23.6%
USA , 17.9%
Spain, 16.1%
India, 8.5%
China, 6.4%
Denmark, 3.3%
Italy, 2.9%
France, 2.6%
UK, 2.5%
Portugal, 2.3% ROW, 13.8%
Source: Renewable Energy Industry (2008)
3. Resource Potential and Future Development Prospects
A number of studies provide estimates of the global potential of wind power
generation (Archer and Jacobson, 2005; Global Wind Energy Council & Greenpeace
International, 2006; IEA, 2008). Archer and Jacobson (2005) in particular argue that the earth
has enough wind resources to meet current energy demand for all purposes (6995 to 10,177
Mtoe) and over seven times the world’s current electricity capacity (1.6-1.8 TW). They arrive
at this conclusion by analyzing approximately 7,500 surface stations and another 500 balloon-
launch stations. More than 13% of all reporting stations experience mean annual wind speeds
greater than the 6.9 meters per second (m/s) at a hub height of 80 m (i.e., wind power class 3
or greater), which they consider to be low cost wind power resources. They find that northern
Europe (along the North Sea), the southern tip of the South American continent, the island of
5
Tasmania in Australia, the Great Lakes region, and the northeastern and northwestern coasts
of North America have the strongest wind power potentials. If turbines were set up in all the
regions with wind speeds greater then 6.9 m/s, they would generate 72 TW of electricity,
which is almost five times the world's current energy use. However, it is not possible to set up
turbines in every region identified due to existing buildings, land rights and other obstacles.
Nevertheless, even 20% of those sites could satisfy current world energy consumption. A
study initiated by the United Nations’ Environment Program (UNEP) to evaluate wind power
potential in 19 African countries estimates that the wind power potential could reach 53 TW
in those countries alone (InWEnt Consulting, 2004).
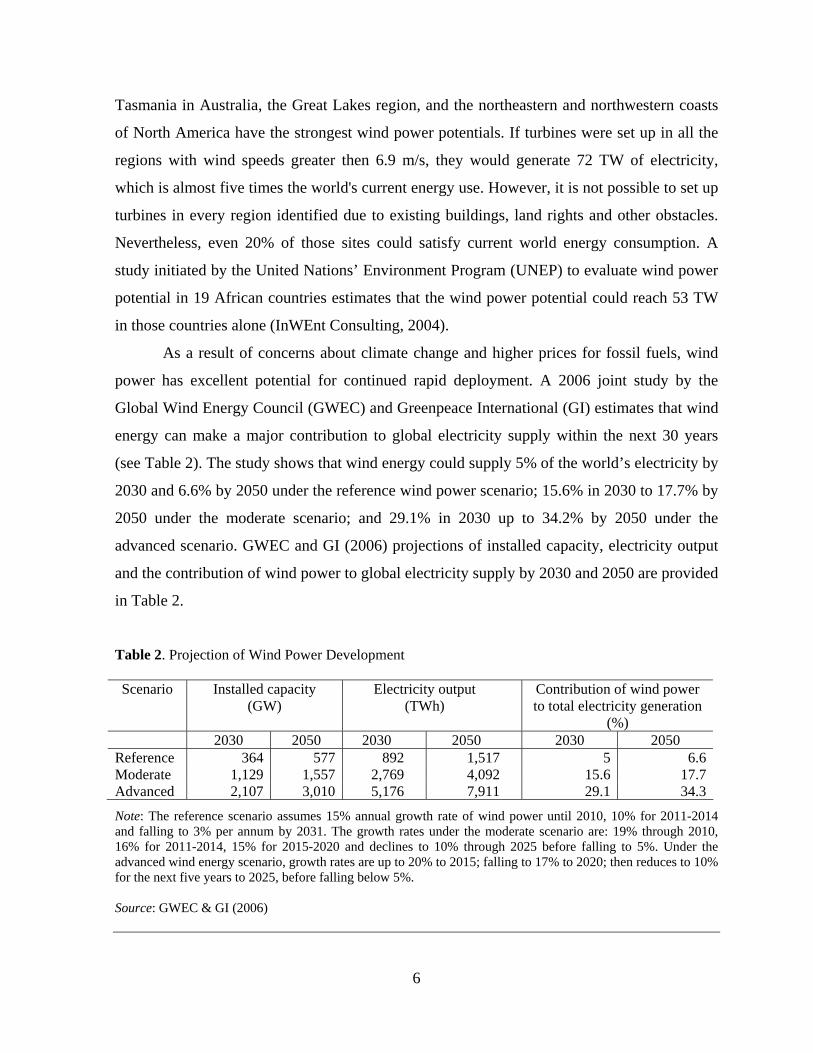
As a result of concerns about climate change and higher prices for fossil fuels, wind
power has excellent potential for continued rapid deployment. A 2006 joint study by the
Global Wind Energy Council (GWEC) and Greenpeace International (GI) estimates that wind
energy can make a major contribution to global electricity supply within the next 30 years
(see Table 2). The study shows that wind energy could supply 5% of the world’s electricity by
2030 and 6.6% by 2050 under the reference wind power scenario; 15.6% in 2030 to 17.7% by
2050 under the moderate scenario; and 29.1% in 2030 up to 34.2% by 2050 under the
advanced scenario. GWEC and GI (2006) projections of installed capacity, electricity output
and the contribution of wind power to global electricity supply by 2030 and 2050 are provided
in Table 2.
Table 2. Projection of Wind Power Development
Scenario Installed capacity (GW)
Electricity output (TWh)
Contribution of wind power to total electricity generation
(%) 2030 2050 2030 2050 2030 2050 Reference 364 577 892 1,517 5 6.6Moderate 1,129 1,557 2,769 4,092 15.6 17.7Advanced 2,107 3,010 5,176 7,911 29.1 34.3
Note: The reference scenario assumes 15% annual growth rate of wind power until 2010, 10% for 2011-2014 and falling to 3% per annum by 2031. The growth rates under the moderate scenario are: 19% through 2010, 16% for 2011-2014, 15% for 2015-2020 and declines to 10% through 2025 before falling to 5%. Under the advanced wind energy scenario, growth rates are up to 20% to 2015; falling to 17% to 2020; then reduces to 10% for the next five years to 2025, before falling below 5%. Source: GWEC & GI (2006)
6
The projections of wind power development vary across studies based on the
underlying assumptions and projections used in their models. In a recent study, the IEA
(2008) estimates wind power development potential under two scenarios referred to as ACT
and BLUE. The ACT scenario assumes that extant technologies and ones that are in an
advanced state of development can bring global CO2 emissions back to current levels by 2050.
The BLUE scenario assumes that CO2 emissions can be reduced by 50% from current levels
by 2050. While the ACT scenarios are demanding, the BLUE scenarios require urgent
implementation of unprecedented and far-reaching new policies in the energy sector. Under
the ACT scenario, global wind power capacity is estimated to increase from 94 GW in 2007
to 1,360 GW in 2050. The capacity would increase to more than 2,010 GW in 2050 under the
BLUE scenario. In the ACT scenario, electricity production from wind contributes 2,712
TWh/yr in 2030 and 3,607 TWh/yr in 2050. In the BLUE scenario, wind power adds 2,663
TWh/yr in 2030 and 5,174 TWh/yr in 2050. Wind power constitutes 12% of global electricity
production in 2050 in the BLUE scenario compared to 2% at the baseline. Wind power
production is expected to grow significantly in OECD countries, and in emerging economies
such as China and India. In the BLUE scenario, China leads in wind power generation in 2050
with a 31% share. In both scenarios, onshore generation of wind power dominates, although
by 2050 some 20% or more power will be generated by (more expensive) offshore wind
farms.
In order to achieve a more diversified energy portfolio, the U.S. Department of Energy
recently explored the possibility of supplying 20% of the nation’s total electricity demand
through wind by 2030. A study commissioned by the Department (USDOE, 2008) concluded
that a 20% wind scenario in 2030, while ambitious, might prove feasible if certain challenges
can be overcome. First, the U.S. would require 300 GW of wind power capacity to be
installed by 2030 to meet the 20% wind scenario, which is almost 18 times as high as the
2007 capacity of about 17 GW. Further, it would require construction of more than 20,000 km
of high-voltage transmission lines, which is opposed by several states as it would likely
increase their electricity rates (as such a network would tend to equalize rates across regions).
The USDOE study estimates that upwards of 600 GW of wind generating capacity
could be installed at a cost of $60 to $100 per megawatt-hour (MWh), including the costs of
connecting to the extant transmission system (USDOE, 2008, p.9). The federal government’s
7
production tax credit would reduce the cost to investors, while technological innovations are
expected to reduce actual costs as well. Overall, the 20% wind scenario would result in
US$43 billion in incremental cost but would also result in cumulative CO2 reductions of more
than 7,600 million metric tons (Mt of CO2) by 2030. Thus, by increasing reliance on wind
energy for electricity production to 20%, CO2 emissions can be reduced at a cost of about
$5.70 per ton of CO2 (tCO2) according the USDOE (2008). If this is realistic, then wind
energy development has a promising future in the United States.
4. Costs of Wind Power Generation
The costs of generating wind power depend to a large extent on wind resources, in
particular, mean wind speed at hub height, the cost of turbines and related equipment, the
proximity to a sufficiently strong transmission grid (i.e. the cost of grid extension and grid
reinforcement), and the accessibility of the site. Other factors such as the existing generating
mix, system load profiles, connections to grids in other countries/regions, electricity markets,
system operating procedures, and land costs also have a significant impact on the costs of
wind power generation. A large number of studies compare the costs of wind power with
those of other electricity generation technologies (e.g., NEA/IEA, 2005; Kammen and Pacca,
2004; Lazard, 2008; CPUC, 2008; EIA, 2008; ESMAP/WB, 2008). Since electricity
generation technologies vary significantly in terms of their investment requirements and
operational characteristics, costs are converted to a level or base for comparison purposes,
known as the levelized (or bus bar) cost of electricity generation. The levelized cost includes
mainly investment or capital costs, operation and maintenance (O&M) costs, and fuel costs.
While capital and fixed O&M costs are proportional to installed capacity, variable O&M and
fuel costs are functions of electricity output.
Recent studies show that wind power can be competitive with conventional sources of
electricity generation. A comparison of the levelized costs of various electricity generation
technologies released by the California Public Utilities Commission on May 13, 2008 shows
that wind power is one of the cheapest options with levelized cost of US$89.10/MWh (CPUC,
2008). Levelized costs per MWh expressed in 2008 US$ of other technologies examined by
the Commissions are as follows: Supercritical Coal – $106; Integrated Gasification Combined
Cycle (IGCC) Coal – $115; IGCC Coal with Carbon Capture & Storage (CCS) – $173;
8
Biogas – $86; Gas Combined Cycle – $94; Geothermal – $102; Hydro – $105; Concentrating
Solar Thermal (CSP) – $127; Nuclear – $153; and Biomass – $165. This study used fixed
2008 price for fuels instead of projected fuel prices and prices of fuels and materials were at
their peak in that year. The costs do not include external costs such as carbon tax. 3
Lazard (2008) also estimates that wind power is one of the cheapest options for
generating electricity in the United States with levelized cost ranging from $44 per MWh to
$91/MWh in 2008 dollars. For other generating technologies, Lazard (2008) estimates
levelized cost ranges of (in 2008 US$ per MWh) $221-$334 for peak (open-cycle) gas, $104-
$134 for IGCC, $98-$126 for nuclear, $74-$135 for advanced supercritical coal,4 $73-$100
for Gas Combined Cycle, $109-$154 for solar PV (crystalline), $96-$124 for solar PV (thin
film), $90-$145 for solar thermal, $115-$125 for fuel cell, $50-$94 for biomass, $50-$81 for
landfill gas, and $42-$69 for geothermal. These estimates do not represent the true cost to
society, however, because they include various government incentives, such as investment
and production tax credits, accelerated asset depreciation and reduced tax rates. Further
assumptions are 60% debt financing at 7% interest rate and 40% equity financing at 12% cost.
Fuel prices used in the estimates are current fixed prices instead of projected prices. Since the
study included taxes and subsidies, it deviates from cost-benefit analysis (CBA) methods.
All of the above cost calculations are for the United States. Moreover, those costs do
not include transmission costs to connect electricity grids, which could be very high for wind
power, especially where wind farms are remotely sited (e.g., offshore or mountainous
regions). Also ignored are the increased costs of managing an electric grid when variable
wind power enters into an existing generation mix.
The cost of wind power relative to other technologies varies significantly across
countries and locations. ESMAP/World Bank (2008) estimates of the costs of electricity
generation equipment for three countries, the United States, India and Romania, indicate that
there are large variations in overnight construction costs across size of generation capacity
3 Please refer to CPUC (2008) for detailed information on data and methodology used and assumptions made while estimating these costs.
4 Upper range includes 90% carbon capture and storage.
9
and locations/countries.5 NEA and IEA (2005) calculate levelized costs of electricity
generation technologies for various countries using data collected from a survey of system
operators and power producers. Table 3 presents the range of levelized costs for various
technologies. As can be seen from the table, the cost ranges are very wide for most of the
technologies as electricity generation costs vary across countries. The table also presents the
weights of different components of the levelized costs for different technologies. While
capital is the main component for non-fossil fuel technologies, fuel costs account for more
than half of the total costs with most fossil fuel based technologies.
The comparisons of levelized costs of electricity generation technologies significantly
vary across existing studies for reasons related to fuel price projections, differences in
material and labor costs across regions and studies, employment of different discount rates,
and differences in exchange rates. In many instances, costs are not comparable across the
studies due to a large divergence in their underlying assumptions and data. For example, cost
estimates in the NEA and IEA (2005) study are expressed in 2003 values, whereas the cost
estimates of CUPC (2008) and Lazard (2008) are expressed in 2008 dollars. Moreover, while
the NEA and IEA study uses fuel price forecasts, CUPC (2008) and Lazard (2008) use current
fuel prices and keep the price fixed over the life of the technology. Moreover, some studies
follow financial analysis (e.g., CPUC, 2008; Lazard, 2008), whereas others (e.g., NEA & IEA
(2005) follow economic analysis and hence the costs are not comparable across the studies.
The levelized costs presented in Table 3 do not include externality costs. Thus, the
costs reported in Table 3 are not the total costs to the society. Moreover, if costs of
externalities, such as costs of local air pollution, GHG emissions and other externalities (e.g.,
impacts of wind power on land use), are taken into appropriate account, the total costs of
electricity generation technology also would change. Using a life cycle cost approach, some
studies (e.g., Owen, 2004; Roth and Ambs, 2004) show that wind power could be as
competitive as fossil fuels if environmental externalities are appropriately accounted for in
calculating true social costs.
5 However, the ESMAP & WB (2008) study does not calculate levelized costs of electricity generation.
10
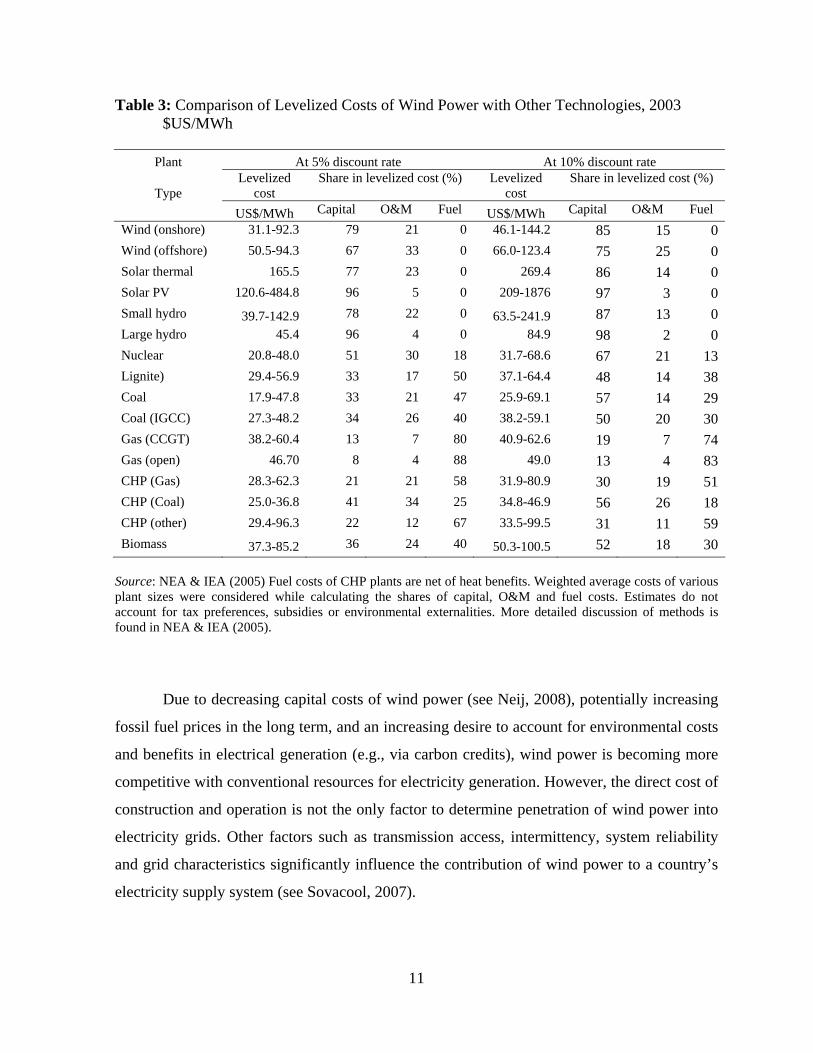
Table 3: Comparison of Levelized Costs of Wind Power with Other Technologies, 2003 $US/MWh
Plant At 5% discount rate At 10% discount rate
Type Levelized
cost Share in levelized cost (%) Levelized
cost Share in levelized cost (%)
US$/MWh Capital O&M Fuel US$/MWh Capital O&M Fuel
Wind (onshore) 31.1-92.3 79 21 0 46.1-144.2 85 15 0
Wind (offshore) 50.5-94.3 67 33 0 66.0-123.4 75 25 0
Solar thermal 165.5 77 23 0 269.4 86 14 0
Solar PV 120.6-484.8 96 5 0 209-1876 97 3 0
Small hydro 39.7-142.9 78 22 0 63.5-241.9 87 13 0
Large hydro 45.4 96 4 0 84.9 98 2 0
Nuclear 20.8-48.0 51 30 18 31.7-68.6 67 21 13
Lignite) 29.4-56.9 33 17 50 37.1-64.4 48 14 38
Coal 17.9-47.8 33 21 47 25.9-69.1 57 14 29
Coal (IGCC) 27.3-48.2 34 26 40 38.2-59.1 50 20 30
Gas (CCGT) 38.2-60.4 13 7 80 40.9-62.6 19 7 74
Gas (open) 46.70 8 4 88 49.0 13 4 83
CHP (Gas) 28.3-62.3 21 21 58 31.9-80.9 30 19 51
CHP (Coal) 25.0-36.8 41 34 25 34.8-46.9 56 26 18
CHP (other) 29.4-96.3 22 12 67 33.5-99.5 31 11 59
Biomass 37.3-85.2 36 24 40 50.3-100.5 52 18 30
Source: NEA & IEA (2005) Fuel costs of CHP plants are net of heat benefits. Weighted average costs of various plant sizes were considered while calculating the shares of capital, O&M and fuel costs. Estimates do not account for tax preferences, subsidies or environmental externalities. More detailed discussion of methods is found in NEA & IEA (2005).
Due to decreasing capital costs of wind power (see Neij, 2008), potentially increasing
fossil fuel prices in the long term, and an increasing desire to account for environmental costs
and benefits in electrical generation (e.g., via carbon credits), wind power is becoming more
competitive with conventional resources for electricity generation. However, the direct cost of
construction and operation is not the only factor to determine penetration of wind power into
electricity grids. Other factors such as transmission access, intermittency, system reliability
and grid characteristics significantly influence the contribution of wind power to a country’s
electricity supply system (see Sovacool, 2007).
11
5. Barriers to Wind Power Development
Despite the apparent advantages of wind power development, wind power faces major
barriers, particularly in developing countries. These can be classified into technical barriers,
economic and financial barriers, market barriers, institutional or capacity barriers, and others.
Perhaps the most critical technical barriers are lack of access to transmission lines,
difficulties in getting cranes and/or turbine components to sites (as mentioned in the preceding
section), and the challenges related to the intermittent nature of wind (Liik et al., 2003; Lund,
2005) that are discussed in more detail below. Another important technical barrier,
particularly in developing countries, is the lack of data needed to assess the size of local wind
resources. Available meteorological data are often inadequate for assessing wind resources, so
mesoscale modeling based on satellite data with follow-up ground-based wind measurements
and microscale wind modeling of the most promising areas are required to obtain ‘bankable’
wind projects. Otherwise, the uncertainty will discourage investors from developing wind
power plants.
Equipment misspecification to comply with the power quality in the local grid also
poses constraints. For example, at the early stage of wind power development in the Indian
State of Gujrat, second-hand equipment purchased from California could not operate
effectively within the Western Electricity Grid of India, which typically undergoes large
fluctuations in frequency and where outages are common-place (Amin, 1999).
The economic and financial barriers include high upfront capital costs and uncertainty
regarding financial returns. This barrier is related to the lack of high quality wind resource
data, thereby inhibiting access to financing. Since wind power is more capital intensive
compared to conventional fossil-fuel fired generating technologies, the relatively high capital
costs continue to be an obstacle to the adoption of wind power at the scale reflecting its
technical potential. Moreover, the costs of constructing transmission lines from a wind farm to
an electricity grid can be high, thereby making wind power generation less financially
attractive relative to thermal power plants that can be constructed near existing transmission
corridors or load centers at lower costs per kW of installed capacity.
In the case of off-grid wind power, companies may be hesitant to make investments
because the long-term costs of small, wind-driven grids are difficult to predict and rural
12
communities may lack financial resources to make payments; thus, the off-grid electricity
market is somewhat risky (Reiche, Covarrubias and Martinot, 2000). This may be more the
case in developing countries where there is also a greater need for off-grid electrification.
Overall, wind power developers face difficulties in raising local equity due to the high
level of technical complications and financial uncertainties (e.g., unfamiliar and potentially
risky investment with uncertain returns). For the same reasons, wind power developers face
difficulties in securing loans. Loan requests are often declined or face high interest rates due
to high risk premiums. Because of these financial barriers, wind power may not be an
attractive portfolio option for private investors, particularly in developing countries.
Unless implemented under the CDM or JI, wind power does not receive ‘green’
benefits, while fossil fuels are not taxed for their environmental externalities. This results in
an uneven playing field, which can be a substantial market barrier to wind power. Moreover,
wind power plants generally tend to be smaller, and wind power producers have less clout in
negotiating favorable terms with larger market players. Obviously, small projects face high
transaction costs at every stage of the project development cycle.
Lack of proper institutions and local capacity are additional key barriers to wind
power development, specifically in developing countries. In many countries, production and
distribution of electricity are still controlled by a monopolist, often the state. There is a
general lack of economic institutions for facilitating contracts (i.e., power purchase
agreements) between the wind power developers and system operators (Beck and Martinot,
2004). Furthermore, many wind power projects are implemented as turn-key projects with
bilateral or multilateral funding from developed countries. Once the projects are handed over
to a local company or system operator, they encounter constraints related to a lack of
operating skills and equipment parts. This eventually results in inefficiencies, outages and
even shutdown of wind farm facilities. These types of problems could eventually lead to a
loss of future interest in small-scale wind power development in remote villages (UNEP,
2001).
Besides the aforementioned barriers, wind power also suffers from other barriers. In
some countries, wind power must meet stringent licensing requirements. Wind turbines along
migratory bird paths and/or in coastal areas often need to address specific environmental
concerns before they can be erected. Competition for land use with agricultural, recreational,
13
14
scenic or development interests can also occur (Beck and Martinot, 2004).
6. Policy Instruments to Support Wind Energy
Many countries have developed strategies to reduce or overcome the barriers
mentioned above. They have also set renewable energy targets. As of 2005, 43 countries had
renewable energy targets, of which ten were developing countries: Brazil, China, the
Dominican Republic, Egypt, India, Malaysia, Mali, the Philippines, South Africa and
Thailand (Martinot, 2005). Various incentives are in place to promote wind energy, including
development subsidies, tax breaks and feed-in tariffs. Table 4 presents a summary of policies
in 63 countries for which we could find information regarding their wind potential, renewable
energy targets and current policies for increasing reliance on wind energy. Most of these
countries have relatively good to excellent potential to generate wind power, especially if
offshore potential is taken into account in the case of coastal countries.
As illustrated in Table 4, the policy instruments considered by various countries can
be classified into three categories: (i) fiscal incentives, (ii) regulatory incentives, and (iii)
other policies and programs. The key fiscal instruments include capital subsidies, tax
incentives, feed-in tariffs, price guarantees, and tradable energy certificates. The main
regulatory instruments introduced are mandatory targets, renewable energy
portfolio/obligation standards. The other policies and programs include priority in
dispatching, transmission access, and long-term contracts. As of 2005, 25 developed and nine
developing countries provided feed-in tariffs for wind energy, the same number of developed
and six developing countries had provisions to provide capital subsidies, and 26 industrialized
and nine developing nations provided other forms of aid (reduced taxes, tax credits, etc.)
(Martinot, 2005). Moreover, 15 countries provided tradable (renewable) energy certificates
that could be used, for example, on the European climate exchange (Japan and Australia were
the only non-European countries to offer this option). It is also clear that state ownership and
public investment are often required to facilitate the development of wind power.
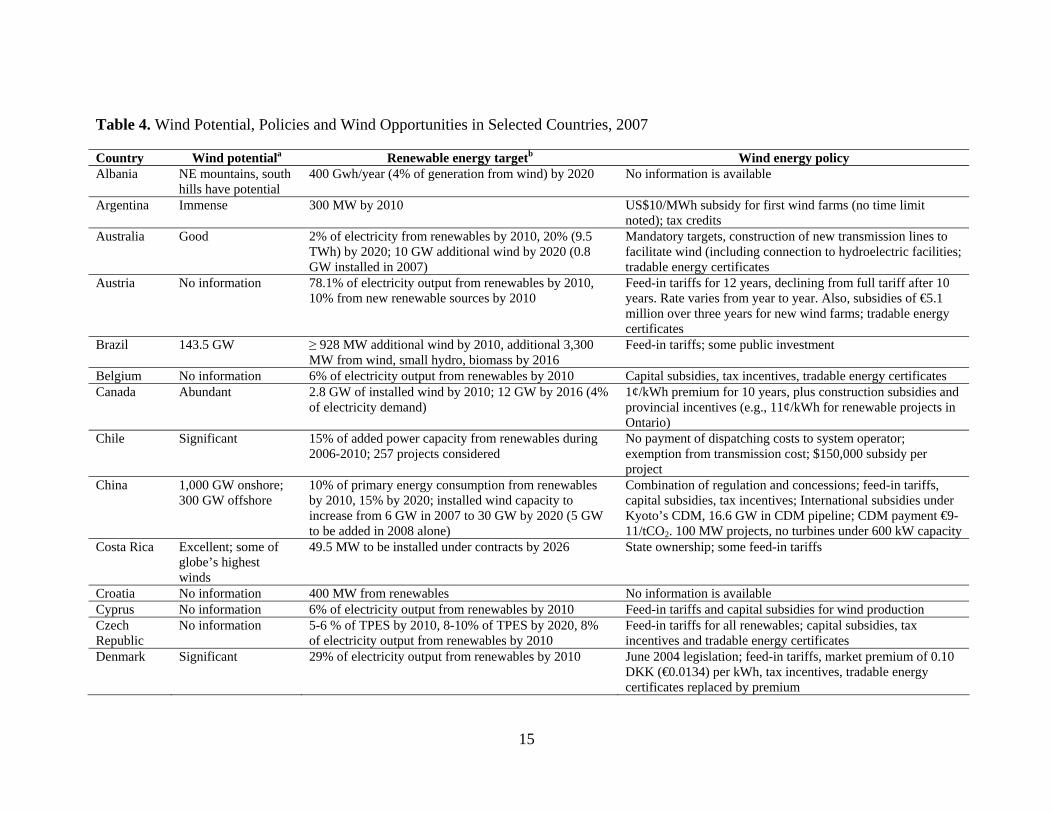
Table 4. Wind Potential, Policies and Wind Opportunities in Selected Countries, 2007
Country Wind potentiala Renewable energy targetb Wind energy policy Albania NE mountains, south
hills have potential 400 Gwh/year (4% of generation from wind) by 2020 No information is available
Argentina Immense 300 MW by 2010 US$10/MWh subsidy for first wind farms (no time limit noted); tax credits
Australia Good 2% of electricity from renewables by 2010, 20% (9.5 TWh) by 2020; 10 GW additional wind by 2020 (0.8 GW installed in 2007)
Mandatory targets, construction of new transmission lines to facilitate wind (including connection to hydroelectric facilities; tradable energy certificates
Austria No information 78.1% of electricity output from renewables by 2010, 10% from new renewable sources by 2010
Feed-in tariffs for 12 years, declining from full tariff after 10 years. Rate varies from year to year. Also, subsidies of €5.1 million over three years for new wind farms; tradable energy certificates
Brazil 143.5 GW
≥ 928 MW additional wind by 2010, additional 3,300 MW from wind, small hydro, biomass by 2016
Feed-in tariffs; some public investment
Belgium No information 6% of electricity output from renewables by 2010 Capital subsidies, tax incentives, tradable energy certificates Canada Abundant 2.8 GW of installed wind by 2010; 12 GW by 2016 (4%
of electricity demand) 1¢/kWh premium for 10 years, plus construction subsidies and provincial incentives (e.g., 11¢/kWh for renewable projects in Ontario)
Chile Significant 15% of added power capacity from renewables during 2006-2010; 257 projects considered
No payment of dispatching costs to system operator; exemption from transmission cost; $150,000 subsidy per project
China 1,000 GW onshore; 300 GW offshore
10% of primary energy consumption from renewables by 2010, 15% by 2020; installed wind capacity to increase from 6 GW in 2007 to 30 GW by 2020 (5 GW to be added in 2008 alone)
Combination of regulation and concessions; feed-in tariffs, capital subsidies, tax incentives; International subsidies under Kyoto’s CDM, 16.6 GW in CDM pipeline; CDM payment €9-11/tCO2. 100 MW projects, no turbines under 600 kW capacity
Costa Rica Excellent; some of globe’s highest winds
49.5 MW to be installed under contracts by 2026 State ownership; some feed-in tariffs
Croatia No information 400 MW from renewables No information is available Cyprus No information 6% of electricity output from renewables by 2010 Feed-in tariffs and capital subsidies for wind production Czech Republic
No information 5-6 % of TPES by 2010, 8-10% of TPES by 2020, 8% of electricity output from renewables by 2010
Feed-in tariffs for all renewables; capital subsidies, tax incentives and tradable energy certificates
Denmark Significant 29% of electricity output from renewables by 2010 June 2004 legislation; feed-in tariffs, market premium of 0.10 DKK (€0.0134) per kWh, tax incentives, tradable energy certificates replaced by premium
15
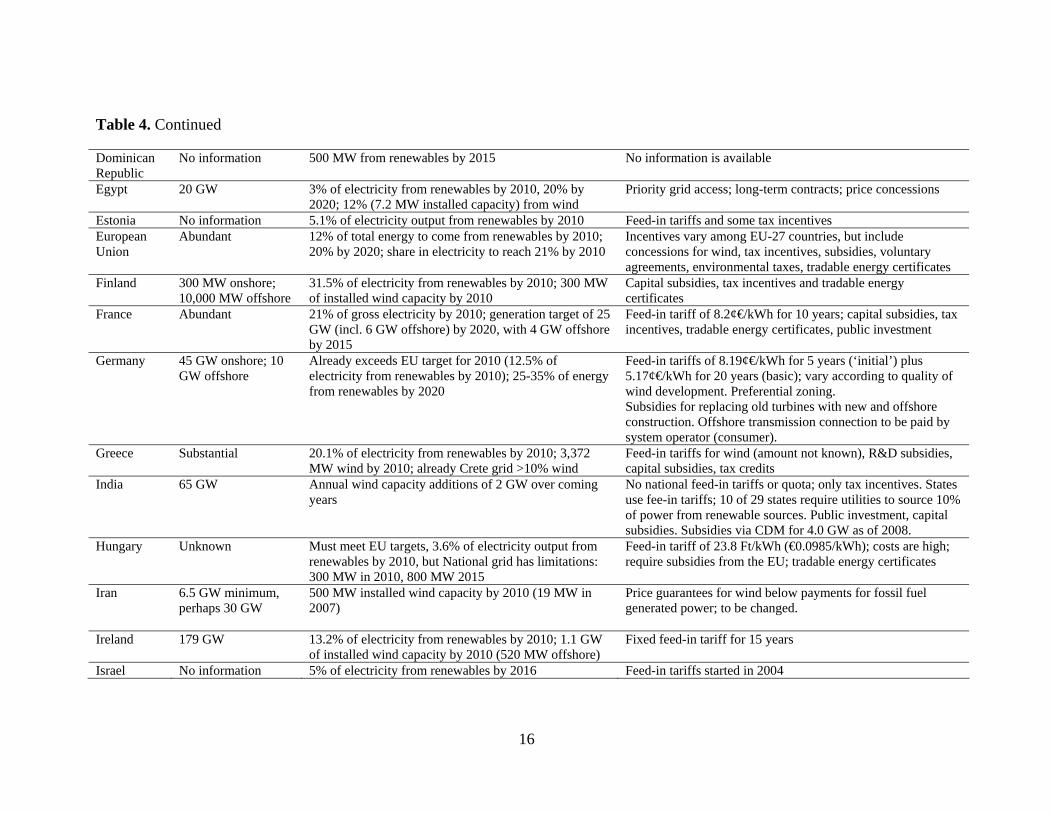
Table 4. Continued
Dominican Republic
No information 500 MW from renewables by 2015 No information is available
Egypt 20 GW 3% of electricity from renewables by 2010, 20% by 2020; 12% (7.2 MW installed capacity) from wind
Priority grid access; long-term contracts; price concessions
Estonia No information 5.1% of electricity output from renewables by 2010 Feed-in tariffs and some tax incentives European Union
Abundant 12% of total energy to come from renewables by 2010; 20% by 2020; share in electricity to reach 21% by 2010
Incentives vary among EU-27 countries, but include concessions for wind, tax incentives, subsidies, voluntary agreements, environmental taxes, tradable energy certificates
Finland 300 MW onshore; 10,000 MW offshore
31.5% of electricity from renewables by 2010; 300 MW of installed wind capacity by 2010
Capital subsidies, tax incentives and tradable energy certificates
France Abundant 21% of gross electricity by 2010; generation target of 25 GW (incl. 6 GW offshore) by 2020, with 4 GW offshore by 2015
Feed-in tariff of 8.2¢€/kWh for 10 years; capital subsidies, tax incentives, tradable energy certificates, public investment
Germany 45 GW onshore; 10 GW offshore
Already exceeds EU target for 2010 (12.5% of electricity from renewables by 2010); 25-35% of energy from renewables by 2020
Feed-in tariffs of 8.19¢€/kWh for 5 years (‘initial’) plus 5.17¢€/kWh for 20 years (basic); vary according to quality of wind development. Preferential zoning. Subsidies for replacing old turbines with new and offshore construction. Offshore transmission connection to be paid by system operator (consumer).
Greece Substantial 20.1% of electricity from renewables by 2010; 3,372 MW wind by 2010; already Crete grid >10% wind
Feed-in tariffs for wind (amount not known), R&D subsidies, capital subsidies, tax credits
India 65 GW Annual wind capacity additions of 2 GW over coming years
No national feed-in tariffs or quota; only tax incentives. States use fee-in tariffs; 10 of 29 states require utilities to source 10% of power from renewable sources. Public investment, capital subsidies. Subsidies via CDM for 4.0 GW as of 2008.
Hungary Unknown Must meet EU targets, 3.6% of electricity output from renewables by 2010, but National grid has limitations: 300 MW in 2010, 800 MW 2015
Feed-in tariff of 23.8 Ft/kWh (€0.0985/kWh); costs are high; require subsidies from the EU; tradable energy certificates
Iran 6.5 GW minimum, perhaps 30 GW
500 MW installed wind capacity by 2010 (19 MW in 2007)
Price guarantees for wind below payments for fossil fuel generated power; to be changed.
Ireland 179 GW 13.2% of electricity from renewables by 2010; 1.1 GW of installed wind capacity by 2010 (520 MW offshore)
Fixed feed-in tariff for 15 years
Israel No information 5% of electricity from renewables by 2016 Feed-in tariffs started in 2004
16
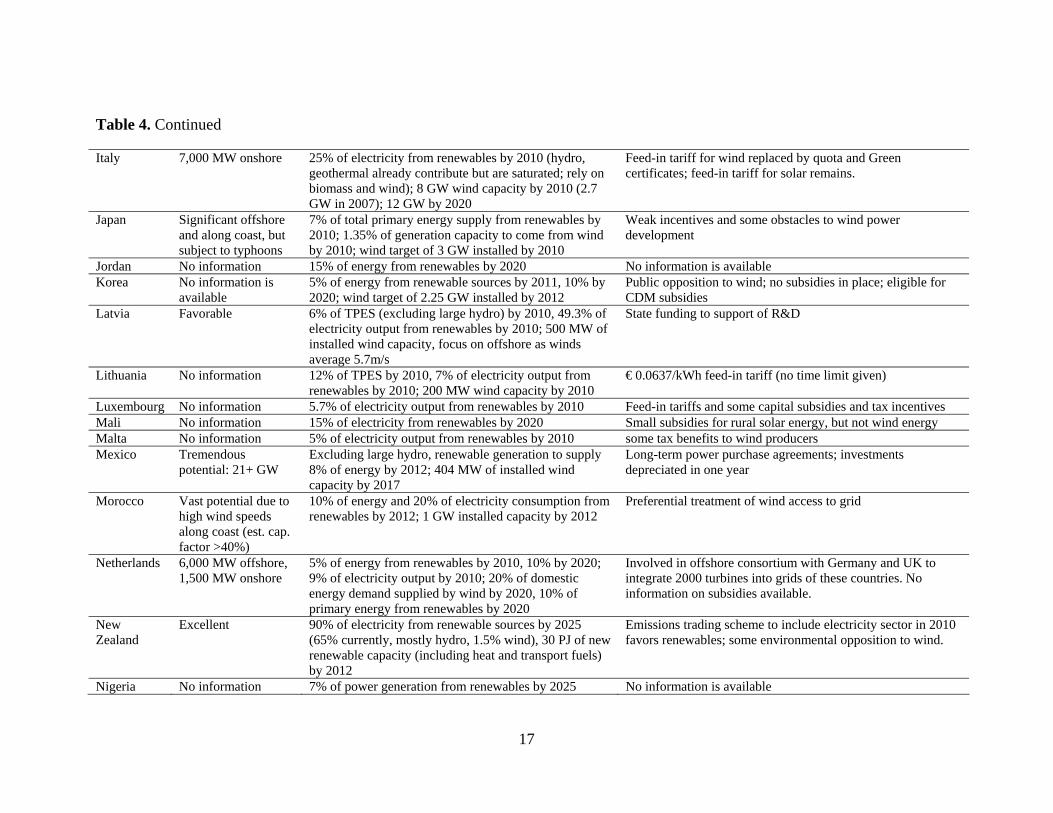
Table 4. Continued
Italy 7,000 MW onshore 25% of electricity from renewables by 2010 (hydro, geothermal already contribute but are saturated; rely on biomass and wind); 8 GW wind capacity by 2010 (2.7 GW in 2007); 12 GW by 2020
Feed-in tariff for wind replaced by quota and Green certificates; feed-in tariff for solar remains.
Japan Significant offshore and along coast, but subject to typhoons
7% of total primary energy supply from renewables by 2010; 1.35% of generation capacity to come from wind by 2010; wind target of 3 GW installed by 2010
Weak incentives and some obstacles to wind power development
Jordan No information 15% of energy from renewables by 2020 No information is available Korea No information is
available 5% of energy from renewable sources by 2011, 10% by 2020; wind target of 2.25 GW installed by 2012
Public opposition to wind; no subsidies in place; eligible for CDM subsidies
Latvia Favorable 6% of TPES (excluding large hydro) by 2010, 49.3% of electricity output from renewables by 2010; 500 MW of installed wind capacity, focus on offshore as winds average 5.7m/s
State funding to support of R&D
Lithuania No information 12% of TPES by 2010, 7% of electricity output from renewables by 2010; 200 MW wind capacity by 2010
€ 0.0637/kWh feed-in tariff (no time limit given)
Luxembourg No information 5.7% of electricity output from renewables by 2010 Feed-in tariffs and some capital subsidies and tax incentives Mali No information 15% of electricity from renewables by 2020 Small subsidies for rural solar energy, but not wind energy Malta No information 5% of electricity output from renewables by 2010 some tax benefits to wind producers Mexico Tremendous
potential: 21+ GW Excluding large hydro, renewable generation to supply 8% of energy by 2012; 404 MW of installed wind capacity by 2017
Long-term power purchase agreements; investments depreciated in one year
Morocco Vast potential due to high wind speeds along coast (est. cap. factor >40%)
10% of energy and 20% of electricity consumption from renewables by 2012; 1 GW installed capacity by 2012
Preferential treatment of wind access to grid
Netherlands 6,000 MW offshore, 1,500 MW onshore
5% of energy from renewables by 2010, 10% by 2020; 9% of electricity output by 2010; 20% of domestic energy demand supplied by wind by 2020, 10% of primary energy from renewables by 2020
Involved in offshore consortium with Germany and UK to integrate 2000 turbines into grids of these countries. No information on subsidies available.
New Zealand
Excellent 90% of electricity from renewable sources by 2025 (65% currently, mostly hydro, 1.5% wind), 30 PJ of new renewable capacity (including heat and transport fuels) by 2012
Emissions trading scheme to include electricity sector in 2010 favors renewables; some environmental opposition to wind.
Nigeria No information 7% of power generation from renewables by 2025 No information is available
17
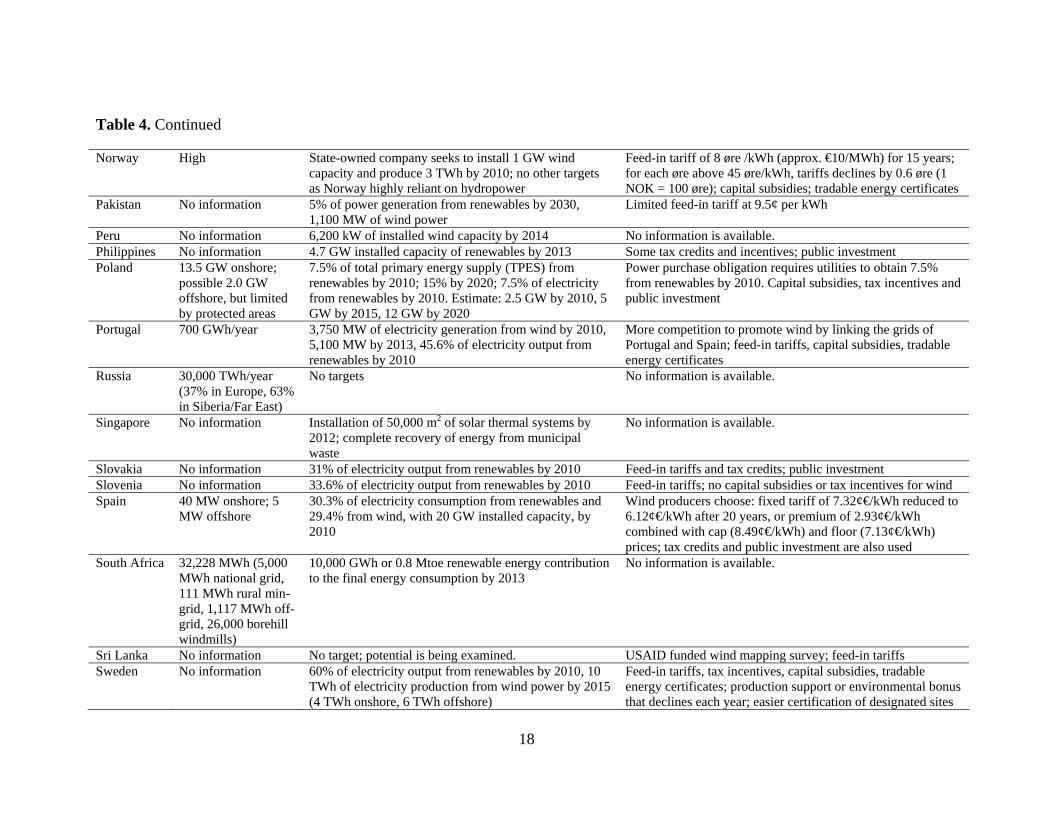
Table 4. Continued
Norway High State-owned company seeks to install 1 GW wind capacity and produce 3 TWh by 2010; no other targets as Norway highly reliant on hydropower
Feed-in tariff of 8 øre /kWh (approx. €10/MWh) for 15 years; for each øre above 45 øre/kWh, tariffs declines by 0.6 øre (1 NOK = 100 øre); capital subsidies; tradable energy certificates
Pakistan No information 5% of power generation from renewables by 2030, 1,100 MW of wind power
Limited feed-in tariff at 9.5¢ per kWh
Peru No information 6,200 kW of installed wind capacity by 2014 No information is available. Philippines No information 4.7 GW installed capacity of renewables by 2013 Some tax credits and incentives; public investment Poland 13.5 GW onshore;
possible 2.0 GW offshore, but limited by protected areas
7.5% of total primary energy supply (TPES) from renewables by 2010; 15% by 2020; 7.5% of electricity from renewables by 2010. Estimate: 2.5 GW by 2010, 5 GW by 2015, 12 GW by 2020
Power purchase obligation requires utilities to obtain 7.5% from renewables by 2010. Capital subsidies, tax incentives and public investment
Portugal 700 GWh/year 3,750 MW of electricity generation from wind by 2010, 5,100 MW by 2013, 45.6% of electricity output from renewables by 2010
More competition to promote wind by linking the grids of Portugal and Spain; feed-in tariffs, capital subsidies, tradable energy certificates
Russia 30,000 TWh/year (37% in Europe, 63% in Siberia/Far East)
No targets No information is available.
Singapore No information Installation of 50,000 m2 of solar thermal systems by 2012; complete recovery of energy from municipal waste
No information is available.
Slovakia No information 31% of electricity output from renewables by 2010 Feed-in tariffs and tax credits; public investment Slovenia No information 33.6% of electricity output from renewables by 2010 Feed-in tariffs; no capital subsidies or tax incentives for wind Spain 40 MW onshore; 5
MW offshore 30.3% of electricity consumption from renewables and 29.4% from wind, with 20 GW installed capacity, by 2010
Wind producers choose: fixed tariff of 7.32¢€/kWh reduced to 6.12¢€/kWh after 20 years, or premium of 2.93¢€/kWh combined with cap (8.49¢€/kWh) and floor (7.13¢€/kWh) prices; tax credits and public investment are also used
South Africa 32,228 MWh (5,000 MWh national grid, 111 MWh rural min-grid, 1,117 MWh off-grid, 26,000 borehill windmills)
10,000 GWh or 0.8 Mtoe renewable energy contribution to the final energy consumption by 2013
No information is available.
Sri Lanka No information No target; potential is being examined. USAID funded wind mapping survey; feed-in tariffs Sweden No information 60% of electricity output from renewables by 2010, 10
TWh of electricity production from wind power by 2015 (4 TWh onshore, 6 TWh offshore)
Feed-in tariffs, tax incentives, capital subsidies, tradable energy certificates; production support or environmental bonus that declines each year; easier certification of designated sites
18
19
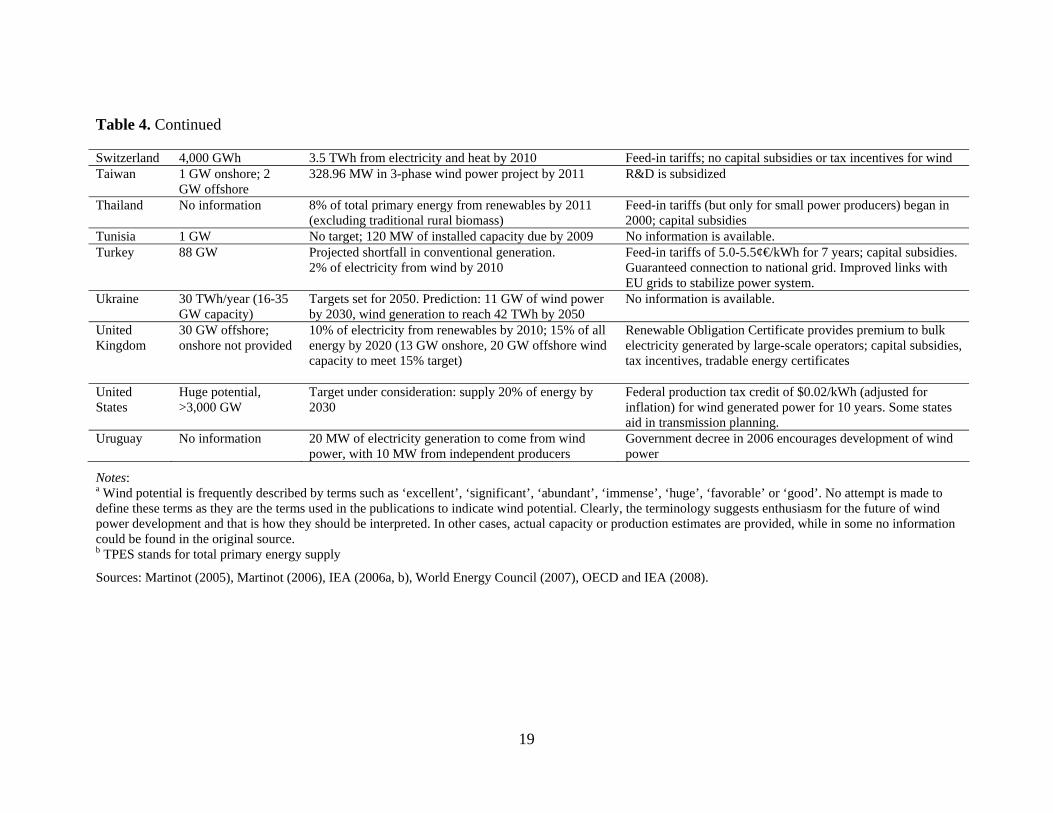
Table 4. Continued
Switzerland 4,000 GWh 3.5 TWh from electricity and heat by 2010 Feed-in tariffs; no capital subsidies or tax incentives for wind Taiwan 1 GW onshore; 2
GW offshore 328.96 MW in 3-phase wind power project by 2011 R&D is subsidized
Thailand No information 8% of total primary energy from renewables by 2011 (excluding traditional rural biomass)
Feed-in tariffs (but only for small power producers) began in 2000; capital subsidies
Tunisia 1 GW No target; 120 MW of installed capacity due by 2009 No information is available. Turkey 88 GW Projected shortfall in conventional generation.
2% of electricity from wind by 2010 Feed-in tariffs of 5.0-5.5¢€/kWh for 7 years; capital subsidies. Guaranteed connection to national grid. Improved links with EU grids to stabilize power system.
Ukraine 30 TWh/year (16-35 GW capacity)
Targets set for 2050. Prediction: 11 GW of wind power by 2030, wind generation to reach 42 TWh by 2050
No information is available.
United Kingdom
30 GW offshore; onshore not provided
10% of electricity from renewables by 2010; 15% of all energy by 2020 (13 GW onshore, 20 GW offshore wind capacity to meet 15% target)
Renewable Obligation Certificate provides premium to bulk electricity generated by large-scale operators; capital subsidies, tax incentives, tradable energy certificates
United States
Huge potential, >3,000 GW
Target under consideration: supply 20% of energy by 2030
Federal production tax credit of $0.02/kWh (adjusted for inflation) for wind generated power for 10 years. Some states aid in transmission planning.
Uruguay No information 20 MW of electricity generation to come from wind power, with 10 MW from independent producers
Government decree in 2006 encourages development of wind power
Notes: a Wind potential is frequently described by terms such as ‘excellent’, ‘significant’, ‘abundant’, ‘immense’, ‘huge’, ‘favorable’ or ‘good’. No attempt is made to define these terms as they are the terms used in the publications to indicate wind potential. Clearly, the terminology suggests enthusiasm for the future of wind power development and that is how they should be interpreted. In other cases, actual capacity or production estimates are provided, while in some no information could be found in the original source. b TPES stands for total primary energy supply
Sources: Martinot (2005), Martinot (2006), IEA (2006a, b), World Energy Council (2007), OECD and IEA (2008).
Fiscal instruments are the policy instruments most commonly used to support wind
power. In the United States, for example, a wind energy production tax credit (PTC) is used to
encourage investment in wind generating capacity. The PTC provides an income tax credit of
2.0¢ per kWh for production of electricity from wind and other renewable sources. It is
adjusted annually for inflation, is in effect for the first ten years of production, but applies
only to large-scale power producers and not the installation of small turbines for individual
use (see Steve, Severn and Raum 2008). India also promotes growth in its wind industry by
supplying generous tax credits to the private sector (Martinot, 2002). Other countries provide
feed-in tariffs or tax incentives amounting to 1.5¢ (in U.S. funds) to 10¢ or more per kWh
delivered to the grid; the length of time a project can collect such payments varies, and
downward sliding payment scale is common.
7. Integration of Wind Power into Electricity Grids
Intermittency is the greatest obstacle to the seamless integration of wind generated
power into electrical grids. When there is no wind, no power is generated; the wind comes
and goes, and does not always blow with the same intensity (Scott 2007). Like solar PV or
run-of-the-river hydro, wind power enters an electrical grid whenever there is an adequate
amount of the resource available for generating electricity, but, unlike run-of-river hydro, the
supply of wind power will fluctuate more than that of traditional thermal or large hydro
generating sources that serve base load and are dispatched according to electricity demand.
The intermittent nature of wind gives rise to two types of indirect costs: (i) the costs of
additional system reserves to cover intermittency, and (ii) the extra costs associated with
balancing or managing an electricity system when power from one (or more) generation
sources fluctuates.
Consider first the issue of system reserves. By installing wind generating capacity,
greater system balancing reserves are required than would normally be the case if an
equivalent amount of thermal or hydro capacity were installed, even after adjusting for the
lower capacity factors associated with wind (Gross et al, 2003, 2006; Kennedy, 2005). The
reliability of power from wind farms due to a high variability in wind is lower than that of
thermal or hydro sources of power and must be compensated for by greater system reserves.
20
Suppose that σs and σd are the standard deviations of supply and demand fluctuations,
respectively. Then, as a rule of thumb, a system operator requires reserves equal to three
standard deviations of all potential fluctuations, or reserves = ±3 22ds (see Gross et al.,
2006, 2007; DeCarolis and Keith, 2005). If wind farms are added to an existing grid, required
reserves must be increased to ±3 222wds , where σw is the standard deviation associated
with wind intermittency. If σw > σs and wind replaces other generation that is more reliable,
then reserves must increase; if σw < σs, reserve capacity would decline. How large must the
additional reserves be? According to Gross et al. (2006, 2007), assuming no correlation
between demand and variable supply from wind, additional reserve requirements would be
small. Based on empirical wind data, they estimate that the standard deviations of wind
fluctuations amount to 1.4% of installed wind capacity for a 30-minute time horizon
(regulating or fast-response reserve) and 9.3% of installed capacity over a four-hour time
period (contingency or standing reserve). Assume 10 GW of installed wind capacity, σw = 140
MW for regulating and σw = 930 MW for contingency reserves, and total generating capacity
of 24.3 GW. Then, if σs+σd = 340 MW, regulating reserves would need to equal 1020 MW (=
3 × 2340 ) without wind and 1181 MW (=3× 22 140340 ) with wind, while respective
contingency reserves would need to be 6780 MW and 7332 MW. Thus, wind intermittency
requires increases in regulating reserves of 15.8% (161 MW) and contingency reserves of
8.1% (552 MW).6 Although this might be considered a small addition to overall reserves, the
financial implications are significant
In addition to the need for greater system reserves, there is a second cost associated
with the need to retain system balance, the added cost of managing the grid (Lund, 2005).
How the grid is to be managed depends on the policy implemented by the authority. If the
grid operator is required to take any wind power that is offered, wind power is then non-
dispatchable, or ‘must run’. In that case, existing generators may need to operate at below
optimal capacity, while ready to dispatch power to the grid in the event of a decline in wind
6 These are the current authors’ calculations using values from Gross et al (2007). Although not given, total generating capacity is approximately 24.3 GW. However, there is no discussion in Gross et al. (2006, 2007) as to whether wind generating capacity simply replaces conventional generating capacity, yet this seems to be the logical assumption based on the discussion found in these sources. Our analysis suggests that this is a highly optimistic analysis of wind power.
21
availability. Peak-load diesel and simple (open-cycle) gas plants and, to a much lesser degree,
combined-cycle gas turbine (CCGT) plants are able to ramp up and down to some extent in
order to follow fluctuations in wind power availability. With non-dispatchable wind power
entering a grid, there is an economic cost because peak-load and load-following generators
operate more often below their optimal efficiency ratings (less than their optimal
instantaneous capacity factors) – wind variability causes peak-load diesel and open-cycle gas
plants to stop and start more frequently, which increases O&M costs. Furthermore, the grid
operator is often required to sell excess power to another operator, usually at low cost. This is
the case in Denmark, for example, where the ‘must-run’ requirement for both wind and CHP
generated power requires the operator to export large amounts of electricity, especially at
night when load is low and CHP and wind power might be high (Pitt et al., 2005).
This problem is exacerbated as wind penetration increases, particularly if the load
remaining when wind generated power is subtracted exceeds the output of base-load power
plants. Coal-fired power plants can ramp down only very slightly at night (when load is low
and wind power might become available) so they can return to full operation during the day,
although costs of operating below optimal capacity are generally high. (They can reduce
output quickly only by venting steam, which can lower heat by hundreds of degrees Celsius,
but at very high cost to equipment.) Nuclear power plants cannot ramp up and down over the
time frames under consideration. Thus, whenever wind power is available excess power from
base-load generators must be sold into another grid, perhaps displacing renewable energy
production in some other jurisdiction (e.g., where no ‘must-run’ requirement exists).7 If wind
penetration is high, management of the grid may become especially problematic if wind
resources are designated ‘must-run’ or non-dispatchable (Liik et al., 2003; Lund, 2005; Pitt et
al., 2005). The indirect grid management costs are likely the highest costs associated with
wind energy (Prescott et al., 2007; Maddaloni, Rowe and van Kooten, 2008a, 2008b),
although this certainly warrants further investigation.
While this problem could be mitigated by storage of wind power, no viable large-scale
storage systems are currently available. Because of the storage problem associated with the
intermittency of supply, wind power is used most effectively in electricity grids that have
7 Surprisingly, there are no studies of which we are aware that have examined the economics of displaced power in other jurisdictions.
22
large hydropower capacity. In that case, water can be stored in reservoirs by withholding
hydroelectricity from the grid when non-dispatchable wind power is produced, but releasing
water and generating electricity when there is no wind power. This is precisely what happens
with wind power in Denmark, where hydro reservoirs in Norway provide de facto storage
(White, 2004; Lund, 2005), while lack of storage and/or connections to a larger market make
wind power a less attractive option in Ireland and Estonia (Liik et al., 2003; ESB, 2004).
An alternative policy is to make wind power dispatchable by requiring wind operators
to reduce output (by ‘feathering’ wind turbines or simply stopping blades from rotating)
whenever the grid operator is unable to absorb the extra electricity. In this case, output from
base-load plants is effectively given precedence over wind generated power because such
plants cannot be ramped up and down, the ramping costs are too great, and/or excess power
cannot be stored or sold. (In Alberta, for example, further expansion of wind farms was
permitted only after developers agreed to control power output so that wind power was no
longer ‘must run’.) This policy makes investments in wind farms must less attractive as it
increases costs, and is usually unacceptable to environmental groups as it is perceived as a
waste of renewable energy. Nonetheless, it might be the only way in which a grid can be
managed to include wind power, especially as wind penetration levels increase.
One argument used to minimize intermittency and storage concerns relates to the
placement of wind farms. If wind farms are placed over a large geographic area, then, for the
same installed wind power capacity, the output would be smoother than if it were to come
from a wind farm at a single site. Therefore, to overcome variability, it is necessary to locate
wind farms across as large a geographic areas as possible and integrate their combined output
into a large grid. By establishing wind farms across the entire country, onshore and offshore,
the United Kingdom hopes to minimize the problems associated with intermittency. In
addition, by connecting all countries of Europe and placing wind farms throughout the
continent as well as in Britain and Ireland, the hope is to increase the ability to employ wind
generated power. Unfortunately, as demonstrated by Oswald, Raine, and Ashraf-Ball (2008),
large weather systems can influence the British Isles and the European continent
simultaneously. They demonstrate that at 18:00 hours on February 2, 2006, electricity demand
in the United Kingdom peaked, but wind power was zero (indeed wind farms added to the
load at that time). At the same time, wind power output in Germany, Spain and Ireland was
23
also extremely low – 4.3%, 2.2% and 10.6% of capacities, respectively. Thus, even a super
grid with many wind farms scattered over a large landscape cannot avoid the problems
associated with intermittency, including the need to manage delivery of power from various
non-wind power generators.
The challenge to integrate wind energy into existing electricity grids depends on
several factors, such as the availability of suitable sites for wind farms, the generation mix of
the electricity grid, and government policies to support wind power. The best sites are those
located on land where wind turbines least interfere with other land uses, where noise and
visual externalities are minimal, and where the effect on wildlife is small. Sites should be
scattered over a sufficiently large area so that they are not affected by the same weather
patterns – so that the correlation of low wind among sites is minimal. Further, wind sites need
to be connected to a transmission grid, and if such a grid does not exist in close proximity, the
costs for deploying wind power become exceedingly large.
8. Climate Change and Wind Power
Climate change initiatives have done much to promote wind energy over the past
decade both in developed and developing countries. In the developed countries, fiscal policies
and regulatory mandates enacted to meet Kyoto commitments have promoted wind power. In
the developing countries, the Clean Development Mechanism of the Kyoto Protocol has
played a catalytic role. Various international organizations, particularly the World Bank
Group and the United Nations’ Development Program (UNDP), have also contributed
significantly to the financing of wind power projects through the Global Environmental
Facility (GEF).
As can be seen from Table 4, many developed countries have set targets for
developing wind power along with other renewable energy sources. In choosing targets and
policies, countries take into account a variety of considerations including climate change
mitigation goals and obligations. For example, Australia is planning to install 10 GW of wind
power capacity by 2020; Canada is planning to have 12 GW of wind capacity by 2016; Japan,
Italy and Spain are planning to have 3 GW, 8 GW and 20 GW, respectively, of wind power
capacity by 2010. In developing countries, the CDM has played an instrumental role in
implementing wind power projects. By early 2009, 180 wind power projects with a combined
24
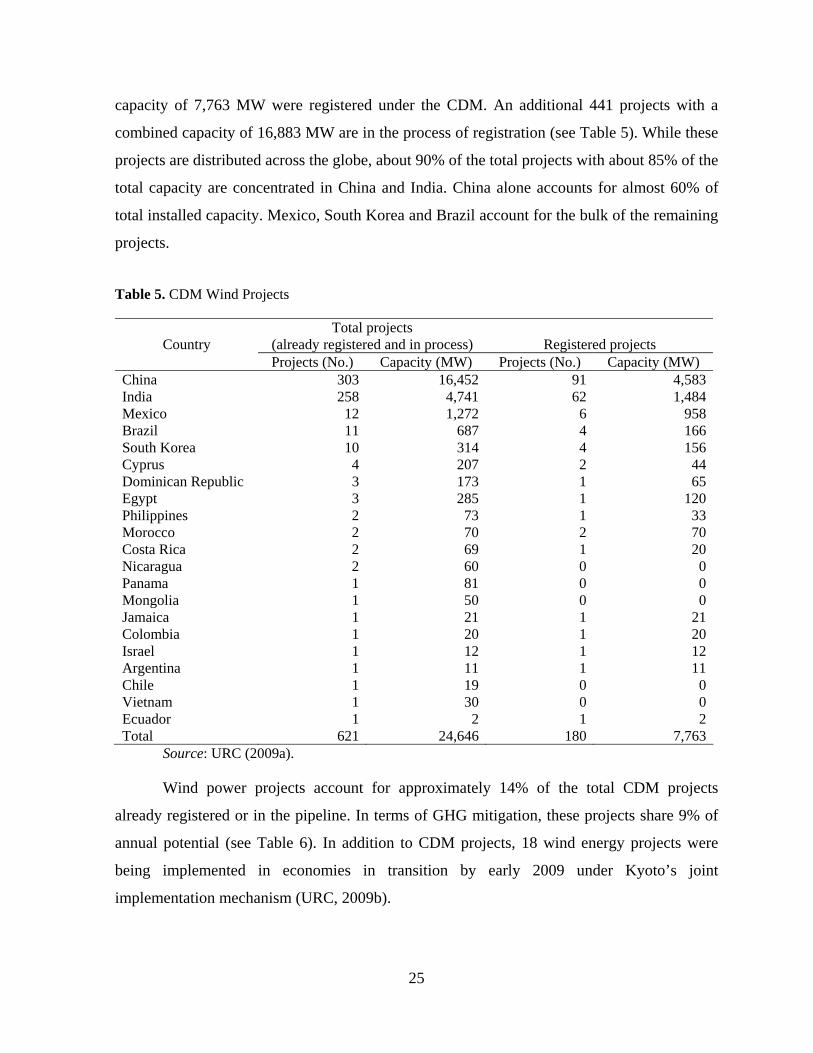
capacity of 7,763 MW were registered under the CDM. An additional 441 projects with a
combined capacity of 16,883 MW are in the process of registration (see Table 5). While these
projects are distributed across the globe, about 90% of the total projects with about 85% of the
total capacity are concentrated in China and India. China alone accounts for almost 60% of
total installed capacity. Mexico, South Korea and Brazil account for the bulk of the remaining
projects.
Table 5. CDM Wind Projects
Country Total projects
(already registered and in process) Registered projects Projects (No.) Capacity (MW) Projects (No.) Capacity (MW)
China 303 16,452 91 4,583India 258 4,741 62 1,484Mexico 12 1,272 6 958Brazil 11 687 4 166South Korea 10 314 4 156Cyprus 4 207 2 44Dominican Republic 3 173 1 65Egypt 3 285 1 120Philippines 2 73 1 33Morocco 2 70 2 70Costa Rica 2 69 1 20Nicaragua 2 60 0 0Panama 1 81 0 0Mongolia 1 50 0 0Jamaica 1 21 1 21Colombia 1 20 1 20Israel 1 12 1 12Argentina 1 11 1 11Chile 1 19 0 0Vietnam 1 30 0 0Ecuador 1 2 1 2Total 621 24,646 180 7,763
Source: URC (2009a).
Wind power projects account for approximately 14% of the total CDM projects
already registered or in the pipeline. In terms of GHG mitigation, these projects share 9% of
annual potential (see Table 6). In addition to CDM projects, 18 wind energy projects were
being implemented in economies in transition by early 2009 under Kyoto’s joint
implementation mechanism (URC, 2009b).
25
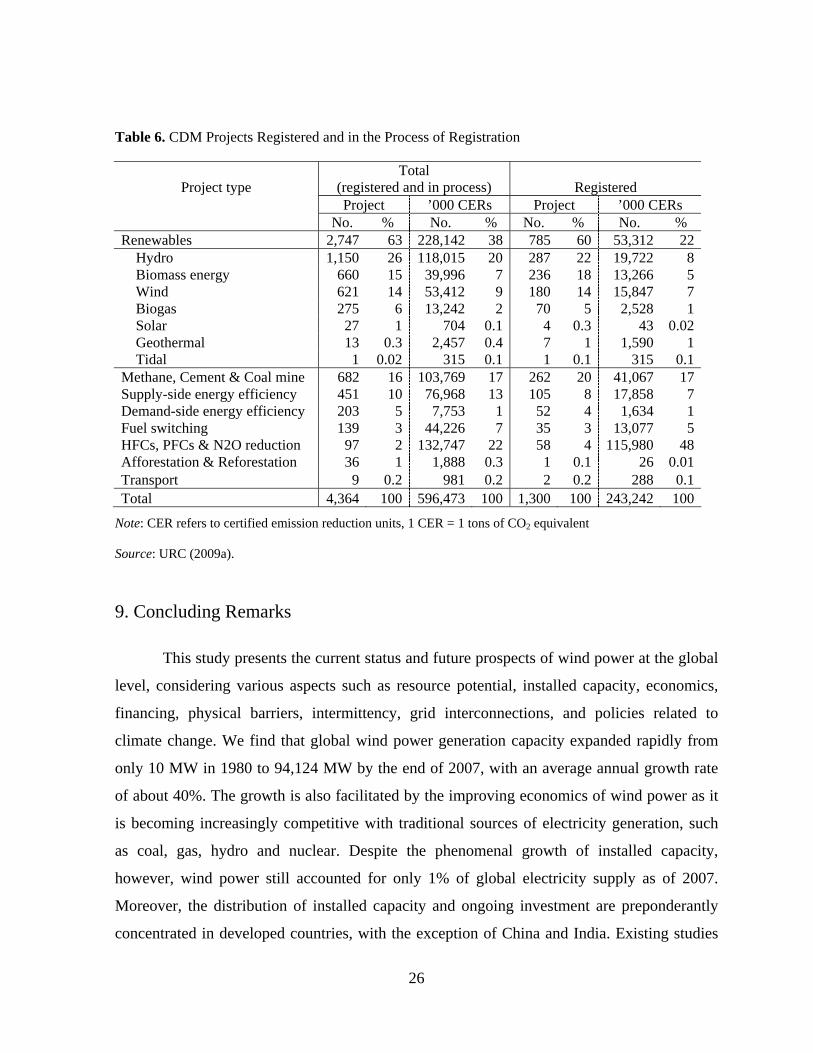
Table 6. CDM Projects Registered and in the Process of Registration
Project type Total
(registered and in process) Registered Project ’000 CERs Project ’000 CERs No. % No. % No. % No. %
Renewables 2,747 63 228,142 38 785 60 53,312 22 Hydro 1,150 26 118,015 20 287 22 19,722 8 Biomass energy 660 15 39,996 7 236 18 13,266 5 Wind 621 14 53,412 9 180 14 15,847 7 Biogas 275 6 13,242 2 70 5 2,528 1 Solar 27 1 704 0.1 4 0.3 43 0.02 Geothermal 13 0.3 2,457 0.4 7 1 1,590 1 Tidal 1 0.02 315 0.1 1 0.1 315 0.1Methane, Cement & Coal mine 682 16 103,769 17 262 20 41,067 17Supply-side energy efficiency 451 10 76,968 13 105 8 17,858 7Demand-side energy efficiency 203 5 7,753 1 52 4 1,634 1Fuel switching 139 3 44,226 7 35 3 13,077 5HFCs, PFCs & N2O reduction 97 2 132,747 22 58 4 115,980 48Afforestation & Reforestation 36 1 1,888 0.3 1 0.1 26 0.01Transport 9 0.2 981 0.2 2 0.2 288 0.1Total 4,364 100 596,473 100 1,300 100 243,242 100
Note: CER refers to certified emission reduction units, 1 CER = 1 tons of CO2 equivalent
Source: URC (2009a).
9. Concluding Remarks
This study presents the current status and future prospects of wind power at the global
level, considering various aspects such as resource potential, installed capacity, economics,
financing, physical barriers, intermittency, grid interconnections, and policies related to
climate change. We find that global wind power generation capacity expanded rapidly from
only 10 MW in 1980 to 94,124 MW by the end of 2007, with an average annual growth rate
of about 40%. The growth is also facilitated by the improving economics of wind power as it
is becoming increasingly competitive with traditional sources of electricity generation, such
as coal, gas, hydro and nuclear. Despite the phenomenal growth of installed capacity,
however, wind power still accounted for only 1% of global electricity supply as of 2007.
Moreover, the distribution of installed capacity and ongoing investment are preponderantly
concentrated in developed countries, with the exception of China and India. Existing studies
26
estimate that wind power could account for 7% to 34% of the global electricity supply by
2050. The ability to continue expansion of wind power will depend, however, on the specific
circumstances facing a country or region, such as the generation mix of the grid to which
wind will be connected, the distance between wind farms and the nearest grid connection,
economic incentives, and institutional support. It also depends on prices of improvements in
wind technology, fossil fuels, economic and political developments surrounding nuclear
power, and the cost and availability of other renewable sources of energy.
Wind power faces a large number of technical, financial, economic, institutional,
market and other barriers. The intermittent nature of wind power and the relative remoteness
of locations where wind resources normally exist are key technical and economic barriers.
Relatively higher upfront capital costs and lack of access to financing, especially in
developing countries, are some key financial barriers. To overcome these barriers, many
developed countries have introduced a variety of policy instruments, the most common of
which are capital subsidies, tax incentives and feed-in tariffs. However, existing policy
instruments alone are not adequate to increase significantly the share of wind power in the
global electricity supply mix. To accomplish this, new and innovative policy instruments and
strong institutional support would be necessary, as well as further advance in wind technology
to lower its cost at larger scales of supply.
Climate change mitigation initiatives, particularly the Kyoto commitments and the
flexibility mechanisms under the Kyoto Protocol, play pivotal roles in promoting wind power.
In order to meet their Kyoto commitments, many developed countries have set domestic
targets for wind power expansion, while developing countries are actively investing in wind
power projects using funds available through the clean development mechanism. As of June
2008, wind power projects with a combined capacity of close to 8 GW had already been
registered under the CDM and an additional almost 17 GW are in the process. Moreover,
more stringent GHG mitigation targets beyond 2012 will likely help accelerate the expansion
of wind power across the globe.
The paper does address the normative question of how much additional investment in
wind capacity should be undertaken by developing countries, and through what means. We
can observe that without efforts to lower institutional, regulatory and financing barriers, even
cost-effective investments in wind capacity are impeded. At the same time, more fundamental
27
technical and economic challenges need to be overcome in order for wind ultimately to
displace significant fractions of fossil fuel electricity capacity in developing and developed
countries. This could be accomplished through both further advances in the technology at a
larger scale of deployment, and increases in the demand for wind technology as a
consequence of a larger global market for CO2 mitigation investments.
References
Amin, A.L. 1999. “Institutional Barriers to Commercialization of Wind Power in India: The
Case of Gujarat.” Working Paper No. 7. Center for International Climate and
Environmental Research, Oslo, Norway.
Anderson, D. and S. Winne. 2007. “Energy system change and external effects in climate
change mitigation.” Journal of Economics and Development 12: 351-357.
Archer, C.L. and M.Z. Jacobson. 2005. “Evaluation of global wind power.” Journal of
Geophysical Research 110: D12110, doi:10.1029/2004JD005462.
Ayres, R.U. 2008. “Sustainability economics: where do we stand?” Ecological Economics 67:
281-310.
Beck, F. and E. Martinot. 2004. “Renewable Energy Policies and Barriers.” In Encyclopedia
of Energy, ed. Cutler J. Cleveland. Academic Press/Elsevier Science.
California Public Utilities Commission (CUPC). 2008.
http://www.sourcewatch.org/index.php?title=Comparative_electrical_generation_costs
, Downloaded on 16 January 2009.
Commission of the European Communities (CEC), 2008. Proposal for a Directive of the
European Parliament and of the Council on the Promotion of the Use of Energy from
Renewable Sources, Brussels, January 23, 2008. Available at
http://ec.europa.eu/energy/climate_actions/doc/2008_res_directive_en.pdf
DeCarolis, J.F. and D.W. Keith. 2005. “The Costs of Wind's Variability: Is There a
Threshold?” The Electricity Journal 18: 69-77.
Earth Policy Institute (EPI). 2008. “Eco-Economy Indicators.” Retrieved from
http://www.earth-policy.org/Indicators/Wind/2008_data.htm#fig2, May 29, 2008.
Energy Information Administration (EIA). 2008. “International Energy Outlook 2008.”
Washington, DC.
28
Energy Sector Management Assistance Program (ESMAP) and World Bank (WB), 2008.
Study of Equipment Prices in the Energy Sector..Washington, DC. April. 165pp.
ESB (Electricity Supply Board). 2004. “Impact of Wind Power Generation in Ireland on the
Operation of Conventional Plant and the Economic Implications.” February. 42pp.
ESB National Grid, Dublin, Ireland.
Gross, R., P. Heptonstall, D. Anderson, T. Green, M. Leach, and J. Skea. 2006. “The Costs
and Impacts of Intermittency: An Assessment of the Evidence on the Costs and
Impacts of Intermittent Generation on the British Electricity Network.” UK Energy
Research Centre, London. Retrieved from http://www.ukerc.ac.uk/Downloads/PDF/
06/0604Intermittency/0604IntermittencyReport.pdf , April 25, 2008.
Gross, R., P. Heptonstall, M. Leach, D. Anderson, T. Green, and J. Skea. 2007. “Renewables
and the Grid: Understanding Intermittency.” Energy 160(1): 31-41.
Gross, R., M. Leach, and A. Bauen. 2003. “Progress in Renewable Energy.” Environment
International 29(1): 105-122.
GWEC (Global Wind Energy Council) and Greenpeace International. 2006. “Global Wind
Energy Outlook 2006.” GWEC and Greenpeace International.
International Energy Agency (IEA). 2006a. “Wind Energy Annual Report 2006.” PWT
Communications, Boulder, Colorado. Retrieved from
http://www.ieawind.org/AnnualReports_PDF/2006%20
AR%20IEA%20Wind/2006%20IEAWind%20AR.indd.pdf, February 9, 2006.
_____. 2006b. “Renewables in Global Energy Supply: An IEA Fact Sheet.” Retrieved from
http://www1.eere.energy.gov/windandhydro/pdfs/renew_leaflet_sept2006_web.pdf,
June 13, 2008.
_____. 2008. “Energy Technology Perspectives 2008: Scenarios and Strategies to 2050.” IEA,
Paris.
InWEnt Consulting. 2004. “Wind Regimes of Africa. Comparative Evaluation of Wind Data
from Selected Countries.” In Environment, Energy and Water, ed. K. Knecht. InWEnt
Division, Berlin, Germany. Retrieved from http://www.afriwea.org/download/R-
WindAfrika_010404_engl.pdf, May 26, 2008.
Kammen, D. M., and S. Pacca. 2004. “Assessing the Cost of Electricity.” Annual Review of
Environment and Resources 29: 301-344.
29
Kennedy, S. 2005. “Wind Power Planning: Assessing Long-Term Costs and Benefits.”
Energy Policy 33(13): 1661-1575.
LAZARD. 2008. “Levelized Cost of Energy Analysis – Version 2.0.” Retrieved from
http://www.narucmeetings.org/Presentations/2008%20EMP%20Levelized%20Cost%2
0of%20Energy%20-%20Master%20June%202008%20(2).pdf on November 3, 2008.
Liik, O., R. Oidram, and M. Keel. 2003. “Estimation of Real Emissions Reduction Caused by
Wind Generators.” Paper presented at the International Energy Workshop. 24-26 June
2003, Laxenburg, Austria. Tallinn Technical University, International Institute for
Applied Systems Analysis, Tallinn, Estonia.
Lund, H. 2005. “Large-Scale Integration of Wind Power into Different Energy Systems.”
Energy 30(13): 2402-2412.
Maddaloni, J.D., A.M. Rowe, and G.C. van Kooten. 2008a. “Network Constrained Wind
Integration on Vancouver Island,” Energy Policy 36(2): 591-602.
Maddaloni, J.D., A.M. Rowe, and G.C. van Kooten. 2008b. “Wind Integration into various
Generation Mixtures,” Renewable Energy In press, doi:10.1016/j.renene.2008.04.019.
Martinot, E. 2002. “Grid-Based Renewable Energy in Developing Countries: Policies,
Strategies, and Lessons from the GEF.” Presented at World Renewable Energy Policy
and Strategy Forum. 13-15 June 2002, Berlin. Global Environmental Facility,
Washington, DC. Retrieved from
http://www.gefweb.org/Martinot_WCRE_June2002.pdf, June 13, 2008.
_____. 2005. “Renewables 2005: Global Status Report.” Prepared for Renewable Energy
Policy Network for the 21st Century, Paris and Worldwatch Institute, Washington,
DC. Retrieved from http://www.martinot.info/RE2005_Global_Status_Report.pdf,
June 16, 2008.
_____. 2006. “Renewables: Global Status Report: 2006 Update.” Renewable Energy Policy
Network for the 21st Century, Paris and Worldwatch Institute, Washington, DC.
Retrieved from http://www.ren21.net/globalstatusreport/download/
RE_GSR_2006_Update.pdf, June 16, 2008.
_____. 2008. “Renewables: Global Status Report: 2007.” Renewable Energy Policy Network
for the 21st Century, Paris and Worldwatch Institute, Washington, DC. Retrieved from
http://www.ren21.net/pdf/RE2007_Global_Status_Report.pdf, January 08, 2009.
30
Nuclear Energy Agency (NEA)/International Energy Agency (IEA). 2005. “Projected Costs
of Generating Electricity. 2005 Update.” Nuclear Energy Agency, IEA, OECD, Paris.
Neij, L. 2008. “Cost Development of Future Technologies for Power Generation – A Study
based on Experience Curves and Complementary Bottom-Up Assessment.” Energy
Policy 36: 2200-2210.
OECD (Organisation for Economic Co-operation and Development) and IEA. 2008. “Global
Renewable Energy Policy and Measures.” Retrieved from
http://www.iea.org/textbase/pm/?mode=re, May 26, 2008.
Oswald, J., M. Raine, and H. Ashraf-Ball. 2008. “Will British Weather Provide Reliable
Electricity?” Energy Policy 36(8): 3202-3215.
Owen, O.D. 2004. “Environmental Externalities, Market Distortions and the Economics of
Renewable Energy Technologies,” The Energy Journal 25 (3): 127-156.
Pitt, L., G.C. van Kooten, M. Love, and N. Djilali. 2005. “Utility-Scale Wind Power: Impacts
of Increased Penetration.” Paper No. IGEC-097 in Proceedings of the International
Green Energy Conference, 12-16 June, Waterloo, Ontario, Canada.
Prescott, R., G.C. van Kooten, and H. Zhu. 2007. “Potential for Wind Energy Meeting
Electricity Needs on Vancouver Island,” Energy & Environment 18(6): 723-746.
Reiche, K., A. Covarrubias, and E. Martinot. 2000. “Expanding Electricity Access to Remote
Areas: Off-Grid Rural Electrification.” In WorldPower 2000 (pp. 52-60), ed. G.
Isherwod. Isherwood Production, London, UK.
Renewable Energy Industry. 2008. “Worldwide Wind Energy Tops 100,000 Megawatts for
the First Time in 2008.” Retrieved from http://www.renewable-energy-industry.com/
business/press-releases/newsdetail.php?changeLang=en_GB&newsid=2834, June 25,
2008.
Roth, I.F. and L.L. Ambs. 2004. “Incorporating Externalities into a Full Cost Approach to
Electric Power Generation Life-Cycle Costing,” Energy 29: 2125-2144.
Scott, D.S. 2007. Smelling Land. The Hydrogen Defense against Climate Catastrophe.
Canadian Hydrogen Association and Natural Resources Canada, Ottawa, ON.
Sovacool, B.K. 2007. “Coal and nuclear technologies: creating a false dichotomy for
American energy policy,” Policy Science 40: 101-122.
31
32
Steve, J., A. Severn and B. Raum. 2008. “Wind Energy Production Tax Credit (PTC).”
AWEA, Washington, DC. Retrieved from http://www.awea.org/pubs/factsheets/
PTC_Fact_Sheet.pdf, May 27, 2008.
UNEP (United Nations Environment Programme). 2001. “Proceedings of the African High-
Level Regional Meeting on Energy and Sustainable Development.” Prepared for the
9th Session of the Commission on Sustainable Development. 10-13 January 2001,
Nairobi, Kenya. Retrieved from http://uneprisoe.org/CSD9/AfricanMeetingCSD9.pdf,
June 13, 2008.
URC (UNEP Risoe Centre on Energy, Climate and Sustainable Development). 2009a. “CDM
Pipeline Overview.” Retrieved from http://cdmpipeline.org/publications/
CDMpipeline.xls, January 23, 2009.
_____. 2009b. “JI Pipeline Overview.” Retrieved from http://cdmpipeline.org/publications/
JIpipeline.xls, January 23, 2009.
USDOE (U.S. Department of Energy). 2008. “20% Wind Energy by 2030 Increasing Wind
Energy’s Contribution to U.S. Electricity Supply.” USDOE, Washington, DC.
White, D.J. 2004. “Danish Wind: Too Good to be True?” The UTILITIES Journal, 37-39.
World Energy Council. 2007. “Country Notes,” in 2007 Survey of Energy Resources (pp. 490-
524). World Energy Council, London, UK. Retrieved from http://www.worldenergy.
org/documents/ser2007_final_online_version_1.pdf, June 13, 2008.