wind power post 2020 pipeline
TRANSCRIPT

Meet the Management, 2 February 2017
Martin Neubert, Chief Strategy Officer
WIND POWER POST 2020 PIPELINE
105
Martin NeubertChief Strategy Officer, Head of Strategy, Development & Regulatory
2016 - Chief Strategy Officer Head of Strategy, Development & Regulatory
2012 - 15 Vice President Head of Partnerships
2008 - 12 Various Senior positionsHead of Group M&A, Head of Equity Partnerships and Senior Project Manager in Group M&A in DONG Energy
-> 2008 Previously at Arthur Andersen, EY and Bain Capital
Born: 1973Education: MSc. in Economics and Finance (FAU) & CFA
Wind Power
Finance
106
StrategyDevelopment & Regulatory
EPC
Operations
Partnerships & Asset
Management
CountryManagement
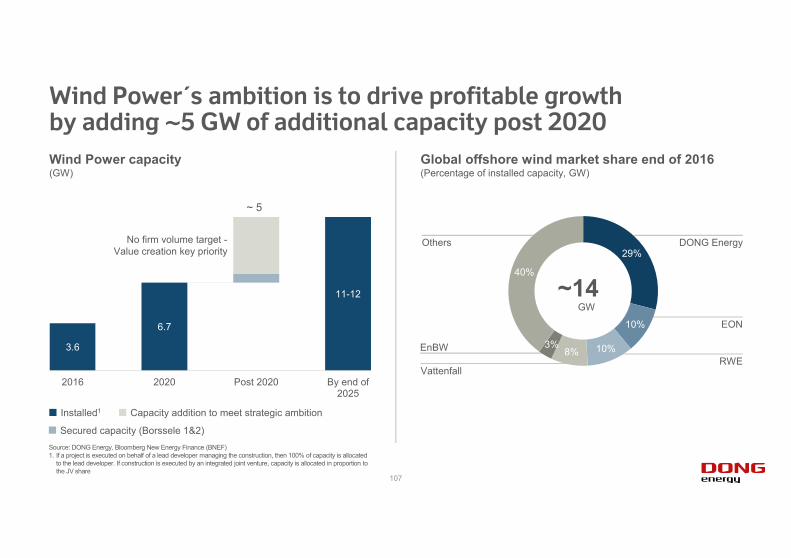
3.6
6.7
11-12
2016 2020 Post 2020 By end of2025
Wind Power´s ambition is to drive profitable growthby adding ~5 GW of additional capacity post 2020
Global offshore wind market share end of 2016(Percentage of installed capacity, GW)
Wind Power capacity(GW)
Source: DONG Energy, Bloomberg New Energy Finance (BNEF)1. If a project is executed on behalf of a lead developer managing the construction, then 100% of capacity is allocated
to the lead developer. If construction is executed by an integrated joint venture, capacity is allocated in proportion to the JV share
~ 5
~14GW
No firm volume target -Value creation key priority
DONG Energy
EON
RWEVattenfall
EnBW
Others29%
10%
10%8%3%
40%
Installed1 Capacity addition to meet strategic ambition
Secured capacity (Borssele 1&2)
107
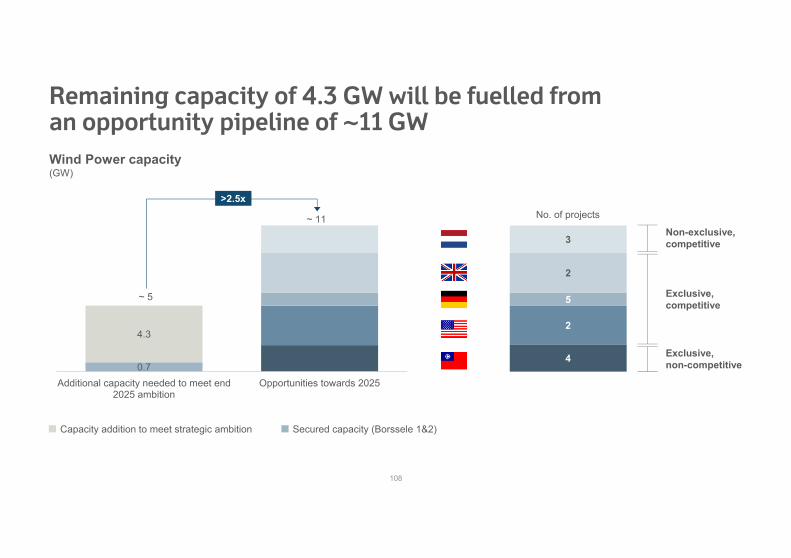
Remaining capacity of 4.3 GW will be fuelled from an opportunity pipeline of ~11 GWWind Power capacity(GW)
Non-exclusive, competitive
Exclusive, competitive
Exclusive, non-competitive
No. of projects
~ 5
Capacity addition to meet strategic ambition Secured capacity (Borssele 1&2)
0.7
4.3
Additional capacity needed to meet end2025 ambition
Opportunities towards 2025
>2.5x
~ 11
3
2
5
2
4
108

Next 18 months will see allocation of more than 8 GW of capacity for the post 2020 periodDONG Energy pipeline options towards 2025
1st German Auction1,550 MW
2nd UK CfDAuction~1,300 MW1
US Massa-chusettsauction
Taiwan EIA2
deadline2nd German Auction1,550 MW
Holland Coast 1 & 2 tender700 MW
Strategic markets>9 GW pipeline options
Opportunistic markets0.7 GW secured2.1 GW3 pipeline options
Source: BNEF; Netherlands Enterprise Agency 1. In 2016 the UK government announced CfD auctions of up to GBP 730m for up to 4 GW of offshore wind to be executed over three auctions by 2020. Exact capacity to be allocated in each round is uncertain. The UK government has committed to up to three auctions in this parliamentary period. However a firm date has only been communicated for the 2017 auction. 2. Environmental Impact Assessment. 3 The Dutch government has proposed in its Energy Agenda to continue offshore wind tendering with 1 GW annually in 2020-2025, hence additional opportunities may arise.
Holland Coast 3 & 4 tender700 MW
3rd UK CfDAuction~1,300 MW1
2017Q1 Q2 Q3 Q4 Q1
2018Q2
Upcoming auctions and tenders>8 GW of opportunities
109
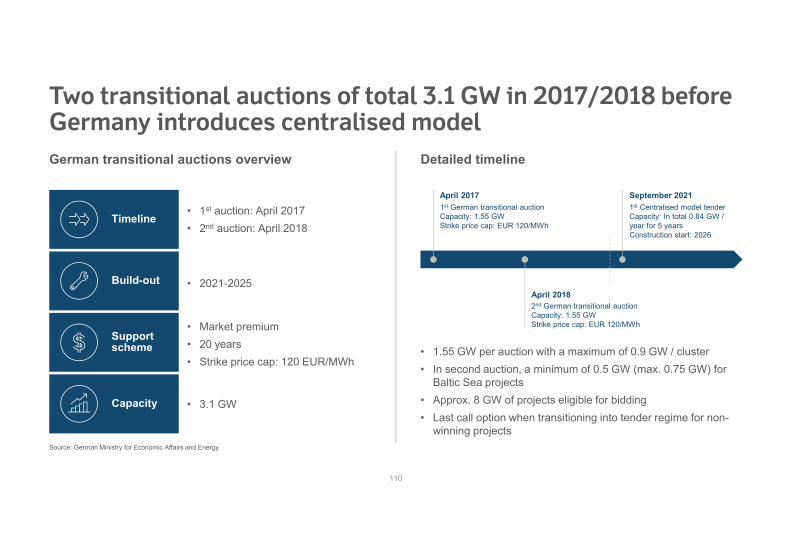
Two transitional auctions of total 3.1 GW in 2017/2018 before Germany introduces centralised model
Detailed timelineGerman transitional auctions overview
Timeline
Build-out
Support scheme
Capacity
• 1st auction: April 2017• 2nd auction: April 2018
• 2021-2025
• Market premium• 20 years• Strike price cap: 120 EUR/MWh
• 3.1 GW
• 1.55 GW per auction with a maximum of 0.9 GW / cluster• In second auction, a minimum of 0.5 GW (max. 0.75 GW) for
Baltic Sea projects• Approx. 8 GW of projects eligible for bidding • Last call option when transitioning into tender regime for non-
winning projectsSource: German Ministry for Economic Affairs and Energy
April 20182nd German transitional auctionCapacity: 1.55 GW Strike price cap: EUR 120/MWh
1st Centralised model tenderCapacity: In total 0.84 GW / year for 5 yearsConstruction start: 2026
September 20211st German transitional auctionCapacity: 1.55 GW Strike price cap: EUR 120/MWh
April 2017
110
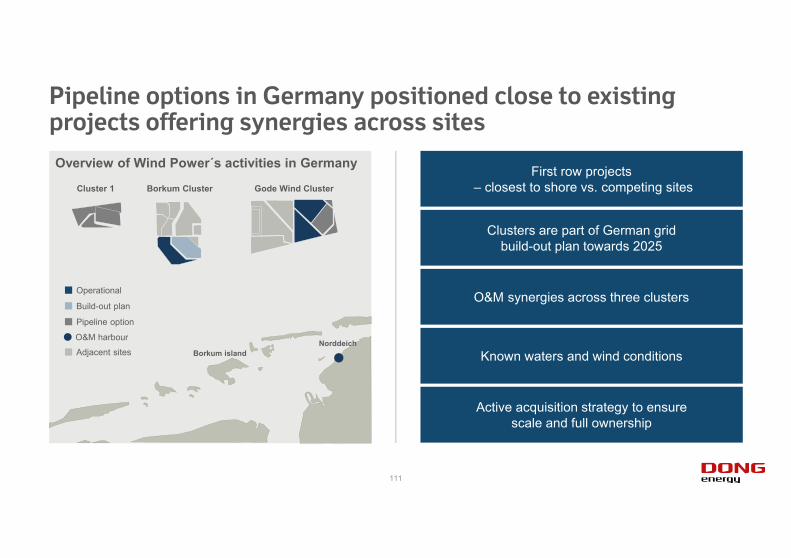
Pipeline options in Germany positioned close to existing projects offering synergies across sites
Overview of Wind Power´s activities in Germany
Cluster 1 Gode Wind ClusterBorkum Cluster
Borkum island
Clusters are part of German grid build-out plan towards 2025
First row projects– closest to shore vs. competing sites
O&M synergies across three clusters
Known waters and wind conditions
Active acquisition strategy to ensure scale and full ownership
Operational
Pipeline option
Build-out plan
Adjacent sites
O&M harbourNorddeich
111
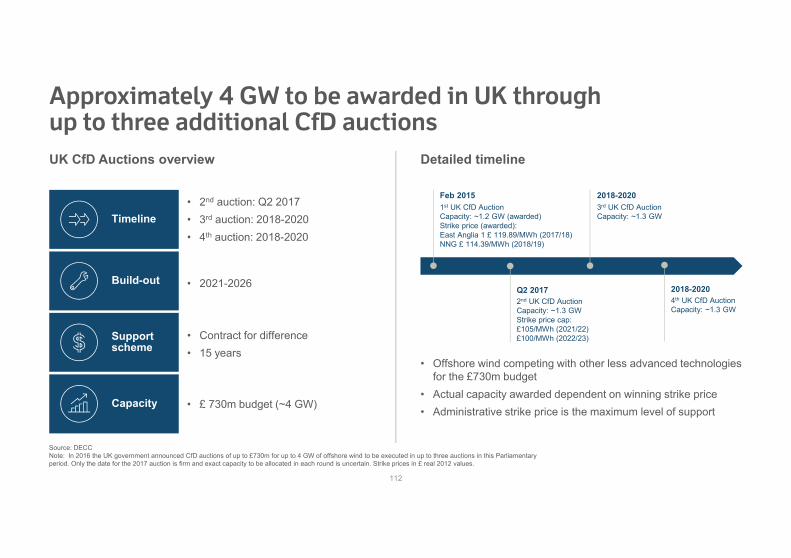
Approximately 4 GW to be awarded in UK through up to three additional CfD auctions
Detailed timelineUK CfD Auctions overview
Timeline
Build-out
Support scheme
Capacity
• 2nd auction: Q2 2017• 3rd auction: 2018-2020• 4th auction: 2018-2020
• 2021-2026
• Contract for difference• 15 years
• £ 730m budget (~4 GW)
• Offshore wind competing with other less advanced technologies for the £730m budget
• Actual capacity awarded dependent on winning strike price• Administrative strike price is the maximum level of support
Q2 20172nd UK CfD AuctionCapacity: ~1.3 GWStrike price cap:£105/MWh (2021/22)£100/MWh (2022/23)
3rd UK CfD AuctionCapacity: ~1.3 GW
2018-20201st UK CfD AuctionCapacity: ~1.2 GW (awarded)Strike price (awarded):East Anglia 1 £ 119.89/MWh (2017/18)NNG £ 114.39/MWh (2018/19)
Feb 2015
2018-20204th UK CfD AuctionCapacity: ~1.3 GW
Source: DECCNote: In 2016 the UK government announced CfD auctions of up to £730m for up to 4 GW of offshore wind to be executed in up to three auctions in this Parliamentary period. Only the date for the 2017 auction is firm and exact capacity to be allocated in each round is uncertain. Strike prices in £ real 2012 values.
112

Detailed overview of the Hornsea area
High quality pipeline for the UK CfD auction rounds
Hornsea 2
Dogger Bank
Race Bank
WestermostRough
EastAnglia
Hornsea 1
Vattenfall &Iberdrola
RWE, SSE, & Statoil
Hornsea
Hornsea
Hornsea
Hornsea
• 1.2 GW
• Under construction
• Up to 1.8 GW
• Development consent awarded in August 2016
• Up to 2.4 GW
• Consent ongoing
• Approx. 1 GW
• Post 2025 potential
• >3 GW of pipeline options towards 2025• Area well known given Hornsea 1 under construction
DONG Energy Wind Power operated or in constructionOther projects
Hornsea 3Hornsea 4
1
2
3
4Triton Knoll
RWE & StatkraftGrimsby
LincsO&M harbour
113
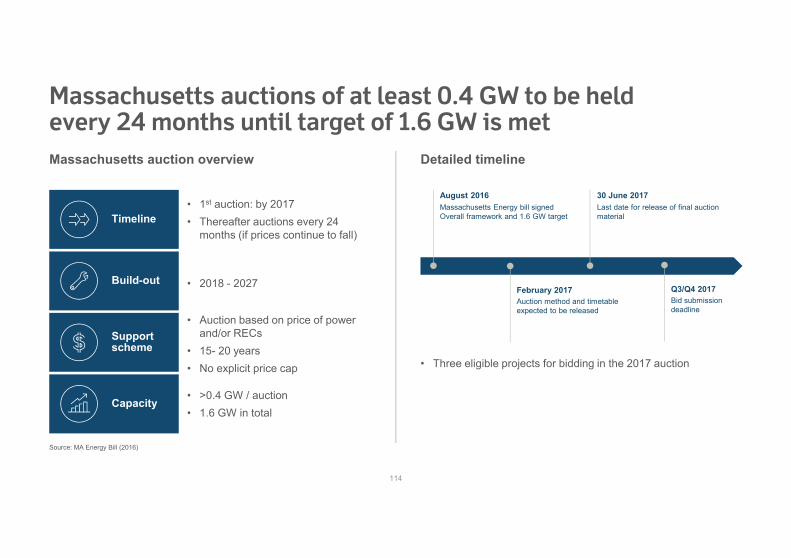
Massachusetts auctions of at least 0.4 GW to be held every 24 months until target of 1.6 GW is met
Detailed timelineMassachusetts auction overview
Timeline
Build-out
Support scheme
Capacity
• 1st auction: by 2017• Thereafter auctions every 24
months (if prices continue to fall)
• 2018 - 2027
• Auction based on price of power and/or RECs
• 15- 20 years• No explicit price cap
• >0.4 GW / auction• 1.6 GW in total
• Three eligible projects for bidding in the 2017 auction
Source: MA Energy Bill (2016)
February 2017Auction method and timetable expected to be released
Last date for release of final auction material
30 June 2017Massachusetts Energy bill signedOverall framework and 1.6 GW target
August 2016
Q3/Q4 2017Bid submission deadline
114
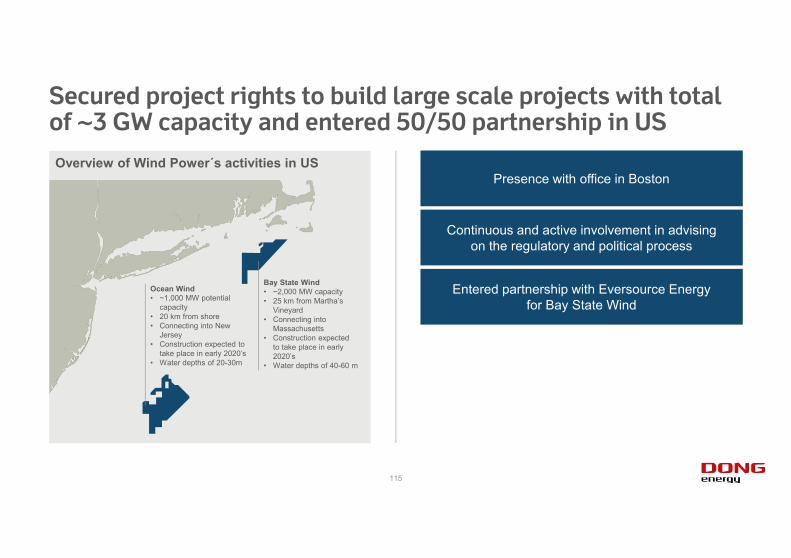
Secured project rights to build large scale projects with total of ~3 GW capacity and entered 50/50 partnership in US
Presence with office in Boston
Continuous and active involvement in advising on the regulatory and political process
Entered partnership with Eversource Energy for Bay State Wind
Bay State Wind• ~2,000 MW capacity • 25 km from Martha’s
Vineyard• Connecting into
Massachusetts• Construction expected
to take place in early 2020’s
• Water depths of 40-60 m
Ocean Wínd• ~1,000 MW potential
capacity • 20 km from shore• Connecting into New
Jersey• Construction expected to
take place in early 2020’s• Water depths of 20-30m
Overview of Wind Power´s activities in US
115
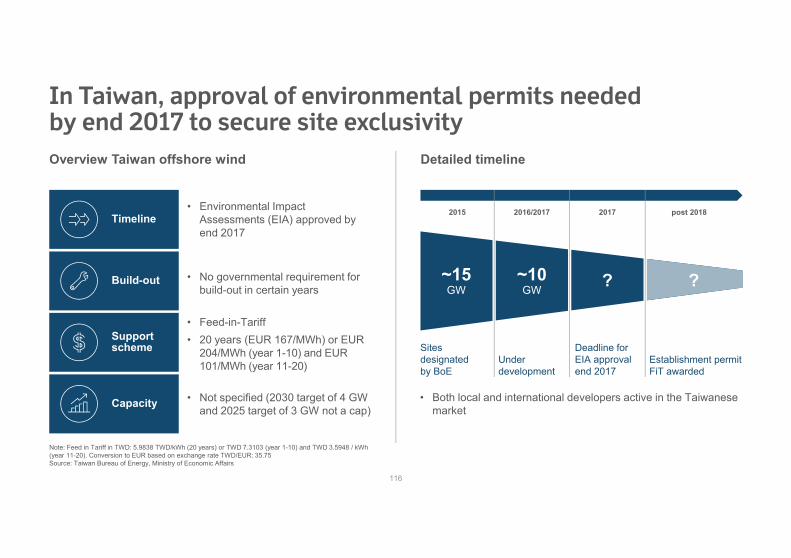
In Taiwan, approval of environmental permits needed by end 2017 to secure site exclusivity
Detailed timelineOverview Taiwan offshore wind
Timeline
Build-out
Support scheme
Capacity
• Environmental Impact Assessments (EIA) approved by end 2017
• No governmental requirement for build-out in certain years
• Feed-in-Tariff• 20 years (EUR 167/MWh) or EUR
204/MWh (year 1-10) and EUR 101/MWh (year 11-20)
• Not specified (2030 target of 4 GW and 2025 target of 3 GW not a cap)
• Both local and international developers active in the Taiwanese market
Note: Feed in Tariff in TWD: 5.9838 TWD/kWh (20 years) or TWD 7.3103 (year 1-10) and TWD 3.5948 / kWh (year 11-20). Conversion to EUR based on exchange rate TWD/EUR: 35.75Source: Taiwan Bureau of Energy, Ministry of Economic Affairs
~15 GW
~10 GW
? ?
Sites designated by BoE
Under development
Deadline for EIA approvalend 2017
Establishment permitFiT awarded
2015 2016/2017 2017 post 2018
116
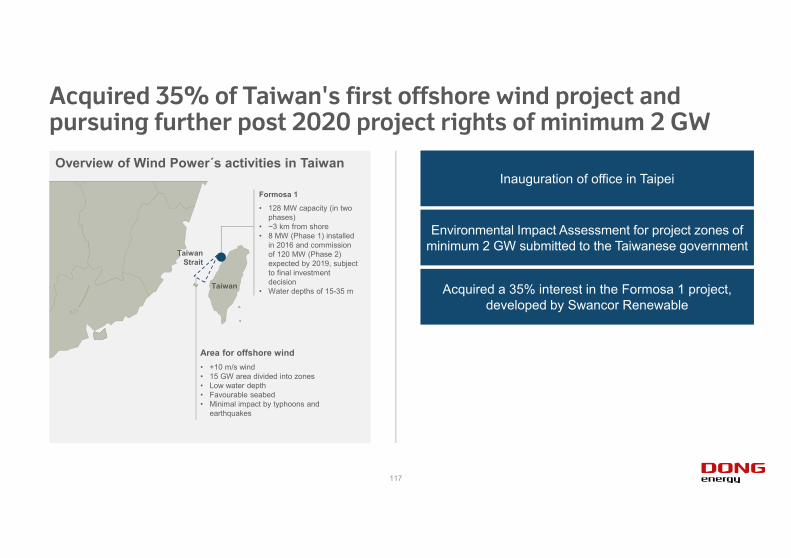
Acquired 35% of Taiwan's first offshore wind project and pursuing further post 2020 project rights of minimum 2 GW
Area for offshore wind• +10 m/s wind• 15 GW area divided into zones• Low water depth• Favourable seabed• Minimal impact by typhoons and
earthquakes
Formosa 1
• 128 MW capacity (in two phases)
• ~3 km from shore• 8 MW (Phase 1) installed
in 2016 and commission of 120 MW (Phase 2) expected by 2019, subject to final investment decision
• Water depths of 15-35 m
Taiwan Strait
Taiwan
Overview of Wind Power´s activities in TaiwanInauguration of office in Taipei
Environmental Impact Assessment for project zones of minimum 2 GW submitted to the Taiwanese government
Acquired a 35% interest in the Formosa 1 project, developed by Swancor Renewable
117
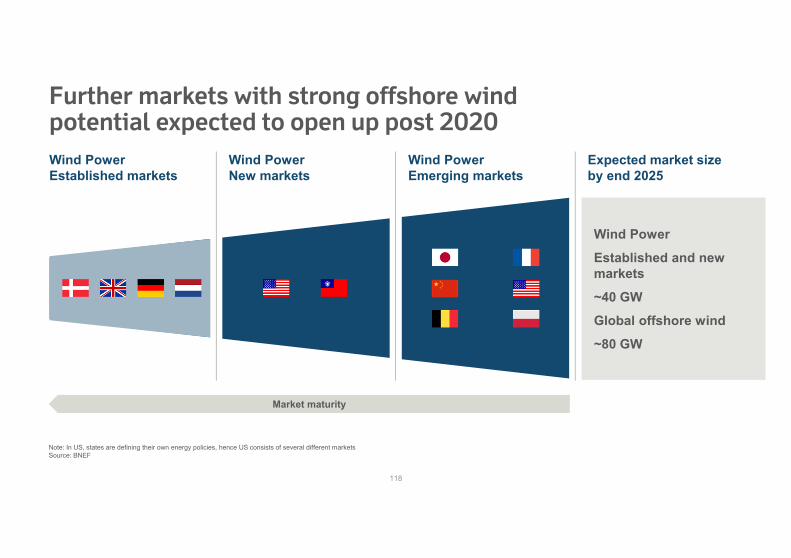
Further markets with strong offshore wind potential expected to open up post 2020
Wind Power
Established and new markets
~40 GW
Global offshore wind
~80 GW
Note: In US, states are defining their own energy policies, hence US consists of several different marketsSource: BNEF
Wind PowerEstablished markets
Wind Power New markets
Wind Power Emerging markets
Expected market size by end 2025
Market maturity
118

Wind Power is the market leader in offshore wind with an ambitious growth strategy post 2020
Ambition of 11-12 GW installed capacity by end 2025
~11 GW opportunity pipeline to secure the further growth
Next 18 months will see allocation of full 2025 capacity
Well positioned in European markets
First mover advantage in US/Taiwan
Potential additional opportunities arising in emerging markets
119
120