wind loading of industrial, mining and petrochemical ... · pdf fileengineers, 2010), have...
TRANSCRIPT

Wind loading of industrial, mining and petrochemical structures–some case studies
*John D. Holmes1)
1) JDH Consulting, Mentone, Victoria, 3194, Australia 1) [email protected]
ABSTRACT
Industrial structures, such as those used for mining activities and petrochemical production, are typically high-value, and are often located in coastal areas of the globe exposed to high winds, such as those produced by tropical cyclones. This paper discusses several cases, in the experience of the author, in which wind loadings of some petrochemical and mining structures were examined in detail, and reviews alternative approaches, such as wind-tunnel tests and the use of codes and standards and specialist design guides
1. INTRODUCTION
Industrial structures, such as those used for mining activities and petrochemical production, are typically high-value, and are often located in coastal areas of the globe exposed to high winds, such as those produced by tropical cyclones, including hurricanes and typhoons. However, shape factors and force coefficients specified in wind codes and standards are usually heavily targeted towards enclosed buildings. Industrial structures typically consist of numerous individual elements including cylindrical vessels, pipes, valves, ladders, conveyors etc., with supporting framework. Thus, mutual shielding and aerodynamic interference effects are important. In many cases, structural designers attempt to use codes and standards which have inadequate provisions for industrial structures, and significantly over-estimate wind loads as a result of the neglect of shielding effects. In other cases where dynamic effects are important, such as flare stacks and chimneys, total wind loading, including the inertial loading produced by resonant response, may be underestimated. This presentation discusses several cases, in the experience of the author, in which wind loadings of some petrochemical and mining structures were examined in detail, and will review alternative approaches, such as wind-tunnel tests, the use of specialist design guides such as that produced by the American Society of Civil Engineers (ASCE Petrochemical Energy Committee, 2011) and more advanced approaches for tall towers and chimneys, such as the ‘equivalent static wind load approach’ (Holmes, 1996).
2. DESIGN STANDARDS AND GUIDES
2.1 Wind loading codes and standards
1) Director
Wind loading codes and standards, such as Australian/New Zealand Standard AS/NZS 1170.2 (Standards Australia, 2011) and ASCE 7 (American Society of Civil Engineers, 2010), have primarily been written for buildings and generally provide aerodynamic shape factors, such as pressure and force coefficients, for prismatic shapes representing generic tall and medium rise buildings. For low-rise buildings pressure coefficients for various roof shapes and pitches are provided. Shape factors for shapes typical of industrial structures may be provided, but these have generally been less well researched, and are often consigned to Appendices or Annexes in these documents.
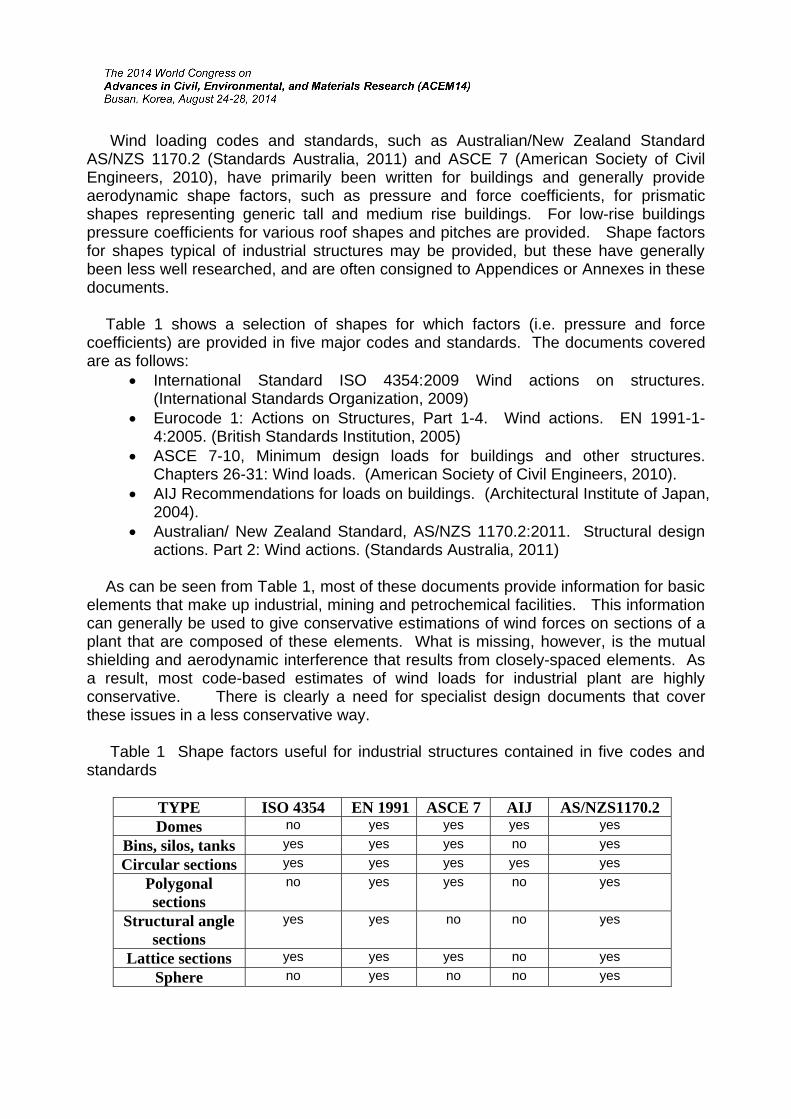
Table 1 shows a selection of shapes for which factors (i.e. pressure and force coefficients) are provided in five major codes and standards. The documents covered are as follows:
International Standard ISO 4354:2009 Wind actions on structures. (International Standards Organization, 2009)
Eurocode 1: Actions on Structures, Part 1-4. Wind actions. EN 1991-1-4:2005. (British Standards Institution, 2005)
ASCE 7-10, Minimum design loads for buildings and other structures. Chapters 26-31: Wind loads. (American Society of Civil Engineers, 2010).
AIJ Recommendations for loads on buildings. (Architectural Institute of Japan, 2004).
Australian/ New Zealand Standard, AS/NZS 1170.2:2011. Structural design actions. Part 2: Wind actions. (Standards Australia, 2011)
As can be seen from Table 1, most of these documents provide information for basic elements that make up industrial, mining and petrochemical facilities. This information can generally be used to give conservative estimations of wind forces on sections of a plant that are composed of these elements. What is missing, however, is the mutual shielding and aerodynamic interference that results from closely-spaced elements. As a result, most code-based estimates of wind loads for industrial plant are highly conservative. There is clearly a need for specialist design documents that cover these issues in a less conservative way.
Table 1 Shape factors useful for industrial structures contained in five codes and standards
TYPE ISO 4354 EN 1991 ASCE 7 AIJ AS/NZS1170.2Domes no yes yes yes yes
Bins, silos, tanks yes yes yes no yes Circular sections yes yes yes yes yes
Polygonalsections
no yes yes no yes
Structural angle sections
yes yes no no yes
Lattice sections yes yes yes no yes Sphere no yes no no yes
2.2 Specialist design guides There are relatively few alternative documents that provide wind loading information, available to structural designers of industrial, mining and petrochemical facilities.
A well-established series of design guides are the wind engineering data items of ESDU International of London U.K. These provide a comprehensive series of data covering all aspects of wind loading – i.e. on wind speeds, turbulence and adjustment for terrain and topography, shape factors for many shapes, and methods of dealing with dynamic response to wind – both along wind and cross wind. Detailed information is provided on pressures and forces on structures with circular cylindrical cross-section (ESDU 80025, 81017), and polygonal and elliptical cross sections (ESDU 79026). Forces on pairs of circular cylinders with various orientations to the wind are covered by ESDU 84015; however this would not be sufficient for a large number of circular sections, such as pipes in a pipe rack, that are common in petrochemical and other chemical facilities.
Force coefficients for sharp-edged structural sections, such as I and L sections, are provided in ESDU 82007. ESDU 81027 provides detailed advice on wind forces on single and multiple planar lattice frames; methods for dealing with additional drag-producing elements such as gusset plates are given, and a pipe bridge structure is used as an example. Tower-like space frames, including those with both flat-sided (angle) and circular members, and the effects of various internal and external ancillaries, are covered by ESDU 81028; although the original inspiration was communication towers, this Item would be useful for flare towers used in the oil and gas industry, and open lattice conveyors used in the mining sector.
At this point it should be noted that the data used in all codes, standards and guides for lattice towers with tubular members of circular cross-section, can all be traced back to a series of tests carried out in the U.K. in the nineteen-seventies (Gould and Raymer, 1972). These tests were unique in that they were carried out in a compressed-air wind tunnel, and thus Reynolds Numbers equivalent to those on full-scale lattice towers could be achieved without the use of roughening of the cylindrical elements. However, there are some questions regarding end effects, and blockage corrections for these test results, and new tests for this type of structure, common in the petrochemical industry should be carried out.
A useful document, that has been produced primarily for petrochemical structures, is the guide: ‘Wind loads for petrochemical and other industrial facilities’ produced by the American Society of Civil Engineers (ASCE Petrochemical Energy Committee, 2011). This is one of five documents produced by the ASCE Petrochemical Energy Committee.
Although directed at American (U.S.) practice with many references to other documents such as ASCE 7, the guide is generally useful to structural designers of petrochemical facilities, and similar industrial structures. It summarizes available information on shape factors for elements such as pipe racks (i.e. arrays of pipes of different diameters), open frame structures, partially clad structures, pressure vessels
and cooling towers. In particular, recent generic research from Louisiana State University (e.g. Amoroso and Levitan, 2009; Amoroso et al., 2009 is summarized.
Appendix 5B of the ASCE guide is particularly useful, as it has provided a single formula for the maximum force coefficient (for most structures this can be taken as a drag coefficient) for ‘high solidity open frame structures’, comprising structural members and equipment and ancillaries such as piping, ladders, handrails, electrical cable trays etc. enclosed within the overall envelope of the framing. This formula is:
, . √
√ (1)
B and L are the plan dimensions corresponding to the across-wind width and along-wind length respectively. is the total solidity, including equipment, presumably determined from an elevation projected in the nominal wind direction.
This formula provides an overall wind force, without providing a distribution of that force within the various elements of the system. The user needs to make a rational distribution of the overall load. It is presumably intended as a quasi-steady force coefficient intended to be used with the 3-second gust duration of ASCE 7, and hence may need modification for other gust durations such as the 0.2 second gust used in AS/NZS 1170.2, or the 10-minute mean wind speed used in Europe (e.g. Eurocode 1) and in several East Asian economies.
The formula is based on mean force coefficients from wind-tunnel tests, and therefore may not take into account correlation effects which would produce reduced loads over complexes with very large horizontal or vertical dimensions. However, Equation (1) could be used as a useful ‘reality check’ on the overall wind loads for complex plants, computed by accumulating contributions from individual elements with no allowance for shielding or aerodynamic interference, and thus giving highly conservative wind loads.
3. WIND-TUNNEL STUDIES
In the following, four examples of petrochemical and mining structures, for which detailed assessments of wind loading were made by the use of wind-tunnel tests, are discussed. For all of these structures, estimates of wind loading were initially made using codes and standards; however these loads resulted in structural design problems and led to requests for the wind-tunnel tests. Two were new structures still in the design stage at the time of the assessments. Two of the structures were existing structures (both about twenty years old at the time of the assessments), but structural checking had raised some doubts about their adequacy into the future. For commercial reasons, the identity and exact location of these structures, or numerical details of the shape factors, or their response to wind cannot be presented. However, useful general information is provided in the following.

3.1 St Figurenatural gkilometrthe locatcritical fathe platf
Fig
The 34m. Thother eqthe deckabove atechniqucritical Rscale coby one t
The simulateaccuratelongitudAssurantop of th
tructure A:e 1 showsgas (LNG)e long, so tion is reguactor in theform from t
g. 1 1/70 s
plan dimehe upper dquipment,ks. An aand belowue making Reynolds Nonditions, tthird from t
model waed atmosphe modelinginal turbu
nce Manuahe upper d
: LNG load a wind-tuon to shipthat it is exularly visitee structurathe ocean
scale wind
ensions of deck of thesuch as a ccurate m
w the deckuse of digNumbers ohe major ethat corres
as mounteheric boung of the mlence spe
al AWES-Qdeck of the
ding platfornnel mode
ps. The plxposed to ed by tropial design offloor.
-tunnel mo
the concre platformcrane, fire
odel of theks was mital drawinon the moelements oponding to
ed on a hdary layer
mean velocectrum, fo
QAM-1 (Ause platform
rmel (1/70 scatform is lothe open ocal cyclonef the platfo
odel of a L
rete decks supports e monitor e platform
made usinggs supplie
odel, in coof circular co the nomin
igh-frequer in a largecity profileollowing thstralasian
m was mou
ale) of a pocated at tocean fromes (typhooorm, partic
NG loading
of the fulseveral shtower, andabove wa
g the sterd by the cl
ontrast to tcross sectinal geome
ncy force wind tunn
, longitudinhe provisiWind Eng
unted at a
platform usthe end of
m all directions), so thaularly for th
g platform
l-scale plahip-loadingd pipeworkater level, eo-lithograient. To a
the super-on were retric scaling
balance anel. The sinal turbuleons of thineering Soheight abo
sed to loada jetty moions. Furtat wind loahe piles su
(Structure
atform are g arms, ask above anand the a
aphy (3-d account forcritical floweduced in g ratio of 1/
and exposmulations
ence intenhe AWESociety, 200ove the su
d liquified re than 1 thermore
ading is a upporting
A)
45m by s well as nd below ncillaries printing)the sub-
w in full-diameter/70.
sed to a includedsity, and Quality 01). The urface to
represent the design condition in which the strong winds from a tropical cyclone are accompanied by a storm surge.
Time histories of the three components of wind forces on the model were recorded and processed to give mean, maximum and minimum values of the full-scale equivalent. The largest resultant maximum horizontal wind force was found to occur for a wind direction approximately along the line of the diagonal, seen when viewing the platform from above. However, the value of this force in full scale, as determined from the wind-tunnel testing, was found to be very much less than that estimated by the client, using a wind loading standard, before the wind-tunnel study was carried out. This result enabled resolution of some design issues associated with resisting the calculated uplift on at the base of several of the supporting piles of the platform.
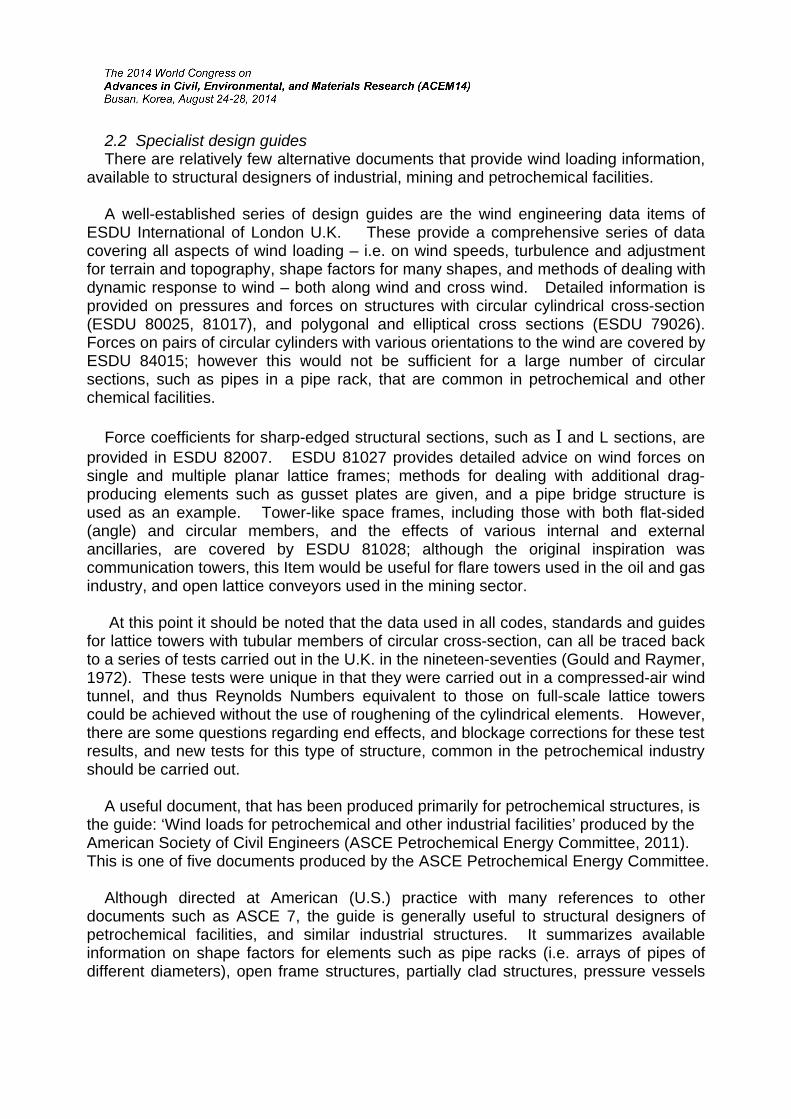
3.2 Structure B: Stockpile cover Wind loads were required for a large existing mineral stockpile cover for a gold mine. This structure is approximately conical in shape – consisting of twenty-four separate faces spaced at 15 degree intervals. The lower edge is approximately 14 metres above ground level when the stockpile is empty. The top of the cover is 32 metres above ground level, and the overall diameter at the widest point is 57 metres. The site is an inland location at which thunderstorms are the dominant extreme wind.
Wind-tunnel tests were carried out at a geometric scaling ratio of 1/100 using a pressure-tapped model (Figure 2), in turbulent boundary-layer winds. The pressure measurements consisted solely of mean pressure coefficients – i.e. fluctuating and peak pressures were not processed. However, external and internal (i.e. on the underside of the cover) pressures were measured and the results presented as net pressure differences. The effects of the radial conveyor (seen in Figure 2), and an upwind embankment for one wind direction, were included.
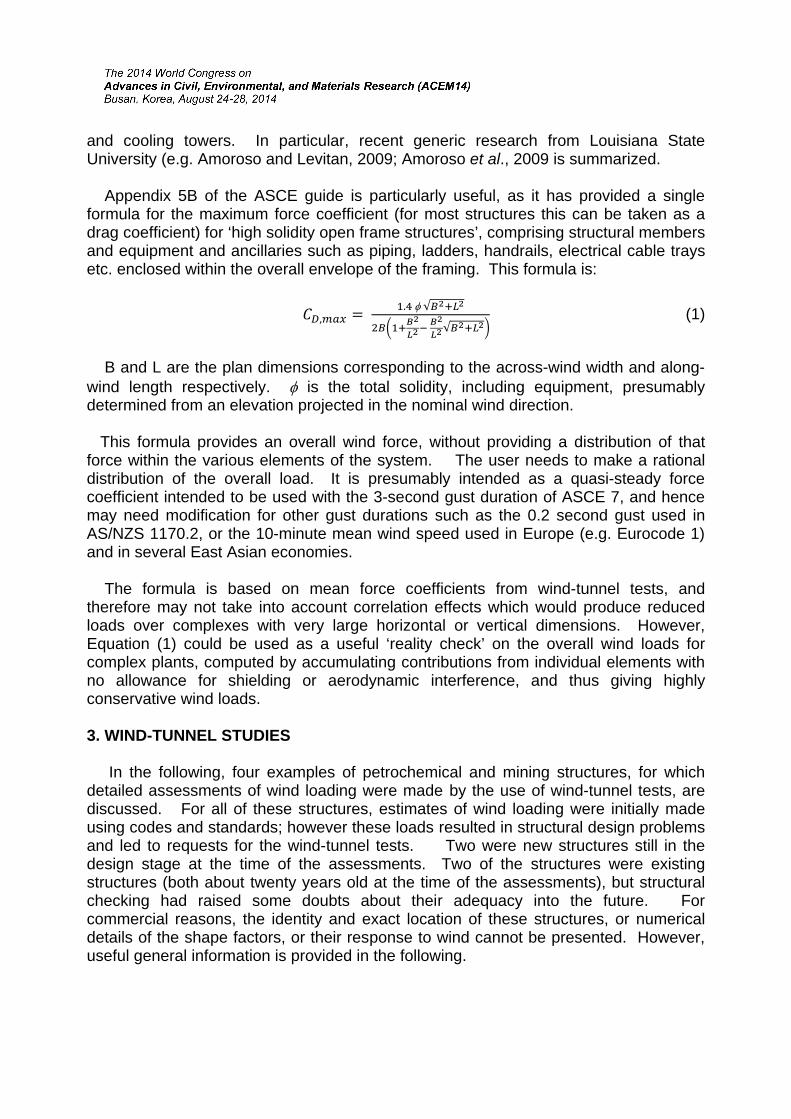
Design loads were calculated using the ‘quasi-steady’ principle (e.g. Holmes, 2007) in which mean pressure coefficients are applied with a gust wind speed, in this case a 0.2-second gust, as used in Australian Standard, AS/NZS 1170.2:2011. Pressure coefficients equivalent to those used in the standard were requested by the client. This approach was adopted even though techniques are available for producing effective static wind load distributions for large roofs, making use of information on fluctuating pressures and their correlations over large areas. However, the validity of these approaches for a site dominated by thunderstorm winds, with uncertain turbulence and correlation properties, may be questionable. The domination of thunderstorm winds is shown in Figure 3 in which the extreme value analyses of gust wind speeds from the nearby airport, separated by storm type, are shown.
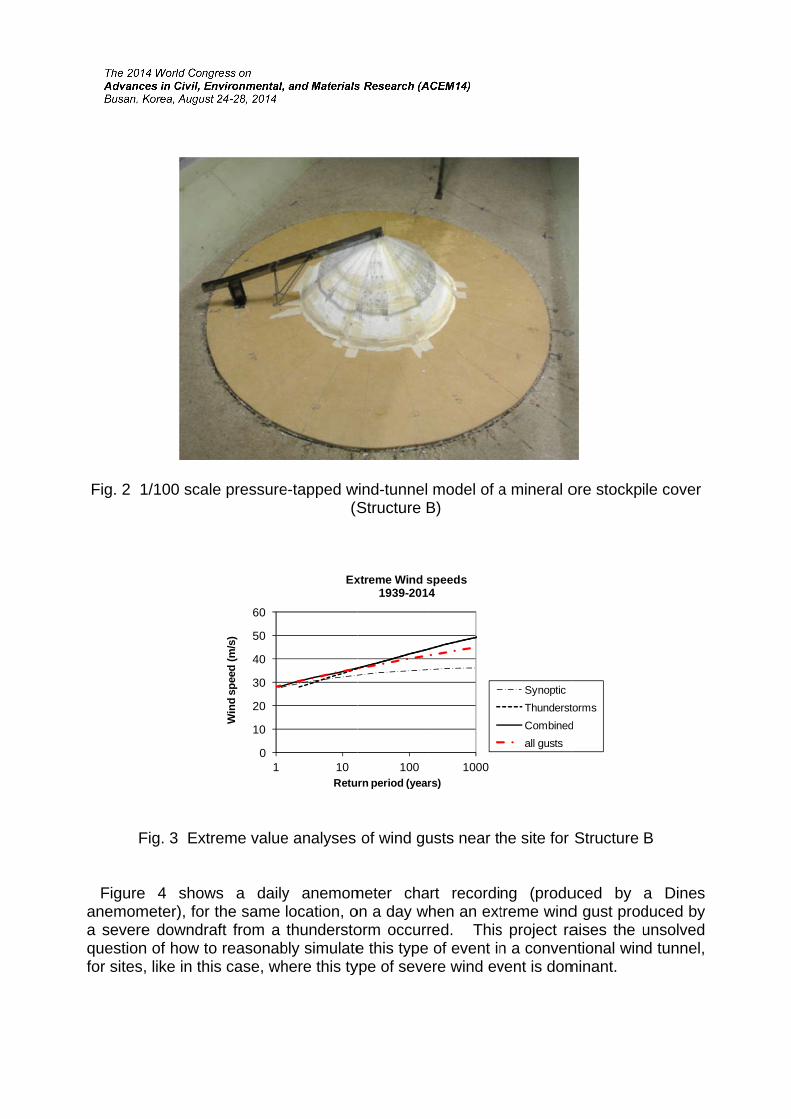
Fig. 2 1
F
Figureanemoma severequestionfor sites
1/100 scale
Fig. 3 Extr
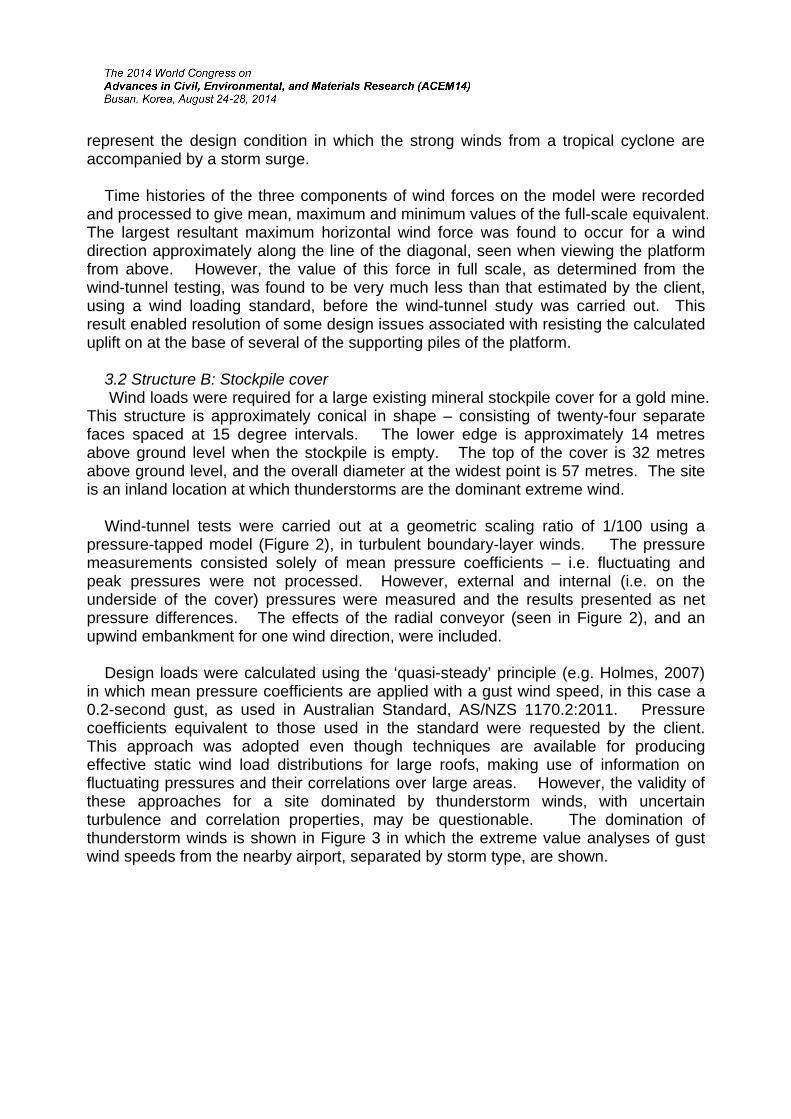
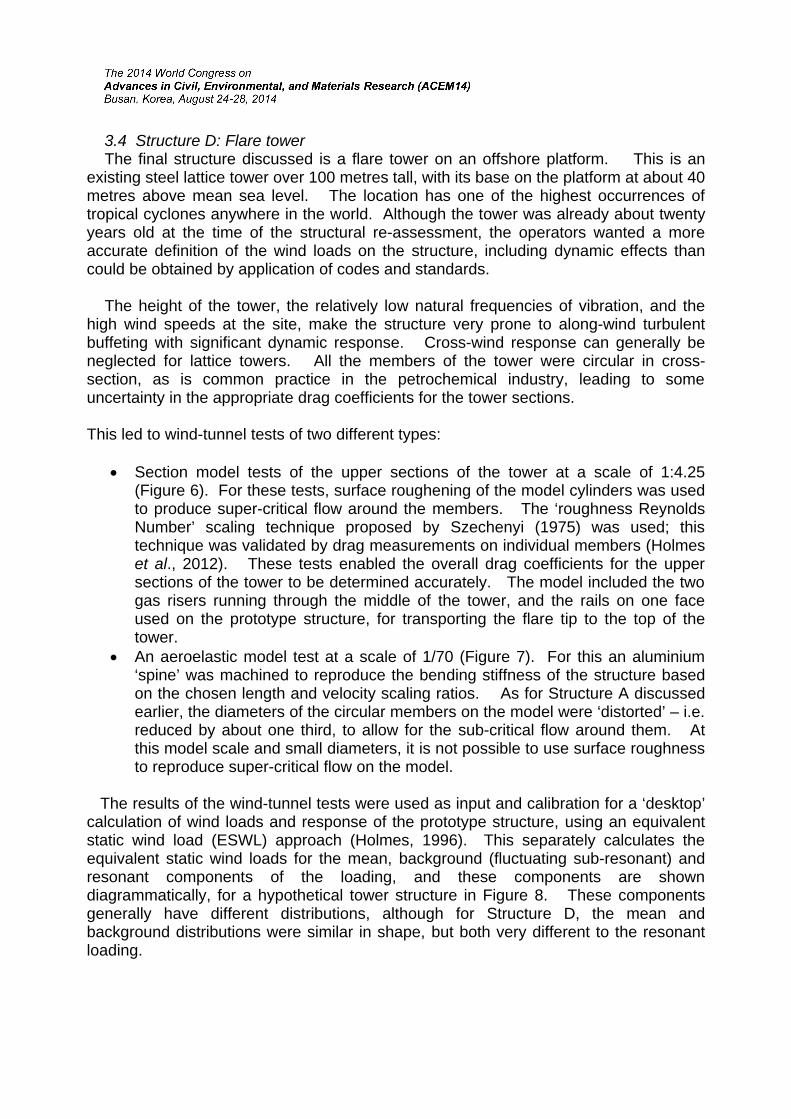
e 4 showmeter), for e downdran of how to, like in this
e pressure
reme value
ws a dailythe same
aft from a o reasonabs case, wh
0
10
20
30
40
50
60
1
Win
d sp
eed
(m/s
)
e-tapped w(S
e analyses
y anemomlocation, othundersto
bly simulatehere this ty
10Retu
Ex
wind-tunnelStructure B
of wind gu
meter chaon a day worm occurre this type
ype of seve
100rn period (year
xtreme Wind s1939-2014
model of aB)
usts near t
rt recordihen an extred. Thisof event in
ere wind ev
1000rs)
speeds4
a mineral o
he site for
ng (produtreme winds project ran a convenvent is dom
SynopticThunderstCombinedall gusts
ore stockpi
Structure
uced by d gust prodaises the untional winminant.
tormsd
ile cover
B
a Dines duced by unsolvedd tunnel,
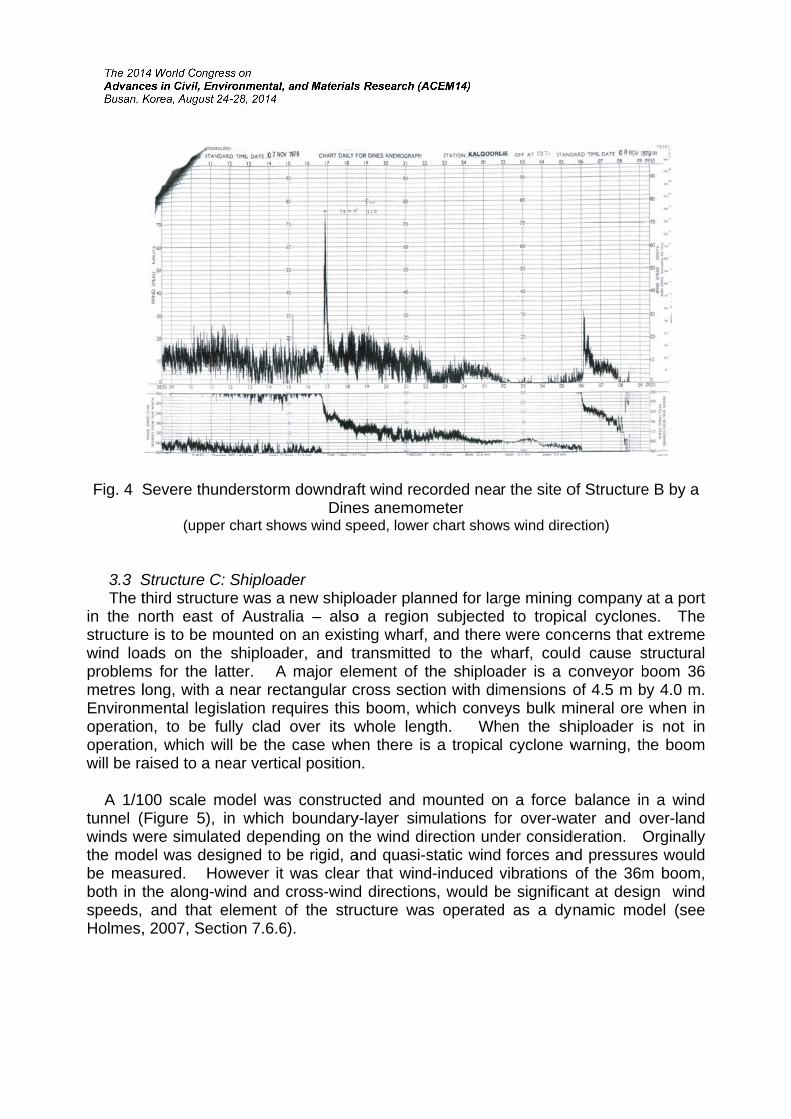
Fig. 4 S
3.3 S The tin the nstructurewind loaproblemmetres lEnvironmoperatiooperatiowill be ra
A 1/1tunnel (winds wthe modbe measboth in tspeeds,Holmes,
Severe thu
(uppe
Structure Cthird structnorth east e is to be mads on the
ms for the long, with mental leg
on, to be on, which waised to a
00 scale mFigure 5),
were simuladel was desured. Hthe along-wand that
, 2007, Sec
understorm
er chart sho
C: Shiploadture was a
of Austramounted oe shiploadlatter. Aa near rec
gislation refully clad will be the near vertic
model was in which
ated depensigned to
However it wind and element o
ction 7.6.6
m downdrafDine
ows wind sp
dernew shiplo
alia – alsoon an existder, and tr
major electangular cquires thisover its wcase whe
cal position
s construcboundary
nding on thbe rigid, awas clear
cross-windof the stru
6).
ft wind reces anemompeed, lower
oader plano a region ting wharf, ransmittedement of tcross sectis boom, whwhole lengen there isn.
cted and my-layer simhe wind dirand quasi-sr that windd directionsucture was
corded neameter
chart show
nned for larsubjectedand there
d to the whe shiploaon with dimhich convegth. Whs a tropica
mounted omulations fo
rection undstatic windd-induced vs, would bs operated
r the site o
ws wind dire
rge miningd to tropic
were concwharf, couldader is a cmensionseys bulk mhen the shl cyclone w
n a force or over-wader consid forces anvibrations
be significad as a dy
of Structure
ection)
g company cal cyclonecerns that d cause sconveyor bof 4.5 m b
mineral ore hiploader iwarning, th
balance inater and o
deration. Ond pressure
of the 36mant at desiynamic mo
e B by a
at a port es. The extreme
structuralboom 36 by 4.0 m.
when in is not in he boom
n a wind over-land Orginally es would m boom, gn wind
odel (see

To iwas chon1 is thethe windmodeledHowevewith thehence waccelera
The and founThis wawere reqcladdingremovabestimatehence mdid not p
Fig. 5 1
nterpret thosen so the first moded. This d correctlyer, a correce frequencwill correcation), prov
cross-windnd to incres unaccepquired. Tg panels neble, and thed that thismake the apermit this
1/100 scale
he wind tue reducede natural fris not a t
y, and defctly scaledcies in thectly reprodvided that a
d vibration ease the bptable bothTo inhibit vear the cohat they bs measurealong-windto be verif
e wind-tunn
nnel forced velocity, requency otrue aeroeflections ad dynamic e wind flowduce forcaeroelastic
of the bobase sheah for the shortex shedrners of thbe removee should red loading cfied by furt
nel model
e measurem(Ub/n1), w
of the boomelastic modand accele
model wilw (includin
ces, includc effects ar
oom, in ther and momhiploader adding nearhe boom, oed during educe the
critical. Unther wind tu
of a shiplo
ments the was the sam, and b idel since erations arl correctly ng vortex ding inertire not sign
e near vertment on thand the whr the top, itover the topa tropical cross-winnfortunatelunnel testin
oader (Stru
wind tunname in mos the sectithe mass re not rep
match theshedding
al forces ificant.
tical positiohe shiploadharf, and rt was recop third of itcyclone w
nd loads by howeverng.
ucture C)
nel velocityodel and fuion width ndistributio
produced ce model frfrequenci(i.e. mas
on, was sder by aboremedial mommendedts height, warning.by about 5r, time and
y scaling ull scale. normal to on is not correctly.requency es), and ss times
ignificant out 30%.
measures d that the be made It was
50%, and d budget
3.4 Structure D: Flare tower The final structure discussed is a flare tower on an offshore platform. This is an existing steel lattice tower over 100 metres tall, with its base on the platform at about 40 metres above mean sea level. The location has one of the highest occurrences of tropical cyclones anywhere in the world. Although the tower was already about twenty years old at the time of the structural re-assessment, the operators wanted a more accurate definition of the wind loads on the structure, including dynamic effects than could be obtained by application of codes and standards.
The height of the tower, the relatively low natural frequencies of vibration, and the high wind speeds at the site, make the structure very prone to along-wind turbulent buffeting with significant dynamic response. Cross-wind response can generally be neglected for lattice towers. All the members of the tower were circular in cross-section, as is common practice in the petrochemical industry, leading to some uncertainty in the appropriate drag coefficients for the tower sections.
This led to wind-tunnel tests of two different types:
Section model tests of the upper sections of the tower at a scale of 1:4.25 (Figure 6). For these tests, surface roughening of the model cylinders was used to produce super-critical flow around the members. The ‘roughness Reynolds Number’ scaling technique proposed by Szechenyi (1975) was used; this technique was validated by drag measurements on individual members (Holmes et al., 2012). These tests enabled the overall drag coefficients for the upper sections of the tower to be determined accurately. The model included the two gas risers running through the middle of the tower, and the rails on one face used on the prototype structure, for transporting the flare tip to the top of the tower.
An aeroelastic model test at a scale of 1/70 (Figure 7). For this an aluminium ‘spine’ was machined to reproduce the bending stiffness of the structure based on the chosen length and velocity scaling ratios. As for Structure A discussed earlier, the diameters of the circular members on the model were ‘distorted’ – i.e. reduced by about one third, to allow for the sub-critical flow around them. At this model scale and small diameters, it is not possible to use surface roughness to reproduce super-critical flow on the model.
The results of the wind-tunnel tests were used as input and calibration for a ‘desktop’ calculation of wind loads and response of the prototype structure, using an equivalent static wind load (ESWL) approach (Holmes, 1996). This separately calculates the equivalent static wind loads for the mean, background (fluctuating sub-resonant) and resonant components of the loading, and these components are shown diagrammatically, for a hypothetical tower structure in Figure 8. These components generally have different distributions, although for Structure D, the mean and background distributions were similar in shape, but both very different to the resonant loading.

Fig. 6 L
Fig. 7 1/7
Large scale
70 scale ae
e section m
eroelastic
model test f
model test
for a flare t
t for a flare
tower (Stru
e tower (Str
ucture D)
ructure D)

Fig. 8 Components of the effective static wind loading for a hypothetical tower(Holmes, 1996)
4. OTHER INDUSTRIAL STRUCTURES
4.1 Stacks, chimneys and pressure vessels Stacks and chimneys of circular cross section are common elements of industrial facilities. The response of these structures to wind loads has long been of concern. In the nineteenth century, brick masonry chimneys regularly failed under wind loads and focused designers on the low tensile strength of brick mortar. In the nineteen-fifties and -sixties the dynamic response of steel chimneys to wind forces was of great interest and focus of research activity. One result of this was the development of a variety of devices to suppress vortex shedding, and hence cross-wind forces on structures with circular sections. The most well known and ubiquitous of these are the triple-start helical strakes developed at the National Physical Laboratory of the United Kingdom. However, strakes increase the drag coefficient greatly and although they effectively suppress the cross-wind response of chimneys, the along-wind response is amplified. This was probably the force component producing the failure of the sugar mill stack shown in Figure 9.
Several methods are available for prediction of the cross-wind response of chimneys and stacks of circular section. However, this is a difficult phenomenon to quantify with many variables affecting it, such as: aspect ratio, chimney taper and upwind turbulence intensity, and the various methods give varying predictions. For example, Verboom and van Koten (2009) applied the two approaches, given in Eurocode 1 (known as ‘Approach 1’ and ‘Approach 2’), for prediction of the cross-wind response to vortex shedding of 13 steel chimneys in Europe, the operational history of which was known in
0
20
40
60
80
100
120
140
160
0.0 0.2 0.4 0.6 0.8 1.0
Effective pressure (kPa)
Hei
ght
(m)
CombinedResonant
Background
Mean

some dunderesoverestiestimatechimney
Probavibrationstructurathe Scrugroup.
4.2 O Opecommodaxes of lattice toappears
detail. Vstimated’ thmated theed the streys as being
Fi
ably, a betns by eitheal means suton Numb
Open-latticn-lattice
dities suchthese stru
owers cans to be for
Verboomhe stressee fatigue lifesses, andg ‘unsafe’.
g. 9 A faile
tter designer aerodynsuch as inber), instal
ce conveyoframe str
h as iron ouctures aren be used rce coeffic
and van s caused fe for five d hence w
ed steel st
n approachnamic meacreasing mlling guy c
orsructures,
ore and coe usually nfor the e
cients for t
Koten coby cross-wof the 13
would hav
tack equipp
h is to preans (such mass per ucables, or
enclosingoal, from stnear horiznclosing sthe belt co
oncludedwind vibrat3 chimneysve unjustly
ped with he
vent the oas the in
unit height structurally
belt cotockpiles t
zontal, but structure. onveyor, a
that Apprtions, and s. Approay rejected
elical strak
occurrencestallation oand/or da
y linking s
onveyorso ships, abasic dragWhat is m
and shieldi
roach 1 ‘shence wo
ach 2 mossix out o
kes
e of vortexof helical
amping (anseveral sta
for moviare commog coefficiemissing ating or inte
seriously uld have
stly over-f the 13
x-inducedstrakes),
nd hence acks in a
ng bulk on. The ents from t present erference

factors resulting from the enclosed lattice structure. It is likely that cross-wind forces as well as drag are significant for the belt conveyor.
Some generic wind-tunnel studies of wind forces on belt conveyors, with and without enclosed lattice structures, are therefore needed.
5. CONCLUSIONS
This paper has reviewed wind loading of industrial structure, with particular emphasis on those used in the mining and petrochemical industries. Generally these structures have received far less attention from wind engineers in comparison with other structures, such as buildings, bridges, communication structures and transmission line systems.
The main aspects from four example structures, for which wind-tunnel tests were undertaken, are described. Other sources available to designers are also described. The need for further research on structures such as belt conveyors and on the mutual shielding between various elements of a complex industrial plant have been emphasized. There is also a need for new wind-tunnel tests at high Reynolds Numbers (actual or simulated using roughness), for sections of lattice towers and frameworks made from circular members.
ACKNOWLEDGEMENTS
The author acknowledges the input of many colleagues with whom he has collaborated on the example structures described in this paper, in particular: Cam Leitch and John Ginger (James Cook University), David Burton (Monash University), Seifu Bekele (Global Wind Technology Services), and Harry Fricke (JDH Consulting).
REFERENCES
American Society of Civil Engineers (2010) Minimum design loads for buildings and other structures. ASCE/SEI 7-10, A.S.C.E., New York.
Amoroso, S. and Levitan, M.L. (2009) “Recent research for wind loads on petrochemical structures”, AASCE/SEI Structures Congress, Austin, Texas, April.
Amoroso, S., Hebert, K. and Levitan, M.L. (2009) “Wind tunnel tests for mean loads on partially clad structures”. Journal of Wind Engineering and Industrial Aerodynamics, 98, 689-700.
Architectural Institute of Japan (2004) AIJ recommendations for loads on buildings. AIJ, Tokyo.

ASCE Petrochemical Energy Committee (2011), Wind loads for petrochemical and other industrial facilities, Task committee on wind-induced forces, American Society of Civil Engineers, Reston, Virginia, U.S.A.
Australasian Wind Engineering Society (2001), Wind engineering studies of buildings, Quality Assurance Manual, AWES-QAM-1-2001.
British Standards Institution (2005) Eurocode 1: Actions on structures - Part 1-4: General actions - Wind actions. BS EN 1991-1-4.6, B.S.I., London, U.K.
ESDU International (1979) Mean fluid forces and moments on cylindrical structures: polygonal sections with rounded corners including elliptical shapes. ESDU Data Item 79026, London, U.K.
ESDU International (1980) Mean forces, pressures and flow field velocities for circular cylindrical structures: single cylinder with two-dimensional flow. ESDU Data Item 80025, London, U.K.
ESDU International (1981) Mean forces, pressures and flow field velocities for circular cylindrical structures: finite length cylinders in uniform and shear flow. ESDU Data Item 81017, London, U.K.
ESDU International (1981) Lattice structures. Part 1: mean fluid forces on single and multiple plane frames. ESDU Data Item 81027, London, U.K.
ESDU International (1981) Lattice structures. Part 2: mean fluid forces on tower-like space frames. ESDU Data Item 81028, London, U.K.
ESDU International (1982) Structural members: mean fluid forces on members of various cross sections. ESDU Data Item 82007, London, U.K.
ESDU International (1984) Cylinder groups: mean forces on pairs of long cylinders. ESDU Data Item 84015, London, U.K.
Gould, R.W.F. and Raymer, W.G. (1972) Measurements over a wide range of Reynolds Numbers of the wind forces on models of lattice frameworks with tubular members. National Physical Laboratory (U.K.), Division of Maritime Science, Report No. 5-72, May.
Holmes, J.D. (1996), “Along-wind response of lattice towers. III. Effective load distributions”, Engineering Structures, 18, 489-494.
Holmes, J.D. (2007), Wind loading of structures, 2nd Edition, Taylor and Francis, London, U.K.

Holmes, J.D., Burton, D. and Fricke, H. (2012) “Drag coefficients for roughened circular cylinders in super-critical flow”, 15th Australasian Wind Engineering Workshop, Sydney, 23-24 February.
Standards Australia and Standards New Zealand (2011) Structural design actions. Part 2: Wind actions. Standards Australia, Sydney, and Standards New Zealand, Wellington. Australian/New Zealand Standard AS/NZS1170.2:2011.
Szechenyi, E. (1975) “Supercritical Reynolds number simulation for two-dimensional flow over circular cylinders”, Journal of Fluid Mechanics, 70, 529-542.
Verboom, V.K. and van Koten, H. (2009) “Vortex excitation: Three design rules tested on 13 industrial chimneys”. Journal of Wind Engineering and Industrial Aerodynamics, 98, 145-154.