wind-hydrogen community on the isle of · pdf filewind-hydrogen community on the isle of lewis...
TRANSCRIPT

Gordon Robertson
Wind-Hydrogen Community on the Isle of Lewis Page 1
Department of Mechanical Engineering
Wind-Hydrogen Community on
the Isle of Lewis
Author: Gordon Robertson
Supervisor: Dr Nick Kelly
A thesis submitted in partial fulfilment for the requirement of degree in
Master of Science in Energy Systems and the Environment
2009

Gordon Robertson
Wind-Hydrogen Community on the Isle of Lewis Page 2
Copyright Declaration
This thesis is the result of the author’s original research. It has been composed by the author and has
not been previously submitted for examination which has led to the award of a degree.
The copyright of this thesis belongs to the author under the terms of the United Kingdom Copyright
Acts as qualified by University of Strathclyde Regulation 3.50. Due acknowledgement must always
be made of the use of any material contained in, or derived from, this thesis.
Signed: Gordon Robertson Date: 18/09/2009

Gordon Robertson
Wind-Hydrogen Community on the Isle of Lewis Page 3
1. Abstract
An increasing number of islands around the world are turning to renewable power systems to
generate the electricity they require so that they are less dependent on energy imports from
the mainland. This helps to ensure more reliable electricity supply to the local community as
well as reducing the higher costs associated with energy imports. This project investigates the
potential of a wind-hydrogen system on the Scottish Outer Hebridean island of the Isle of
Lewis.
The proposed area of Lewis where this wind-hydrogen system would be placed experiences
frequent cuts in electricity since the community is at the end of the line of a weak electrical
grid. If the installation of renewable energy systems such as wind farms are to be solely relied
upon for energy, an energy storage medium (in this case, hydrogen) is required to solve the
problems of intermittent energy supply from the wind farm.
This project uses wind data collected from a meteorological site on the West coast of Lewis
to determine the energy output from a theoretical 2.73MW wind farm. Electrical demand data
is generated for an average household in the community to determine the size of hydrogen
system required to meet the primary project aim of supplying electricity to the community all
year round.
Microsoft Excel has been used to simulate the wind-hydrogen system and to determine the
number of households the 2.73MW wind farm could supply with their annual electricity
requirements. In addition to this, the hydrogen fuel cells used in the system will act as mini-
CHP units supplying the households with both power and heat through the use of a heat
exchanger integrated into the fuel cell’s cooling circuit and household’s hot water system.
The efficiencies of the fuel cells and hydrogen producing electrolysers are obtained through
practical experimentation with a 600W fuel cell to determine the units’ performances under
transient loading conditions.

Gordon Robertson
Wind-Hydrogen Community on the Isle of Lewis Page 4
2. Acknowledgements:
I would like to begin by saying thank-you to Dr Nick Kelly who was my project supervisor
and provided me with the topic of research and gave me guidance throughout the duration of
the project. Dr Kelly also set-up the initial contacts with Greenspace Research on the Isle of
Lewis (Stornoway).
I would also like to acknowledge the help I was given during my stay in Stornoway by the
team at Greenspace Research and the Lews Castle College staff, in particular, Dr Alasdair
Macleod, Dr Neil Finlayson and Ms Sally Bell. Dr Macleod assisted me with some of the
experiments carried out in the Lews Castle College hydrogen laboratory and Ms Sally Bell
was responsible for my accommodation arrangements during my stay and a point of contact if
any help was needed.
Acknowledgement also goes to the Western Isles council who, along with Greenspace
Research, fronted half of the money for my accommodation and travel expenses to island.
Rhuari MacIver from the council gave his valuable input to my project when discussing the
best location for the wind farm to be used in the project.
Finally, I am grateful to Donald Mackenzie from Scottish & Southern Energy for his efforts
in trying to obtain energy demand data for the chosen community in the project and Brian and
Kath Griffiths, for the data they kindly supplied me with on annual heating demands for a
typical household on the island.

Gordon Robertson
Wind-Hydrogen Community on the Isle of Lewis Page 5
Table of Contents
1. Abstract.............................................................................................. 3
2. Acknowledgements............................................................................ 4
3. Introductory Section
3.1. Introduction.......................................................................................9
3.2. Aims and Objectives...........................................................................10
4. Project Background
4.1. Literature Review...............................................................................13
4.1.1. Utsira Project.............................................................................13
4.1.2. PURE Project............................................................................14
4.1.3. Lolland Project...........................................................................16
4.1.4. HARI Project (UK)......................................................................17
4.2. Wind-Hydrogen Components.................................................................20
4.2.1. Wind Turbines.............................................................................20
4.2.2. Fuel Cells...................................................................................28
4.2.3. Electrolysers...............................................................................34
4.2.4. Hydrogen Properties.....................................................................36
4.2.5. Hydrogen Storage........................................................................39
4.3. Heat Pumps.......................................................................................41
5. Project Description
5.1. Introduction to the Isle of Lewis.........................................................43
5.2. Galson Estate Wind Data.................................................................47
5.3. Heat and Power Demand.................................................................51
5.3.1. Electrical Power Profile.......................................................51
Gordon Robertson
Wind-Hydrogen Community on the Isle of Lewis Page 6
5.3.2. Heating & DHW Profiles.....................................................52
5.4. UHI/Greenspace Research Hydrogen Systems......................................55
5.4.1. Introduction.....................................................................55
5.4.2. Hydrogen System Details....................................................55
6. Experimental Results & Analysis
6.1. Introduction......................................................................................63
6.2. Technical Findings and Analysis............................................................63
6.2.1. Wind Farm...............................................................................65
6.2.2. Experimental Results from Fuel Cell...............................................67
6.2.3. Gas Compressor Model...............................................................71
6.2.4. Electrical Power System Energy Balance.........................................72
6.2.5. Thermal Energy Recovery for DHW and Heating...............................78
6.3. Economic Analysis of Component Cost....................................................84
7. Conclusions and Recommendations.................................................86

Gordon Robertson
Wind-Hydrogen Community on the Isle of Lewis Page 7
List of Tables & Figures:
1) Figure 1: Illustration of a Hydrogen Energy Balance..........................................................11
2) Figure 2: Simple Representation of a Wind-Hydrogen System...........................................12
3) Figure 3: Utsira Wind-Hydrogen Project.............................................................................13
4) Figure 4: PURE Project (Unst Shetland Islands).................................................................15
5) Figure 5: Lolland Demonstration.........................................................................................16
6) Figure 6: HARI Diaphragm Compressor and Buffer Tank..................................................18
7) Figure 7: E44 Enercon Wind Turbine..................................................................................20
8) Figure 8: Wind turbine components....................................................................................21
9) Figure 9: Induction Machine Slip Conditions......................................................................23
10) Figure 10: Stream Tube for 2-D Rotor Disc......................................................................24
11) Figure 11: Power and Cp curves for Enercon E44 Turbine...............................................27
12) Table 1: Fuel Cell Properties.............................................................................................28
13) Figure 12: Proton Exchange Membrane Fuel Cell.............................................................29
14) Figure 13: Alkaline Electrolyser Components...................................................................35
15) Figure 14: Range of Flammability.....................................................................................37
16) Figure 15: Liquid Hydrogen Storage Tank........................................................................40
17) Figure 16: Ground Source Heat Pump...............................................................................42
18) Figure 17: Proposed Wind Farms on Lewis......................................................................45
19) Figure 18: Galson Estate Weibull Distribution..................................................................47
20) Figure 19: Monthly Energy Output from Wind Farm.......................................................49
21) Figure 20: Daily Power Profile (1 house)..........................................................................52

Gordon Robertson
Wind-Hydrogen Community on the Isle of Lewis Page 8
22) Figure 21: Monthly Heating Energy Demand....................................................................53
23) Figure 22: Daily Demand for DHW..................................................................................54
24) Figure 23: LCC Hydrogen Safety Control System............................................................56
25) Figure 24: Electrolyser Containment Unit.........................................................................57
26) Figure 25: Hydrogen Storage Tank....................................................................................58
27) Figure 26: Hydrogen Laboratory Pressure Regulators......................................................59
28) Figure 27: HP600 Fuel Cell System..................................................................................61
29) Figure 28: Electronic Load on Fuel Cell............................................................................62
30) Figure 29: Community Area for Wind-Hydrogen Project.................................................64
31) Figure 30: Enercon E44 Power Curve...............................................................................65
32) Table 2: Wind Farm Results..............................................................................................66
33) Table 3: Experimental Fuel Cell Results...........................................................................67
34) Figure 31: Fuel Cell Voltage Power Curves......................................................................69
35) Figure 32: Corrected Fuel Cell Efficiency Curve..............................................................69
36) Table 4: Electrical System Results.....................................................................................74
37) Figure 33: Hydrogen Storage Level...................................................................................76
38) Figure 34: DHW Outlet Temperature................................................................................81
39) Table 5: Heat Recovery Results........................................................................................82
40) Figure 35: Heat Recovery Performance............................................................................83
41) Table 6: System Component Costs...................................................................................84

Gordon Robertson
Wind-Hydrogen Community on the Isle of Lewis Page 9
3.1 Introduction:
There is an increasing demand for the development of renewable energy schemes in Europe
and the United Kingdom (UK) to help cut CO2 emissions and meet renewables targets set-out
by the European Union (EU) for 2020. The Western Isles of Scotland have an abundance of
renewable energy resource which could be used to meet the renewable energy targets both the
UK Government and Scottish Executive have set for the future.
At the end of 2008, 5.5% (21,597 GWh) of the electricity generated in the UK was from
renewable energy sources [1]. The UK government in April 2009 officially agreed to
conform to the EU wide 2020 target for 20% of all Europe’s energy to come from renewable
sources [2]. The UK’s contribution to the EU target will be for 15% of all energy generated
from renewables. This is notably less than the contributions coming from other EU countries
such as Sweden and Germany. To achieve this, it is proposed that 30% of the electricity
produced, 12% of heating energy and 10% from transport will be produced from renewable
sources [3].
The main problem with relying on renewable energy schemes such as wind farms for our
energy is that their output is completely dependent on the available wind or energy resource.
As such, their energy output at a certain time in the future cannot be accurately predicted
which requires conventional fossil-fuel burning power stations to be available on stand-by.
The UK National Grid has sufficient reserve capacity to cope with the intermittency of supply
from the current renewables capacity connected to the grid. However, relying on renewables
for 30% of the electricity as is proposed for 2020 will need additional power stations to act as
a reserve [4].
Another problem the UK faces in integrating renewable power generation into the National
Grid arises from the need to build renewable power ‘stations’ in remote areas of the country.
Northern Scotland offers some of the best renewable energy resource in Europe, however,
there is insufficient (and in some cases non-existent) electrical infrastructure located in these
remote areas to distribute the energy they generate to the demand centres in the South of the
country. Further to this, transmitting large levels of electricity over long distances from these
remote areas of the country would result in greater power losses [5].

Gordon Robertson
Wind-Hydrogen Community on the Isle of Lewis Page 10
3.2 Aims and Objectives:
In this study, a relatively small scale 2.73MW wind farm located on the West coast of the Isle
of Lewis will be looked at to determine what size of community the farm could theoretically
supply with the domestic energy requirements (heating and electricity) all year round.
Success for smaller scale systems like this can be used as demonstrations for larger potential
projects on the mainland which would lead to greater financial investment in the
technologies. Increased financial investment in renewable technologies will undoubtedly
progress their performance and efficiency whilst driving down the costs as the market for
them grows. Stand-alone wind-hydrogen schemes on islands are of particular use as it
removes the islanders dependence on the main grid connection which can be of poorer quality
as well as the higher costs associated with fuel for heating since it must be imported from the
mainland.
For this report, the problems faced with intermittent supply from wind farms are to be solved
with the use of an energy buffering system. When the wind farm is producing more energy
than there is demand, the energy can be stored in the form of hydrogen. This is achieved
through the electrolysis of water splitting it into hydrogen and oxygen and then storing the
hydrogen under compression. When the energy output from the wind farm falls below that of
the demand from the community, the hydrogen is consumed by a fuel cell producing
electricity and heat as a by-product. A simple illustration of this process is shown below in
Figure 1 where the blue shaded area represents the energy stored as hydrogen and the yellow
shaded area represents the energy produced by the fuel cell from the hydrogen storage;

Gordon Robertson
Wind-Hydrogen Community on the Isle of Lewis Page 11
Figure 1 – Illustration of Hydrogen Energy Balance
To meet the objective of supplying the community with energy for space heating and
domestic hot water, households were assumed to use a combination of heat recovery from the
fuel cells as well as electricity from the wind farm in storage heaters and heat pumps to
maximise the efficiency.
Wind data from the collected from the meteorological station at the proposed site for the
wind farm on the Galson Estate (West coast of Lewis) was used to determine the annual
energy output from the wind farm. In addition to this, Scottish and Southern Energy supplied
the energy demands for the West coast of Lewis allowing for a more accurate energy balance
of the wind-hydrogen system.
The electrical and thermal efficiencies of the fuel cell and electrolyser components in the
wind-hydrogen system were generated from experimental results carried out in a hydrogen
lab with Greenspace Research (Lews Castle College) on the Isle of Lewis. Microsoft Excel
was then used to simulate the system using the data collected from the experiments, Galson
Estate and Scottish & Southern Energy.
A simple representation of a hydrogen buffering system can be seen in Figure 2 below;

Gordon Robertson
Wind-Hydrogen Community on the Isle of Lewis Page 12
Figure 2 - Simple Representation of a Wind-Hydrogen System
Gordon Robertson
Wind-Hydrogen Community on the Isle of Lewis Page 13
4. Project Background:
4.1 Literature Review:
As has already been discussed, this project aims to investigate the technical feasibility of
introducing a wind hydrogen scheme to the Isle of Lewis. The advantage of first looking at a
relatively small wind farm on the island is that the system can be easily scaled-up to the
incorporate a larger number of households on Lewis.
There are several wind-hydrogen projects in existence (particularly on islands) that are of a
smaller scale than is proposed in this project. Four of such projects have been studied in this
literature review and a brief summary of each is presented in the following section, each
designed to serve slightly different purposes.
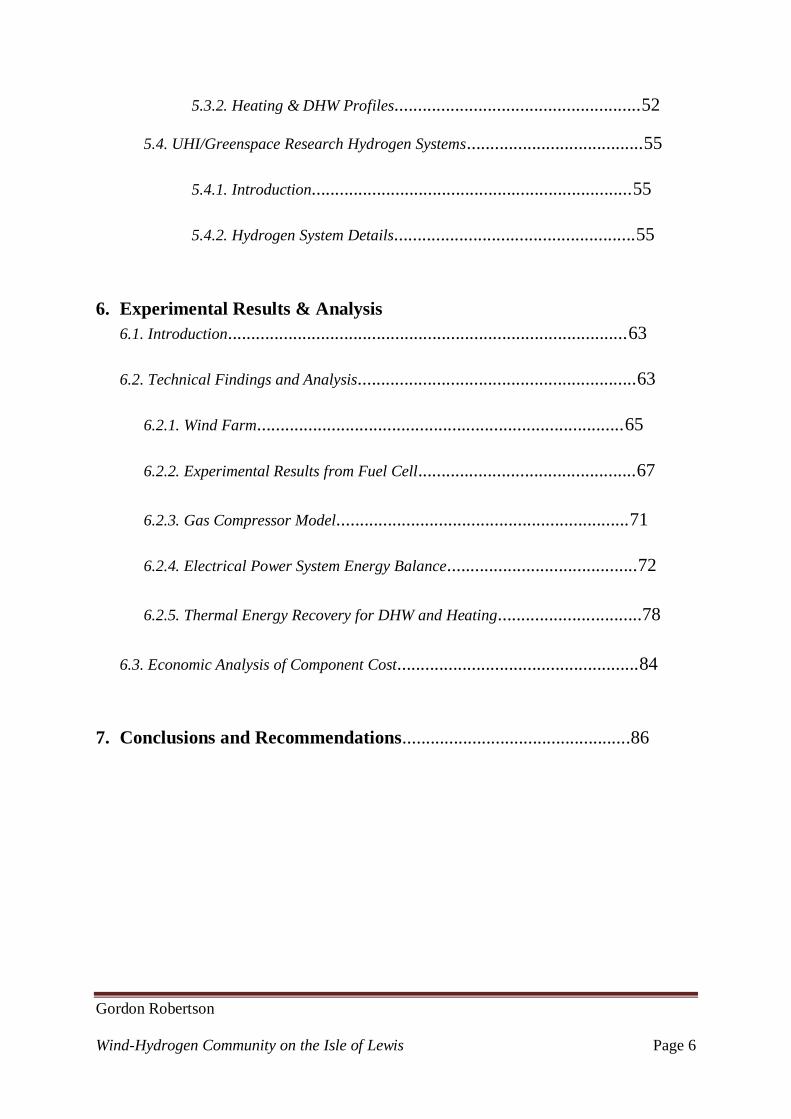
4.1.1. Utsira Project:
Utsira is a small island of around 6km2
in area located off the West coast of Norway. A
company called Norsk-Hydro installed a wind-hydrogen scheme on the island to meet some
of the energy demands of the local community which consists of approximately 235
inhabitants [6]. The peak power demand from the island peaked around 900kW in 2006 with
an average energy consumption over the year of 3.5GWh.
Figure 3 - Utsira Wind-Hydrogen System [7]

Gordon Robertson
Wind-Hydrogen Community on the Isle of Lewis Page 14
The wind-hydrogen project built by Hydro is the world’s first full scale system of its kind
supplying all of the energy needs of 10 households on the island as well as delivering energy
to the rest of the island when there is sufficient wind resource. The project was completed
and operational by the summer of 2004. The project consists of two 600kW wind turbines
built by the German manufacturer, Enercon. These turbines deliver energy to the local island
grid as well as a hydrogen station located at the base of the turbines when there is excess
wind energy available.
The hybrid hydrogen station uses two forms of energy storage. The first is in the form of
hydrogen gas using a 48kW electrolyser capable of producing 10Nm3/h of hydrogen gas, and
the second is a mechanical flywheel capable of storing 5kW in its rotating mass which is used
as a buffer to supply a stable power supply to the grid from the variable output wind source.
Within the hydrogen station, there is also a 10kW fuel cell from a small Danish company
IRD and a 55kW hydrogen internal combustion engine (HICE) which supply the energy
needs to the 10 households when there is insufficient energy produced from the turbines. The
hydrogen storage tank has a capacity of 2400Nm3 which should have an energy content of
approximately 7200kWh.
The future goal for the project is to make the island fully grid independent using local
renewable energy resource and possible export excess energy produced back to the mainland.
4.1.2. PURE Project:
The PURE (Promoting Unst Renewable Energy) project is the world’s first community
owned renewable hydrogen scheme. Unst is the most northerly island in the UK located in
the Shetlands. The island has a population of 500 and a larger area of land when compared to
Utsira of 60miles2.
The project was designed and by PURE, The Unst Partnership Ltd (local Government),
siGEN (Fuel cell manufacturers) and the Robert Gordon Engineering faculty in Aberdeen on
a budget of £350,000 [8].

Gordon Robertson
Wind-Hydrogen Community on the Isle of Lewis Page 15
Figure 4 - PURE Project (Unst-Shetland Islands) [8]
The project uses two commercial prototype 15kW wind turbines as the primary energy source
for the scheme as wind turbines were the most economically viable. They found that there
was a lack in the wind turbine market for commercially available wind turbines in the rated
power region of 6-300kW. Additionally, it was found that smaller scale community sized
turbines lacked active yaw and pitch control which aid in operating efficiency of the turbines.
As such, the PURE project team were involved in the development of the 15kW turbines
eventually used.
Despite the system using wind turbines as the primary energy source, it was designed so that
it could use any other energy source which would cater for future expansion of the scheme.
The main aims of the system were to supply heat to five businesses on the island as well as
hydrogen for a fuel cell vehicle and a back-up fuel cell.
Excess wind energy is used to supply a high pressure electrolyser capable of producing
3.55Nm3/h of hydrogen which is then stored in pressurised gas cylinders ready to be used
either at the filling station for the hybrid vehicle or in the back-up fuel cell. The back-up fuel
cell supplied by siGEN is rated at 5kW and is used to deliver electricity to the 5 businesses
when there is insufficient wind.

Gordon Robertson
Wind-Hydrogen Community on the Isle of Lewis Page 16
The unregulated AC output from the wind turbines is fed through AC-DC rectifiers before
being used in storage heaters in the heating load. The PURE project designers thought the
best use of the wind turbines energy would be to supply heat rather than power. This has the
advantage of naturally matching energy supply with demand as there is a correlation between
high wind speeds and the thermal energy lost from buildings as a result. Therefore the energy
captured by the turbines during the high wind speeds is used to replace the energy lost from
the buildings.
4.1.3. Lolland Project:
Lolland is an island in Denmark where a demonstration project for a hydrogen community is
being developed. The project has been split into 3 phases. At present, phase 1 is complete and
work on phase 2 is under way. The island has an abundance of wind resource from off-shore
wind turbines, however, the majority of the energy is generated at night times when the
instantaneous demand for it is at its lowest. As such, the need for an energy storage system is
required if the island is to be self sufficient on renewable energy.
Phase 1 began in 2007 making use if the excess energy from the turbines to generate
hydrogen through the electrolysis of water [9]. 10 households were fitted with fuel cells from
IRD which were used as combined heat and power (CHP) systems in a micro-generation
scheme. Hydrogen is piped to these CHP systems from a centralised electrolyser, compressor
and hydrogen storage station. A diagrammatic representation of the system can be seen below
in Figure 5.
Figure 5 - Lolland Demonstration [10]
Gordon Robertson
Wind-Hydrogen Community on the Isle of Lewis Page 17
The project uses two 4kW electrolysers from the Canadian company, Hydrogenics which
produces hydrogen gas to be stored under compression (6 bar) in a 50Nm3 capacity tank.
Each house is to be fitted with a 2kW Proton Exchange Membrane (PEM) fuel cell which
supplies it with the heat and power needs.
Future plans for the project are to expand to supply 35 households on Lolland and 100
households nationally in phase 2.
4.1.4. HARI Project (UK):
The HARI (Hydrogen And Renewables Integration) project (2001-present) is based in West
Beacon Farm (Leicestershire, UK) where hydrogen is being used in combination with
renewable power generation to balance the energy supply and demand. There are small scale
wind turbines, photovoltaic panels and micro-hydroelectric energy generators on site
supplying the domestic and business buildings [11].
The project focussed on introducing a hydrogen energy system to the existing renewable
power systems in place on the farm. These systems included; two 25kW wind turbines, 13kW
photovoltaic installation, two micro-hydroelectric generators with a combined rating of 3kW.
In addition to the renewables, a 10kW ground source heat pump is used for domestic heating
purposes and an LPG (Liquid Petroleum Gas) fuelled CHP unit producing 15kW of electrical
power and 38kW of thermal energy. Other sustainable technologies that are in place which
make use of passive solar heating and collection of rainwater for domestic uses (as well as the
electrolyser in the HARI project) due to the lack of a mains water supply.
The HARI project introduced a hydrogen energy storage (HES) system to the farm which
replaced 120kWh capacity of lead acid batteries which had been used to balance energy
supply and demand in combination with the electrical grid. The HES system used a 36kW
alkaline electrolyser from Stuart Energy Europe company which produced hydrogen gas at a
pressure of 25 bar. The claimed maximum efficiency for this electrolyser is 3.9kWh/Nm3.
This roughly equates to a stack efficiency of 75% which is higher than most electrolysers
achieve in practice.

Gordon Robertson
Wind-Hydrogen Community on the Isle of Lewis Page 18
The hydrogen produced by the electrolyser is stored as a compressed gas as in the other
projects looked at previously in this thesis (compressed gas storage is the cheapest solution,
particularly as stationary storage doesn’t have the same design constraints for space)
however, more expensive but compact hydride storage is to be looked at in the future. The
project uses 48 steel gas cylinders each with a volume of 0.475m3 compressed to 137 bar
giving an actual storage volume of 2856Nm3. This gives the farm an energy storage capacity
of 3.8MWh running through the fuel cells which is enough to run the farm for 3 weeks with
no other energy input. A diaphragm type gas compressor is used to raise the electrolyser exit
gas pressure up to 137 bar for storage in the cylinders. A small buffer tank is used with the
compressor to ensure a steady gas supply rate to the compressor which can be seen in the
figure below (Figure 6). In addition to the hydrogen storage, the project makes use of a
20kWh battery for short term energy storage when the there is surplus energy from the
renewable energy systems that the electrolyser can’t absorb.
Figure 6 - HARI Diaphragm Compressor and Buffer Tank [11]

Gordon Robertson
Wind-Hydrogen Community on the Isle of Lewis Page 19
West Beacon Farm has two PEM fuel cells installed used to supply both heat and power to
the project. The smaller of the two fuel cells is a 2kW CHP unit which produces 2kWelec and
2kWthermal at peak loading. The heat from the fuel cell is recovered from the cooling circuit
and passed through a heat exchanger linked into the building’s central heating system. The
larger of the two fuel cells is set up to produce power only at present for the farm. It is a 5kW
unit developed by siGEN and there are plans to convert this unit into a CHP device as well.
These four demonstration projects have all been developed over the past 9 years and each
have been used for slightly different purposes. It is proposed that the techniques learnt from
these projects are used in the hypothetical wind-hydrogen project on the Isle of Lewis and
scaled-up to meet the higher energy demands. In the following section, details of the
components used in wind-hydrogen projects will be outlined for the reader.

Gordon Robertson
Wind-Hydrogen Community on the Isle of Lewis Page 20
4.2 Wind-Hydrogen Components:
4.2.1. Wind Turbines:
The most common type of wind turbine used for large scale power generation is the three
bladed horizontal axis wind turbine (HAWT). Before the wind was used to produce
electricity, windmills have been used for mechanical work such as grinding grain and
pumping water for centuries. The first windmill built for the production of electricity was in
Scotland in July 1887 by Professor James Blyth of what is now known as Strathclyde
University [12]. The windmill was used to provide power for the lighting in his house. Later,
in the 1890s, Danish scientist, Poul La Cour developed wind turbines which were used to
produce hydrogen from water.
With the increasing demand for electricity at the beginning of the twentieth century and the
strain on fuel resources caused by the war, windmills were converted to generate electricity
rather than be used for more traditional purposes. However, serious development of wind
turbines for electrical power output didn’t begin until the oil crisis in 1973 where energy
producers sought alternative means of producing energy without relying on finite resources of
fossil fuel [13].
Figure 7 - E44 Enercon Wind Turbine

Gordon Robertson
Wind-Hydrogen Community on the Isle of Lewis Page 21
The image shown above in Figure 7 is of an Enercon E44 wind turbine with a rated power of
910kW and a peak power coefficient of approximately 0.5. The turbine uses a direct drive,
synchronous generator to produce electricity. This is the turbine that is proposed for the small
wind farm in this project on the Galson estate (Isle of Lewis).
The Enercon E44 turbine operates between wind speeds of 3m/s and 25m/s (with a storm
control system that allows brief gusts up to much higher wind speeds without damaging the
turbine or generator). The turbine power output increases with the wind speed up to its rated
design wind speed of 15m/s where the onboard control systems pitch the individual blades
accordingly so as not to overload the generator.
Wind turbines are always kept facing directly into the wind when they are in operation so as
to capture as much energy as possible. This is achieved on larger turbines such the ones being
used in this project via yaw control system connected to electric motors inside the turbine. A
wind vane sits on top of the nacelle sending information about the wind direction to the yaw
control system so that the blades are always kept facing into the wind. On smaller and lighter
systems, a vertical stabiliser is often used that to naturally keep the blades pointing into the
wind. A simple diagram of the components found inside a wind turbine is shown below in
Figure 8;
Figure 8 - Wind turbine components

Gordon Robertson
Wind-Hydrogen Community on the Isle of Lewis Page 22
It is worth noting that not all wind turbines have the same components as shown in the
diagram above. This depends for instance on whether the generator is a direct drive system,
(large diameter generators with many poles which therefore require a low speed input
negating the requirement of a gearbox) or as shown above, driven through a gearbox which is
needed to increase the low rotational speed of the wind turbine (typically between 20 and 50
rpm) up to 1000 to 3000 rpm.
The pitching control mechanism seen on the blades of the wind turbine is used to maximise
the wind turbine efficiency as the wind speeds pick up to rated. At rated speed the blades are
pitched to keep the rotational speed of the blades constant as mentioned above. The pitching
mechanism is also used to bring the turbine to a stop when the wind speeds get to high or for
shutdown during maintenance intervals. In addition to this aerodynamic braking system, the
turbine shaft also has a large hydraulic disc brake which could be used in emergency
shutdown procedures and to hold the blades stationary when the wind turbine is inoperative.
Having pitched controlled blades (as opposed to fixed speed turbines) on larger wind turbines
(~1MW plus) also reduces mechanical stresses on the turbine as they can absorb sudden gusts
of wind in the mechanical inertia of the turbine which reduces the torque pulsations.
Removing some of the torque pulsations also allows the generator to deliver better power
quality as fluctuations such as ‘flicker’ are reduced
Wind Turbine Generator Types:
Most large wind turbines of the size being used in this project and above use doubly-fed
induction type generators, however, an increasing number of direct drive synchronous
generators are being introduced in the large wind turbine market. German wind turbine
developers typically favour the latter type of generators as is used in the Enercon E44 wind
turbine which has a direct –drive multi-pole synchronous generator.
Induction generators are widely used as they are generally cheaper than synchronous
machines, they are durable and if there is a fault in the grid network then the turbines will
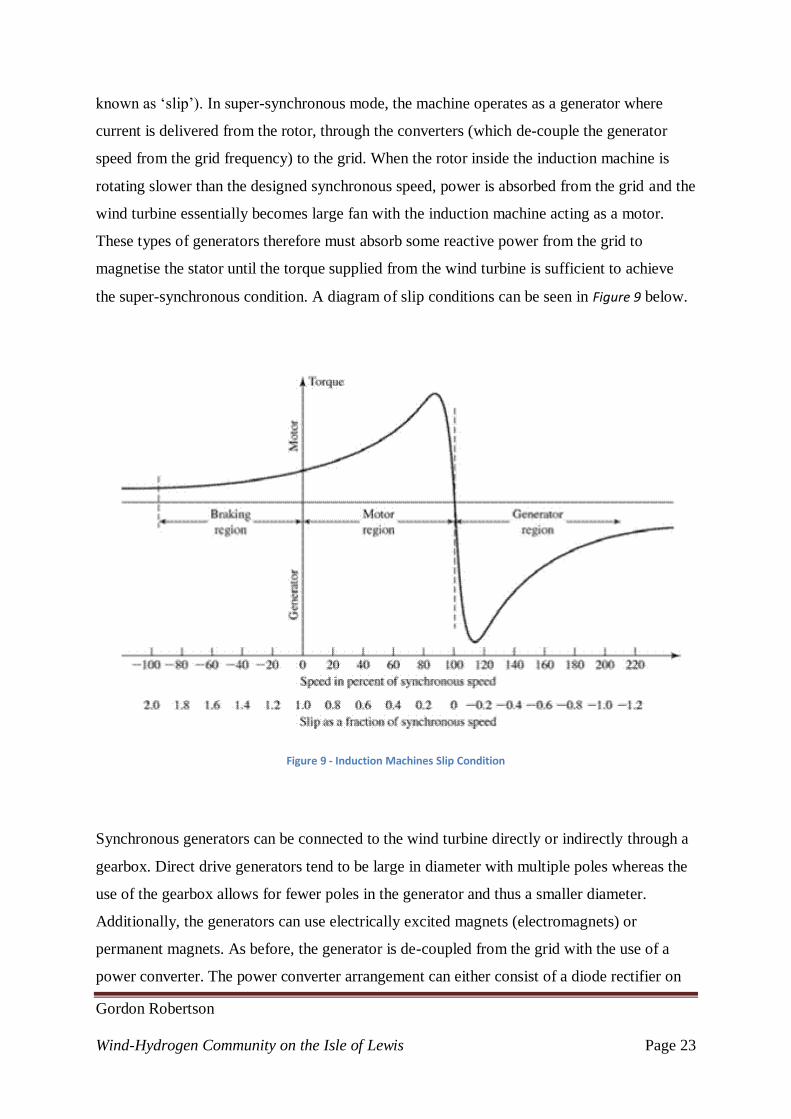
shut-down. Induction machines can operate in sub or super-synchronous conditions. These
conditions refer to the rotor speed relative to the synchronous speed of the machine (this is
Gordon Robertson
Wind-Hydrogen Community on the Isle of Lewis Page 23
known as ‘slip’). In super-synchronous mode, the machine operates as a generator where
current is delivered from the rotor, through the converters (which de-couple the generator
speed from the grid frequency) to the grid. When the rotor inside the induction machine is
rotating slower than the designed synchronous speed, power is absorbed from the grid and the
wind turbine essentially becomes large fan with the induction machine acting as a motor.
These types of generators therefore must absorb some reactive power from the grid to
magnetise the stator until the torque supplied from the wind turbine is sufficient to achieve
the super-synchronous condition. A diagram of slip conditions can be seen in Figure 9 below.
Figure 9 - Induction Machines Slip Condition
Synchronous generators can be connected to the wind turbine directly or indirectly through a
gearbox. Direct drive generators tend to be large in diameter with multiple poles whereas the
use of the gearbox allows for fewer poles in the generator and thus a smaller diameter.
Additionally, the generators can use electrically excited magnets (electromagnets) or
permanent magnets. As before, the generator is de-coupled from the grid with the use of a
power converter. The power converter arrangement can either consist of a diode rectifier on
Gordon Robertson
Wind-Hydrogen Community on the Isle of Lewis Page 24
the generator side to convert the AC output to DC before a pulse width modulated voltage
source converter (PWM VSC) converts the DC to the AC grid frequency, or use two PWM
VCS on both sides of the converter.
Maximum Power Coefficient:
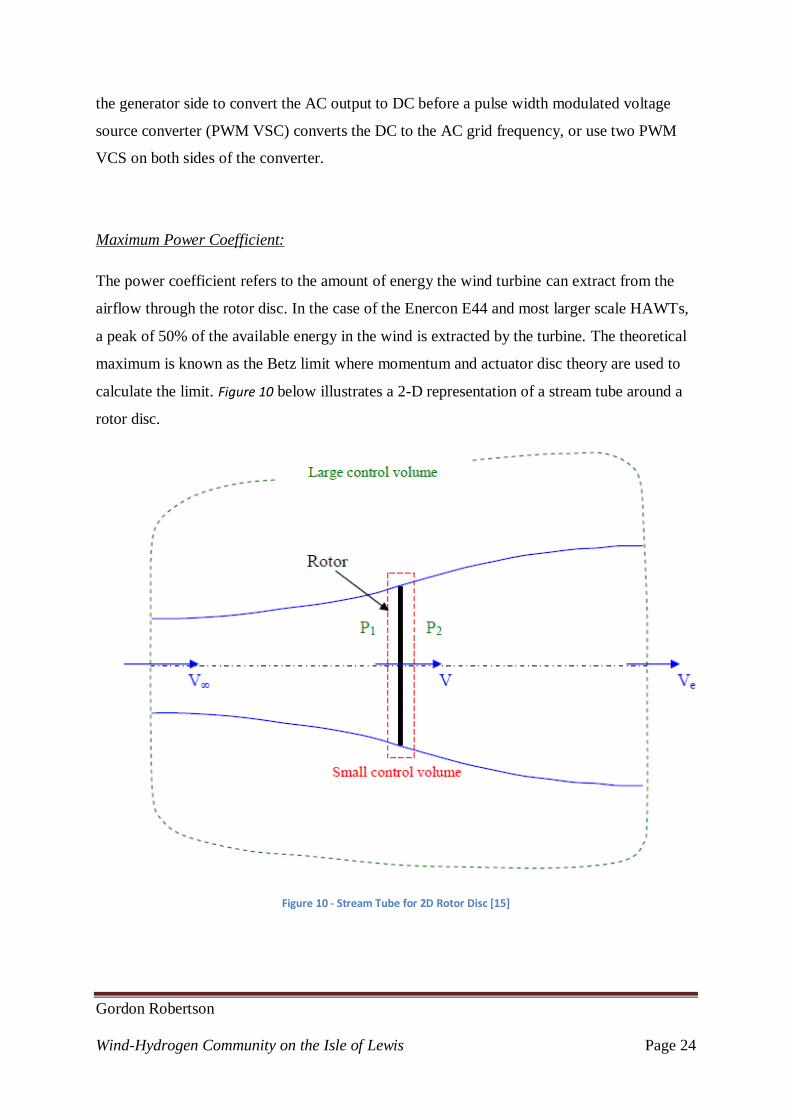
The power coefficient refers to the amount of energy the wind turbine can extract from the
airflow through the rotor disc. In the case of the Enercon E44 and most larger scale HAWTs,
a peak of 50% of the available energy in the wind is extracted by the turbine. The theoretical
maximum is known as the Betz limit where momentum and actuator disc theory are used to
calculate the limit. Figure 10 below illustrates a 2-D representation of a stream tube around a
rotor disc.
Figure 10 - Stream Tube for 2D Rotor Disc [15]

Gordon Robertson
Wind-Hydrogen Community on the Isle of Lewis Page 25
As can be seen in the figure above, the stream tube far upstream from the rotor is of a smaller
diameter than the rotor itself. The presence of the rotor in the tube causes the incoming air to
slow down as it approaches it resulting in the expansion of the stream tube. Since no work
has been done on or by the air at this point, the static pressure rises above atmospheric
pressure to account for the decrease in kinetic energy in the flow [14]. When the air crosses
the rotor, the wake pressure drops below atmospheric levels found outside of the stream tube
before eventually returning to atmospheric pressure further downstream of the rotor. The
return to this equilibrium pressure is again at the expense of kinetic energy in the wind thus
reducing the flow speed further. The difference in the kinetic energy of the flow upstream of
the stream tube and far downstream is the energy absorbed by the wind turbine.
The Betz limit can be calculated from the following equations. The mass flow rate of the
wind is determined by the air density, ρ, the cross sectional area of the disc, A and the flow
velocity, V. The mass flow rate is the same at all points through the stream tube, however, the
disc induces an inflow velocity to the free stream velocity known as an inflow factor, a. The
inflow factor is given by the equation;
𝑉𝑑𝑖𝑠𝑐 = 𝑉∞(1 − 𝑎) (1)
From momentum theory, the change in momentum from the far upstream velocity to the far
downstream velocity can be calculated from;
𝑅𝑎𝑡𝑒 𝐶𝑎𝑛𝑔𝑒 𝑜𝑓 𝑀𝑜𝑚𝑒𝑛𝑡𝑢𝑚 = (𝑉∞ − 𝑉𝑒)𝜌𝐴𝑉𝑑𝑖𝑠𝑐 (2)
The expression for the power extracted from the wind by the rotor is given by;
𝑃 = 1
2𝜌𝐴𝑉𝑑𝑖𝑠𝑐 (𝑉∞
2 − 𝑉𝑒2) (3)

Gordon Robertson
Wind-Hydrogen Community on the Isle of Lewis Page 26
Equation 2 can be re-arranged to give equation 4 which can be substituted into equation 1 to
give equation 5 as follows;
𝑉𝑑𝑖𝑠𝑐 = 1
2(𝑉∞ − 𝑉𝑒) (4)
𝑉𝑒 = 𝑉∞(1 − 2𝑎) (5)
Substituting equation 5 into equation 3 now gives a new expression for the power extracted
by the wind turbine which can be differentiated to obtain a value for the inflow factor, a, at
maximum and minimum power ratings;
𝑃 = 2𝜌𝐴𝑉∞3(𝑎 − 2𝑎2 + 𝑎3) (6)
Differentiating the power with respect to the inflow factor, then factorising the solution gives
two stationary points on the power curve relating to maximum and minimum power. It is
found that maximum power is obtained at an inflow factor of a third. Using this value in the
power equation and then substituting the solution into the equation for maximum power
coefficient gives the following solution to the Betz limit;
𝐶𝑃𝑚𝑎𝑥=
8
27 𝜌𝐴𝑉∞
3
1
2𝜌𝐴𝑉∞
3 =
16
27 = 0.593 (7)
Where the numerator in equation 7 represents the solution for maximum power extracted by
the rotor and the denominator is the maximum energy available in the wind flow. The Betz
limit states that the theoretical maximum power coefficient for a wind turbine is 59.3%.
Gordon Robertson
Wind-Hydrogen Community on the Isle of Lewis Page 27
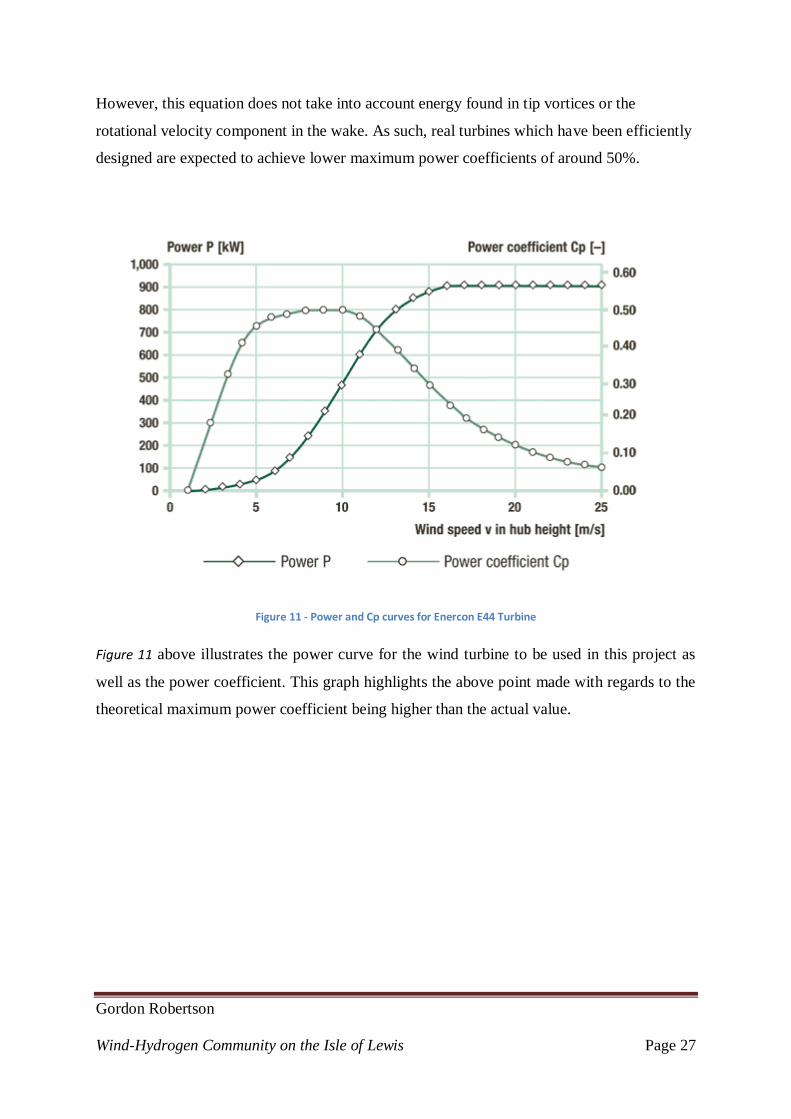
However, this equation does not take into account energy found in tip vortices or the
rotational velocity component in the wake. As such, real turbines which have been efficiently
designed are expected to achieve lower maximum power coefficients of around 50%.
Figure 11 - Power and Cp curves for Enercon E44 Turbine
Figure 11 above illustrates the power curve for the wind turbine to be used in this project as
well as the power coefficient. This graph highlights the above point made with regards to the
theoretical maximum power coefficient being higher than the actual value.

Gordon Robertson
Wind-Hydrogen Community on the Isle of Lewis Page 28
4.2.2. Fuel Cells:
The method of generating electricity through the use of a hydrogen fuel cell is both
sustainable and completely clean since the only emissions from the process are air and water
vapour. A fuel cell also has a very simple method of operation which uses no moving parts
(apart from ancillary devices such as pumps and fans). However, the main problem with
using hydrogen as the fuel is that despite there being an essentially limitless supply of it, pure
hydrogen is not readily available and energy is required to extract it (see later section on
electrolysers).
The first fuel cell reaction was produced in 1839 by scientist and lawyer, William Grove [18].
This involved a simple reaction using a liquid acid electrolyte and two platinum electrodes
connected by a circuit to produce a DC current. Since fuel cells produce DC current and
household mains power supply is AC, power conditioning in the form of an inverter must be
used in this project.
There are six main types of fuel cell. The different fuel cells are defined by the type of
electrolyte used as well as fuel source among other factors. These types are; Alkaline, Proton
Exchange Membrane, Direct Methanol, Phosphoric Acid, Molten Carbonate and Solid Oxide
fuel cell. The table below highlights some of the properties of these fuel cells;
Fuel Cell Type Mobile Ion Operating Temp (oC) Applications
Alkaline (AFC) OH-
50-200 Spacecraft
Proton Exchange
Membrane
(PEMFC)
H+ 30-100 Vehicles, lower
power CHP
Direct Methanol
(DMFC)
H+ 20-90 Portable low
power systems
Phosphoric Acid
(PAFC)
H+ ~220 Medium power
CHP systems
Molten Carbonate
(MCFC)
CO32-
~650 Medium to
large scale CHP

Gordon Robertson
Wind-Hydrogen Community on the Isle of Lewis Page 29
Solid Oxide (SOFC) O2-
500-1000 Low to large
scale CHP
systems
Table 1 - Fuel Cell Properties [18]
The diagram below (Figure 12) illustrates the reaction process inside a PEMFC;
Figure 12- Proton Exchange Membrane Fuel Cell [19]

Gordon Robertson
Wind-Hydrogen Community on the Isle of Lewis Page 30
The PEMFC (which is used in this project) uses a solid polymer electrolyte which only
allows protons to pass through thus forcing the electrons through an external circuit. The
chemical reactions which occur at both of electrodes are shown below;
𝐴𝑛𝑜𝑑𝑒: 2𝐻2 → 4𝐻+ + 4𝑒− (8)
𝐶𝑎𝑡𝑜𝑑𝑒: 𝑂2 + 4𝑒− + 4𝐻+ → 2𝐻2𝑂 (9)
Hydrogen gas is supplied to the anode electrode where the platinum catalyst works to ionise
the hydrogen. Ionising the hydrogen gas molecule releases 4 hydrogen ions (4 protons) and 4
electrons as shown in equation 8 above. Since the solid polymer electrolyte only allows the
protons to pass through the middle of the fuel cell, the electrons are forced to pass through the
external circuit creating an electrical current. The positively charged protons are drawn
through the electrolyte to the negatively charged cathode where they recombine with the
electrons and the oxygen in the air being pumped over the cathode to form water vapour as
described in equation 9.
Due to the relatively low operating temperatures of a PEMFC when compared to some of the
other types, the rate of the reaction can be quite slow. In order to speed up the reaction,
porous electrodes containing the catalyst, platinum, are used to increase the surface area and
speed up the rate of reaction. The advantage of the low operating temperature makes the fuel
cell well suited to mobile applications since it has a very quick start-up period and energy is
not consumed pre-heating the fuel as it is in higher temperature fuel cell types. It also makes
the fuel cell suitable for use in residential micro-CHP systems; again, due to the start stop
nature of operation and quick responses.
Since PEMFC require high purity hydrogen gas as a fuel, there use depends on there being
sufficient supply of hydrogen which needs to be extracted from other sources such as water
or natural gas. One solution is to use methanol as the fuel rather than pure hydrogen gas.
DMFCs consume liquid methanol which presents better storage solutions when compared to
PEMFC and the hydrogen doesn’t need to be extracted from the fuel before use. The

Gordon Robertson
Wind-Hydrogen Community on the Isle of Lewis Page 31
disadvantage is that these types of fuel cells have low power outputs and are not really
suitable for the type of application being looked at in this project.
Alkaline fuel cells have been extensively used by NASA for the past 50 years in their Apollo
missions and in the current re-useable shuttle to supply the onboard electricity and drinking
water. These fuel cells also use porous platinum coated electrodes like the PEMFC to
increase the rate of reaction. Some systems have been designed to operate under high
pressures which run at higher temperatures. The problem with the AFC is that the cathode
requires a carbon dioxide free air supply so as not to poison the catalyst. As such, a pure
supply of oxygen needs to be used to get round this problem
The phosphoric acid fuel cell operates at higher temperatures (see table 1) than the three
already looked at which makes it more suitable for CHP systems. Using a fuel cell for both
heat and power clearly increases the overall system efficiency. The drawback of the PAFC is
that it obtains its hydrogen from a finite fuel source, methane, through an energy intensive
process of steam methane reforming. As such, the methane reforming system considerably
adds to the cost of the fuel cell despite its widespread use to date.
The high operating temperatures of the solid oxide fuel cell mean that they don’t require
expensive catalysts to increase the rate of the reaction due to the high energy environment.
Additionally, natural gas is used as the fuel which is reformed inside the unit negating the
requirement for a separate fuel reformer. The very high operating temperatures (1000oC) do
bring other problems though. Complicated and expensive ceramic materials are needed to
cope with the extreme temperatures which add to the cost of the system. Additionally, more
energy is consumed in the ancillary devices to pre-heat the air and fuel as well as the complex
cooling system needed.
The final fuel cell type is the molten carbonate fuel cell. This is another high temperature fuel
cell which means that it only needs a cheap nickel catalyst to achieve a good rate of reaction.
Unlike the alkaline fuel cell, the MCFC relies on an air supply to the cathode containing
carbon dioxide. The disadvantage of this fuel cell is that the electrolyte is a molten mix of
corrosive lithium, potassium and sodium carbonates [18].
Gordon Robertson
Wind-Hydrogen Community on the Isle of Lewis Page 32
Fuel Cell Efficiency:
The maximum thermal efficiency of single cycle systems which rely on the combustion of a
fuel in air is approximately only 30%. A major advantage of the fuel cell is that they can
operate at efficiencies as high as 70%. The theoretical maximum efficiency of a single fuel
cell can be calculated from the equation 10 below;
𝐸 =−∆𝑓
2𝑁𝑒 (10)
Where E represents the EMF output of the fuel cell, hf is the enthalpy of formation
(hydrogen), N is Avogadro’s number (the number of electrons in a mole of an element) and e
is the charge on one electron. Depending on which heating value of hydrogen (enthalpy of
formation) is used, the solution to equation 10 will differ accordingly. If the higher heating
value of hydrogen gas is used (energy released condensing water vapour to a liquid, -
285.84kJ/mol-1
), then the EMF of the cell is 1.45V. However, using the lower heating value
(energy released burning hydrogen, -241.83kJ/mol-1
), the EMF will be slightly lower at
1.25V per cell. These voltages are what would be achieved if the fuel cell was 100%
efficient. Since the voltage output from an individual cell is very low, in practice, many cells
are connected in series to form a ‘stack’ raising the power output to the desired level. The
cells in the stack are separated by bi-polar plates which have alternate channels on either side
of the plate to separate the hydrogen and air supplies to the fuel cell.
In reality, fuel cells cannot convert all of the energy stored in the hydrogen into electricity as
some of it is lost as heat during the reactions (assuming no hydrogen can leak from the
system). A fuel cell operates at its highest electrical efficiency during minimum loads
(opposite to internal combustion engines) and then decreases as the load is increased
normally levelling out between 40% and 60% efficiency. Therefore, the actual fuel cell
efficiency is calculated from;

Gordon Robertson
Wind-Hydrogen Community on the Isle of Lewis Page 33
𝜂𝐹𝑢𝑒𝑙 𝐶𝑒𝑙𝑙 = 𝜇𝑓𝑉𝑎𝑐𝑡𝑢𝑎𝑙
𝐸𝐿𝐻𝑉 (11)
Where Vactual is the average measured individual cell voltage, ELHV is the lower heating value
EMF output at 100% efficiency calculated from equation 10 and µf is the fuel utilisation
coefficient. The fuel utilisation coefficient refers to mass of fuel reacted in the cell over the
mass of fuel supplied to the cell. This figure can be estimated between 0.95 and 0.98 to give a
figure for the actual fuel cell efficiency.
Gordon Robertson
Wind-Hydrogen Community on the Isle of Lewis Page 34
4.2.3. Electrolysers:
An electrolyser can be thought of as the reverse process of a fuel cell since energy is
consumed (DC electrical current) by the system in order to produce the hydrogen (the energy
storage medium) to be used by the fuel cell when the energy is required.
As with the fuel cell, there are differing types of electrolyser based on the electrolyte that
they use. These are; the alkaline electrolyser, the proton exchange membrane electrolyser and
the solid oxide type.
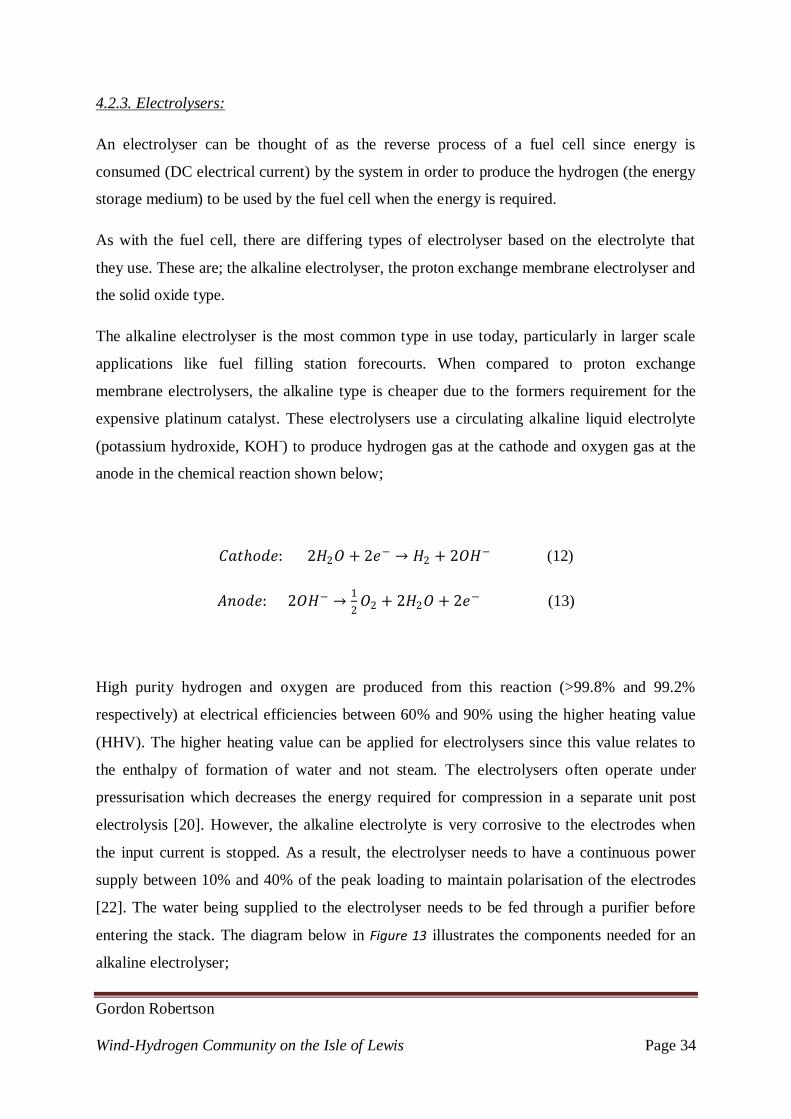
The alkaline electrolyser is the most common type in use today, particularly in larger scale
applications like fuel filling station forecourts. When compared to proton exchange
membrane electrolysers, the alkaline type is cheaper due to the formers requirement for the
expensive platinum catalyst. These electrolysers use a circulating alkaline liquid electrolyte
(potassium hydroxide, KOH-) to produce hydrogen gas at the cathode and oxygen gas at the
anode in the chemical reaction shown below;
𝐶𝑎𝑡𝑜𝑑𝑒: 2𝐻2𝑂 + 2𝑒− → 𝐻2 + 2𝑂𝐻− (12)
𝐴𝑛𝑜𝑑𝑒: 2𝑂𝐻− →1
2𝑂2 + 2𝐻2𝑂 + 2𝑒− (13)
High purity hydrogen and oxygen are produced from this reaction (>99.8% and 99.2%
respectively) at electrical efficiencies between 60% and 90% using the higher heating value
(HHV). The higher heating value can be applied for electrolysers since this value relates to
the enthalpy of formation of water and not steam. The electrolysers often operate under
pressurisation which decreases the energy required for compression in a separate unit post
electrolysis [20]. However, the alkaline electrolyte is very corrosive to the electrodes when
the input current is stopped. As a result, the electrolyser needs to have a continuous power
supply between 10% and 40% of the peak loading to maintain polarisation of the electrodes
[22]. The water being supplied to the electrolyser needs to be fed through a purifier before
entering the stack. The diagram below in Figure 13 illustrates the components needed for an
alkaline electrolyser;

Gordon Robertson
Wind-Hydrogen Community on the Isle of Lewis Page 35
Figure 13 - Alkaline Electrolyser Systems [21]
The PEM electrolyser uses the same solid polymer electrolyte as the PEM fuel cell, Nafion,
which is a fluorocarbon based ionomer. As such, the chemical reaction which occurs inside
the stack is the reverse of equations 8 and 9 (see previous fuel cells section on PEMFC). The
PEM electrolyser has proven reliability operating under real world environments
continuously for over 100,000 hours. Higher purity hydrogen is achieved when compared to
alkaline electrolysers of 99.999% and higher current densities (more compact unit) at
efficiencies between 50-90% (HHV). Efficiency is lost in the PEM electrolyser like the
PEMFC when operating under higher current densities. The advantage of the PEM
electrolyser is its ability to operate under transient current supplies as would be experienced
by the electrolyser being used in this project.
Like the SOFC, the solid oxide electrolyser operates at very high temperatures requiring
inexpensive catalyst material on the electrodes. However, the same problems exist in
manufacturing and handling the ceramic materials as well as achieving comparable operating
lives when compared to the other two types of electrolyser [20].

Gordon Robertson
Wind-Hydrogen Community on the Isle of Lewis Page 36
4.2.4. Hydrogen Properties:
Hydrogen is the most abundant element in the universe and is present in all manner of
substances on earth. Hydrogen is the simplest and lightest element in the periodic table
containing only one proton and one electron. Some radioactive isotopes of hydrogen contain
neutrons such as deuterium and tritium. The chemical arrangement of a hydrogen atom is
very reactive which means hydrogen atoms will readily combine with other atoms meaning it
doesn’t occur naturally on its own and must be separated from the other atoms before use (see
section on electrolysers).
Hydrogen is a gas at room temperature and has the second lowest boiling points of all the
elements at -253oC and is a solid at -259
oC (only 14 degrees Kelvin above absolute zero).
This makes hydrogen a cryogenic substance when in solid or liquid state. At room
temperature therefore, hydrogen is a colourless, odourless and tasteless gas which is non-
toxic to humans (unless in an enclosed space where the volume of the gas displaces too much
oxygen which would result in asphyxiation) [24].
With the hydrogen atom being the simplest of all elements, it has the lowest atomic mass.
This means that the density of the hydrogen is very low when compared to other elements
and fuels. For instance, under standard atmospheric conditions, hydrogen gas at 1 bar of
pressure has a density of 0.0899kg/m3, whereas petrol is a liquid under standard conditions
with a density of 700kg/m3. Even using an energy intensive process to cool hydrogen into a
liquid still results in a very low density of 70kg/m3. This can be illustrated by the fact that a
cubic meter of water weighing 1000kg still contains more hydrogen than a cubic meter of
pure liquid hydrogen at 111kg versus 70kg due to the more tightly packed molecules.
Despite hydrogen having a very low volumetric density, the energy density per mass of
hydrogen is the highest of all fuels due to its very low weight. When burnt, hydrogen releases
119.93kJ/g (LHV) whereas petrol only contains 44.5kJ/g giving hydrogen an energy density
2.7 times greater than petrol. This still means that the volumetric energy density of hydrogen
gas at 1 bar is some 3100 times less than petrol. In other words, the volume of the hydrogen
storage required to contain the same level of energy as petrol would have to be 3100 times
bigger. This is why hydrogen gas must be stored under compression in order to reduce the
size of storage required (see next section on Hydrogen Storage).

Gordon Robertson
Wind-Hydrogen Community on the Isle of Lewis Page 37
Safety is an issue that arises when using hydrogen as a fuel as it is very flammable when
ignited with oxygen. Most people think of the Hindenburg disaster when they think of
hydrogen safety. However, a NASA employee released a paper citing the zeppelin’s skin as
the root cause of the accident and the hydrogen fuelled the fire there after.
The flammability of a fuel is often determined between the upper and lower limits of its
concentration in oxygen. These limits are referred to by the lower flammability limit (LFL)
and the upper flammability limit (UFL). The LFL is the lowest concentration of fuel that will
support a self propagating (after ignition source) flame when in the presence of oxygen and
the UFL denotes the maximum concentration of fuel in oxygen which can sustain a flame.
Above and below these conditions and a flame cannot be supported as the air/fuel mixture is
too lean and rich respectively. Stoichiometric conditions are achieved when air and fuel are
present in the correct proportions. The diagram below illustrates the range of flammability of
hydrogen when compared to other fuels;
Figure 14 - Range of Flammability [24]

Gordon Robertson
Wind-Hydrogen Community on the Isle of Lewis Page 38
Due to the very small size of the hydrogen molecule, it can leak through very small gaps in
containers which otherwise be ait-tight to all other gases. However, should a hydrogen leak
occur, due to the very low density under atmospheric conditions and buoyancy it will
disperse rapidly up into the air where the concentration of the fuel will quickly fall to a safe
level where below the LFL. Should there be a leak in an enclosed area or ignition occur
within the range of flammability, the flame will burn upwards and away from the fuel source
avoiding setting fire to much of the surrounding materials. This is safer than other liquid fuels
where they will pool around the area of the leak and spread the flames outwards rather than
upwards.

Gordon Robertson
Wind-Hydrogen Community on the Isle of Lewis Page 39
4.2.5. Hydrogen Storage:
Using hydrogen as an energy source presents a problem when it comes to storage due to the
low density issues discussed in the previous section. There are several methods which could
be used for storing the hydrogen, each with their own advantages and drawbacks. The most
common types of storage in use today are compressed gas storage and cryogenic liquid
storage. Other experimental storage types in development are, metal hydride storage,
chemical hydrogen storage and carbon-based nano-tubes.
It is proposed in this project that compressed gas storage built from mild steel is used at a
pressure of 250 bar (250 times the pressure of standard atmosphere). This would result in the
hydrogen only requiring 13 times the volume of storage when compared to petrol for the
same energy content rather than 3100 times at 1 bar. 250 bar is a fairly moderate pressure to
store a gas when compared to the 800 bar potential of the latest carbon-fibre tanks. However,
these latest tanks are being developed primarily for the transport industry so as to keep the
size and weight of the vehicle down. In a stationary situation such as this project for
supplying fuel cells, the size of the hydrogen tanks are not of as much importance when
compared with the transport sector and less energy is consumed in compressing the gas.
Storing hydrogen as a liquid increases the energy density of the hydrogen well beyond that of
compressed gas storage. However, the volumetric energy density of these types of storage
still can’t compete with convention hydrocarbon fuels. In addition to this, liquid hydrogen
tanks are more expensive than compressed gas storage, they have issues with loss of
hydrogen through ‘boil-off’ and around 30% of the LHV of hydrogen is consumed in cooling
the gas. This makes these systems less attractive for this project but useful in transport
situations [25].

Gordon Robertson
Wind-Hydrogen Community on the Isle of Lewis Page 40
Figure 15 - Liquid Hydrogen Storage Tank [26]

Gordon Robertson
Wind-Hydrogen Community on the Isle of Lewis Page 41
4.3. Heat Pumps:
Heat pumps are a more energy efficient way to provide space heating or domestic hot water
heating to a household than conventional methods of using a boiler to heat water or electric
heaters. Heat pumps can either use the ambient air (air source heat pumps) as the energy
source or geothermal energy (ground source heat pumps). Ground source heat pumps can be
split into open loop systems; where the ground loop is circulated at the bottom of a pond or
loch, or closed loop systems; where the ground loop is circulated through horizontal trenches
a few feet below the frost level or vertically down through bore holes.
It is proposed for this project that closed loop, water to water ground source heat pumps
would be more suitable for use on the Isle of Lewis application rather than air source heat
pumps. Ground source heat pumps (GSHP) have higher coefficients of performance than air
source. The coefficient of performance (COP) is calculated as the energy output from the heat
pump divided by the energy input to the compressor and any auxiliary pumps. The COP of a
GSHP is between 3 and 4, i.e. the produce 3 to 4 times the electrical energy they consume as
heat.
The main advantage of the GSHP is that the geothermal temperature 4-6ft below the frost
level remains constant throughout the year. So, in the summer, the ground temperature is
generally lower than the air temperature allowing for household cooling if it is needed
whereas in the winter, the ground temperature is higher than the ambient temperature. Most
households on the West coast of Lewis are spaced out with room in the gardens to install the
cheaper horizontal ground loop systems.
Heat pumps operate in the same way in which a refrigerator operates. Low pressure
refrigerant is pumped through the closed ground loop heat exchanger (evaporator) where
thermal energy is absorbed from the higher temperature soil into the system. The higher
temperature refrigerant then returns to the household where it passes through a heat
exchanger transferring the heat to the second closed loop system. The fluid in the second loop
is then passed through a compressor which raises the temperature (and pressure) to the
desired level. The high temperature fluid passes through a third heat exchanger (either
another water to water or water to air heat exchanger) which delivers the thermal energy to
the home. The thermal energy in the second loop decreases and is then cooled below the
temperature of the ground loop through an expansion valve which allows thermal energy to

Gordon Robertson
Wind-Hydrogen Community on the Isle of Lewis Page 42
once again be absorbed from the ground loop heat exchanger. A diagram of this process can
be seen in Figure 16 below;
Figure 16 - Ground Source Heat Pump [23]
The theoretical efficiency (or COP) for a heat pump is governed by the second law of
thermodynamics and is calculated from the equation 14 below [23];
𝐶𝑂𝑃𝑒𝑎𝑡𝑖𝑛𝑔 = ∆𝑄𝐻𝑜𝑡
∆𝐴 ≤
𝑇𝑜𝑡
𝑇𝑜𝑡−𝑇𝑐𝑜𝑙𝑑 = 1/𝜂𝑐𝑎𝑟𝑛𝑜𝑡 (14)

Gordon Robertson
Wind-Hydrogen Community on the Isle of Lewis Page 43
5.1. Project Description:
Introduction to the Isle of Lewis:
The Isle of Lewis is the largest of the Scottish Hebridean islands located off the North West
coast of Scotland. At its longest and widest, the island measures 60 miles by 25 miles
respectively. The main postal town on the island is Stornoway which has a population of
approximately 8000 people with the total Western Isles population estimated at 26,370 in
June 2005 by the General Register Office for Scotland (Isle of Lewis accounts for 17,000 of
this figure). Lewis is connected to the Isle of Harris to the South which has far more
mountainous terrain. The terrain on the Isle of Lewis itself is very flat for the most part. As a
result, the island has some of the best sea-level wind energy resource since the wind blows in
from the Atlantic Ocean with little obstruction to reduce the incoming energy.
Traditionally, up until the 1970s, domestic energy costs on the Isle of Lewis were fairly
cheap due to the abundance of peat available for heating homes and hot water systems.
However, since then, a large shift has occurred where homes have been converted to run on
fuel oil for heating resulting in a large rise in the cost of energy for the island. The average
household on the island uses cheap rate electricity for storage heaters in some of the house
and oil fired boiler for the rest. In 2007, it was estimated that around 7 million litres of fuel
oil were consumed by the island for domestic heating purposes [27].
There is limited renewable power production on the island at present despite the vast resource
and potential for it. A 1MW hydro scheme is installed on the island which provides some of
the electricity along with a small wind farm on the Arnish Moor site near Stornoway
consisting of 3, 1.3MW Nordex N60 turbines. The sighting of these turbines is a little at odds
with legislation that prevents construction of tall structures within a 3 mile radius of the local
airport which they are. Many proposals for building large wind farms on the island have been
submitted to the local council over the past decade which have met resistance from locals
who do not wish the landscape to be spoilt or the habitat for local wildlife. As a result, only
the Arnish Moor wind farm exists on the island which is connected to the local grid.
The largest wind farm proposal was made by the Lewis Wind Power Ltd in 2001 which was
backed by AMEC and British Energy (now EDF energy). If the project had been accepted, it
would have been the biggest wind farm in Europe with a rated power output of 652MW from

Gordon Robertson
Wind-Hydrogen Community on the Isle of Lewis Page 44
181, 3.6MW Siemens wind turbines. Rough calculations released by the project predicted
that the wind farm would have produced an annual energy output of 1,997,806 MWh which
would have supplied the electrical needs of 425,000 households and saved 1,718,113 tonnes
of CO2 per year. These figures suggest that the Lewis Wind Project was taking an average
annual household energy consumption of 4700kWh which is fairly consistent with the UK
national average. However, due to wind’s intermittent nature and the fact that energy
produced during low demand times (night-time) is likely to be dumped as the grid cannot
store electricity, the actual output figures would look less favourable but it does provide an
indication of the wind farm’s performance. Along with the Lewis Wind Power proposal, two
other large wind farms were proposed from Scottish & Southern Energy and Beinn Mhor
Power which would have taken the total installed wind capacity on the island to 1016MW
[28].

Gordon Robertson
Wind-Hydrogen Community on the Isle of Lewis Page 45
Figure 17 - Proposed Wind farms on Lewis [30]
The map above the shows the location of the proposed wind farms mentioned previously.
This map was produced in 2004 and only the Arnish Moor wind cluster to the South of
Stornoway was constructed. The location of the Galson Estate project has also been indicated
on the map. The Pentland Road wind farm is a project that has been in the making for five
years but has problem with the Airport and environmentalist concerned about the habitat of
the Golden Eagles. Allowing the construction of any one of these wind farms would have
resulted in many jobs being created on the island. Furthermore, the Arnish steel fabrication
yard was used in the construction of the Arnish Moor wind farm and would once again be

Gordon Robertson
Wind-Hydrogen Community on the Isle of Lewis Page 46
used for the new wind farms which would give the local company very useful business to
keep them afloat as one of the mainstays of the Western Isles economy [31].
Isle of Lewis Grid Connection:
The Isle of Lewis is connected to the National Grid via a 33kV transmission line entering
North Harris from a sub-sea cable running from Ardmore on the Isle of Skye. The total
capacity of the current transmission cables is approximately 30MW with the minimum
demand load never dropping below 9MW [29]. The 33kV transmission line runs up the
middle of the island with an 11kV network supplying the small villages dotted along the
roads and closer to the coasts. The 2.73MW wind farm installation proposed in this project
would free-up some of the limited power capacity on the local grid leading to fewer power
cuts for the residences on the end of the lines.

Gordon Robertson
Wind-Hydrogen Community on the Isle of Lewis Page 47
5.2. Galson Estate Wind Data:
As was mentioned in the introductory section, the Galson Estate is located on the West coast
of the island along the main road that heads to the most Northern tip in Port Ness. A
meteorological site has been set up on the estate by the Galson Trust in combination with the
engineering department at Lews Castle College which is part of the University of Highlands
and Islands.
Lews Castle College supplied this project with wind data collected in 10 minute intervals
from the Galson Estate meteorological site which is located 10 meters above ground level.
This data revealed that an average wind speed over the entire year from March 2008 to March
2009 was measured at 7.03m/s which is within the expected value for the location. The
Weibull distribution chart of the wind speed is shown in the figure below.
Figure 18 - Galson Estate Weibull Distribution
0%
2%
4%
6%
8%
10%
12%
14%
0 1 2 3 4 5 6 7 8 9 10111213141516171819202122232425
% O
cc
urr
en
ce
Wind speed bin (m/s)
Weibull wind speed distribution
Measured
Weibull best fit

Gordon Robertson
Wind-Hydrogen Community on the Isle of Lewis Page 48
The Weibull distribution illustrates the frequency of a wind speed over the year which can be
used to select an appropriate wind turbine that produces the greatest energy at the most
frequent wind speeds [22]. The equation for creating the Weibull distribution graph in the
figure above is shown here in equation 15;
𝑤 𝑣 =𝑘
𝑐 𝑣
𝑐 𝑘−1
exp[− 𝑣
𝑐 𝑘
] (15)
Where v is the wind speed, k (calculated as 2.16 for the Galson estate) is the shape factor and
c (calculated as 8.23) is the scale parameter.
Since the standard height for meteorological weather station is used on the Galson Estate
(10m above ground level), the wind speeds need to be scaled up to for the hub height of the
Enercon E44 wind turbines being used in the project. These turbines have a hub height of 55
meters. The wind speed needs to be scaled up due to the wind shear factor (boundary layer)
present close to ground level. Wind speeds are affected by wind shear up to heights of
approximately 100 meters above ground level. The speed of the wind flow increases from
stationary (on the ground) up to the full free stream flow above 100 meters. The logarithmic
formula used to calculate the wind speed at the 55 meter hub height is shown here in equation
16;
V2 = V1(LN
Z2Z0
LN Z1Z0
) (16)
Where V2 is the new wind speed at the 55 meter hub height, V1 is the original 10 meter wind
speed, Z2 is the new hub height, Z1 is the original height and Z0 is the roughness factor. The
roughness factor refers to the type of landscape obstructions present around the wind farm.
For the Galson Estate, it was assumed that a roughness factor of 0.03 would apply to the

Gordon Robertson
Wind-Hydrogen Community on the Isle of Lewis Page 49
fallow fields of the area. The new average wind speed for the site over the year was
calculated at, 9.09m/s (up from the original 7.03m/s).
Using the wind power curves available from Enercon for the three 0.91MW turbines, the
hourly energy output from the wind farm can be calculated from the new scaled up wind data.
It was found that the capacity factor (or load factor) for these turbines on this site is 37.3%
which is better than the UK average (25-30%). The capacity factor relates to the actual annual
energy output from the wind turbines divided by the theoretical maximum energy output if
the turbines were to operate at their rated power all year round. The total monthly energy
output from the three turbines can be seen in Figure 19 below;
Figure 19 - Monthly Energy Output from Wind Farm
This graph illustrates the difference in energy output from the wind farm over the year. It can
be calculated that the average energy produced by the wind farm in the summer is
583406kWh compared to 838206kWh in the winter. The average energy produced in the
winter is 44% greater than it is in the summer. This is a useful correlation to note since the
energy demand in the winter is comparatively higher than in the summer due to the increased
0
200000
400000
600000
800000
1000000
1200000
1400000
Jan
Feb
Mar
Ap
r
May Jun
Jul
Au
g
Sep
Oct
No
v
Dec
Ener
gy k
Wh
Monthly Energy Output
Monthly Energy Output

Gordon Robertson
Wind-Hydrogen Community on the Isle of Lewis Page 50
requirement for lighting as a result of the fewer daylight hours and electric space heating if
installed in the house.

Gordon Robertson
Wind-Hydrogen Community on the Isle of Lewis Page 51
5.3. Heat and Power Demand:
5.3.1. Electrical Power Profile:
Contact was made with an employee (Donald Mackenzie) of Scottish & Southern Energy on
the Isle of Lewis with regards to obtaining annual hourly electrical demand data from the
Barvas substation which supplied the whole North-West corner of Lewis with electricity. A
request was made to Scottish & Southern headquarters in Perth to release the data to the
public domain to be used in this project. However, time constraints for the submission of this
thesis meant that the data could not be used as it failed to arrive before the project deadline.
Instead, an electrical profile generating tool developed by an MSc project group from
Strathclyde University was used as a substitute [32]. The tool uses simple user defined inputs
for a particular community such as, number of households and total energy consumption.
Percentages of ownership of typical electrical appliances, occupancy level of households in
community and occupancy frequency are input into the generator where probabilities
calculate the times and duration of use of each appliance to generate hourly electrical demand
profiles for the four seasons.
It was estimated in 2005 that the average total energy consumption per household in the UK
over a year is 21,500kWh (heat and power). Of this figure, 12,250kWh (gas central
heating/cooking) are used for space heating, 4600kWh for domestic hot water and 4650kWh
for electricity demand [27]. It should be noted that the actual electrical energy consumption
per household used for electrical appliances and not heating will be lower (~3500kWh) than
this figure since some houses use electric heating. This gives a mean energy demand per hour
of 2.45kWh although peak power demands will be significantly higher than this figure.
Donald Mackenzie from Scottish & Southern Energy indicated that the average annual
electricity consumption per household for the North-West corner of Lewis will be in the
region of 7500kWh (3500kWh for electrical appliances and 4000 kWh for electric heating).
This 7500kWh figure was used in the calculations for the electricity demand profile. The
diagram below, Figure 20 - Daily Power Profile (1 house), represents the daily electrical demand
profile for 1 household on the Galson Estate on the Isle of Lewis over the four seasons. From
the graph, it appears at first glance that the Spring profile is missing; however, the profile is
present on the graph but is hidden for most of the day behind the Autumn profile since these

Gordon Robertson
Wind-Hydrogen Community on the Isle of Lewis Page 52
seasons were calculated to be fairly similar. The thickness of the line representing the
Autumn profile was decreased slightly in order to reveal more of the spring profile.
Figure 20 - Daily Power Profile (1 house)
5.3.2. Heating & DHW Profiles:
It was hoped that actual hourly heating demands for the year would be attained for the project
to match the hourly time-step of the wind-hydrogen system in the Excel program however,
the best that was achieved was monthly heating energy totals from a typical house on the
island.
The figures provided were from a local couple (Brian and Kath Griffiths) who obtain their
heating energy requirements for most of the year from a 2.5kW micro-wind turbine installed
in their back garden supplying the DC current to electric heaters in the house. The data
supplied for this project dates from 2003, before the installation of the wind turbine.
0
0.5
1
1.5
2
2.5
3
1 3 5 7 9 11 13 15 17 19 21 23
Po
we
r (k
W)
Hour of the Day
Daily Electrical Power Profile (1 house)
Spring
Autumn
Summer
Winter

Gordon Robertson
Wind-Hydrogen Community on the Isle of Lewis Page 53
Incidentally, since 2003, the couple has managed to reduce their annual heating energy
consumption down from 14,805kWh to 9,500kWh through energy savings methods and
changing their energy usage behaviour. The figure below illustrates the monthly energy
consumption for a typical household on the island;
Figure 21 - Monthly Heating Energy Demand
Domestic hot water consumption was assumed to be constant throughout the year so the same
daily hot water consumption was applied throughout the simulation. In 1979, scientists
(Perlman and Mills) carried out a study focussed on modelling domestic hot water use
profiles. It was found that the average household consumes 245 litres of hot water every day
for use in washing dishes, cooking and hygiene (showers and baths) [33].
The temperature in a domestic hot water tank in the UK is required to be 60oC even though
showers and baths require a temperature of approximately 40oC. The reason for this is to
prevent the growth of the Legionella bacteria which causes Legionnaire’s disease in humans
(can be a fatal form of pneumonia) [34]. The Legionella bacterium needs warm water
conditions in which to grow between the temperatures of 20oC and 45
oC.
Below is the profile for domestic hot water consumption in a typical household;
0
500
1000
1500
2000
2500
Jan
Feb
Mar
Ap
r
May Jun
Jul
Au
g
Sep
Oct
No
v
Dec
Ene
rgy
kWh
Month
Heating Demand
Heating Demand

Gordon Robertson
Wind-Hydrogen Community on the Isle of Lewis Page 54
Figure 22 - Daily Demand for DHW
0
5
10
15
20
25
1 3 5 7 9 11 13 15 17 19 21 23
Litr
es
of
Ho
t W
ate
r
Hours
Daily Demand for Domestic Hot Water
Litres of Hot Water

Gordon Robertson
Wind-Hydrogen Community on the Isle of Lewis Page 55
5.4. UHI/Greenspace Research Hydrogen Systems:
5.4.1. Introduction:
The data for the performance of the PEMFCs to be used in this wind-hydrogen project (and
also the PEM electrolyser) was obtained from experimental results. These experiments were
carried out in the Lews Castle College hydrogen laboratory where access to hydrogen fuel
cell was gives as well as a hydrogen gas producing electrolyser to ensure efficient was always
available in the gas storage.
As discussed in section 4 of this paper, manufacturers will and proponents of fuel cell
technology often quote high efficiency ratings. These high efficiencies are normally achieved
at optimum loading ratios on the fuel cell and likewise, on the electrolyser. It is far more
useful to know how these systems perform during a wide range of transient loading ratios. As
such, this will result in more accurate results for the wind-hydrogen simulation since the fuel
cell and electrolyser will need to operate under transient load conditions; the fuel cell needs
to follow the varying electrical demand from the household and the electrolyser needs to
absorb the excess energy produced by the wind farm.
5.4.2. Hydrogen Systems:
The Lews Castle College (LCC) hydrogen laboratory is fitted with range of safety devices to
avoid any incidents involving a hydrogen gas leak in the room. The fire door was kept closed
at all times and the room was fitted with a raft of hydrogen gas detectors. The hydrogen
storage cylinder was located outdoors in a locked cage so that the fuel source was kept out of
the building. When a hydrogen leak is detected in the room, the electronic safety shut off
valve closes stemming the flow of any more hydrogen entering into the room as well as
cutting the mains electricity supply to the laboratory. Then, a series of high powered suction
fan vents (located on the roof where the hydrogen would collect in the event of a leak) are
turned on to rapidly remove the gas from the room and eliminate the chance of ignition.
Should a fire start in the room, there is an automatic fire extinguishing system present to
prevent the spread of the fire. The image below is of the safety control unit for laboratory
including the electronic hydrogen shut off valve, the switch for the gas extraction system and
the mains power supply cut-off switch produced by siGEN;
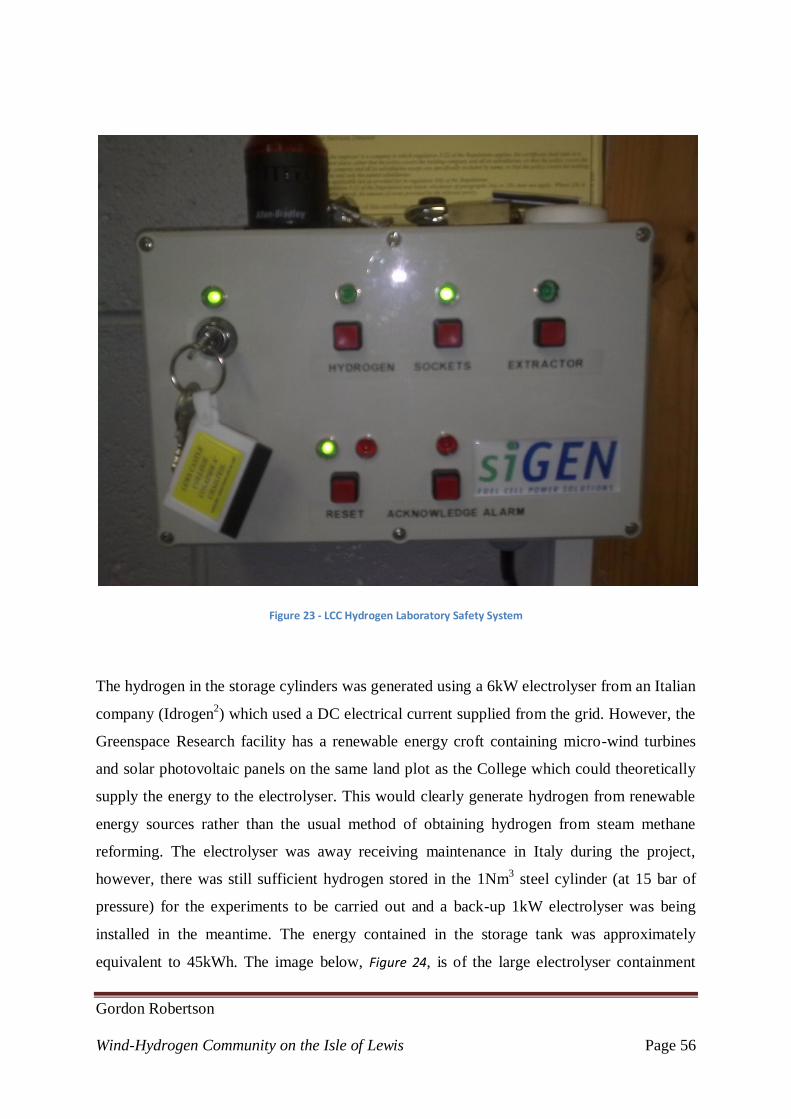
Gordon Robertson
Wind-Hydrogen Community on the Isle of Lewis Page 56
Figure 23 - LCC Hydrogen Laboratory Safety System
The hydrogen in the storage cylinders was generated using a 6kW electrolyser from an Italian
company (Idrogen2) which used a DC electrical current supplied from the grid. However, the
Greenspace Research facility has a renewable energy croft containing micro-wind turbines
and solar photovoltaic panels on the same land plot as the College which could theoretically
supply the energy to the electrolyser. This would clearly generate hydrogen from renewable
energy sources rather than the usual method of obtaining hydrogen from steam methane
reforming. The electrolyser was away receiving maintenance in Italy during the project,
however, there was still sufficient hydrogen stored in the 1Nm3 steel cylinder (at 15 bar of
pressure) for the experiments to be carried out and a back-up 1kW electrolyser was being
installed in the meantime. The energy contained in the storage tank was approximately
equivalent to 45kWh. The image below, Figure 24, is of the large electrolyser containment

Gordon Robertson
Wind-Hydrogen Community on the Isle of Lewis Page 57
unit outside the building which is located next to the hydrogen fuel storage cylinder shown in
the subsequent image, Figure 25.
Figure 24 - Electrolyser Containment Unit
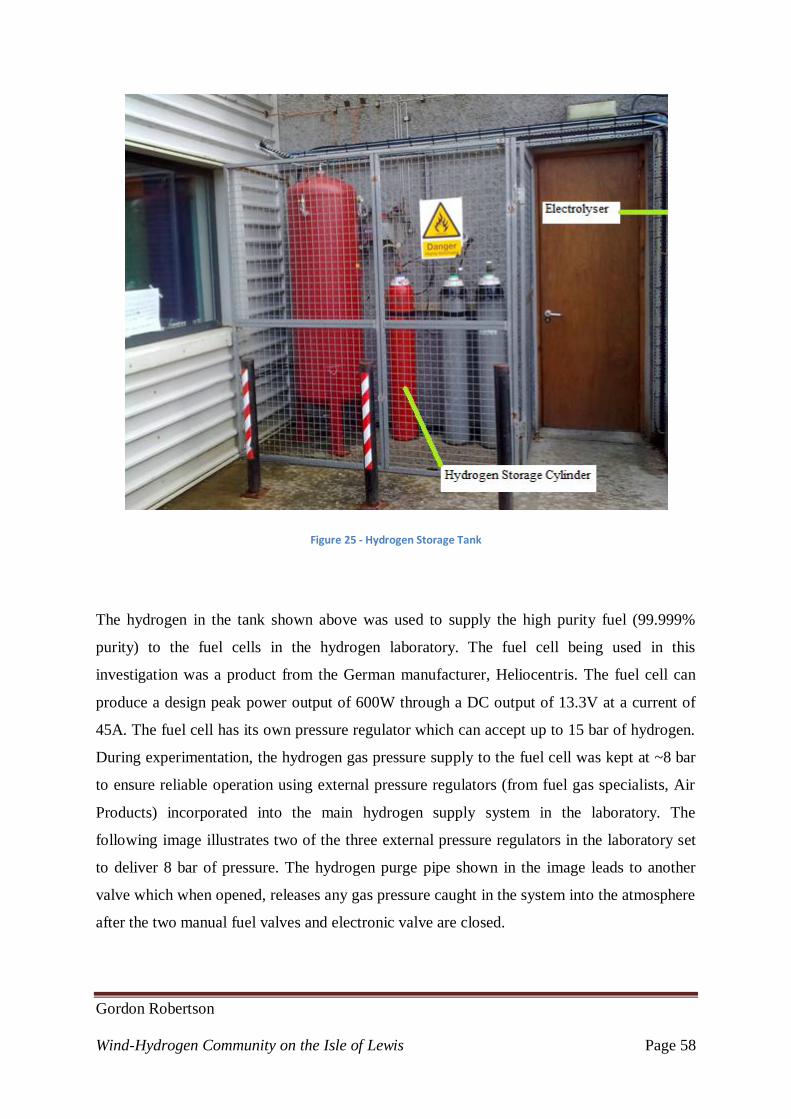
Gordon Robertson
Wind-Hydrogen Community on the Isle of Lewis Page 58
Figure 25 - Hydrogen Storage Tank
The hydrogen in the tank shown above was used to supply the high purity fuel (99.999%
purity) to the fuel cells in the hydrogen laboratory. The fuel cell being used in this
investigation was a product from the German manufacturer, Heliocentris. The fuel cell can
produce a design peak power output of 600W through a DC output of 13.3V at a current of
45A. The fuel cell has its own pressure regulator which can accept up to 15 bar of hydrogen.
During experimentation, the hydrogen gas pressure supply to the fuel cell was kept at ~8 bar
to ensure reliable operation using external pressure regulators (from fuel gas specialists, Air
Products) incorporated into the main hydrogen supply system in the laboratory. The
following image illustrates two of the three external pressure regulators in the laboratory set
to deliver 8 bar of pressure. The hydrogen purge pipe shown in the image leads to another
valve which when opened, releases any gas pressure caught in the system into the atmosphere
after the two manual fuel valves and electronic valve are closed.

Gordon Robertson
Wind-Hydrogen Community on the Isle of Lewis Page 59
Figure 26 - Hydrogen Laboratory Pressure Regulators
The fuel cell stack comprised of 24 individual cells which were kept from overheating via a
closed water cooling loop. The maximum permissible stack temperature is 70oC, above
which, and the fuel cell goes into a safety shutdown procedure. Similarly, if any of the
individual cells falls below 70% of the maximum voltage output from the other cells, then the
system will again enter a safety shutdown procedure.
The coolant loop for the fuel cell has a water reservoir which feeds into an electric pump,
supplying cooling water to circulate around the fuel cell stack. The pump supplies a steady
flow rate of approximately 1600ml/min of water coolant to the fuel cell. The coolant then
leaves the stack where it passes through an air to water heat exchanger. The heat exchanger
has two cooling fans mounted on one the top side and a large, finned surface area which
radiates some of the thermal energy stored in the coolant into the atmosphere. Temperature
measuring equipment is fitted to the coolant pipes at the entry and exit of the fuel cell so that
the heat exchanger efficiency can be determined.
The cathode electrodes of a fuel cell require a supply of air (containing the necessary oxygen)
to complete the energy producing chemical reactions which occur inside the stack. On

Gordon Robertson
Wind-Hydrogen Community on the Isle of Lewis Page 60
smaller fuel cells up to around 50W capacity, the air in the atmosphere is enough to complete
the reactions, however, larger fuel cells such as the one being used in this project require an
air fan to circulate air through the bipolar plates to the cathode electrodes.
The fuel cell unit is completely energy self sufficient requiring no external power supply. The
electrical power required for the ancillary systems in the unit (water pump, cathode air supply
fan, heat exchanger fans and integrated electronic control/measurement panel) comes from
the fuel cell itself. The fuel cell charges a 12V battery which supplies the energy to the
ancillary systems.
Fuel cell power output responds to electrical loading being placed on the external circuit. The
fuel cell used in the laboratory is capable of producing unregulated DC power, regulated DC
power (achieved with the use of an integrated DC-DC converter holding a minimum 12V
output by varying the current) and 230V AC power (with the use of an integrated DC/AC
inverter).
The system control panel was set-up to log data from various sensors in the system and
output the information to a desktop PC where all the data could be monitored in real-time (1
second time intervals) using LabVeiw software. The data available from the system included;
FC stack voltage current and power, battery voltage and current, stack temperature, coolant
inlet and outlet temperature to the stack, available fuel gas pressure, volume flow rate of
coolant, cathode air circulation and fuel cell management current (parasitic loading on the
stack from the ancillaries). The data from LabView could be recorded and output to an Excel
file for post analysis.
A hydrogen gas flow meter was fitted between the fuel cell pressure regulator and the mains
hydrogen fuel supply. Unfortunately, the LabView software designed for monitoring the gas
flow meter data on a PC was an outdated version and operated at a different bit rate to the
communications port in the more modern PC. Ultimately, the gas flow meter was not
essential as the fuel consumption of the stack can be calculated after the experiments from the
fuel cell electrical efficiency.
The image below is of the fuel cell used in the experimentations for this project;

Gordon Robertson
Wind-Hydrogen Community on the Isle of Lewis Page 61
Figure 27 - HP600 Fuel Cell System
As can be seen in the figure above, positive and negative electrical cables are connected to
the regulated DC output from the fuel cell. These cables are connected to an electronic load
capable of applying a peak power load of 1500W to the fuel cell which is more than the fuel
cell can produce. The experiments on the fuel cell were carried out by gradually increasing
the current on the electronic load panel over the fuel cell’s operating range. The following
image in Figure 28 is of the electronic load unit also built by the same company as the fuel
cell, Heliocentris;

Gordon Robertson
Wind-Hydrogen Community on the Isle of Lewis Page 62
Figure 28 - Electronic Load on Fuel Cell

Gordon Robertson
Wind-Hydrogen Community on the Isle of Lewis Page 63
6. Experimental Results:
6.1. Introduction:
The simulations for the project were carried out using Microsoft Excel and the Visual Basic
Editor for some of the processes. The simulations were carried out in hourly time-steps over
the year using the Galson estate wind data from 2008 as detailed in section 5.
The primary aim of the simulations was to discover the maximum number of households the
proposed 2.73MW wind farm could supply with all of the electrical energy presently required
by the houses in the community stretching up the North coast from South Galson to Port
Ness. The maximum number of households was determined using an iterative process until
there was no unmet electrical load in the system. The electrical demand profiles being used in
the simulation also contain a total of 3500kWh over the year per household in electricity used
for space heating.
It is intended that the energy produced by the wind farm will first be used to serve the
electrical demand from the community through a local grid. Any surplus energy generated
delivered to mini hydrogen stations which are distributed out over the community area
involved in the wind-hydrogen scheme. The fuel depot in Stornoway which currently stores
the oil used by households on the island contains several tanks in the region of 100m3
in
volume. This is common for remote island towns as they must rely on oil rather than a gas
network for their heating energy. It is thought that each compressed hydrogen storage
container would be of this size.
Using a distributed hydrogen station approach would minimise the energy losses in the
transmission of the fuel as the electricity in the grid is the only energy that would need to
travel any great distances as opposed to piping the hydrogen to the community or transporting
it with vehicles. It would, however, necessitate the construction of a local hydrogen piping
network to connect the fuel cells in the homes to the fuel supply.
Each hydrogen station would consist of a rectifier (change the incoming AC power to DC for
the electrolyser), a PEM electrolyser, a small hydrogen tank to act as a buffer between the
electrolyser and the compressor, a diaphragm-type compressor which subsequently feeds the
main hydrogen storage tank.
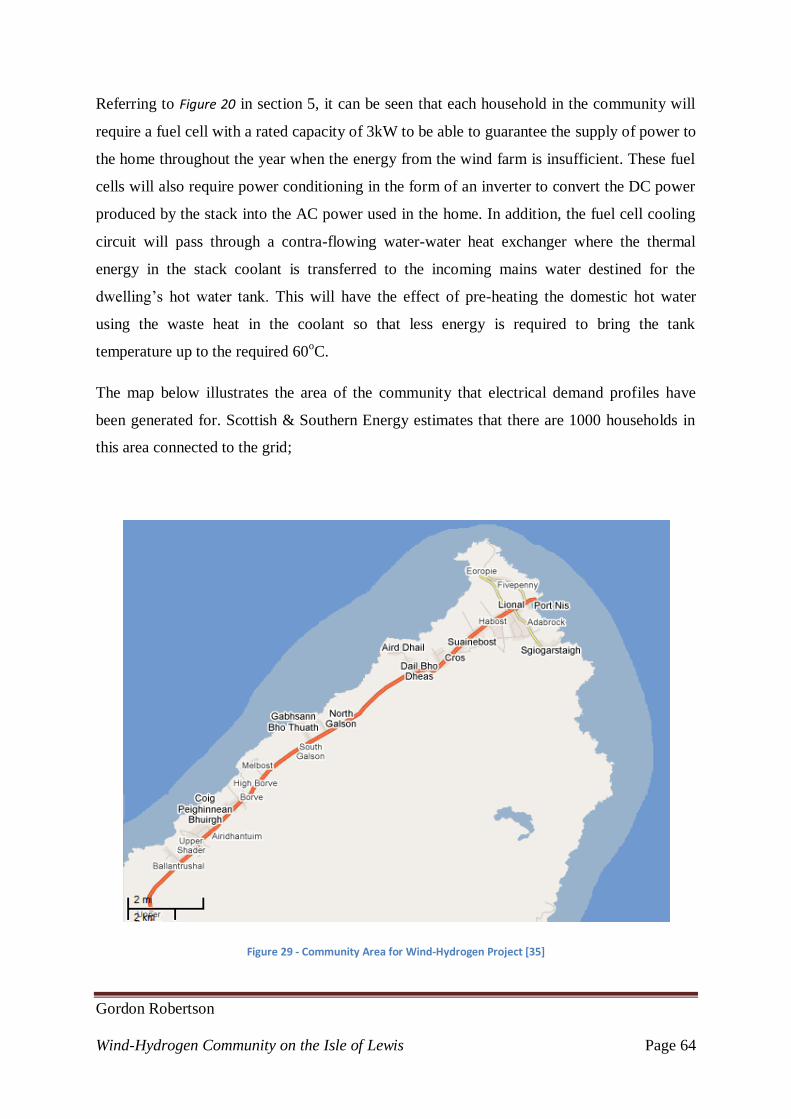
Gordon Robertson
Wind-Hydrogen Community on the Isle of Lewis Page 64
Referring to Figure 20 in section 5, it can be seen that each household in the community will
require a fuel cell with a rated capacity of 3kW to be able to guarantee the supply of power to
the home throughout the year when the energy from the wind farm is insufficient. These fuel
cells will also require power conditioning in the form of an inverter to convert the DC power
produced by the stack into the AC power used in the home. In addition, the fuel cell cooling
circuit will pass through a contra-flowing water-water heat exchanger where the thermal
energy in the stack coolant is transferred to the incoming mains water destined for the
dwelling’s hot water tank. This will have the effect of pre-heating the domestic hot water
using the waste heat in the coolant so that less energy is required to bring the tank
temperature up to the required 60oC.
The map below illustrates the area of the community that electrical demand profiles have
been generated for. Scottish & Southern Energy estimates that there are 1000 households in
this area connected to the grid;
Figure 29 - Community Area for Wind-Hydrogen Project [35]

Gordon Robertson
Wind-Hydrogen Community on the Isle of Lewis Page 65
6.2. Technical Results and Analysis:
6.2.1. Wind Farm:
The energy output from the system is clearly governed by the wind resource and the
efficiency of the installed wind capacity at capturing the wind resource. Below shows the
wind power curve used in the simulation to obtain the hourly energy outputs from the wind
farm of 3 turbines over the year;
Figure 30 - Enercon E44 Power Curve
The cut-in and cut-out wind speeds of the turbine are 4m/s and 25m/s respectively. There are
three periods in the summer when the wind farm produces very little energy which puts a
strain on the system as the community will need to rely on the stored energy in the hydrogen
tanks. The first period occurs at the beginning of June where the system must solely depend
on the fuel stores for 36 hours. The next occurrences of no and very little energy from the
-200
0
200
400
600
800
1000
0 5 10 15 20 25 30
Gen
era
tor
Ou
tpu
t kW
Wind Speed (m/s)
Wind Power Curve Enercon 0.91MW
Wind Power Curve Enercon E44

Gordon Robertson
Wind-Hydrogen Community on the Isle of Lewis Page 66
wind farm occur in July for durations of 29 hours and 37 hours. Surprisingly, the longest
period without energy from the wind farm is 103 hours in December. However in reality,
when the electrical demand of the community is applied to the simulation, there will be far
longer periods where energy from the hydrogen tank will be relied upon to meet the load.
Table 2 Shows some of the details from the wind farm where the CO2 savings are calculated
based on a figure of 0.86 tonnes per MWh and the average UK household consumes
4700kWh;
Theoretical
Wind-Farm
Output
Actual
Wind-Farm
Output
Capacity
Factor
Average Wind
Speed (Hub
Height)
Total Cumulated
Days Without
Power
Theoretical
No Average
UK
Households
Annual
theoretical
CO2 Savings
23,915
MWh
8,925 MWh 37.32% 9.1m/s 43 1900 7676 tonnes
Table 2 -Wind Farm Results

Gordon Robertson
Wind-Hydrogen Community on the Isle of Lewis Page 67
6.2.2. Experimental Results from Fuel Cell:
The results obtained from experimentation on the 600W fuel cell were scaled up by a factor
of 5 to represent the 3kW fuel required in each household in the full system energy balance.
The electronic load unit discussed in section 5 was first connected to the power conditioned
DC output (DC-DC converter), and then in a later experiment to the unregulated DC output
where the load on the fuel was ramped up in 2.5A increments between 0A and 70A and the
performance was recorded.
The aim of the experiments was to determine the electrical efficiency of a PEM fuel over
transient load conditions as well as recording the coolant output temperatures from the stack.
The results from the regulated DC output experiments provided the most reliable data from
the fuel cell which could be continuously repeated to achieve the same results each time. The
table below shows truncated results of the parameters recorded in the experiments deemed
most important to this project;
Load Current
(A)
FC Voltage
(V)
FC Current
(A)
FC Efficiency
(%)
Thermal
Output (W)
Coolant Inlet
Temp (oC)
Coolant
Outlet
Temp (oC)
0 19.4 2.1 65.7 21.3 28 28
10 16.0 12 54.2 162.2 31 32
20 14.7 22.2 49.8 329 37 39
25 14.3 25.6 48.4 389.6 42 45
30 13.8 31.5 46.7 495.2 46 49
35 13.4 33.7 45.4 543.2 50 56
40 13.2 35.9 44.7 585.9 51 56
45 13 37.9 44 626.1 51 56
50 12.9 38.6 43.7 641.5 51 56
60 12.1 42.4 41 738.6 51 57
70 11.4 47.1 38.6 853.5 52 58
Table 3 - Experimental Fuel Cell Results

Gordon Robertson
Wind-Hydrogen Community on the Isle of Lewis Page 68
As can be seen from the table, the peak efficiency of a PEM fuel cell is at minimum loadings
which is not at all useful for delivering power to a load. Installing over-sized capacity fuel
cells relative to the peak demands would be one option to operate the unit higher up its
efficiency curve, however, as can be seen in Figure 32, the unit would need to be greatly
oversized to achieve reasonable increases in efficiency at great capital cost to the project
since the efficiency rapidly deceases at low loadings before levelling out.
The efficiency of the fuel cell was calculated from equation 11 in section 4 where the fuel
utilisation factor was assumed to be 0.98 and the LHV of hydrogen was taken as 1.23V(in
terms of ideal electrolyser [19]) was multiplied by the number of cells in the stack. The
efficiency figures refer to the electrical efficiency of the stack. It is assumed that there are no
hydrogen leaks in the system, therefore, the energy lost is in the form of heat. The thermal
output is simply calculated by taking into account both the fuel cell stack power (obtained
from P=IV) and lost energy suggested by the electrical efficiency.
It is noticed that the condition where zero external load is placed on the fuel (0A entry in
table 3), still results in the fuel cell doing some useable work. This can be attributed to the
parasitic power consumption mentioned in section 5 where the fuel cell management systems
(FCMS) draws energy from the battery to drive the ancillary systems.
It was discovered when increasing the load on the fuel cell using the electronic load unit that
there came a point where the load power being drawn from the fuel cell was exceeding the
fuel cells maximum rated power output (600W). The fuel cell entered a safety shutdown
procedure when a peak load of 70A and 10.1V (707W) was exerted on the stack. This was
some 107W higher than the rated power of the fuel cell. It was realised that when the load
exceeds the output of the fuel cell, the FCMS draws on the 12V back-up battery to meet the
additional load. The fuel cell only shutdown since the battery reached a critical state of
charge where it entered an energy preservation routine. This affected the results from the
experiments as it is expected that the power output from the stack increases gradually to a
maximum before tailing off beyond this maximum loading point. The voltage power curves
from the fuel cell experiment can be seen in Figure 31 below;

Gordon Robertson
Wind-Hydrogen Community on the Isle of Lewis Page 69
Figure 31 - Fuel Cell Voltage Power Curves
The instruction manual for the fuel cell was consulted to determine where the voltage power
curves transitioned from being the product of solely the fuel cell stack to being a combination
of the stack and battery. The green line in the figure above illustrates this point and shows
where the fuel cell power begins to dip. The voltage and power curves up to this point are
characteristic of a PEM system. This information was then used and the applied load was
converted in to a percentage to produce the corrected efficiency curve seen below in Figure
32.
Figure 32 - Corrected FC Efficiency Curve
0
10
20
30
40
50
60
70
0 20 40 60 80 100
Effi
cien
cy %
Loading %
FC Efficiency
FC Efficiency
Poly. (FC Efficiency)

Gordon Robertson
Wind-Hydrogen Community on the Isle of Lewis Page 70
The efficiency curve in the figure above contains a 6th
order polynomial curve which was
used to gain a mathematical expression for the curve in Excel. It was found that the 6th
order
polynomial equation accurately follows the fuel cell efficiency curve between the loadings of
0 and 22% (where the biggest slope change in the curve occurs). Beyond a loading of 22%
and a simpler 2nd
order polynomial equation more accurately represents the straighter part of
the curve. These equations were used in the overall system energy balance where the
efficiency of the fuel cell unit could be determined at any demand loading value. The two
polynomial equations can be seen here below as equations 16 and 17;
y = 3E-10x6 - 1E-07x5 + 1E-05x4 - 0.0011x3 + 0.0449x2 - 1.1408x + 65.622 (16)
y = 0.0023x2 - 0.4106x + 62.712 (17)
The practical experiments that were planned for the project were to evaluate the operating
efficiency of a PEM fuel cell which was achieved as discussed above. It was also hoped that
experimentation of electrolyser efficiency could be carried out in the hydrogen laboratory but
since the unit was unavailable during the project, (away for maintenance) this was not
possible in the end. However, as it is a PEM electrolyser that is to be used in the project, the
efficiency results from the fuel cell experiments were applied to the reverse process of the
electrolyser as well.

Gordon Robertson
Wind-Hydrogen Community on the Isle of Lewis Page 71
6.2.3. Gas Compressor Model:
A simple thermodynamic mathematical model for a diaphragm compressor was adopted from
another hydrogen energy project carried out by the European Commission and Institute for
Energy [36].
The model was used to determine the power requirement from the system to compress the
hydrogen produced by the electrolyser at 1 bar to 250 bar for storage. The inlet conditions to
the compressor were assumed to be 1 bar of pressure and 15oC ambient gas temperature
(288K). Equation 18 below is used to calculate the theoretical amount of work required for
the gas compression;
𝑊𝑡𝑒𝑜𝑟𝑦 = 𝛾
𝛾−1 ∗ 𝑍 ∗ 𝑅𝐻2
∗ 𝑇0 ∗ [(𝑃1/𝑃0) 𝛾−1
𝛾 − 1] (18)
Where γ is the adiabatic exponent for a diatomic gas (1.41), Z is the compressibility factor at
the inlet to the compressor (1.001), 𝑅𝐻2is the hydrogen gas constant (4.124kJ/molK), 𝑇0 is the
inlet temperature in Kelvin (288), P1 is the required outlet barometric gas pressure and P0 is
the barometric inlet gas pressure. Now, from the solution to equation 18, the theoretical work
can be used to calculate the actual unit work required for the compression of the gas. This is
obtained from equation 19 as follows;
𝑊𝐴𝑐𝑡𝑢𝑎𝑙 = 𝑎 ∗ 𝑊𝑡𝑒𝑜𝑟𝑦
𝜂𝑐 ∗ 𝜌𝐻2
(19)
Where 𝜂𝑐 is the typical efficiency of diaphragm compressor (figure of 80% was used in this
simulation), ‘a’ is a conversion factor changing kJ to kWh (1/3600) and finally, 𝜌𝐻2is the
density of hydrogen gas assumed to 0.0899kg/m3. The solution to equation 19 gives the unit
work required for the gas compression in this project as 0.508kWh/Nm3.

Gordon Robertson
Wind-Hydrogen Community on the Isle of Lewis Page 72
6.2.4. Electrical Power System Energy Balance:
The simulations carried out for the total energy balance of the electrical power system were
based on the wind-hydrogen system being able to deliver power all year round to the
community. The system also needed to maintain a minimum hydrogen storage tank state of
charge of 10%. This would provide the system flexibility in the case that wind resource in
subsequent years varied slightly from the 2008 data. Having the 10% minimum state of
charge would also allow the system to absorb any fluctuations in peak demand. In reality,
since the electrical demand curves for the community were generated based on theory, (see
section 5.3.1 for details), the system will not have any of sudden peaks in demand will occur
during the year.
As has already been discussed, the system will take any wind energy generated from the farm
and deliver it directly to the local grid feeding the households. This ensures maximum
efficiency of the system as it would be highly inefficient (both financially, due to the large
hydrogen system required, and energy inefficient) to supply all the energy through the
buffering system. Some of the energy produced by the wind turbine is lost through the power
conditioning units required to feed the AC power from the generator to the grid at the correct
frequency. From the wind turbine section in section 4, the Enercon E44 wind turbine has its
synchronous generator decoupled from the grid, first with the use of a diode base rectifier to
change the voltage to DC and then with the use of pulse width modulation using insulate gate
bipolar transistors (IGBTs). These systems have typical conversion efficiencies of 95% which
have been adopted in this project [37]. There are further losses due to power conversion at the
hydrogen stations converting the AC grid power to DC for the electrolyser and with the
household fuel cell needing DC-DC converter followed by a DC-AC inverter. These
efficiencies were also assumed to be 95% [38].
When there is a surplus of electricity from the wind farm, it is converted to hourly available
DC power in Excel. This available surplus must be split into energy required to drive the
diaphragm gas compressor and energy for the electrolysis of water. The energy used for the
electrolysis of the water was converted into a percentage of the rated power input to the fuel
cell so that the polynomial equations, 16 and 17, could be used to determine the volume of
hourly volume of hydrogen produced over the year. The total rated electrolyser size was
calculated from the hourly maximum available energy from the wind farm surplus minus the

Gordon Robertson
Wind-Hydrogen Community on the Isle of Lewis Page 73
energy required for the compressor and rounded up to the nearest 100kW. The compressor
power required was calculated at 8.63% of the available energy surplus which corresponded
to the average electrolyser electrical efficiency over the year of 51.3%.
When there is a deficit between the power produced by the wind farm and the electrical
demand from the community, the 3kW fuel cells located in each household balance the load
by consuming hydrogen from the storage tanks. The peak electrical power demand from a
household over the year is found to be 2.6kW from the demand profile shown in Figure 20.
Therefore, there is capacity in the 3kW fuel cell to cope with some variances in the actual
peak demand experienced over the year. The total hourly required power conditioned output
from the fuel cells are calculated in Excel from the deficit between wind farm output and
electrical demand. From this, the required input energy to the fuel cell (in the form of
hydrogen fuel) can be calculated using the same method as for the electrolyser. Equations 16
and 17 are used to accurately plot the efficiency curve of the PEM fuel cell based on the
percentage loading calculated from the rated power output from the fuel cell. The total rated
power output from the fuel cell systems is obtained by simply multiplying the number of
households in the community by the rated power of one fuel cell.
The system is assumed to have hydrogen fuel in its storage tanks at the beginning of the year
so that the fuel cells can be used if required before the system has a chance to produce any
hydrogen fuel itself. In fact, for the first four hours of the year, the wind farm produces no
energy so the fuel cells are relied upon to deliver the energy to the load using the hydrogen
placed in the tank at the start. From running a few iterations of the simulation, a starting
energy content of 180,000kWh is chosen to be placed in the tank. This is equivalent to
5350kg of hydrogen by mass or 240m3 by volume under a pressure of 250 bar. The energy
balance that occurs in the hydrogen tank takes the form of equation 20 below where the
hydrogen tank efficiency is assumed to be 99% efficient;
𝐻𝑦𝑑𝑟𝑜𝑔𝑒𝑛 𝑇𝑎𝑛𝑘 𝐸𝑛𝑒𝑟𝑔𝑦 𝐵𝑎𝑙𝑎𝑛𝑐𝑒 = (𝐸𝑙𝑦𝑜𝑢𝑡 + 𝐻2𝑆𝑡𝑜𝑟𝑒𝑑− 𝐹𝐶𝑅𝑒𝑞 ) ∗ 0.99 (20)
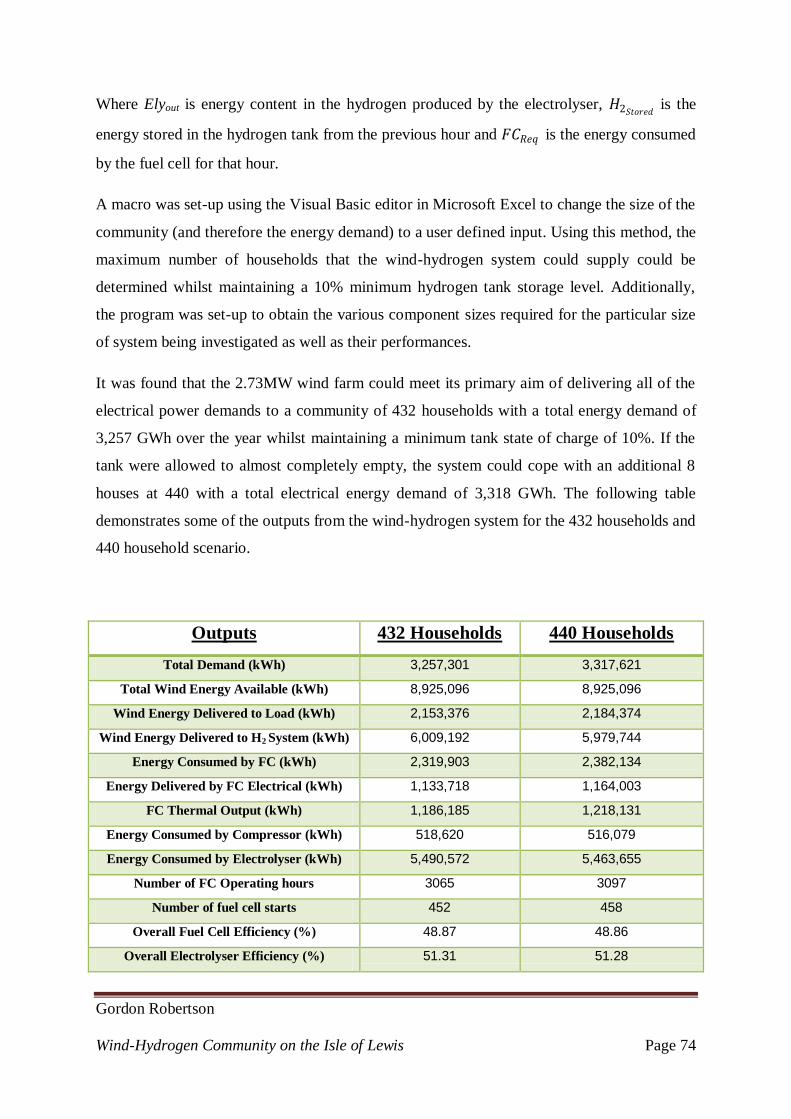
Gordon Robertson
Wind-Hydrogen Community on the Isle of Lewis Page 74
Where Elyout is energy content in the hydrogen produced by the electrolyser, 𝐻2𝑆𝑡𝑜𝑟𝑒𝑑is the
energy stored in the hydrogen tank from the previous hour and 𝐹𝐶𝑅𝑒𝑞 is the energy consumed
by the fuel cell for that hour.
A macro was set-up using the Visual Basic editor in Microsoft Excel to change the size of the
community (and therefore the energy demand) to a user defined input. Using this method, the
maximum number of households that the wind-hydrogen system could supply could be
determined whilst maintaining a 10% minimum hydrogen tank storage level. Additionally,
the program was set-up to obtain the various component sizes required for the particular size
of system being investigated as well as their performances.
It was found that the 2.73MW wind farm could meet its primary aim of delivering all of the
electrical power demands to a community of 432 households with a total energy demand of
3,257 GWh over the year whilst maintaining a minimum tank state of charge of 10%. If the
tank were allowed to almost completely empty, the system could cope with an additional 8
houses at 440 with a total electrical energy demand of 3,318 GWh. The following table
demonstrates some of the outputs from the wind-hydrogen system for the 432 households and
440 household scenario.
Outputs 432 Households 440 Households
Total Demand (kWh) 3,257,301 3,317,621
Total Wind Energy Available (kWh) 8,925,096 8,925,096
Wind Energy Delivered to Load (kWh) 2,153,376 2,184,374
Wind Energy Delivered to H2 System (kWh) 6,009,192 5,979,744
Energy Consumed by FC (kWh) 2,319,903 2,382,134
Energy Delivered by FC Electrical (kWh) 1,133,718 1,164,003
FC Thermal Output (kWh) 1,186,185 1,218,131
Energy Consumed by Compressor (kWh) 518,620 516,079
Energy Consumed by Electrolyser (kWh) 5,490,572 5,463,655
Number of FC Operating hours 3065 3097
Number of fuel cell starts 452 458
Overall Fuel Cell Efficiency (%) 48.87 48.86
Overall Electrolyser Efficiency (%) 51.31 51.28

Gordon Robertson
Wind-Hydrogen Community on the Isle of Lewis Page 75
Minimum Tank Level (%) 10.18 0.295
Maximum H2 Tank Size Required (m3) 756.4
667.4
Required FC Size (kW) 1296 1320
Required Electrolyser size (kW) 2200 2200
Required Compressor Size (kW) 210 210
Unmet Electrical Load (kWh) 0 0
Energy in tank at Year End/Surplus (kWh) 409,727 / (229,727) 335157 / (155,157)
CO2 Emissions Savings (tonnes) 2801 2853
Overall Electrical Efficiency of System (%) 36.5 37.2
Table 4 - Electrical System Results
The overall electrical efficiency shown at the bottom of table 4 takes into account the energy
left in the hydrogen storage tank at the end of the year. Since the storage tanks start with a
combined total of 180,000 kWh of energy in them at the start of the year, there must be at
least 180,000 kWh of gas left in the tank at year end. With both scenarios, there is more
energy left in the yank at year end that at the start of the year. The surplus energy figures are
shown in brackets in the table. This hydrogen could be siphoned off from the tank and sold as
a fuel to another market (e.g. transportation project on the island).
Inevitably, there is a small difference in the required fuel cell rating between the two
scenarios, but the 440 household system required a smaller storage tank than the 432
household system. This can be explained by the smaller community system being required to
never drop below a minimum storage tank state of charge of 10%.
With the system never dipping below 10.18% state of charge, there is an energy reserve in the
system of 58,157 kWh. The average energy demand over the year for the 432 household
scenario is 372 kWh. Taking this into account, there is enough energy in reserve to run the
whole community for 156 hours or just under a week. When the hydrogen tank is at its
maximum capacity of 756.4Nm3, there is enough energy to support the community for 63.5
days at the average hourly demand of 372kWh.
The maximum hydrogen tank size required for the 432 household scenario can be assumed to
be 800m3. With the proposed tank sizes for the system of 100m
3, there will need to be 8
hydrogen generating stations spread out over the community which will each serve a

Gordon Robertson
Wind-Hydrogen Community on the Isle of Lewis Page 76
community of 54 houses each. The size of the other individual components in each hydrogen
station would be; 275kW electrolyser/inverter and a 27.5kW compressor. The average daily
state of charge of the hydrogen tank throughout the year can be seen in the figure below;
Figure 33 - Hydrogen Storage Level
The general trend from the graph illustrates that the hydrogen storage is replenished during
the spring and winter months while the lower wind speeds from the middle of the year result
in a net decline in the fuel storage. This is also reflected in an increase in fuel cell activity
during the middle part of the year. Referring back to Figure 19, the energy output from the
wind farm is at its lowest throughout the year during the month of May. The fuel cell is
predictably most active during this period. As mentioned above, the average hourly energy
demand from the community is approximately 370 kWh. During the month of May, the
average demand is slightly higher at 378kWh. The fuel cells are relied upon to deliver almost
half of the energy during this period at an average energy output of 186kWh.
Stationary fuel cells can have operational lives lasting up to 40000 hours. The fuel cells in
this project are required for 35% of the year (just over 3000 hours/year) which would suggest
that they have a lifespan of approximately 13 years. However, the conditions that the fuel
cells are operating under are more reflective of PEM fuel cells used in transport applications.
0
2000
4000
6000
8000
10000
12000
14000
16000
18000
0 100 200 300
H2
Sto
rage
(kg)
Days
Hydrogen Storage Level
Hydrogen Storage Level

Gordon Robertson
Wind-Hydrogen Community on the Isle of Lewis Page 77
The fuel cell is required to operate at continuously variable loadings in this project as they
would be in a transport application and they make over 400 start/stop procedures over the
year. These types of operating conditions tend to lead to shortened life expectancies meaning
that a 13 year life-span is over optimistic.

Gordon Robertson
Wind-Hydrogen Community on the Isle of Lewis Page 78
6.2.5. Thermal Energy Recovery for DHW and Heating:
The secondary aim for the system was to determine how much of a household’s annual
space-heating and domestic hot water energy requirements could be supplied by the wind-
hydrogen system. This would be achieved through the use of heat recovery from the fuel
cell’s coolant circuit in a heat exchanger to pre-heat the water destined for the domestic hot
water tank. Additional energy would then need to be imported from the electrical grid to
power an emersion heater in the hot water tank to achieve the required 60oC temperature in
the hot water tank.
The electricity demand curves for the community contain a large portion of energy that is
normally consumed in electric heaters. Instead of using this energy to directly supply electric
heaters, it could instead be consumed by a ground source heat pump (discussed in section 4)
to increase the heating potential in the household. There is 3500kWh of available energy in
the power demand curves used in the simulations. Assuming coefficients of performance
from the ground source heat pump between 3 and 4, the fuel cell could potentially supply
heating energy to the household over the year between 10500kWh and 14000kWh.
According to the monthly heating demand averages shown in Figure 21, the fuel cell could
supply roughly supply between 71% and 95% of a household’s annual heating requirements.
Heat Recovery Result from Fuel Cell:
The results from the experiments on the 600W fuel cell can be seen in Table 3, along with the
output temperatures of the coolant from the stack. The outputs from the 600W fuel cell can
be scaled up by a factor of 5 to mimic the performance of the 3kW fuel cells intended for use
in the households. Peak output temperatures for systems of this size tend to be between 80
and 100oC. For this reason, a temperature scaling factor was also applied to the experimental
results so that under peak loading, the coolant outlet temperature reaches 80oC.
In section 5, the annual domestic hot water heating energy consumed by a household in the
UK is 4650kWh. It is assumed for this project that the average mains water inlet temperature
on Lewis is 10oC and the volume consumed per day is 245 litres (Figure 22). So, knowing the
mass of water, the inlet temperature and the desired outlet temperature (10oC and 60
oC

Gordon Robertson
Wind-Hydrogen Community on the Isle of Lewis Page 79
respectively), the annual energy required for domestic hot water heating can be calculated
from equation 21 below;
𝑄 = 𝐶𝑝 ∗ 𝑚𝑤𝑎𝑡𝑒𝑟 ∗ 𝑑𝑇 (21)
Where Q, is the heat required, 𝐶𝑝 is the specific heat capacity of water, 𝑚𝑤𝑎𝑡𝑒𝑟 is the mass of
water and dT is the difference in temperature. Using a 𝐶𝑝 value of 4186J/kgK, a mass of
water of (245*365=89,425kg) and a temperature difference of 50 degrees Kelvin, gives an
annual energy requirement of 5199kWh per household or 14.24kWh per day. However, the
outlet temperature from the fuel cell is much higher than the mains water temperature
therefore; the domestic hot water can gain useful energy from the wasted heat in the fuel cell
coolant.
Since the heat exchanger fitted to the 600W fuel cell during the experimentations was of the
wrong type for this application (water-air), the actual heat transfer for the water-water heat
exchanger will need to be estimated from calculations. The average effectiveness was taken
to be 0.75 for the system which would be applied to the maximum heat transfer equation to
obtain the household heat exchanger outlet temperature.
The coolant water mass flow from the fuel cell was scaled up by a factor of 5 from the
experimental results (1600ml/min) to represent the 3kW fuel cell (0.133kg/s). The mass flow
rate from the mains water supply into the heat exchanger was calculated as (0.068kg/s). This
corresponds to the daily mass of hot water consumed by a household passing through the heat
exchanger during one of the fuel cells’ operational hours. The outlet temperature of the
domestic hot water from the heat exchanger is calculated from the equations below;
𝐶𝑚𝑖𝑛 = 𝑚𝑑𝑜𝑡𝑐𝑜𝑙𝑑 ∗ 𝐶𝑝𝑐𝑜𝑙𝑑 (22)

Gordon Robertson
Wind-Hydrogen Community on the Isle of Lewis Page 80
Where 𝑚𝑑𝑜𝑡𝑐𝑜𝑙𝑑 is the mass flow rate of the mains water heading to the hot water tank and
𝐶𝑝𝑐𝑜𝑙𝑑 is the specific heat capacity of the water at 10oC. The maximum heat transfer can now
be calculated using equation 23 below;
𝑄𝑚𝑎𝑥 = 𝜀 ∗ 𝐶𝑚𝑖𝑛 ∗ (𝑇𝑜𝑡 𝑖𝑛 − 𝑇𝑐𝑜𝑙𝑑 𝑖𝑛) (23)
Where 𝜀 is the heat exchanger effectiveness and the two temperatures relate to the hot coolant
entering the heat exchanger and the cold mains water. From this equation, the outlet
temperature of the water heading to the hot water tank can be determined using equation 24;
𝑇𝑐𝑜𝑙𝑑 𝑜𝑢𝑡= 𝑇𝑐𝑜𝑙𝑑 𝑖𝑛
+𝑄𝑚𝑎𝑥
𝐶𝑚𝑖𝑛 (24)
Applying these equations across the outlet temperatures obtained from the experiments
carried out on the fuel cell gives the outlet temperatures from the heat exchanger. These
results are presented in the Figure 34 below;

Gordon Robertson
Wind-Hydrogen Community on the Isle of Lewis Page 81
Figure 34 - DHW Outlet Temperature
The same method was used for obtaining the heat recovery from the fuel cell as for applying
the fuel cell and electrolyser efficiency curves to the simulation. Two polynomial equations
were used to model the heat recovery curve as shown in the figure above. A third order
polynomial equation was used to accurately model the curve in the figure above up to a fuel
cell loading of 67%. Above a loading of 67% and a simpler second order polynomial
equation is used to model the flatter part of the curve. These two equations are shown below;
y = -4E-05x3 + 0.0057x
2 - 0.0098x + 21.016 (25)
y = -0.0004x2 + 0.2314x + 19.255 (26)
The table below shows the results from the heat recovery calculations;
0
5
10
15
20
25
30
35
40
0 20 40 60 80 100
Tem
pe
ratu
re d
egC
FC Load %
DHW Outlet Temp
HE Outlet Temp

Gordon Robertson
Wind-Hydrogen Community on the Isle of Lewis Page 82
Outputs 432 Households
Total Energy Required for DHW heating (kWh) 2,319,839
Total Energy Recovered (kWh) 773,004
Total Additional Energy required (kWh) 1,546,835
Total Fuel Cell Efficiency (%) 82.2
Total System Energy Efficiency (%) 45.2
Table 5 - Heat Recovery Results
The table above demonstrates the increase in total efficiency of the fuel cell when operating
as a CHP device rather than purely for power generation (up from 48% to 82%). The total
system energy efficiency improves by 9% of pure power generation making the entire power
system over 10% more efficient than a single cycle fossil fuel power station. With the use of
heat recovery, 33% of the annual energy required for DHW heating is supplied from the
wasted heat in the coolant of the fuel cell.
A 12 to 18% reduction in domestic hot water energy consumption could potentially be made
on top of the heat recovery system being fitting further heat exchangers to the bath and
shower drainage pipes. These pipes contain hot water, known as grey-water, whose thermal
energy could be recovered to further optimise the community wind-hydrogen system [39].
Figure 35 shows the average daily energy recovery (by month) from the fuel cells as well as
the additional energy required to heat the water in the tanks up to 60oC;
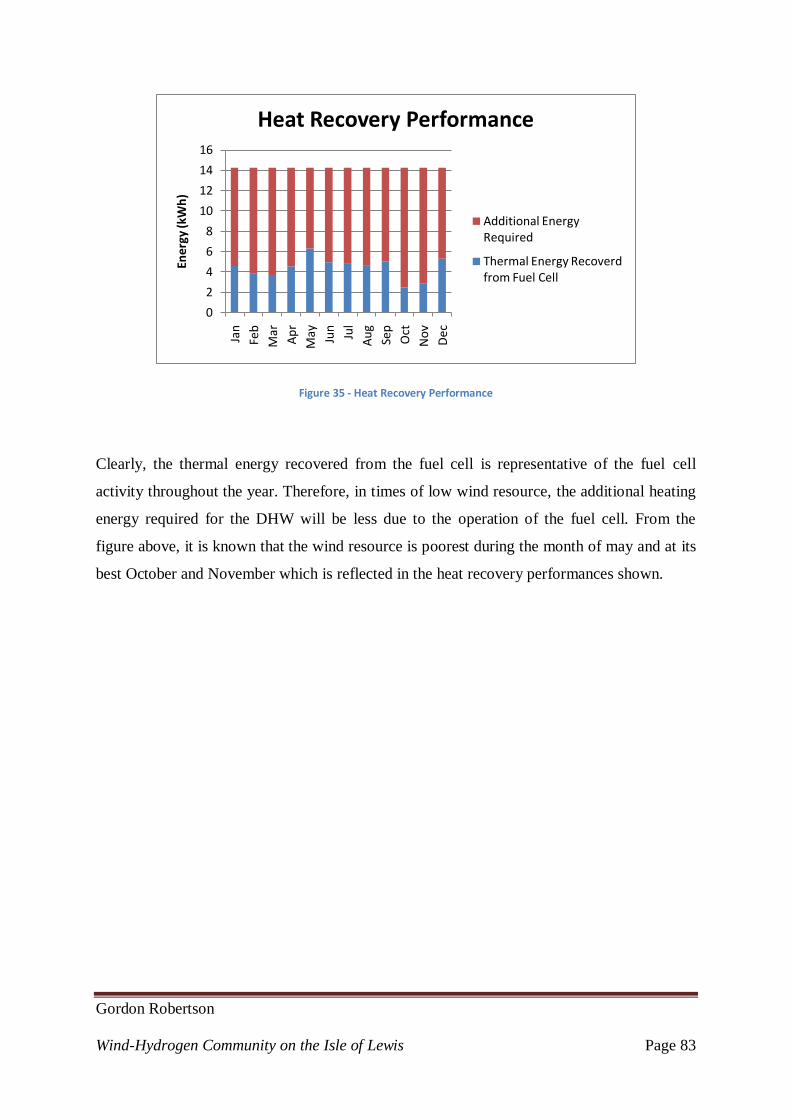
Gordon Robertson
Wind-Hydrogen Community on the Isle of Lewis Page 83
Figure 35 - Heat Recovery Performance
Clearly, the thermal energy recovered from the fuel cell is representative of the fuel cell
activity throughout the year. Therefore, in times of low wind resource, the additional heating
energy required for the DHW will be less due to the operation of the fuel cell. From the
figure above, it is known that the wind resource is poorest during the month of may and at its
best October and November which is reflected in the heat recovery performances shown.
0
2
4
6
8
10
12
14
16
Jan
Feb
Mar
Ap
r
May Jun
Jul
Au
g
Sep
Oct
No
v
Dec
Ene
rgy
(kW
h)
Heat Recovery Performance
Additional Energy Required
Thermal Energy Recoverd from Fuel Cell

Gordon Robertson
Wind-Hydrogen Community on the Isle of Lewis Page 84
6.3. Economic Analysis of Component Costs:
A brief analysis of the capital costs related to the component sizes of the system detailed in
section 6.2.4 is presented here. This analysis purely looks at the capital costs associated with
the components in a wind-hydrogen system rather than the large costs that would be involved
in setting-up such a system with the installation of a grid connection to the wind turbines and
a local hydrogen gas piping network (since residences do not rely on natural gas at present).
The table below details the costs that would be involved in the optimal 432 household
scenario. The life-span of the wind farm is considered to be 20 years so some components
will need replacing during the project. The figures for the costs involved were taken from a
recent project on a similar topic which used various manufacturers’ quotes [40].
Component Capital Cost
(£)
Replacement
Cost (£)
Operational &
Maintenance
Costs (£) / Year
Total (£)
Wind-Farm 3,052,932 N/A 45,794 3,968,812
Fuel Cells 3,110,400 2,954,880 62,208 7,309,440
Electrolysers 5,280,000 4,752,000 105,600 12,144,000
Compressors 198,800 N/A 2,982 258,440
H2 Storage 23,800,000 N/A 595,000 35,700,000
Power Conditioning 3,496,000 N/A 52,440 4,544,800
Total £38,938,132 £7,706,880 £864,024 £63,925,492
Table 6 - System Component Costs
It can be noted from the table above that the cost of the wind farm nearly 13 times less than
the costs required for the hydrogen systems despite the wind farm being the energy source for
the community. However, it is clear that the costs of the 8 large, compressed storage tanks
needed to store the fuel required to support the community during times of low wind resource
are the primary costs associated with the system. As technology improves and wind-hydrogen

Gordon Robertson
Wind-Hydrogen Community on the Isle of Lewis Page 85
systems become more common, the capital and maintenance costs of this type of scheme
should begin to fall.
Gordon Robertson
Wind-Hydrogen Community on the Isle of Lewis Page 86
7. Conclusions & Recommendations:
Conclusions:
The Isle of Lewis has a significant amount of un-tapped wind energy resource which could be
used to help meet the UK’s renewables targets in 2020. This project looked to address the
issues of intermittent power supply from wind farms with the use of a wind-hydrogen system.
The proposed wind farm by the Galson Trust on the West coast of Lewis is theoretically
capable of supplying 1900 UK average households with electricity. However, the intermittent
nature that wind farms generate power with means that the actual number of households
which the wind farm can supply energy to all year round is zero.
It was found that with the use of a hydrogen system, the wind farm could supply the electrical
energy needs of 432 households all year round whilst never allowing the hydrogen fuel
storage to drop below 10% full. This represented an electrical system efficiency of 36.5%
with an energy surplus at the yearend of 229,727kWh (enough energy to support the entire
community for 26 days without any wind power). The environmental impact of this is a CO2
saving of 2801 tonnes per year.
Eight hydrogen generating stations are needed in the system which are distributed over the
community demand centres thus minimising energy losses in transmission. Each station
would contain a 100Nm3 storage capacity capable of supplying the electrical energy needs to
54 households.
Results from heat recovery calculations carried out on the fuel cells indicate that a significant
improvement in overall fuel cell and entire system efficiency can be made. The fuel cell
efficiency improves to 82.2% and overall efficiency is up to 45.2%. These are useful
improvements in efficiency considering the relatively modest fuel cell output temperatures
that contribute to 33% of the a household’s annual DHW energy requirements.
Finally, a brief look into the capital costs of the wind hydrogen system components revealed
that the size of the hydrogen storage tanks were the main influencing factor on the
£38,938,132 figure.

Gordon Robertson
Wind-Hydrogen Community on the Isle of Lewis Page 87
Future Recommendations:
The simulation of the wind energy system related electrolyser efficiencies to the
experimental fuel cell efficiencies as the electrolyser was unavailable during the
project. For future work, it would me more accurate to experiment with the efficiency
of the electrolyser with the transient power supplies to obtain more representative
results. This could be achieved between Greenspace Research and Lews Castle
College by supplying the energy for electrolysis from the power generated on the
renewable energy croft they have on-site.
The heat recovery potential from the fuel cell could also be explored with
experimentation. The households on the island require 3kWel fuel cells with heat
recovery potential. A useful progression to the project would be to work with a 3kW
PEM fuel cell and have the coolant circuit passing through a water-water heat
exchanger being supplied with mains water as the heat sink for the coolant.
Obtaining hourly demand data for households in the community for space heating
would be another logical progression in moving towards a 100% renewable
community. Greenspace Research has an open system ground source heat pump under
development in their renewable energy croft. Carrying out experiments over the year
with this system would provide more accurate efficiencies of the heat pump in the
Lewis climate which could be applied to wind-hydrogen community to optimise the
energy available from the wind farm.
The Isle of Lewis has often been linked with the construction of large wind farms in
excess of 100MW (larger than the 2.73MW farm investigated in this project). For this
reason, it may be useful to look into a wind-hydrogen system of a much larger scale to
learn how this could be integrated into a renewable energy of this size.
The wind-hydrogen system modelled in this project was found to produce excess
hydrogen by the end of the year. Future work in this area could look into the
possibility of beginning a renewable transportation project using hydrogen as the fuel.
At present, the Western Isles council are keen to get such a project into action. They

Gordon Robertson
Wind-Hydrogen Community on the Isle of Lewis Page 88
are in discussions with the Royal Mail van service on the island based in Stornoway
to introduce one or two vans using hydrogen in the internal combustion engines rather
than petrol. In addition to this, the market for oxygen gas could be looked into since
the electrolysis process produces large quantities of oxygen gas. On Lewis, one
possible industry which could make good use of stored oxygen gas is the fish farming
industry where managing the O2 concentration in the water enhances fish production.

Gordon Robertson
Wind-Hydrogen Community on the Isle of Lewis Page 89
References:
[1] ReStats: Renewable Energy Statistics Database for the UK, (Website 2008-2009).
Available from: http://www.restat.org.uk/electricty.html
[2] House of Commons Innovation, Universities, Science and Skills Communication.
Renewable Electricity-Generation Technologies (5th Report of Session 2008-2009). Date: 11
th
June 2008
[3] Carbon Trust Strategy: The UK Renewable Energy Strategy 2009, (Website 2009).
Available:
http://www.carbontrust.co.uk/../CarbonTrustBriefingonUKRenewableEnergyStrategy2009.pd
f
[4] The Ashden Awards for Sustainable Energy: Wind Energy Summary, (Website 2008).
Available from: http://www.ashdenawards.org/wind
[5] A Norwegian Case Study on the production of Hydrogen from Wind Power, International
Journal of Hydrogen Energy (30th November 2006). Authors; Christopher Greiner, Magnus
Korpas and Arne Holen.
[6] Utsira Wind Power & Hydrogen Plant, (1st July 2004). Norsk-Hydro Oil and Energy
Company.
[7] Utsira – Demonstrating the hydrogen society on renewable terms. Norsk-Hydro Oil and
Energy Company. Date: 4th December 2005
[8] A field application experience of integrating hydrogen technology with wind power in a
remote island location, Robert Gordon University, Journal of Power Sources. Date: 18th
January 2006.
[9] Island Wind-Hydrogen energy: A significant US Resource, Renewable Energy 33.
Authors: Benjamin Sovacool & Richard Hirsh. Date: 4th December 2007
[10] Wind & Hydrogen Lolland community testing facilities, Renew Europe 2007 Hamburg.
Senior Advisor Jesper Krogh Jensen. Date: 22nd
March 2007
Gordon Robertson
Wind-Hydrogen Community on the Isle of Lewis Page 90
[11] Hydrogen and Renewables Integration (HARI), CREST (Centre for Renewable Energy
Technology) Loughborough University. Authors: Rupert Gammon et al. Date: March 2006.
[12] James Blyth – Britain’s first modern wind power pioneer, Wind Engineering Volume 29.
Author: Trevor J. Price. Date: May 2005
[13] General Introduction to Wind Turbines. Website available from:
www.earthscan.co.uk/Portals/0/Files/Sample%20Chapters/9781844074389.pdf. Date:
September 2009
[14] Handbook of Wind Energy. Author: Tony Burton. Date January 2001. Page 4
[15] Energy Systems & the Environment, Course notes on Energy Resources and Policy
(Betz Formula). Author: Dr Andy Grant. Date: 2009
[16] Wind Energy: Renewable Energy and the Environment, Authors: Vaughn Nelson and
Abbas Ghassemi. Page 138-142. Date: 2009
[17] Wind Power Integration: connection and system operational aspects. Author: Brendan
Fox. Date 2007, Pages 73-79.
[18] Fuel Cell Systems Explained. Authors: James Larminie and Andrew Dicks. Date
Published: 2003.
[19] UHI Renewable Energy Course Notes, Hydrogen Fuel Cells (Image taken from Ballard
Power Systems, www.ballard.com). Author: Alasdair Macleod
[20] A report on electrolysers, future markets and the prospects for ITM Power Ltd’s
electrolyser technology. Author: Professor Marcus Newborough. Date: February 2004.
[21] Summary of Electrolytic Hydrogen Production, National Renewable Energy Laboratory.
Author: Johanna Ivy. Date: September 2004.
[22] A probabilistic method for sizing of isolated wind-electrolyser systems, Norwegian
University of Science and Technology. Authors: Lars Nesje Grimsmo et al. Date: 2004
Gordon Robertson
Wind-Hydrogen Community on the Isle of Lewis Page 91
[23] Ground Source Heat Pumps and Applications, Renewable and Sustainable Energy
Reviews. Author: Abdeen Mustafa Omer. Date: 28th July 2006
[24] Hydrogen Fuel Cell Engines, Hydrogen Properties. Available from: (website,
www1.eere.energy.gov) pdf. Date: December 2001.
[25] US Department of Energy, Energy Efficiency and Renewable Energy, Hydrogen
Storage. Available from: (website www1.eere.energy.gov). Date: 18th September 2008
[26] Hydrogen Cars Now, Liquid Hydrogen. Available from: (website
www.hydrogencarsnow.com). Date: Viewed September 2009.
[27] Wind Hydrogen Production for Domestic Hydrogen Production?, University of the
Highlands and Islands (Lews Castle College). Author: Dr Alisdair Macleod. Date: 2008
[28] Carbon Savings and Wind Power on Lewis, Views of Scotland Briefing, Paper 6. Date:
October 2007.
[29] The Carbon Trust: Marine Energy Challenge, Oscillating Water Column Wave Energy
Converter Evaluation Report. Date: 2005
[30] Isle of Lewis – Proposed Wind farm development areas (image), Website available
from: http://www.jmt.org/assets/news/lewis_wind_map_fullw.jpg. Date: September 2009
[31] Lewis Wind Power, Website available from: http://www.lewiswind.com/projectcentre/.
Date: September 2009.
[32] Demand Side Management, Towards a Carbon Neutral Community. Authors: Fairuz
Abd Jamil et al. Available from website: http://www.esru.strath.ac.uk/EandE/Web_sites/06-
07/Carbon_neutral/START%20PAGE.htm Date: June 2007
[33] Thermal Performances of Hot Water Heater in Series, University of Petroleum and
Minerals, Dhahran, Saudi Arabia. Authors: A. K. Kar and K. M. Al-Dossary. Date: 1995.
[34] Legionnaire’s Disease, Health & Safety Executive. Website available from:
http://www.hse.gov.uk/legionnaires/ . Date: September 2009.
[35] Map of the Proposed area for wind-hydrogen project, Google Maps. Available from
website: http://maps.google.co.uk/maps?hl=en&tab=wl . Date: September 2009.

Gordon Robertson
Wind-Hydrogen Community on the Isle of Lewis Page 92
[36] Bridging the European Wind Energy Market and a Future Renewable Hydrogen-
Inclusive Economy, European Commission & Institute for Energy. Authors: S. Shaw, S.D.
Petevs. Date: 2006
[37] Wind Power Electronics: Achieving lower cost, higher efficiency, and superior
reliability. Author: Darren Hammell. Date: 30th June 2004.
[38] Sustainable Energy Technologies – Fuel Cell Power Inverter Efficiency, Website
available from http://www.encyclopedia.com/doc/1G1-71352644.html . Date: March 8 2001.
[39] On the Combined Effect of Wastewater Heat Recovery and Solar Domestic Hot Water
Heating, Canadian Solar Buildings Conference. Authors: Michael Kummert et al. Date:
August 20-24 2004.
[40] Wind Resource Utilising Hydrogen Buffering, System Costs. Available from website:
www.esru.strath.ac.uk Date: May 2009