wimax in papua new guinea - bicsi • introduce papua new guinea • introduce u‐konekt...
TRANSCRIPT

WiMax in Papua New GuineaWiMax in Papua New Guinea
The Last Frontier

AgendaAgenda
• Introduce Papua New Guinea• Introduce Papua New Guinea• Introduce U‐Konekt TechnologiesIntroduce U Konekt Technologies
• Brief discussion of “Why WiMax”
• Q&A

The Flag…

Key statisticsPopulation:6 7 MillionPopulation:6.7 MillionArea: 462,840 sq KmGDP per capita : 2400 USD, increasing 4.2% annually GDP Growth: Average 6% over past 3years; will
greatly expand due to LNG projectLiteracy: 57%Urbanization: 12%
East of Indonesia, eastern half of second largest island in the world (New Guinea)largest island in the world. (New Guinea)
Mobile penetration: 18%Fixed Line penetration: 1%Fixed Line penetration: 1%Internet users: 120,000
RB1
Slide 4
RB1 CIA world factbook quotes population at 6.06M people (July 2010 projection)Mobile phone penetration is 600,000 (2008).Richard Bussiere, 8/12/2010

The People• First people arrived some
60,000 years ago• Barely explored by the westBarely explored by the west
until 1930, resulting in isolation and underdevelopment– To this day many Papua NewTo this day many Papua New
Guineans have not seen a white man and think that they are ghosts when they do see one!
• The most heterogeneous country on the planet – Over 800 unique languages– “Main” languages are English,
Pidgin and Motu
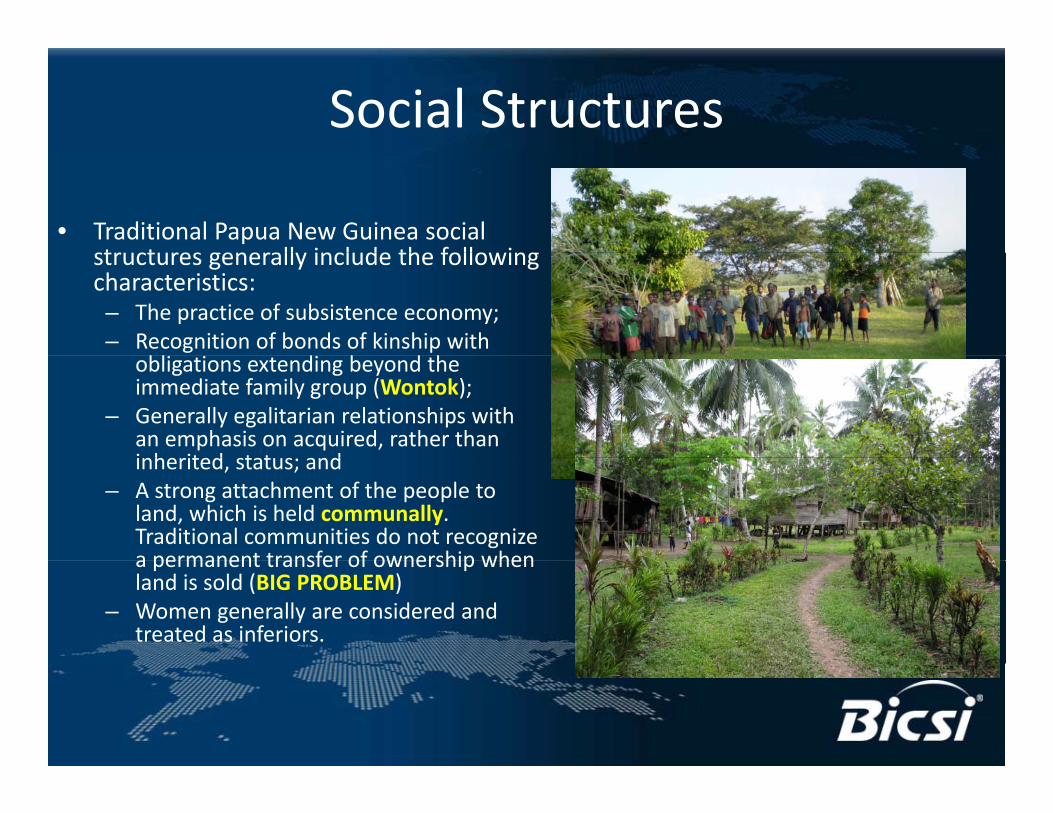
Social Structures
• Traditional Papua New Guinea social structures generally include the followingstructures generally include the following characteristics:– The practice of subsistence economy;– Recognition of bonds of kinship with
bl d b d hobligations extending beyond the immediate family group (Wontok);
– Generally egalitarian relationships with an emphasis on acquired, rather than inherited status andinherited, status; and
– A strong attachment of the people to land, which is held communally. Traditional communities do not recognize a permanent transfer of ownership whena permanent transfer of ownership when land is sold (BIG PROBLEM)
– Women generally are considered and treated as inferiors.

Natural ResourcesNatural Resources
• Rich in ResourcesRich in Resources– PNG has much mineral wealth, including gold, copper iron oil and natural gascopper, iron, oil and natural gas
– Renewable resources include timber, fish, coffee
• Mineral and oil export receipts account for• Mineral and oil export receipts account for 82% of GDP
A i l f 13% f GDP• Agriculture accounts for 13% of GDP

The PNG LNG Project• Estimated 227 billion cubic meters of natural gas reserves
• Project approved in December 2009 with several multinational oil companies including Exxon‐Mobile;
it l t t d $15B USDcapital cost to exceed $15B USD
• Expected to increase GDP from $8.6B USD to term to $18.2B USD in the near term
• Expected to triple PNGs export revenuerevenue
• Ripple effect helps to drive economy via increased public and private spending

Ukonekt OverviewUkonekt Overview
• Established to provide 4th GenerationEstablished to provide 4 Generation Wireless WiMax based Broadband Internet access throughout Papua New Guineaaccess throughout Papua New Guinea
• One of two holders of a WiMax License, nationwidenationwide
• Ownership split is 51% Papua New Guinean, 49% f i49% foreign– Required by law for license, barrier to entry for f i fi
9
foreign firms

Current StatusCurrent Status
• License is secured for WiMax (2 3 GHz spectrumLicense is secured for WiMax (2.3 GHz spectrum nation wide) and licensed backhaul in Port Moresby (11 GHz)y ( )
• Contracted P1 International (Malaysia) to manage trial and monitor networkmanage trial and monitor network– Assisted in setup and is remotely monitoring trial
– Approximately 100 userspp y
– Mix of High Quality, Desktop, and Dongle based CPE
• Trial operational since April 2010
10
Trial operational since April 2010
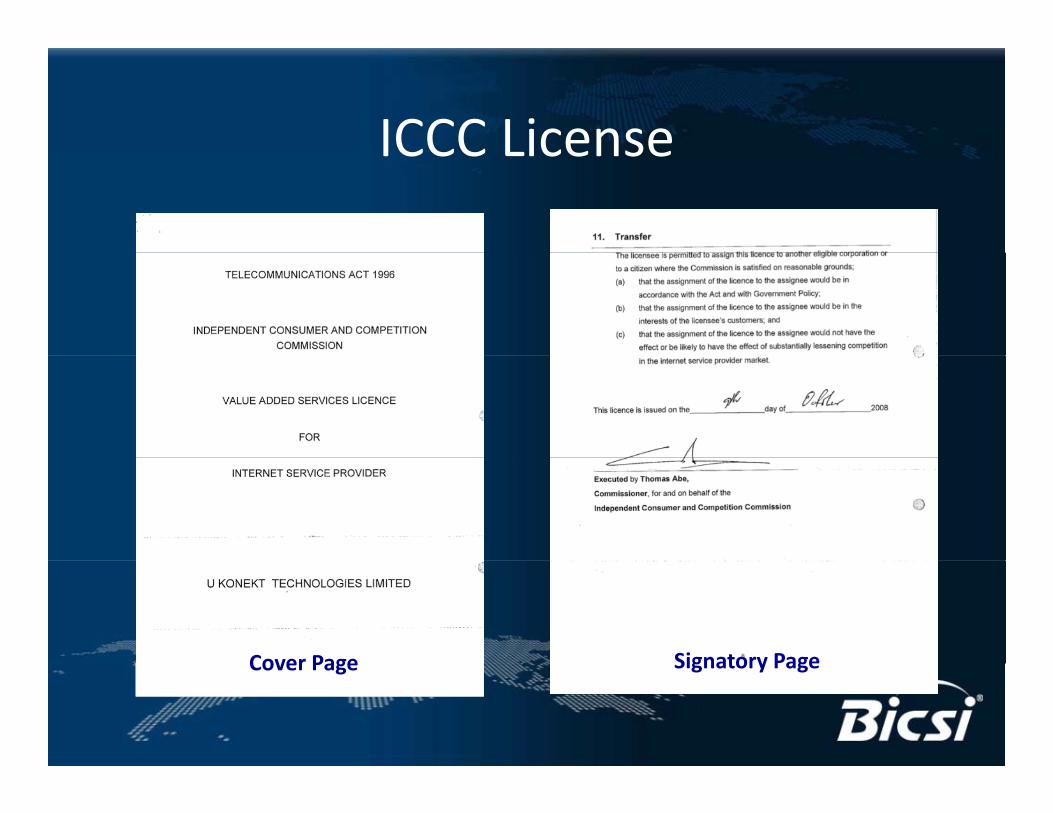
ICCC LicenseICCC License
Cover Page Signatory PageCover Page Signatory Page
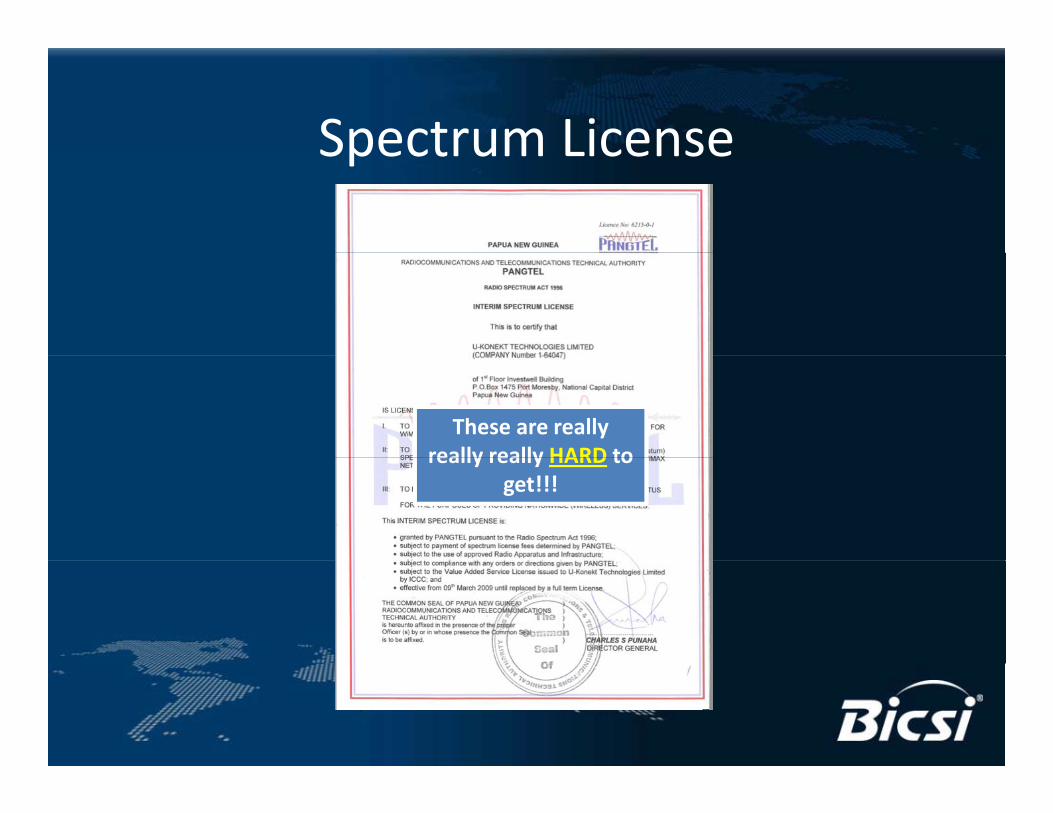
Spectrum LicenseSpectrum License
These are really really really HARD toreally really HARD to
get!!!
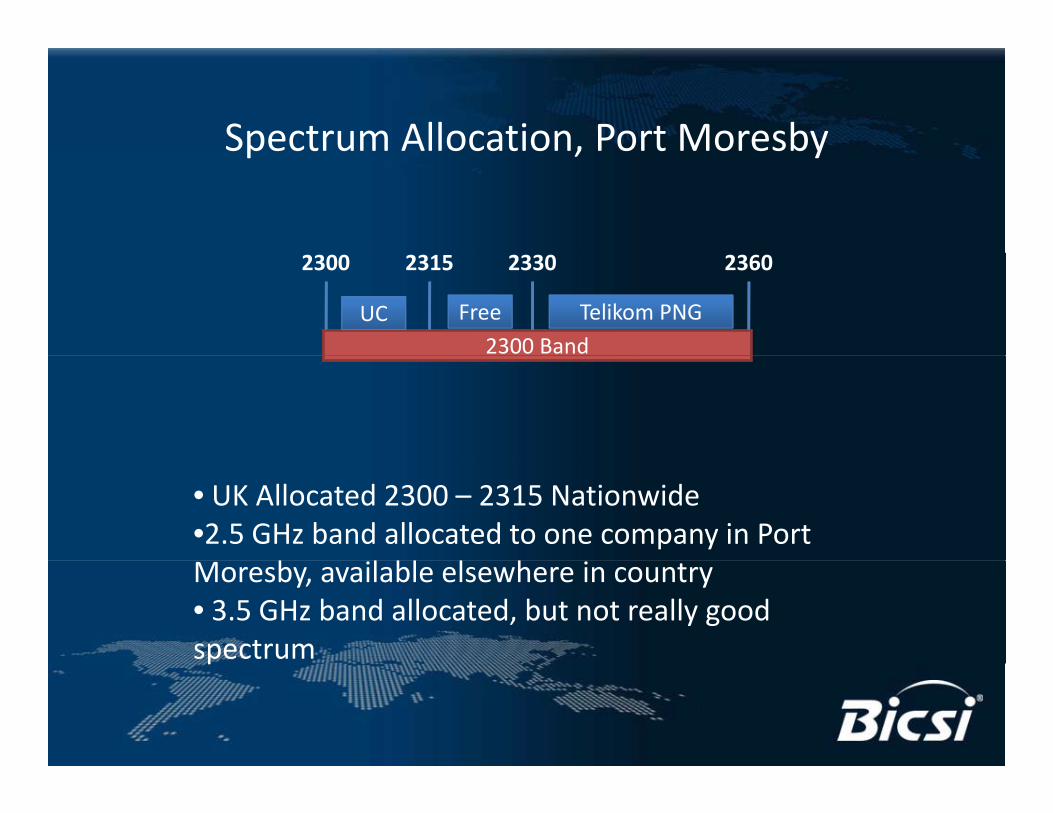
Spectrum Allocation, Port MoresbySpectrum Allocation, Port Moresby
2300 BandUC Free Telikom PNG
2300 2315 2330 2360
• UK Allocated 2300 – 2315 Nationwide•2.5 GHz band allocated to one company in Port
b l bl l hMoresby, available elsewhere in country• 3.5 GHz band allocated, but not really good spectrump

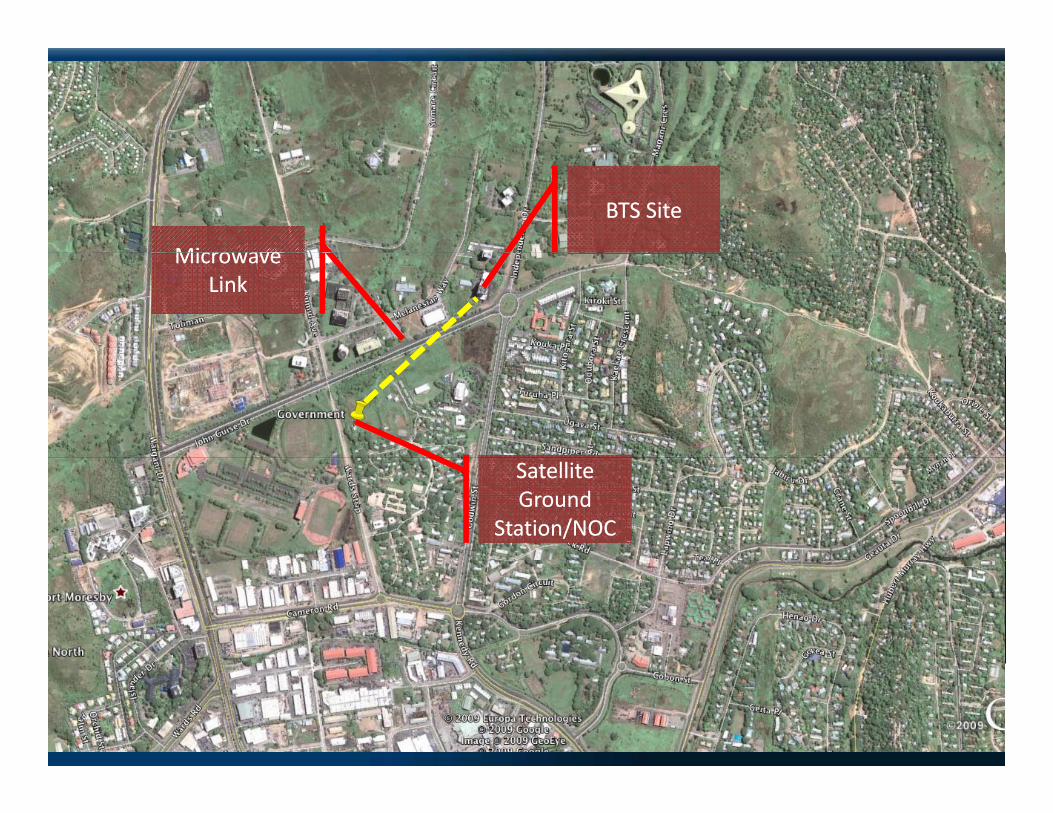
Network Path Profile

BTS SiteBTS Site
MicrowaveMicrowaveMicrowave Link
Microwave Link
Satellite Ground
Station/NOC
Satellite Ground
Station/NOC
UKonekt Confidential

UKonekt Confidential

Equipment is located in weatherproofCastellation on top of
b ildibuilding

W NN
ES

BTS Location
UKonekt ConfidentialNOC/Satellite Location
BTS SiteBTS Site
MicrowaveMicrowaveMicrowave Link
Microwave Link
Satellite Ground
Station/NOC
Satellite Ground
Station/NOC
UKonekt Confidential

Network Design

EquipmentEquipment
• Cisco was selected as the WiMax Vendor forCisco was selected as the WiMax Vendor for the trial– Unfortunately they exited the WiMax market so– Unfortunately they exited the WiMax market so left us orphaned
– Equipment has been performing well but isEquipment has been performing well but is unsupported – no CPE support from third parties (very very painful)
• Currently shopping for an alternative vendor to complete roll‐outto complete roll out

Installation Pictures

Thin Client Server (Dell)
NOC Equipment
Cisco 5505 VPN Gateway
Cisco 2960 Switch
EMS Server (Windows 2003)
CAR Server (Linux)
Cisco 7604 Router
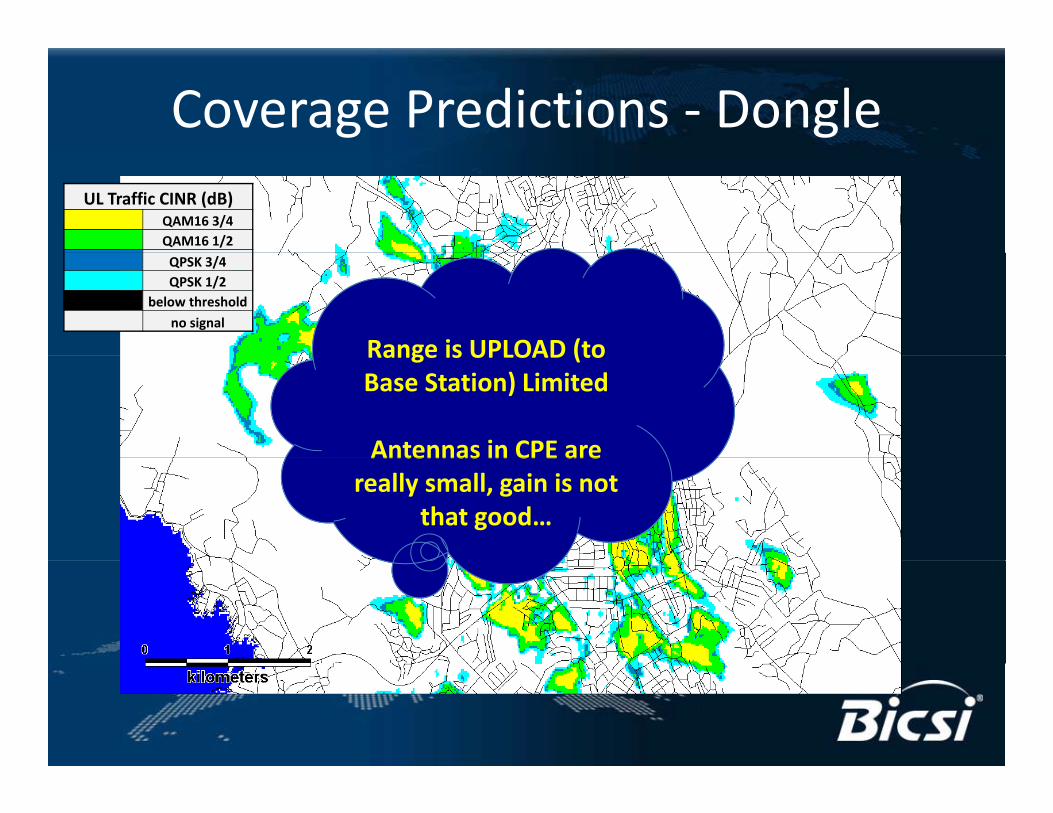
Coverage Predictions ‐ DongleUL Traffic CINR (dB)
QAM16 3/4QAM16 1/2
Range is UPLOAD (to
QPSK 3/4QPSK 1/2
below thresholdno signal
Range is UPLOAD (to Base Station) Limited
Antennas in CPE areAntennas in CPE are really small, gain is not
that good…

Coverage Prediction ‐ OutdoorUL Traffic CINR (dB)
QAM16 3/4QAM16 1/2
QPSK 3/4/QPSK 1/2
below thresholdno signal

Papua New Guinea EconomyPapua New Guinea Economy
• Strong GDP Growth rateStrong GDP Growth rate– Expected to exceed 6% in 2009
– 6.3% in 20086.3% in 2008
– 6.0% in 2007
– Compare against Thailand at 3.6% (2008) and 4.9%Compare against Thailand at 3.6% (2008) and 4.9% (2007)
• Large LNG project coming on‐line in next 3 yearsg p j g y
• Population = 6 Million
• Per capita income is $2200Per capita income is $2200

Energy Exploitation Creates OpportunityEnergy Exploitation Creates Opportunity
• LNG boom will create stress on all existingLNG boom will create stress on all existing infrastructure
• Will create demand for Internet services• Will create demand for Internet services– 14,000 expatriate workers
N b i d ill– New support businesses and contractors will emerge requiring Internet access
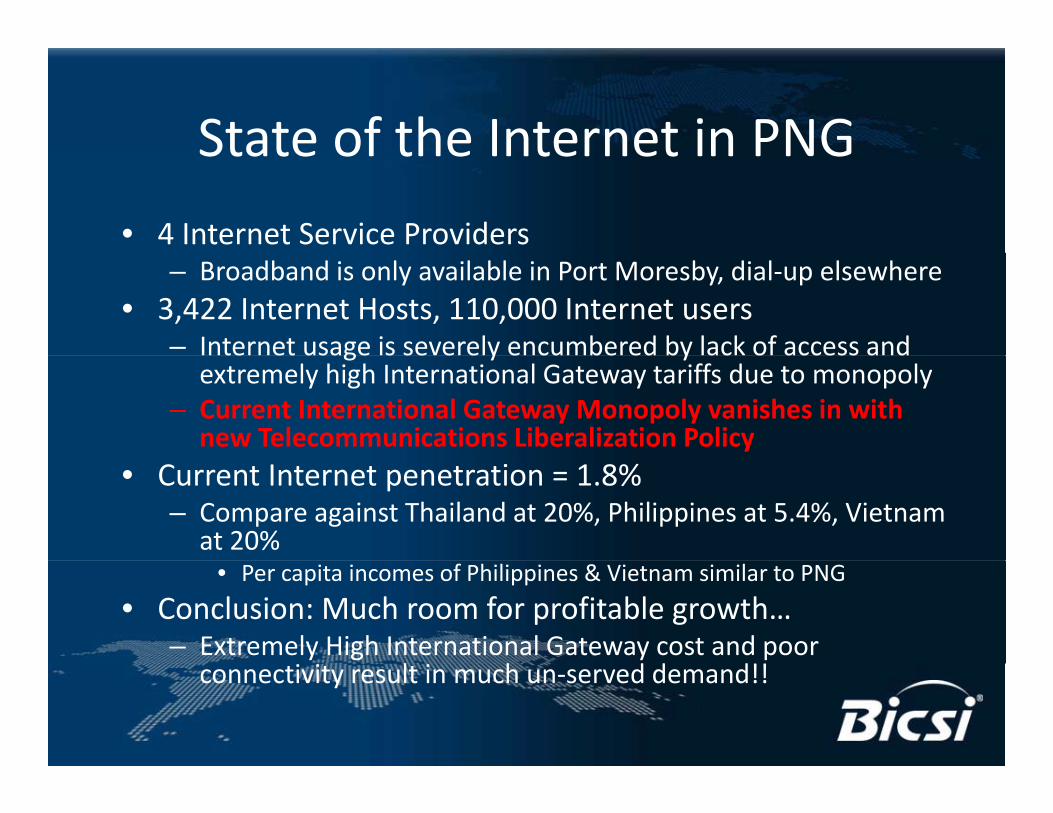
State of the Internet in PNGState of the Internet in PNG
• 4 Internet Service Providers– Broadband is only available in Port Moresby, dial‐up elsewhere
• 3,422 Internet Hosts, 110,000 Internet users– Internet usage is severely encumbered by lack of access and te et usage s se e e y e cu be ed by ac o access a d
extremely high International Gateway tariffs due to monopoly– Current International Gateway Monopoly vanishes in with
new Telecommunications Liberalization Policy• Current Internet penetration = 1.8%
– Compare against Thailand at 20%, Philippines at 5.4%, Vietnam at 20%
• Per capita incomes of Philippines & Vietnam similar to PNG
• Conclusion: Much room for profitable growth…– Extremely High International Gateway cost and poor
connectivity result in much un‐served demand!!
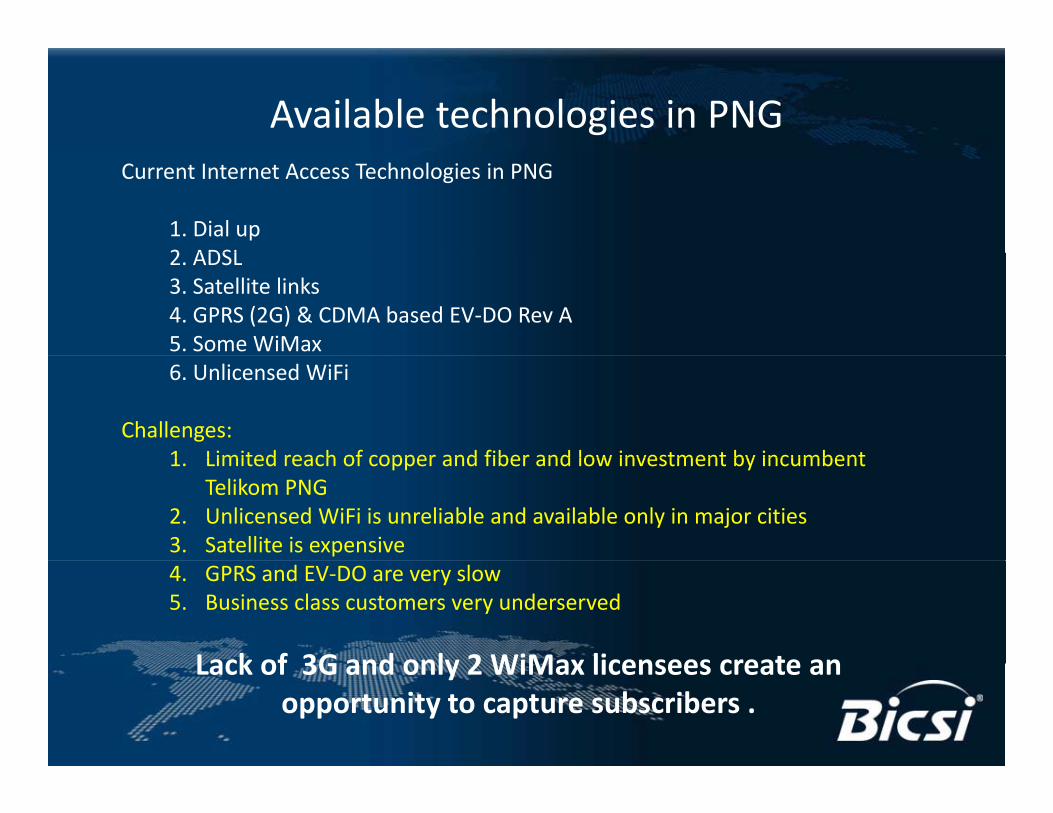
Available technologies in PNGCurrent Internet Access Technologies in PNG
1. Dial up2 ADSL2. ADSL3. Satellite links4. GPRS (2G) & CDMA based EV‐DO Rev A5. Some WiMax6. Unlicensed WiFi
Challenges:1 Limited reach of copper and fiber and low investment by incumbent1. Limited reach of copper and fiber and low investment by incumbent
Telikom PNG2. Unlicensed WiFi is unreliable and available only in major cities3. Satellite is expensive4. GPRS and EV‐DO are very slow5. Business class customers very underserved
Lack of 3G and only 2 WiMax licensees create anLack of 3G and only 2 WiMax licensees create an opportunity to capture subscribers .

Four incumbent ISPs in PNGFour incumbent ISPs in PNG• Daltron
b &– Present in Port Moresby & Lae• Limited broadband & dial‐up in Port Moresby, dial‐up only in Lae
– Some WiFi point‐to‐point for businesses• Datec
– Present in Port Moresby & Lae• Telikom
– Existing monopoly on International Gateway – will go awayLi it d DSL d t i f t t i P t M b– Limited DSL due to poor copper infrastructure in Port Moresby
– Rolling out WiMax• Pacific Internet
– Dial‐up onlyDial up only– Present in Port Moresby
• Conclusion – Most ISPs focus on Port Moresby only and neglect the rest of the country

Incumbent Pricing ModelsIncumbent Pricing Models• All similar and is among the most expensiveinternet access in the world in terms of price
• Current pricing models render access out of reach for most people and seriously hinders penetration.– Typical subscriber access costs are K 100 monthly for a dial‐up connection limited to 100 million bytes.bytes.
– Charges per megabyte for users exceeding this cap; average is S$0.10!!
32

PNG Population DistributionPNG Population Distribution

WHYWiMAX‐ ?WHY WiMAX‐ ?

Wireless Technologies are evolving to meet h bil db d d dthe Mobile Broadband demand
EDGEDL 474 kb
EvolvedEDGE
2008 2009 2010 2012 20132011
GE
DL : 474 kbpsUL : 474 kbps
EDGEDL : 1.89 MbpsUL : 947 kbps
HSPADL : 14.4 MbpsUL : 5.76 Mbps
In 5 MHz
Rel 7 HSPA +DL : 28 MbpsUL : 11.5 Mbps
In 5 MHz
Rel 8 HSPA +DL : 42 MbpsUL : 11.5 Mbps
In 5 MHz
E DG
H SPA
Rel 9 HSPA +DL : 84 MbpsUL : 23 MbpsIn 10 MHz
LTE
EV ‐DO Rev A EV ‐DO Rev B
LTE (Rel 9)L T
E000
LTE Advanced
Fixed WiMax
EV DO Rev ADL : 3.1 MbpsUL : 1.8 MbpsIn 1.25 MHz
EV DO Rev BDL : 14.7 MbpsUL : 4.9 MbpsIn 5 MHzC
DMA20
Fixed
WiMAX
Fixed WiMax
Release 1.0DL : 46 MbpsUL : 4 Mbps
10 MHz 3:1 TDD Rel 1.5 IEEE 802 .16m
F WMob
ileWiMAX
Throughput rates are peak theoretical network rates at Radio channel bandwidths indicatedDates refer to expected initial commercial network deployment except 2008, which shows available technologies that year
. . .
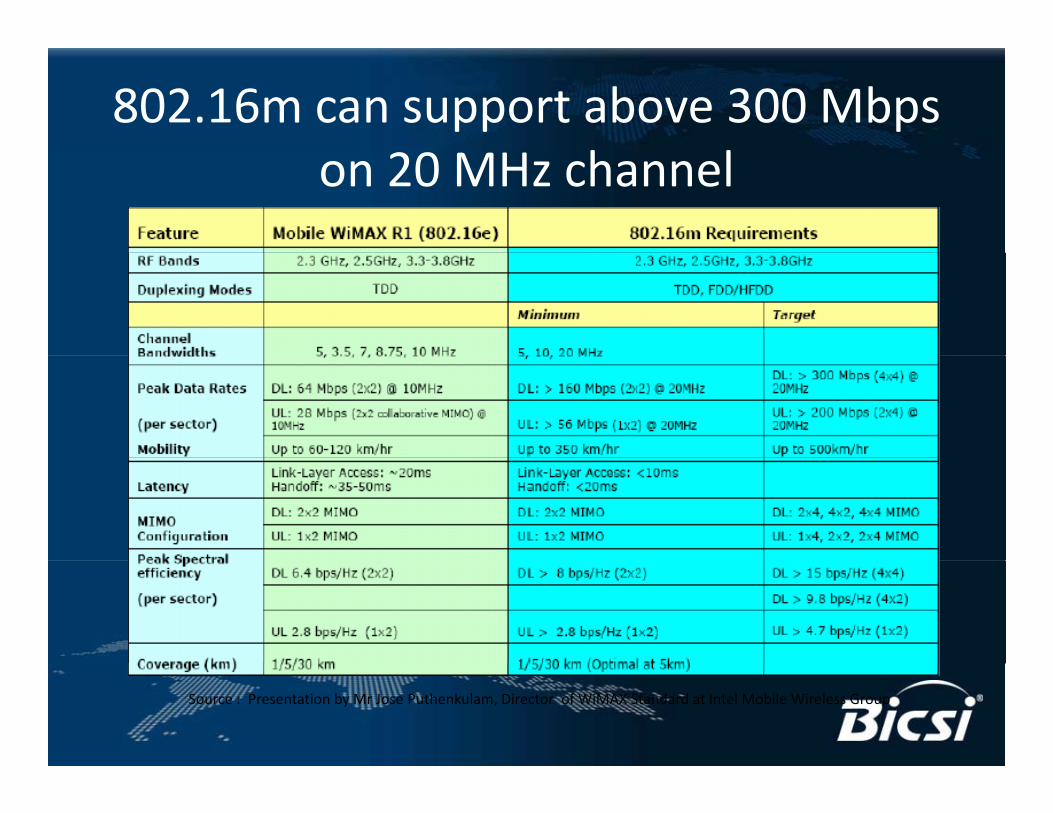
802.16m can support above 300 Mbps h lon 20 MHz channel
Source : Presentation by Mr Jose Puthenkulam, Director of WiMAX Standard at Intel Mobile Wireless Group

WiMAX is appropriate solution for next 3‐5 years;Mi ti t LTE if i d ld b iblMigration to LTE, if required, would be possible
LTE is still in its infancy; Commercially stability should be expected by mid 2012.As any technology takes atleast 2‐3 years for being commercially available given the priceAs any technology takes atleast 2‐3 years for being commercially available given the price sensitivity for mass adoption, WiMAX has a clear 3‐5 year time advantage over LTE.
WiMAX is likely to remain an attractive platform
•With 16m (Release 2.0) of WiMAX reporting 2x of spectral efficiency of Release 1.5, WiMAX will be ahead of the current LTE prototypes/ versions
•Transition of WiMAX Release 1.5 (16e) to WiMAX Release 2.0 (16m) will be smoother and more cost effective, as it is backward compatiblewith Releases 1 0 and Release 1 5 and has lowerwith Releases 1.0 and Release 1.5, and has lower incremental investment in RAN as it utilizes the same Edge and Core network.

Global Growth of WiMax
502 Deployments in 141 Countries(1) POPs Coverage(1)
600
500484
500
400
300 260
200
100
110141
004/2008 06/2009
DeploymentsC t iCountries
Global WiMax subscriptions are expected to grow from 3.9 million today to 92.3 million in 2015(2)
Bulk of the growth is expected to be in regions which have a large mobile market and low broadband t ti ( I di Chi CEEC) idi h t ti l f bil WiM i
Global WiMax subscriptions are expected to grow from 3.9 million today to 92.3 million in 2015(2)
Bulk of the growth is expected to be in regions which have a large mobile market and low broadband t ti ( I di Chi CEEC) idi h t ti l f bil WiM i
Source: (1) WiMAX Forum, (2) Yankee Group
penetration (e.g. India, China, CEEC) – providing huge potential for mobile WiMax servicespenetration (e.g. India, China, CEEC) – providing huge potential for mobile WiMax services

WiMAX Deployments

WiMAX Evolution Roadmap• Operates in scalable channel bandwidths from 5 to 20 MHz, unlike 3G which operates in multiples of
5*2 MHz
• Supports the best in class security features through mutual device/ user authentication, flexible key management protocol strong traffic encryption and security protocol optimizations for fastmanagement protocol, strong traffic encryption and security protocol optimizations for fast handovers.
• Lower network OPEX as compared with circuit switched 2G & 3G networks
Mobility
Cellular
Mobility High Quality Voice
InternetAccess
CellularQ yLow speed data
Fixed “Medium” Quality voice
High speed data WiMax
WiMax
FixedPSTN
ccess
Mobility with voice & High Speed Data
High speed data
Fixed High Quality voice
Nomadic with Voice & High Speed Data
Current
WiMax
Current
2008 2009 2010 2011

WiMAX has Time to Market AdvantageWiMAX has Time to Market Advantage
PNG BUSINESS PLANPNG BUSINESS PLAN

Rollout ApproachRollout ApproachRoll‐outs in cities are planned as gradual rollout that
•First creates selective coverage and then evolves to higher level coverage and services. •The evolution from pocketed coverage to ubiquitous coverage would be partially demand driven. •This principle is reflected in the way the network coverage has been designed
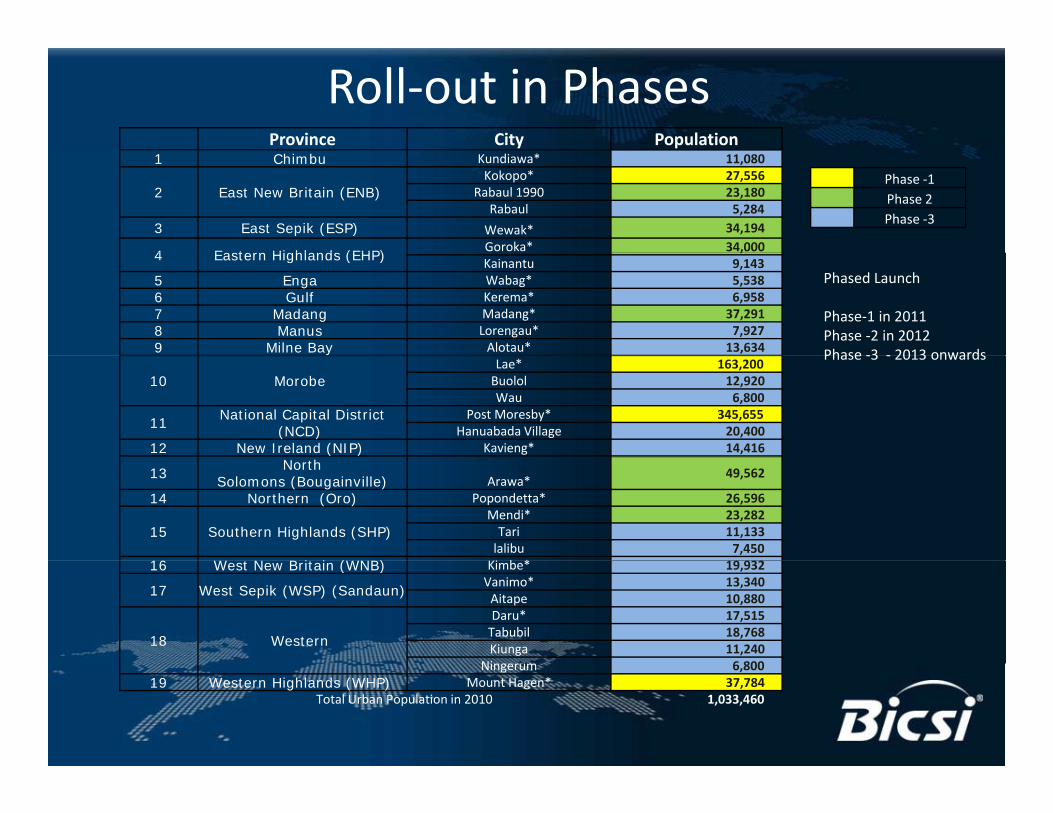
Roll‐out in PhasesProvince City Population
1 Chimbu Kundiawa* 11,080
2 East New Britain (ENB)Kokopo* 27,556
Rabaul 1990 23,180 Rabaul 5,284
3 East Sepik (ESP) Wewak* 34,194
4 Eastern Highlands (EHP)Goroka* 34,000
Phase ‐1Phase 2Phase ‐3
4 Eastern Highlands (EHP),
Kainantu 9,143 5 Enga Wabag* 5,538 6 Gulf Kerema* 6,958 7 Madang Madang* 37,291 8 Manus Lorengau* 7,927 9 Milne Bay Alotau* 13,634
Phased Launch
Phase‐1 in 2011Phase ‐2 in 2012Phase ‐3 ‐ 2013 onwards
10 MorobeLae* 163,200 Buolol 12,920 Wau 6,800
11 National Capital District (NCD)
Post Moresby* 345,655 Hanuabada Village 20,400
12 New Ireland (NIP) Kavieng* 14,416
Phase ‐3 ‐ 2013 onwards
13 North Solomons (Bougainville) Arawa*
49,562
14 Northern (Oro) Popondetta* 26,596
15 Southern Highlands (SHP)Mendi* 23,282 Tari 11,133 lalibu 7,450
16 W t N B it i (WNB) i b *16 West New Britain (WNB) Kimbe* 19,932
17 West Sepik (WSP) (Sandaun)Vanimo* 13,340 Aitape 10,880
18 Western
Daru* 17,515 Tabubil 18,768 Kiunga 11,240
Ni 6 800Ningerum 6,800 19 Western Highlands (WHP) Mount Hagen* 37,784
Total Urban Population in 2010 1,033,460
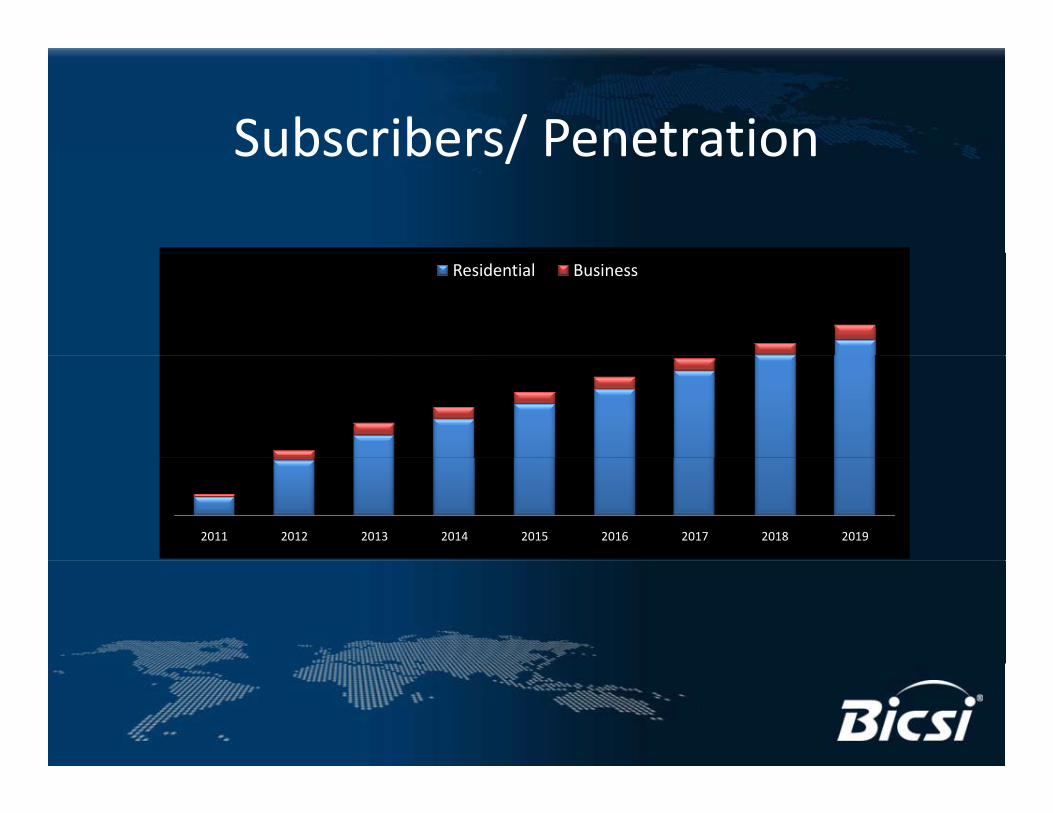
Subscribers/ PenetrationSubscribers/ Penetration
Residential Business
2011 2012 2013 2014 2015 2016 2017 2018 2019

Base StationsBase Stations
2010 2011 2012 2013 2014 2015 2016 2017 2018 20192010 2011 2012 2013 2014 2015 2016 2017 2018 2019

Questions??