willis aerospace · 4 willis aerospace aviation products market review 2011 for the aviation...
TRANSCRIPT

WILLIS AEROSPACEAVIATION PRODUCTS MARkET REVIEW 2011

3 WILLIS AEROSPACE AVIATION PRODUCTS MARkeT ReVIew 2010
Munich Re |
Solvency II and Aviation Risks – An O
verview
AIR
BUS (an EA
DS Com
pany) |R
unway Excursion at Landing
BAR
LOW
LyD
E & g
ILBERT |Forum
Shopping and FNC
in International Aviation Disputes
WILLIS AEROSPACEAVIATION PRODUCTS MARkET REVIEW 2011Executive Summary 2
Introduction 6
Aviation Industry Review 8
Special Article | Airbus (an EADS company)
Aviation Market Analysis & Capacity 12
Special Article | Munich Re
Market Segment Analysis 16
Index Premium and Loss Development 26
Special Article | Barlow Lyde & Gilbert
Forecast for 2011 30
Clients Before Contingents 34

WILLIS AEROSPACE AVIATION PRODUCTS MARkeT ReVIew 2011 1

EXEC
UTIV
E SU
MM
ARY

Dear Clients/Buyers
Further to our Special Bulletin in February 2011, The Global Aerospace Practice of Willis Aerospace is pleased to present you with our 8th Aviation Products Market Review which remains the only review totally focused on the aerospace manufacturing industry.
Within this years review, we have tried to offer you not only aviation insurance market commentary but importantly, to highlight and debate some of the current (and future issues), you as Clients/Buyers do or will face.
In this respect, we are pleased to advise that we have special articles from:
— Airbus (an EADS company) – Explaining how leading edge technology can help reduce the No.1 source of claims for the aviation industry
— Munich Re – Providing an overview of the forthcoming Solvency II requirements and its possible implications for aviation risks
— Barlow Lyde & Gilbert – Giles Kavanagh and team highlighting some of the issues of “forum shopping” by plaintiffs and “forum non conveniens” trends in the USA
Coming back to 2010, we have seen the world economy continue to seek stronger foundations for economic growth.
Initial signs of an economic recovery in the year faded, especially as debt levels in several European economies sent tremors through the global markets.
The insurance marketplace remained static, despite an onslaught of catastrophe – from Haiti to Chile and from the Gulf of Mexico to Queensland, Australia – which brought not only significant losses but also human suffering on a staggering scale.
The plentiful supply of capital seeking a return combined with the stagnant demands of an uncertain economy is likely to prolong the long standing soft market and put pressure on global premium incomes.
Surprisingly, 2010 saw some of our peers begin taking contingent commissions again in retail brokerage, Willis said “no”.
Willis said “no” back in 2004, when the issue first rose to prominence, and we said “no” again in 2010 because contingents represent a fundamental conflict of interest and go against our promise to serve our clients above all else.
We even launched a campaign – Clients Before Contingents – to remind risk managers and others of the conflicts that cast a shadow on our industry. Willis stood up for what was right even though we stood – and still stand – alone.
WILLIS AEROSPACE AVIATION PRODUCTS MARkeT ReVIew 2011 3

4 WILLIS AEROSPACE AVIATION PRODUCTS MARkeT ReVIew 2011
For the aviation industry, 2010 was again a year of mixed fortunes.
As a positive for the airline sector, global airline passenger numbers rose by 7.63% to 2.72 billion whereas aircraft deliveries again reduced, by 13.24% (with helicopter deliveries being the worst affected). Passenger growth did not, however, occur unilaterally across the world and was most prominent in Asia.
Asia has long been associated with growth in aviation transportation and when we analyse the number of aircraft deliveries over the last 10 years, it is clear to see why:
2000 2001 2002 2003 2004 2005 2006 2007 2008 20102009
Asia Australasia Europe NAm ME SAm/Carib Africa
0
100
200
300
400
500
600
700
Annu
al U
nit D
eliv
erie
s
During 2010, we saw an increased number of aircraft total losses (46) and an unwelcome increase in passenger fatalities (648) although the underlying trend for passenger fatalities still remained lower than in previous decades.
Aviation Insurers also had mixed fortunes, although they did still manage to generate a profit/premium credit balance for 2010.
The airline sector achieved a slight increase in premium volume (4.5%) which unfortunately, due to claims activity, was not sufficient to show a positive return for Insurers (2010 being the 4th consecutive year of negative premium returns).
The aerospace sector, however, showed total premium reductions of 2.84% with the aerospace companies within the Wilis Index receiving a total 2.10% decrease but still generating a healthy profit/premium credit balance.
It would therefore appear that those Insurers who participate on both aerospace and airline risks now have a balanced, but imbalanced, portfolio of business.
34%
66%
31%
69%
20%
80%
34%
66%54% 46%
20%
80%
ANNUAl UNIT DelIVeRIeS by OPeRATOR AReA
10 yeAR COMbINeD AeROSPACe/ AIRlINe PReMIUM CReDIT bAlANCe ShARe/CONTRIbUTIONS
From 2010, we looked backwards to generate a market performance indicator.
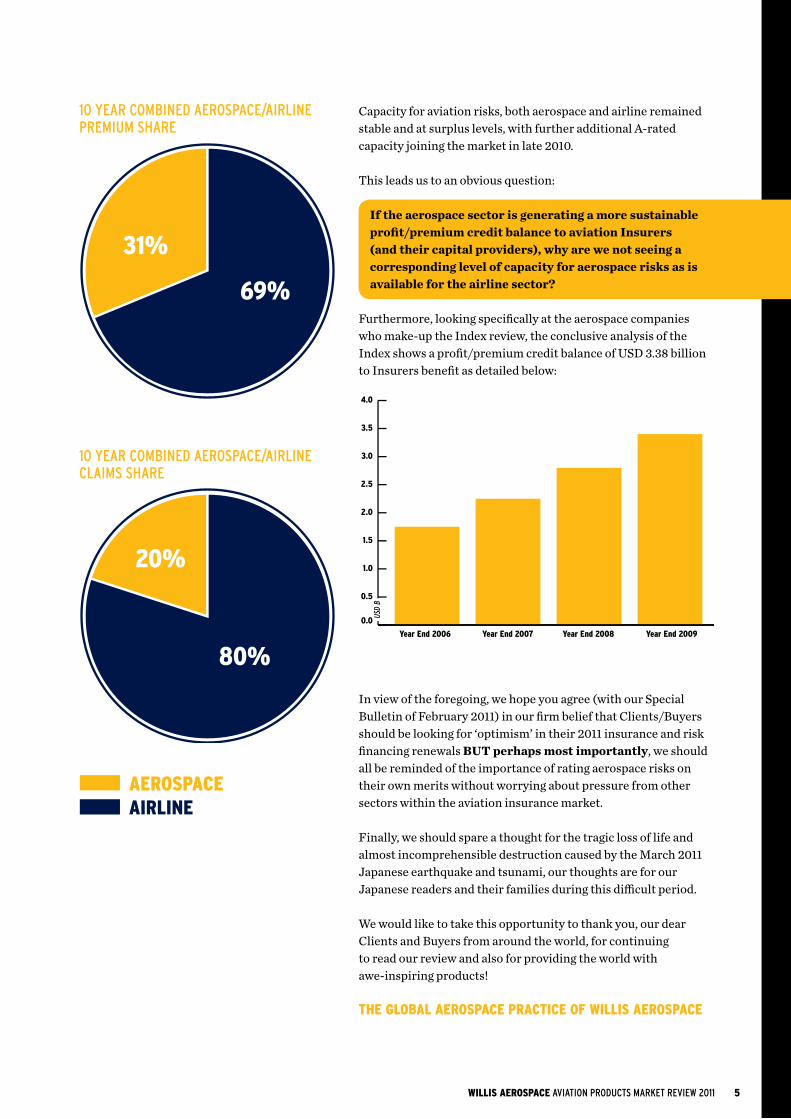
This analysis showed that during the last 10 years, the combined aerospace/airline market has generated over USD 10 billion of profit/premium credit, however, there are some interesting dynamics to which we would like to draw your attention:
— the aerospace sector has generated 31% of aviation market premium (combined airline and aerospace sectors) in the last 10 years, BUT
— the aerospace sector produced only 20% of claims over the same period which could suggest there is still an ‘imbalance’ between the airline and aerospace sectors
— it could be argued by some Insurers that the airline sector generated more income over the last 10 years which does go some way to justifying this ‘imbalance’, however
— understanding that Insurers are in the risk transfer business and need to generate a profit margin to their capital providers, we asked ourselves the question: over the last 10 years, which sector has generated more profit/premium credit balance to Insurers, airline or aerospace?
The aerospace sector has generated 31% of aviation market premium but only 20% of market claims, however, it contributed 54% of the aviation markets USD 10 billion profit/premium credit balance over 10 years.
WILLIS AEROSPACE AVIATION PRODUCTS MARkeT ReVIew 2011 5
34%
66%
31%
69%
20%
80%
34%
66%54% 46%
20%
80%
34%
66%
31%
69%
20%
80%
34%
66%54% 46%
20%
80%
10 yeAR COMbINeD AeROSPACe/AIRlINe PReMIUM ShARe
10 yeAR COMbINeD AeROSPACe/AIRlINe ClAIMS ShARe
In view of the foregoing, we hope you agree (with our Special Bulletin of February 2011) in our firm belief that Clients/Buyers should be looking for ‘optimism’ in their 2011 insurance and risk financing renewals BUT perhaps most importantly, we should all be reminded of the importance of rating aerospace risks on their own merits without worrying about pressure from other sectors within the aviation insurance market.
Finally, we should spare a thought for the tragic loss of life and almost incomprehensible destruction caused by the March 2011 Japanese earthquake and tsunami, our thoughts are for our Japanese readers and their families during this difficult period.
We would like to take this opportunity to thank you, our dear Clients and Buyers from around the world, for continuing to read our review and also for providing the world with awe-inspiring products!
ThE gLOBAL AEROSPACE PRACTICE Of WILLIS AEROSPACE
GreenYear
‘Developing’ 7 Years
0
100
200
300
400
500
600
2000 20082001 2002 2003 2004 2005 2006 2007 2009
Mature Years
USD
M
-300
-250
-200
-150
-100
-50
0
50
USD
M
USD +5.58 million2000 Mature Year Comparison As at end 2009As at end 2010 Change USD +5.58 million
USD -272.88 millionIndex 8-Year Fluid Tracker:As at end 2009 = 2002-2008 vsAs at end 2010= 2003-2009 Change USD -272.88 million
Index 8-Year Fluid Tracker
0
50
100
150
200
Perc
enta
ge
Loss Ratio
0.0
0.5
1.0
1.5
2.0
2.5
3.0
3.5
4.0
Year End 2006 Year End 2007 Year End 2008 Year End 2009
USD
B
AEROSPACEAIRLINE
Capacity for aviation risks, both aerospace and airline remained stable and at surplus levels, with further additional A-rated capacity joining the market in late 2010.
This leads us to an obvious question:
If the aerospace sector is generating a more sustainable profit/premium credit balance to aviation Insurers (and their capital providers), why are we not seeing a corresponding level of capacity for aerospace risks as is available for the airline sector?
Furthermore, looking specifically at the aerospace companies who make-up the Index review, the conclusive analysis of the Index shows a profit/premium credit balance of USD 3.38 billion to Insurers benefit as detailed below:

InTR
odUC
TIon

WILLIS AEROSPACE AVIATION PRODUCTS MARkeT ReVIew 2011 7
For this 2011 edition, we have maintained the core principles of providing a comprehensive 10 year review of the individual business sectors within the aviation manufacturers portfolio, again utilising our market leading analysis tool, The Index.
In addition, we have further enhanced our review of the aviation products market and included some topics which we feel would be of mutual interest and benefit to you as aviation manufacturers. Consequently, Willis Aerospace is pleased to welcome articles from Airbus, Munch Re and Barlow Lyde & Gilbert – all markets leaders in their respected fields. In summary, the subjects in our review are:
AN AVIATION INDUSTRy REVIEWAn analysis of aircraft deliveries, number of incidents/fatalities versus passenger/fleet growth and an overview of how the aircraft manufacturing industry is responding (or dealing with) the lingering effects of the global downturn.
RUNWAy ExCURSION AT LANDINg, ThE NO. 1 SOURCE Of CLAIMS fOR ThE AVIATION INDUSTRy Following on from the industry review, Airbus have kindly provided an article highlighting the largest cause of aircraft incidents and how innovative avionics can reduce this risk.
AVIATION MARkET ANALySIS/CAPACITyAn appraisal of the overall aviation insurance market coupled with analysis of capacity availability levels for aviation products liability risks.
SOLVENCy II AND AVIATION RISkS, AN OVERVIEWWe are again pleased to have an article from Munich Re in respect of the forthcoming Solvency II requirements and its possible implications for aviation risks.
MARkET SEgMENT ANALySISOur core 10 year review of the individual manufacturing sectors and their performance both in terms of premium movement and sales development patterns.
INDEx PREMIUM AND LOSS DEVELOPMENTAssessment of manufacturer loss development including our Tracker and how the profit/premium credit balance continues to accumulate.
fORUM ShOPPINg AND fNC’S IN INTERNATIONAL AVIATION DISPUTESBarlow Lyde & Gilbert have kindly written an article regarding the topics “forum shopping” by plaintiffs and “forum non conveniens” trends in the USA – both of which have unfortunate consequences on the global industry.
fORECAST fOR 2011Our outlook for 2011 of the aviation products insurance market and why clients/buyers of aviation products insurance should be optimistic.

AVIA
TIon
IndU
STRY
REV
IEw
WILLIS AEROSPACE AVIATION PRODUCTS MARkeT ReVIew 2011 9
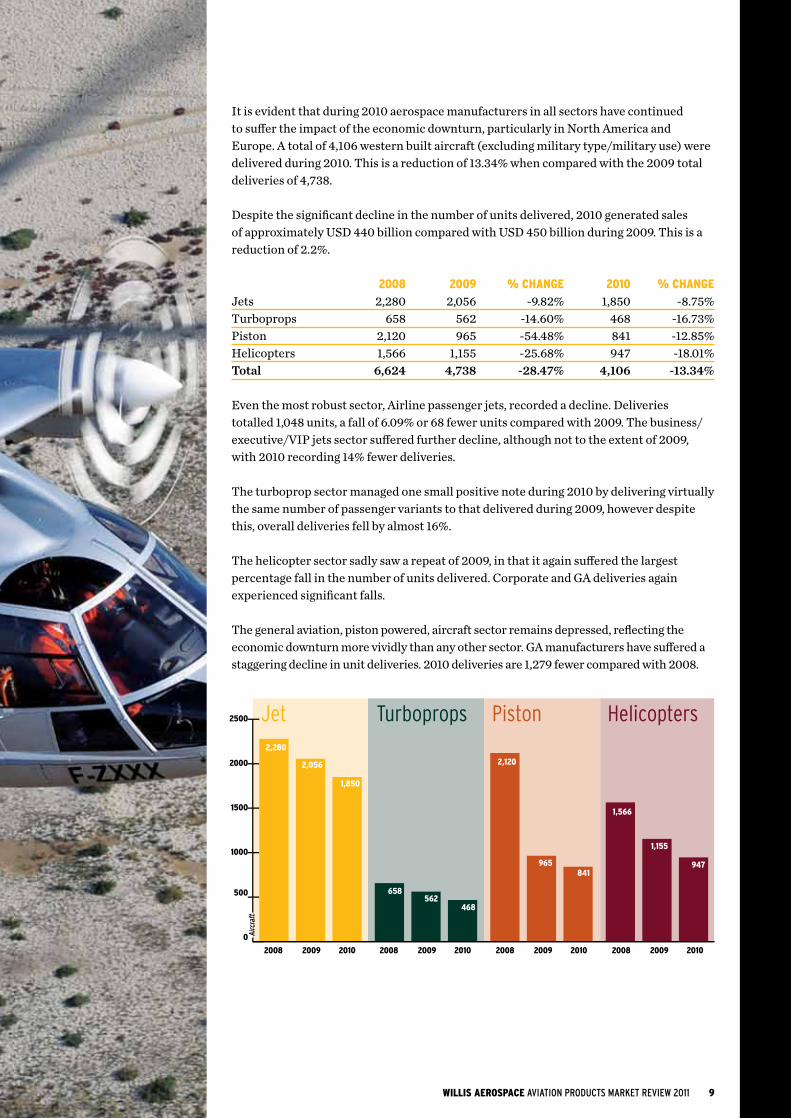
It is evident that during 2010 aerospace manufacturers in all sectors have continued to suffer the impact of the economic downturn, particularly in North America and Europe. A total of 4,106 western built aircraft (excluding military type/military use) were delivered during 2010. This is a reduction of 13.34% when compared with the 2009 total deliveries of 4,738.
Despite the significant decline in the number of units delivered, 2010 generated sales of approximately USD 440 billion compared with USD 450 billion during 2009. This is a reduction of 2.2%. 2008 2009 % ChANgE 2010 % ChANgEJets 2,280 2,056 -9.82% 1,850 -8.75%Turboprops 658 562 -14.60% 468 -16.73%Piston 2,120 965 -54.48% 841 -12.85%Helicopters 1,566 1,155 -25.68% 947 -18.01%Total 6,624 4,738 -28.47% 4,106 -13.34%
Even the most robust sector, Airline passenger jets, recorded a decline. Deliveries totalled 1,048 units, a fall of 6.09% or 68 fewer units compared with 2009. The business/ executive/VIP jets sector suffered further decline, although not to the extent of 2009, with 2010 recording 14% fewer deliveries.
The turboprop sector managed one small positive note during 2010 by delivering virtually the same number of passenger variants to that delivered during 2009, however despite this, overall deliveries fell by almost 16%.
The helicopter sector sadly saw a repeat of 2009, in that it again suffered the largest percentage fall in the number of units delivered. Corporate and GA deliveries again experienced significant falls.
The general aviation, piston powered, aircraft sector remains depressed, reflecting the economic downturn more vividly than any other sector. GA manufacturers have suffered a staggering decline in unit deliveries. 2010 deliveries are 1,279 fewer compared with 2008.
0
500
1000
1500
2000
2500
Airc
raft
2008
2,280
2,056
658562
2,120
965
1,566
1,155
1,850
468
841947
2009 2008 2009 2008 2009 2008 20092010 2010 2010 2010
Jet Turboprops Piston Helicopters

10 WILLIS AEROSPACE AVIATION PRODUCTS MARkeT ReVIew 2011
Jet aircraft retirements during 2010 totalled 410 compared with 487 in 2009, the majority of which, 77%, were of passenger aircraft. This is a similar percentage to that of 2009 at 78%.
Considerably fewer turboprop aircraft retirements occurred during 2010, 91 compared to 164 recorded during 2009. Total stored aircraft jet and turboprop totalled 5,970. This is a small increase of 0.73% compared with 2009.
With slightly fewer commercial aircraft retirements and the fact that global passenger numbers increased during 2010, it is just possible to consider that 2011 may see the ‘bottoming out’ of the economic downturn with regard to manufacturers, however, recovery is very fragile and geographically uneven.
The general aviation sector, as mentioned, has experienced horrific decline in unit deliveries, however, recent acquisitions made by Chinese interests in this sector offer tremendous future prospects particularly in emerging markets.
The business/executive/VIP sector after two very tough years is increasingly upbeat based again on the positive prospects offered by emerging markets.
The increase in airline passenger and landing numbers during 2010 indicate that economic recovery is underway, however it is not geographically even. The Asia/Pacific, South American and Middle Eastern regions all recorded significant growth, Europe recorded growth but suffered the effects the volcanic ash cloud as well as a particularly severe winter. North America achieved modest growth but passenger numbers remain below pre- economic downturn levels.
gROWTh 2009 2010 % +/-Passengers 2.52b 2.72b +7.63%Aircraft units 24,690 25,254 +2.28%Landings 33,915m 35,621m +5.03%
2000 2001 2002 2003 2004 2005 2006 2007 2008 20102009
Asia Australasia Europe NAm ME SAm/Carib Africa
0
100
200
300
400
500
600
700
Annu
al U
nit D
eliv
erie
s
ANNUAl UNIT DelIVeRIeS by OPeRATOR AReA

0
5,000
10,000
15,000
20,000
25,000
Flee
t
1994 1995 1996 1997 1998 1999 2000 2001 2002 2003 2004 2005 2006 2007 2008 20102009
0
500
1,000
1,500
2,000
2,500
3,000
Pax
Mill
ion
1994
2001 20092002 2003 2004 2005 2006 2007 2008 2010
1995 1996 1997 1998 1999 2000 2001 2002 2003 2004 2005 2006 2007 2008 20102009
Pax LandingsPax Fatal Pax Fatal Trend
0
10
20
30
40To
tal L
osse
s
0.10
0.20
0.30
0.40
0.50
0.60
0.50
0.75
1.00
1.25
1.50
1.75
2.00
Pax
fata
lity
per P
ax M
illio
n
fIVE yEAR ROLLINg AVERAgE VALUES (AS AT yEAR END 2010)
FleeT gROwTh/TOTAl lOSS AS PeRCeNTAge OF FleeT
0
5,000
10,000
15,000
20,000
25,000
Flee
t
1994 1995 1996 1997 1998 1999 2000 2001 2002 2003 2004 2005 2006 2007 2008 20102009
0
500
1,000
1,500
2,000
2,500
3,000
Pax
Mill
ion
1994
2001 20092002 2003 2004 2005 2006 2007 2008 2010
1995 1996 1997 1998 1999 2000 2001 2002 2003 2004 2005 2006 2007 2008 20102009
Pax LandingsPax Fatal Pax Fatal Trend
0
10
20
30
40
Tota
l Los
ses
0.10
0.20
0.30
0.40
0.50
0.60
0.50
0.75
1.00
1.25
1.50
1.75
2.00
Pax
fata
lity
per P
ax M
illio
n
PAx gROwTh/PAx FATAlITy PeR MIllION PAx
During 2010 there were 46 recorded total losses of western built aircraft in airline service (operational and non-operational). This is a significant increase compared with 2009 (36).
This has caused the five year average total loss number to rise to 0.1914% up from 0.1902% last year. 2010 also saw an unwelcome rise in the number of passenger fatalities, 648 compared with 453 during 2009. However the five year average fatality per million passengers has fallen by 8.12% to 0.2128.
The results of 2010 do however demonstrate the continued excellent safety record of air travel and the continued underlying operational improvement achieved.

AVIA
TIon
MAR
kET
AnAl
YSIS
And
CAp
ACIT
Y
WILLIS AEROSPACE AVIATION PRODUCTS MARkeT ReVIew 2011 13
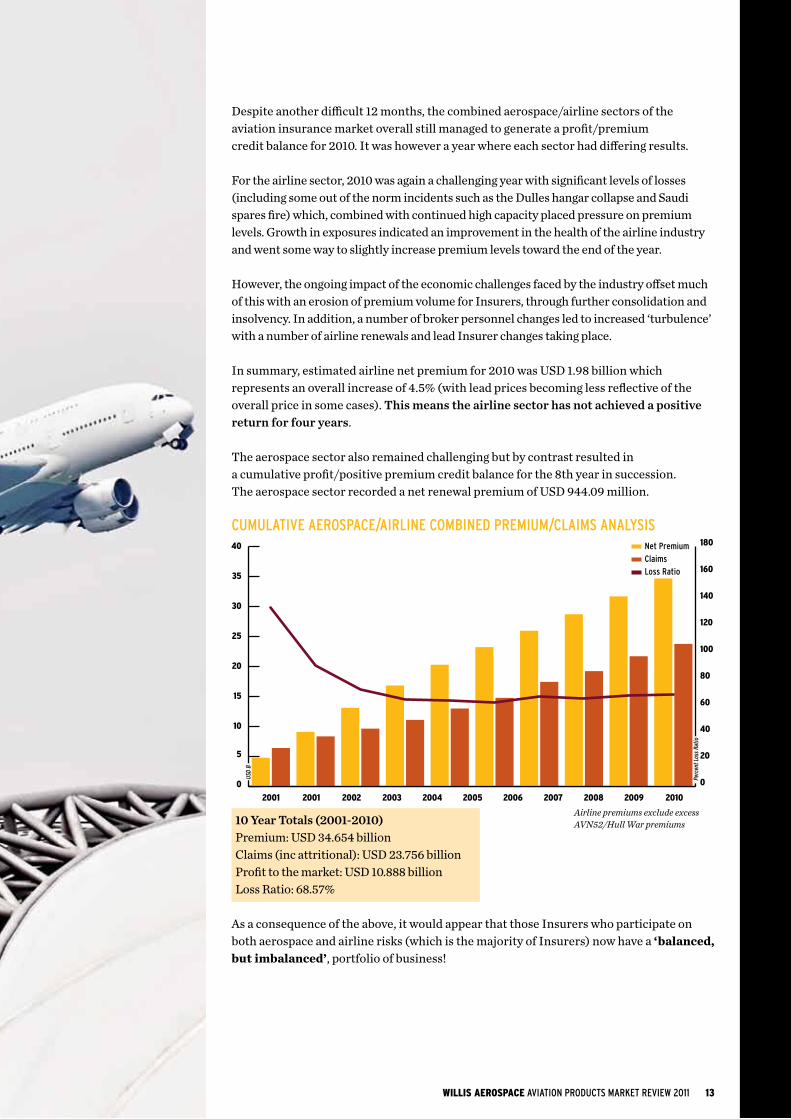
Despite another difficult 12 months, the combined aerospace/airline sectors of the aviation insurance market overall still managed to generate a profit/premium credit balance for 2010. It was however a year where each sector had differing results.
For the airline sector, 2010 was again a challenging year with significant levels of losses (including some out of the norm incidents such as the Dulles hangar collapse and Saudi spares fire) which, combined with continued high capacity placed pressure on premium levels. Growth in exposures indicated an improvement in the health of the airline industry and went some way to slightly increase premium levels toward the end of the year.
However, the ongoing impact of the economic challenges faced by the industry offset much of this with an erosion of premium volume for Insurers, through further consolidation and insolvency. In addition, a number of broker personnel changes led to increased ‘turbulence’ with a number of airline renewals and lead Insurer changes taking place.
In summary, estimated airline net premium for 2010 was USD 1.98 billion which represents an overall increase of 4.5% (with lead prices becoming less reflective of the overall price in some cases). This means the airline sector has not achieved a positive return for four years.
The aerospace sector also remained challenging but by contrast resulted in a cumulative profit/positive premium credit balance for the 8th year in succession. The aerospace sector recorded a net renewal premium of USD 944.09 million.
CUMUlATIVe AeROSPACe/AIRlINe COMbINeD PReMIUM/ClAIMS ANAlySIS
10 Year Totals (2001-2010)Premium: USD 34.654 billionClaims (inc attritional): USD 23.756 billionProfit to the market: USD 10.888 billionLoss Ratio: 68.57%
As a consequence of the above, it would appear that those Insurers who participate on both aerospace and airline risks (which is the majority of Insurers) now have a ‘balanced, but imbalanced’, portfolio of business!
Airline premiums exclude excess AVN52/Hull War premiums
0
5
10
15
20
25
30
35
40 Net Premium
Claims
Loss Ratio
2001 2001 20092002 2003 2004 2005 2006 2007 2008 2010
USD
B
0
20
40
60
80
100
120
140
160
180
Perc
ent L
oss
Ratio
14 WILLIS AEROSPACE AVIATION PRODUCTS MARkeT ReVIew 2011
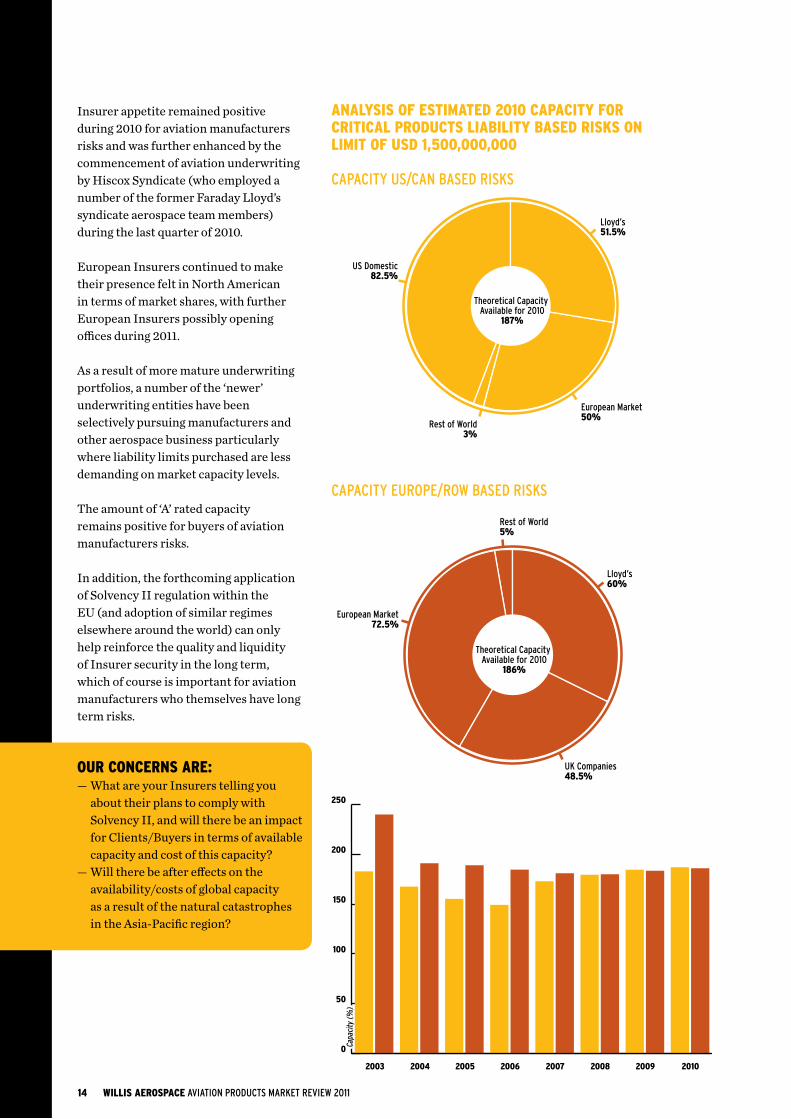
Insurer appetite remained positive during 2010 for aviation manufacturers risks and was further enhanced by the commencement of aviation underwriting by Hiscox Syndicate (who employed a number of the former Faraday Lloyd’s syndicate aerospace team members) during the last quarter of 2010.
European Insurers continued to make their presence felt in North American in terms of market shares, with further European Insurers possibly opening offices during 2011.
As a result of more mature underwriting portfolios, a number of the ‘newer’ underwriting entities have been selectively pursuing manufacturers and other aerospace business particularly where liability limits purchased are less demanding on market capacity levels.
The amount of ‘A’ rated capacity remains positive for buyers of aviation manufacturers risks.
In addition, the forthcoming application of Solvency II regulation within the EU (and adoption of similar regimes elsewhere around the world) can only help reinforce the quality and liquidity of Insurer security in the long term, which of course is important for aviation manufacturers who themselves have long term risks.
OUR CONCERNS ARE:— What are your Insurers telling you
about their plans to comply with Solvency II, and will there be an impact for Clients/Buyers in terms of available capacity and cost of this capacity?
— Will there be after effects on the availability/costs of global capacity as a result of the natural catastrophes in the Asia-Pacific region?
Lloyd’s60%
European Market72.5%
Rest of World5%
UK Companies48.5%
Lloyd’s51.5%
US Domestic82.5%
Rest of World3%
European Market50%
Theoretical Capacity Available for 2010
187%
Theoretical Capacity Available for 2010
186%
0
50
100
150
200
250
Capa
city
(%)
2003 2004 2005 2006 2007 2008 20102009
ANALySIS Of ESTIMATED 2010 CAPACITy fOR CRITICAL PRODUCTS LIABILITy BASED RISkS ON LIMIT Of USD 1,500,000,000
CAPACITy US/CAN bASeD RISkS
Lloyd’s60%
European Market72.5%
Rest of World5%
UK Companies48.5%
Lloyd’s51.5%
US Domestic82.5%
Rest of World3%
European Market50%
Theoretical Capacity Available for 2010
187%
Theoretical Capacity Available for 2010
186%
0
50
100
150
200
250
Capa
city
(%)
2003 2004 2005 2006 2007 2008 20102009
CAPACITy eUROPe/ROw bASeD RISkS
Lloyd’s60%
European Market72.5%
Rest of World5%
UK Companies48.5%
Lloyd’s51.5%
US Domestic82.5%
Rest of World3%
European Market50%
Theoretical Capacity Available for 2010
187%
Theoretical Capacity Available for 2010
186%
0
50
100
150
200
250
Capa
city
(%)
2003 2004 2005 2006 2007 2008 20102009

WILLIS AEROSPACE AVIATION PRODUCTS MARkeT ReVIew 2011 15
“ Insurers who participate on both aerospace and airline risks (which is the majority of Insurers) now have a ‘balanced, but imbalanced’, portfolio of business!”

MAR
kET
SEgM
EnT
AnAl
YSIS

WILLIS AEROSPACE AVIATION PRODUCTS MARkeT ReVIew 2011 17
We have continued to utilise the aerospace manufacturers who are listed within Flight International magazine’s ‘Top 100 Aerospace Companies*’ that insure and have insured in the London marketplace for at least the past five consecutive years.
We have also included other manufacturers/aerospace companies to create an analysis tool that we consider reflects the London markets’ position regarding manufacturers liability insurance.
This analysis tool is referred to as the ‘The Index’.
For the 2010 review, The Index analyses the renewal experience of 116 core Aerospace manufacturers and MRO Insured’s, (part of a total 197 Insured’s for whom we are able to review London market renewal experience information).
The Index is subdivided into six specific sectors, as detailed below, and we believe this provides a good indication of development patterns within the manufacturers’ arena.
— Prime Airframe Manufacturers
— Major Engine Manufacturers
— Sub-Airframe/Engine Manufacturers
— Component Manufacturers
— Electronic/Avionic
— Maintenance/Repair and Overhaul (MRO)
Premiums are all based on lead net terms (as far as known) and all premium and estimated sales figures shown are US dollars**.
Analysis and results based on The Index are subjective in that many Insured’s are able to fall into more than one sector due to the diverse nature of their aviation businesses.
* Sept 2010 Report. Based on sales for the year 2009.** All currencies converted to US Dollars as at applicable ROE @ January 2010.

18 WILLIS AEROSPACE AVIATION PRODUCTS MARkeT ReVIew 2011
ThE IndEX 2010Even though we seek to review the renewal experience of a consistent group of Insured’s, using Flight International magazine’s ‘Top 100 Aerospace Companies’* as our base, mergers and acquisitions within the aerospace industry have resulted in new entrants to that list. Some of these new entrants have been introduced into The Index for the first time in 2010. We have, however, continued to maintain our requirement that those Insured’s contained within The Index have renewed in the London marketplace for the past five consecutive years.
Consequently, 2009 has been adjusted to reflect ‘new Insureds’ to The Index and this has allowed us to provide an accurate comparison with 2010. The charts on this page identify the proportion of premium contributed by each of the main sectors within our review and also illustrates premium development history and annual quantum within each sector analysed.
For the individual sector analysis, the charts shown focus on each of our sectors since 2001 (i.e. a 10 year analysis is being maintained and will continue to be rolled forward on a 10 year basis for future reviews).
* Sept 2010 Report. Based on sales for the year 2009.
0
100
200
300
400
500
600
700
800
9002003
2004
2005
2006
2007
2008
20092010
Total Prime Airframe
EngineMajor
Component MRO Sub Airframe/Engine
Electronic/Avionic
USD
Mn
Prime Airframe61%
Engine Major16%
Component9%
MRO8%
Sub Airframe/Engine3%
Electronic/Avionic3%
wIllIS INDex ReNewAl NeT PReMIUM
0
100
200
300
400
500
600
700
800
9002003
2004
2005
2006
2007
2008
20092010
Total Prime Airframe
EngineMajor
Component MRO Sub Airframe/Engine
Electronic/Avionic
USD
Mn
Prime Airframe61%
Engine Major16%
Component9%
MRO8%
Sub Airframe/Engine3%
Electronic/Avionic3%
wIllIS INDex ReNewAl 2010 NeT PReMIUM SeCTOR ShARe

WILLIS AEROSPACE AVIATION PRODUCTS MARkeT ReVIew 2011 19
The recorded total premium for this sector was USD 412.93 million which equated to a reduction of 2.66% against 2009.
Sales estimates of USD 231.75 billion showed a decline of 4%. This is the second consecutive year of reduced sales and is slightly greater than the 3.8% decline recorded in last years review.
Actual unit deliveries by the prime manufacturers within our Index totalled 2,953* for 2010 which compared to the pre- economic downturn figure of 5,283, represents a significant reduction of 44%.
Despite a modest reduction in premium and the continued decline in projected sales/turnover, the derived rate on sales increased marginally by 1.40%.
Those Insured’s who previously utilised Self Insured Retentions (SIRs) continued this theme in 2010, where varying SIR amounts were employed in order to gain maximum benefit to the Insured (and Insurers).
The use of SIRs remains an attractive marketing strategy as they remove much of the sectors’ attritional losses, thus further contributing towards the increasing premium credit balance that is currently in Insurers favour.
It was also noted that a number of policies either renewed on a longer term basis or extended existing long term arrangements to 2012 and beyond.
* Ascend Air claims and GAMA excluding military/para-public deliveries.
Premium Development
Rate on Sales Development
0
100
200
300
400
500
600
USD
Mn
2001 20092002 2003 2004 2005 2006 2007 2008 2010
0.0
0.5
1.0
1.5
2.0
2.5
Dev.
Rat
io
2001 2001 20092002 2003 2004 2005 2006 2007 2008 2010
0
50
100
150
200
250
300
USD
Bn
2001 20092002 2003 2004 2005 2006 2007 2008 2010
ANNUAl NeT PReMIUM
pRIME AIRfRAME MAnUfACTURERS
Premium Development
Rate on Sales Development
0
100
200
300
400
500
600
USD
Mn
2001 20092002 2003 2004 2005 2006 2007 2008 2010
0.0
0.5
1.0
1.5
2.0
2.5
Dev.
Rat
io
2001 2001 20092002 2003 2004 2005 2006 2007 2008 2010
0
50
100
150
200
250
300
USD
Bn
2001 20092002 2003 2004 2005 2006 2007 2008 2010
DeVelOPMeNT RATIOS: NeT PReMIUM/RATe ON SAleS
Premium Development
Rate on Sales Development
0
100
200
300
400
500
600
USD
Mn
2001 20092002 2003 2004 2005 2006 2007 2008 2010
0.0
0.5
1.0
1.5
2.0
2.5
Dev.
Rat
io
2001 2001 20092002 2003 2004 2005 2006 2007 2008 2010
0
50
100
150
200
250
300
USD
Bn
2001 20092002 2003 2004 2005 2006 2007 2008 2010
eSTIMATeD ANNUAl SAleS

20 WILLIS AEROSPACE AVIATION PRODUCTS MARkeT ReVIew 2011
Projected sales of the major engine manufacturers for 2010 were USD 83.39 billion which equates to a reduction of USD 2.975 billion or 3.45% when compared to 2009. This is the second consecutive year of decline.
Despite this fall in projected sales, the sector did record an increase in premium by 1.11% to USD 107.57 million.
This premium increase was mainly due to deterioration on back years claims and in some cases, related to non-engine business units within the major engine manufacturers risk profile.
The derived premium rate on sales has consequently recorded an increase of 4.71%, the second consecutive year that this sectors’ derived rate has risen and it is again the largest rise of any sector within the Index.
As with aircraft prime manufacturers, Insureds in this sector:— Continued with the utilisation of Self
Insured Retentions (SIRs) which remained prevalent (around half of Insureds used them in 2010)
— Long term policy risk financing strategies were adopted or extended, by some Insureds
— Continued to show a healthy premium credit balance in Insurers favour.
Premium Development
Rate on Sales Development
0
30
60
90
120
150
0.0
0.5
1.0
1.5
2.0
2.5
Dev.
Rat
io
0
25
50
75
100
USD
BnUS
D M
n
2001 20092002 2003 2004 2005 2006 2007 2008 2010
2001 2001 20092002 2003 2004 2005 2006 2007 2008 2010
2001 20092002 2003 2004 2005 2006 2007 2008 2010
ANNUAl NeT PReMIUM
MAjoR EngInE MAnUfACTURERS
Premium Development
Rate on Sales Development
0
30
60
90
120
150
0.0
0.5
1.0
1.5
2.0
2.5
Dev.
Rat
io
0
25
50
75
100
USD
BnUS
D M
n
2001 20092002 2003 2004 2005 2006 2007 2008 2010
2001 2001 20092002 2003 2004 2005 2006 2007 2008 2010
2001 20092002 2003 2004 2005 2006 2007 2008 2010
DeVelOPMeNT RATIOS: NeT PReMIUM/RATe ON SAleS
Premium Development
Rate on Sales Development
0
30
60
90
120
150
0.0
0.5
1.0
1.5
2.0
2.5
Dev.
Rat
io
0
25
50
75
100
USD
BnUS
D M
n
2001 20092002 2003 2004 2005 2006 2007 2008 2010
2001 2001 20092002 2003 2004 2005 2006 2007 2008 2010
2001 20092002 2003 2004 2005 2006 2007 2008 2010
eSTIMATeD ANNUAl SAleS

WILLIS AEROSPACE AVIATION PRODUCTS MARkeT ReVIew 2011 21
This sector recorded the highest projected sales growth within the Index, being 8.63%.
This is mainly the result of an acquisition by a manufacturer in this sector, of a manufacturer that was previously included in a different Index sector. Thus, the new entity is retained in this sector with greatly increased sales.
We did however see that sales forecasts were generally up in this sector in 2010.
Premium recorded a fall of 2.72% to a level of USD 20.32 million.
The acquisition mentioned above helped to achieve a new combined 2010 premium base that was significantly less than the combined sum of expiring premium, thus distorting the final result inside this sector.
The derived rate on sales reduced by 10.45% which is the combined impact of increased sales and premium reduction mentioned above.
The loss ratios in this sector remain low and therefore this sector continues to be attractive to Insurers.
Premium Development
Rate on Sales Development
0
10
20
30
40
0.0
0.5
1.0
1.5
2.0
2.5
3.0
3.5
4.0
Dev.
Rat
io
0
5
10
15
20
25
USD
BnUS
D M
n
2001 20092002 2003 2004 2005 2006 2007 2008 2010
2001 2001 20092002 2003 2004 2005 2006 2007 2008 2010
2001 20092002 2003 2004 2005 2006 2007 2008 2010
ANNUAl NeT PReMIUM
SUb-AIRfRAME/EngInE MAnUfACTURERS
Premium Development
Rate on Sales Development
0
10
20
30
40
0.0
0.5
1.0
1.5
2.0
2.5
3.0
3.5
4.0
Dev.
Rat
io
0
5
10
15
20
25
USD
BnUS
D M
n2001 20092002 2003 2004 2005 2006 2007 2008 2010
2001 2001 20092002 2003 2004 2005 2006 2007 2008 2010
2001 20092002 2003 2004 2005 2006 2007 2008 2010
DeVelOPMeNT RATIOS: NeT PReMIUM/RATe ON SAleS
Premium Development
Rate on Sales Development
0
10
20
30
40
0.0
0.5
1.0
1.5
2.0
2.5
3.0
3.5
4.0
Dev.
Rat
io
0
5
10
15
20
25
USD
BnUS
D M
n
2001 20092002 2003 2004 2005 2006 2007 2008 2010
2001 2001 20092002 2003 2004 2005 2006 2007 2008 2010
2001 20092002 2003 2004 2005 2006 2007 2008 2010
eSTIMATeD ANNUAl SAleS

22 WILLIS AEROSPACE AVIATION PRODUCTS MARkeT ReVIew 2011
Component manufacturers continues to be one of the most difficult and diverse sectors to be analysed.
Overall, the sector recorded a net premium reduction of 3.5% in 2010 against 2009 figures.
This does however disguise a broad spectrum of renewal results, ranging from double digit reduction to double digit increase.
This is reflective of the risk profiles being presented to Insurers which ranged from; sales increases, claim history improvements to sale reductions and claims deteriorations.
2010 sales forecasts overall for this sector were at USD 37.13 billion which represents 4.85% reduction on 2009 information.
Historical loss ratios also continued to improve within this diverse aerospace sector.
Premium Development
Rate on Sales Development
0
20
40
60
80
0.0
0.5
1.0
1.5
2.0
2.5
3.0
3.5
Dev.
Rat
io
0
10
20
30
40
USD
BnUS
D M
n
2001 20092002 2003 2004 2005 2006 2007 2008 2010
2001 2001 20092002 2003 2004 2005 2006 2007 2008 2010
2001 20092002 2003 2004 2005 2006 2007 2008 2010
ANNUAl NeT PReMIUM
CoMponEnT MAnUfACTURERS
Premium Development
Rate on Sales Development
0
20
40
60
80
0.0
0.5
1.0
1.5
2.0
2.5
3.0
3.5
Dev.
Rat
io
0
10
20
30
40
USD
BnUS
D M
n
2001 20092002 2003 2004 2005 2006 2007 2008 2010
2001 2001 20092002 2003 2004 2005 2006 2007 2008 2010
2001 20092002 2003 2004 2005 2006 2007 2008 2010
DeVelOPMeNT RATIOS: NeT PReMIUM/RATe ON SAleS
Premium Development
Rate on Sales Development
0
20
40
60
80
0.0
0.5
1.0
1.5
2.0
2.5
3.0
3.5
Dev.
Rat
io
0
10
20
30
40
USD
BnUS
D M
n
2001 20092002 2003 2004 2005 2006 2007 2008 2010
2001 2001 20092002 2003 2004 2005 2006 2007 2008 2010
2001 20092002 2003 2004 2005 2006 2007 2008 2010
eSTIMATeD ANNUAl SAleS
WILLIS AEROSPACE AVIATION PRODUCTS MARkeT ReVIew 2011 23
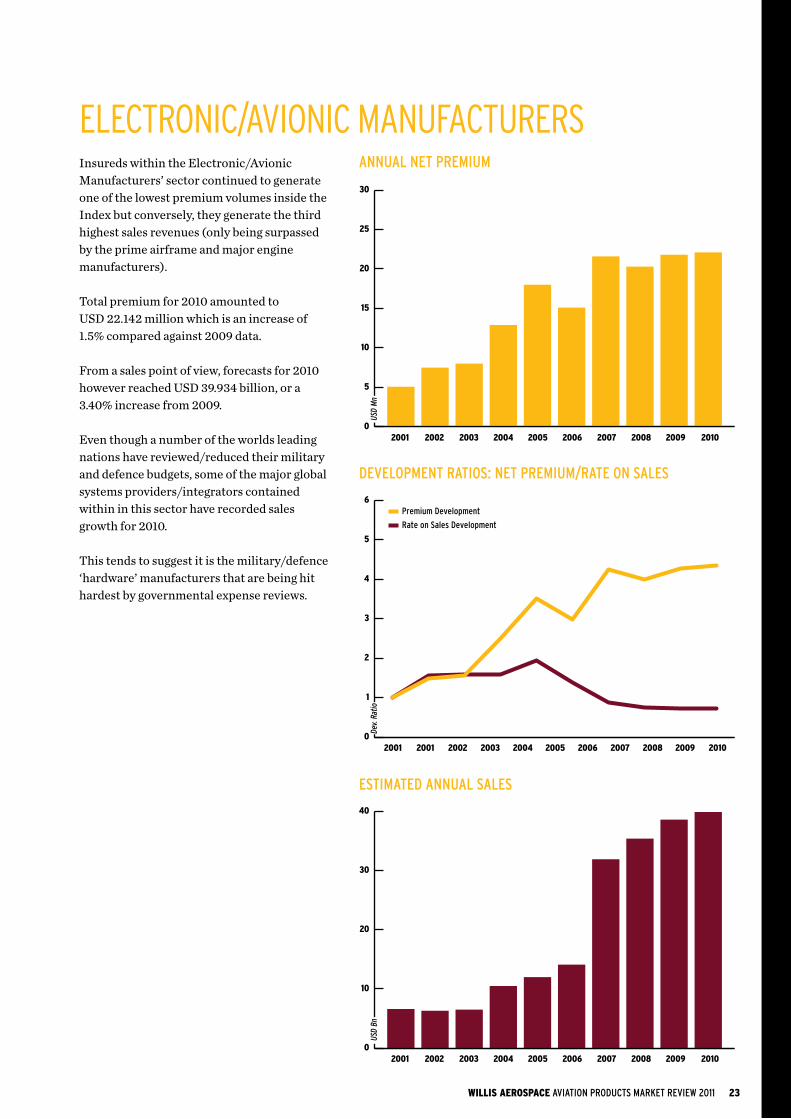
Insureds within the Electronic/Avionic Manufacturers’ sector continued to generate one of the lowest premium volumes inside the Index but conversely, they generate the third highest sales revenues (only being surpassed by the prime airframe and major engine manufacturers).
Total premium for 2010 amounted to USD 22.142 million which is an increase of 1.5% compared against 2009 data.
From a sales point of view, forecasts for 2010 however reached USD 39.934 billion, or a 3.40% increase from 2009.
Even though a number of the worlds leading nations have reviewed/reduced their military and defence budgets, some of the major global systems providers/integrators contained within in this sector have recorded sales growth for 2010.
This tends to suggest it is the military/defence ‘hardware’ manufacturers that are being hit hardest by governmental expense reviews.
Premium Development
Rate on Sales Development
0
5
10
15
20
25
30
0
1
2
3
4
5
6
Dev.
Rat
io
0
10
20
30
40
USD
BnUS
D M
n
2001 20092002 2003 2004 2005 2006 2007 2008 2010
2001 2001 20092002 2003 2004 2005 2006 2007 2008 2010
2001 20092002 2003 2004 2005 2006 2007 2008 2010
ANNUAl NeT PReMIUM
ElECTRonIC/AVIonIC MAnUfACTURERS
Premium Development
Rate on Sales Development
0
5
10
15
20
25
30
0
1
2
3
4
5
6
Dev.
Rat
io
0
10
20
30
40
USD
BnUS
D M
n2001 20092002 2003 2004 2005 2006 2007 2008 2010
2001 2001 20092002 2003 2004 2005 2006 2007 2008 2010
2001 20092002 2003 2004 2005 2006 2007 2008 2010
DeVelOPMeNT RATIOS: NeT PReMIUM/RATe ON SAleS
Premium Development
Rate on Sales Development
0
5
10
15
20
25
30
0
1
2
3
4
5
6
Dev.
Rat
io
0
10
20
30
40
USD
BnUS
D M
n
2001 20092002 2003 2004 2005 2006 2007 2008 2010
2001 2001 20092002 2003 2004 2005 2006 2007 2008 2010
2001 20092002 2003 2004 2005 2006 2007 2008 2010
eSTIMATeD ANNUAl SAleS

24 WILLIS AEROSPACE AVIATION PRODUCTS MARkeT ReVIew 2011
Maintenance, Repair and Overhaul (MRO) companies provide specialist technical support services to aircraft operators but also in many cases, offer design and manufacturing capabilities thus presenting Insurers with diverse exposures which can be both short term and longer term liability risks.
This diversity is generally recognised by Insurers when assessing MRO Insureds.
Sales from MRO companies have continued the recent trend of further increases, being +4% in 2010 to a total of USD 21.584 billion.
This is partly because aircraft operators continue to outsource MRO services, particularly in areas of aviation industry growth (i.e. Asia where we have seen the most noticeable increase in productivity from MRO’s in recent years).
The MRO sector has generated some short term (liability) losses in recent years, to which Insurers reacted by applying premium increases.
However, some of the historical claims have improved during the 2010 renewal season and consequently, Insurers readjusted their rates, reflecting the shorter term nature of the MRO sector.
For 2010, total premium was USD 52.186 million, a 3.6% reduction compared to 2009.
Premium Development
Rate on Sales Development
0
10
20
30
40
50
60
0.0
0.5
1.0
1.5
2.0
2.5
3.0
Dev.
Rat
io
2001 20092002 2003 2004 2005 2006 2007 2008 2010
0
5
10
15
20
25
USD
Bn
2001 20092002 2003 2004 2005 2006 2007 2008 2010
USD
Mn
2001 20092002 2003 2004 2005 2006 2007 2008 2010
ANNUAl NeT PReMIUM
MAInTEnAnCE, REpAIR And oVERhAUl (MRo)
Premium Development
Rate on Sales Development
0
10
20
30
40
50
60
0.0
0.5
1.0
1.5
2.0
2.5
3.0
Dev.
Rat
io
2001 20092002 2003 2004 2005 2006 2007 2008 2010
0
5
10
15
20
25
USD
Bn
2001 20092002 2003 2004 2005 2006 2007 2008 2010
USD
Mn
2001 20092002 2003 2004 2005 2006 2007 2008 2010
DeVelOPMeNT RATIOS: NeT PReMIUM/RATe ON SAleS
Premium Development
Rate on Sales Development
0
10
20
30
40
50
60
0.0
0.5
1.0
1.5
2.0
2.5
3.0
Dev.
Rat
io
2001 20092002 2003 2004 2005 2006 2007 2008 2010
0
5
10
15
20
25
USD
Bn
2001 20092002 2003 2004 2005 2006 2007 2008 2010
USD
Mn
2001 20092002 2003 2004 2005 2006 2007 2008 2010
eSTIMATeD ANNUAl SAleS
WILLIS AEROSPACE AVIATION PRODUCTS MARkeT ReVIew 2011 25
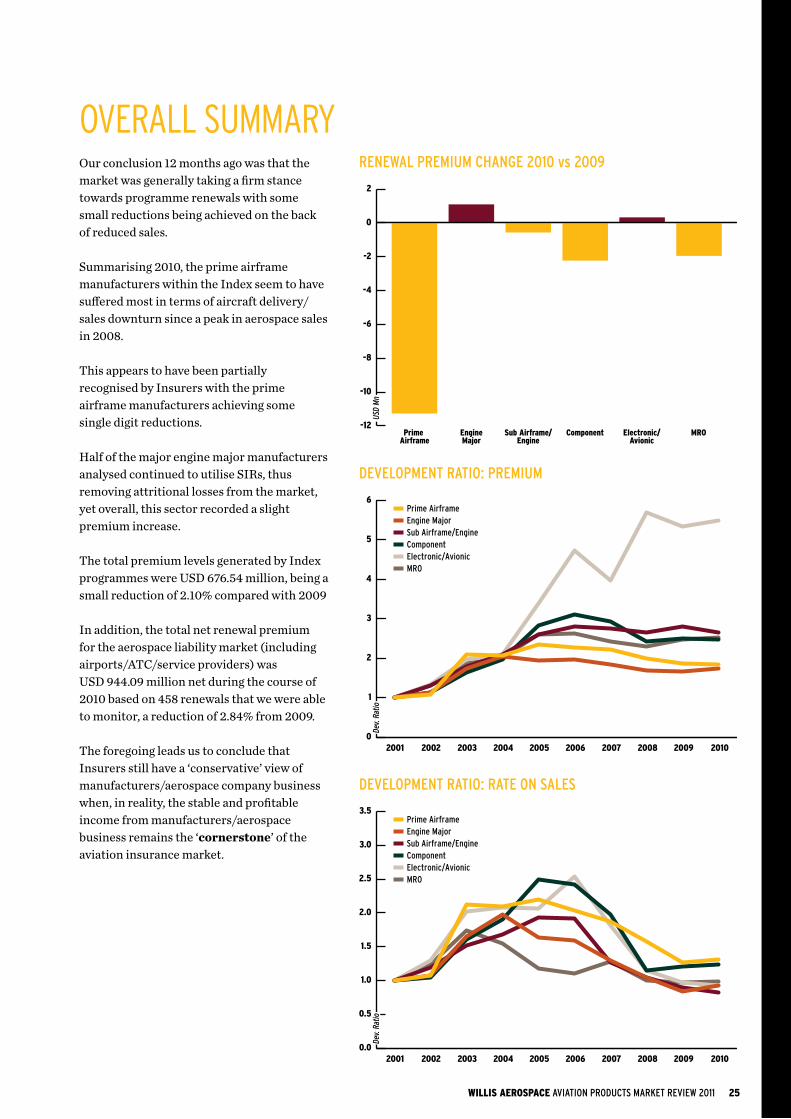
Our conclusion 12 months ago was that the market was generally taking a firm stance towards programme renewals with some small reductions being achieved on the back of reduced sales.
Summarising 2010, the prime airframe manufacturers within the Index seem to have suffered most in terms of aircraft delivery/sales downturn since a peak in aerospace sales in 2008.
This appears to have been partially recognised by Insurers with the prime airframe manufacturers achieving some single digit reductions.
Half of the major engine major manufacturers analysed continued to utilise SIRs, thus removing attritional losses from the market, yet overall, this sector recorded a slight premium increase.
The total premium levels generated by Index programmes were USD 676.54 million, being a small reduction of 2.10% compared with 2009
In addition, the total net renewal premium for the aerospace liability market (including airports/ATC/service providers) was USD 944.09 million net during the course of 2010 based on 458 renewals that we were able to monitor, a reduction of 2.84% from 2009.
The foregoing leads us to conclude that Insurers still have a ‘conservative’ view of manufacturers/aerospace company business when, in reality, the stable and profitable income from manufacturers/aerospace business remains the ‘cornerstone’ of the aviation insurance market.
Prime AirframeEngine MajorSub Airframe/EngineComponentElectronic/AvionicMRO
-12
-10
-8
-6
-4
-2
0
2
0
1
2
3
4
5
Dev.
Rat
io
2001 2001 20092002 2003 2004 2005 2006 2007 2008 2010
2001 2001 20092002 2003 2004 2005 2006 2007 2008 2010
Prime AirframeEngine MajorSub Airframe/EngineComponentElectronic/AvionicMRO
0.0
0.5
1.0
1.5
2.0
2.5
3.0
3.5
USD
Mn
Prime Airframe
EngineMajor
Component MROSub Airframe/Engine
Electronic/Avionic
ReNewAl PReMIUM ChANge 2010 vs 2009
oVERAll SUMMARY
Prime AirframeEngine MajorSub Airframe/EngineComponentElectronic/AvionicMRO
-2
-1
0
1
2
3
4
5
0
1
2
3
4
5
6
Dev.
Rat
io
2001 20092002 2003 2004 2005 2006 2007 2008 2010
Prime AirframeEngine MajorSub Airframe/EngineComponentElectronic/AvionicMRO
0.0
0.5
1.0
1.5
2.0
2.5
3.0
3.5
2001 20092002 2003 2004 2005 2006 2007 2008 2010
USD
Mn
Prime Airframe
EngineMajor
Component MROSub Airframe/Engine
Electronic/Avionic
Dev.
Rat
io
DeVelOPMeNT RATIO: PReMIUMPrime AirframeEngine MajorSub Airframe/EngineComponentElectronic/AvionicMRO
-2
-1
0
1
2
3
4
5
0
1
2
3
4
5
6
Dev.
Rat
io
2001 20092002 2003 2004 2005 2006 2007 2008 2010
Prime AirframeEngine MajorSub Airframe/EngineComponentElectronic/AvionicMRO
0.0
0.5
1.0
1.5
2.0
2.5
3.0
3.5
2001 20092002 2003 2004 2005 2006 2007 2008 2010
USD
Mn
Prime Airframe
EngineMajor
Component MROSub Airframe/Engine
Electronic/Avionic
Dev.
Rat
io
DeVelOPMeNT RATIO: RATe ON SAleS

IndE
X pR
EMIU
M A
nd
loSS
dEV
Elop
MEn
T

WILLIS AEROSPACE AVIATION PRODUCTS MARkeT ReVIew 2011 27
We have already shown (in the Aviation Industry Review) that notwithstanding increased passenger fatalities in 2010, overall, passenger fatalities rates still remain substantially lower than in previous decades.
When we consider that 2.72 billion airline passengers were carried in 2010 against 648 recorded fatalities, this leads to the conclusion that the aviation industry continues to be one of the safest forms of transport and is a testament to the quality of product and service support coming from the aviation manufacturing industry.
Considering passenger awards are one of the largest contributors towards aviation products liability claims, the improving passengers fatality rates have undoubtedly led towards the growing aviation products market profit/premium credit balance.
In last years review, we established the Index Eight Year Fluid Tracker (the Tracker) in order to have a better understanding of the aviation products market premium and loss patterns.
The Tracker is generated using a seven year claims basis (year seven being the point on ‘average’ that manufacturers losses peak in a 10 year cycle) including the most recently expired (green) year, reflecting an eight year loss profile.
Using the Tracker, we can advise that the year end figures (as presented during 2010 underwriting year) now generates a profit/premium credit balance of USD 3.38 billion to Insurers benefit as detailed below:
Having established that the companies that constitute The Index have been profitable to Insurers, we should next review the Tracker from last years report to see how this has performed.
GreenYear
‘Developing’ 7 Years
0
100
200
300
400
500
600
2000 20082001 2002 2003 2004 2005 2006 2007 2009
Mature Years
USD
M
-300
-250
-200
-150
-100
-50
0
50
USD
M
USD +5.58 million2000 Mature Year Comparison As at end 2009As at end 2010 Change USD +5.58 million
USD -272.88 millionIndex 8-Year Fluid Tracker:As at end 2009 = 2002-2008 vsAs at end 2010= 2003-2009 Change USD -272.88 million
Index 8-Year Fluid Tracker
0
50
100
150
200
Perc
enta
ge
Loss Ratio
0.0
0.5
1.0
1.5
2.0
2.5
3.0
3.5
4.0
Year End 2006 Year End 2007 Year End 2008 Year End 2009
USD
B
PReMIUM CReDIT bAlANCe USINg The TRACkeR
28 WILLIS AEROSPACE AVIATION PRODUCTS MARkeT ReVIew 2011
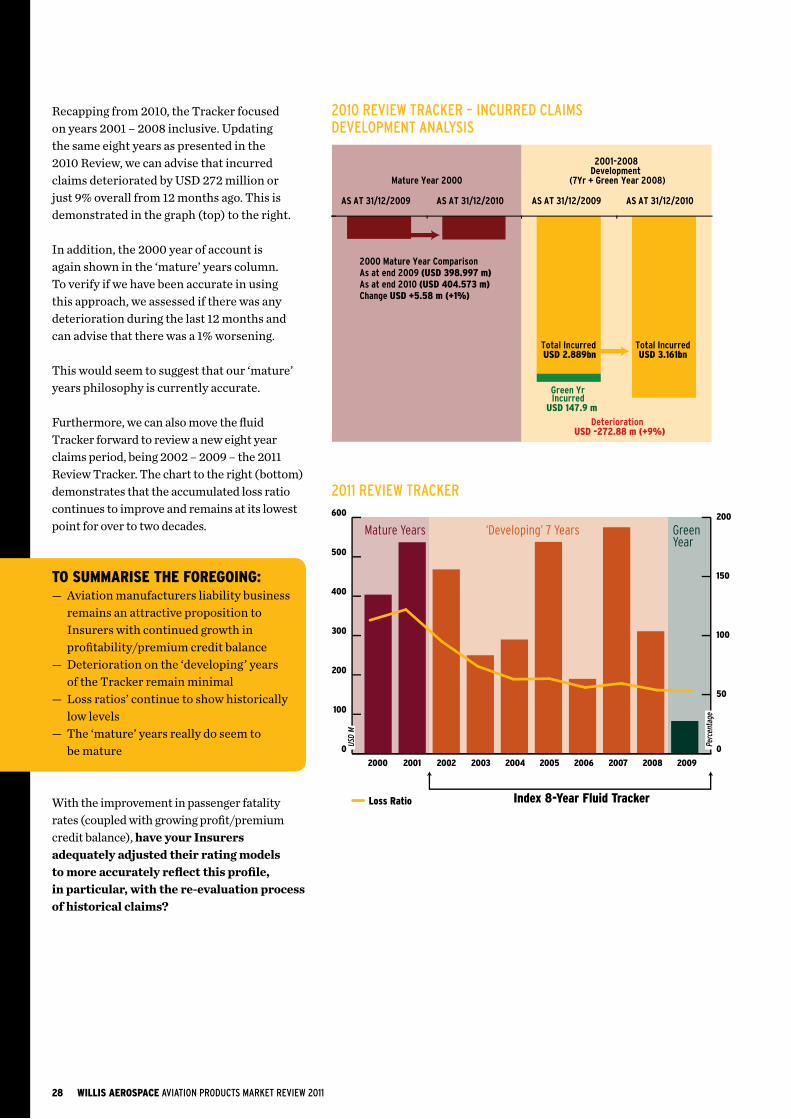
Recapping from 2010, the Tracker focused on years 2001 – 2008 inclusive. Updating the same eight years as presented in the 2010 Review, we can advise that incurred claims deteriorated by USD 272 million or just 9% overall from 12 months ago. This is demonstrated in the graph (top) to the right.
In addition, the 2000 year of account is again shown in the ‘mature’ years column. To verify if we have been accurate in using this approach, we assessed if there was any deterioration during the last 12 months and can advise that there was a 1% worsening.
This would seem to suggest that our ‘mature’ years philosophy is currently accurate.
Furthermore, we can also move the fluid Tracker forward to review a new eight year claims period, being 2002 – 2009 – the 2011 Review Tracker. The chart to the right (bottom) demonstrates that the accumulated loss ratio continues to improve and remains at its lowest point for over to two decades.
TO SUMMARISE ThE fOREgOINg:— Aviation manufacturers liability business
remains an attractive proposition to Insurers with continued growth in profitability/premium credit balance
— Deterioration on the ‘developing’ years of the Tracker remain minimal
— Loss ratios’ continue to show historically low levels
— The ‘mature’ years really do seem to be mature
With the improvement in passenger fatality rates (coupled with growing profit/premium credit balance), have your Insurers adequately adjusted their rating models to more accurately reflect this profile, in particular, with the re-evaluation process of historical claims?
2010 ReVIew TRACkeR – INCURReD ClAIMS DeVelOPMeNT ANAlySIS
2011 ReVIew TRACkeR
Mature Year 2000
AS AT 31/12/2009 AS AT 31/12/2010 AS AT 31/12/2009 AS AT 31/12/2010
Total Incurred USD 2.889bn
Total IncurredUSD 3.161bn
Development (7Yr + Green Year 2008)
Deterioration
Green Yr Incurred
USD 147.9 m
2000 Mature Year Comparison As at end 2009 (USD 398.997 m)As at end 2010 (USD 404.573 m)Change USD +5.58 m (+1%)
USD -272.88 m (+9%)
2001-2008
GreenYear
‘Developing’ 7 Years
0
100
200
300
400
500
600
2000 20082001 2002 2003 2004 2005 2006 2007 2009
Mature Years
USD
M
-300
-250
-200
-150
-100
-50
0
50
USD
M
USD +5.58 million2000 Mature Year Comparison As at end 2009As at end 2010 Change USD +5.58 million
USD -272.88 millionIndex 8-Year Fluid Tracker:As at end 2009 = 2002-2008 vsAs at end 2010= 2003-2009 Change USD -272.88 million
Index 8-Year Fluid Tracker
0
50
100
150
200
Perc
enta
ge
Loss Ratio
0.0
0.5
1.0
1.5
2.0
2.5
3.0
3.5
4.0
Year End 2006 Year End 2007 Year End 2008 Year End 2009
USD
B

WILLIS AEROSPACE AVIATION PRODUCTS MARkeT ReVIew 2011 29
“ The Tracker now generates a profit/premium credit balance of USD 3.38 billion to Insurers benefit.”

foRE
CAST
foR
201
1

WILLIS AEROSPACE AVIATION PRODUCTS MARkeT ReVIew 2011 31
Twelve months ago, our forecast referred to a “stable and healthy” marketing environment, challenging conditions for airline Insurers and a growing aerospace profitability (notwithstanding incidents in 2009).
Summarising 2010, we can advise as follows:— 2010 saw a slight increase in aviation market capacity— The airline sector had another difficult year, but— The aerospace sector profit/premium credit balance grew again— However, Clients/Buyers only appeared to receive modest reductions overall
Although our 2010 Forecast appears to have been correct, what can we do as an insurance and risk management service industry to continue to remind Insurers of the importance of the aerospace sector client base during 2011 and beyond?
In February 2011, we issued a Special Bulletin where we stated that Clients/Buyers should be looking for ‘optimism’ in their 2011 insurance and risk financing renewals and highlighted the level of profit/premium credit balance in Insurers’ favour that aerospace manufacturers had generated.
We are pleased to describe below the reasons why: — Although we can not predict the future, passenger fatality rates seem to have
shown a ‘sustained’ cumulative improvement over the last decade notwithstanding strong growth in global passenger numbers – aircraft technology and flight safety improvements being key contributors
— This improvement in passenger fatality rates has no doubt been a factor towards the level of products liability claims against manufacturers we have seen in the last 10 years and therefore has been a contributory factor towards the sustained growth of the profit/premium credit balance of Insurers participating on aviation products liability policies
— In the last 10 years, the aviation insurance market has generated over USD 10 billion of profit/premium credit, however, there are some underlying factors that we would like to highlight:— The aerospace sector have generated 31% of aviation market premium (combined
airline and aerospace sectors) in the last 10 years, BUT— The aerospace sector has produced only 20% of claims (against 31% premium)
over the same period which could suggest there is still an ‘imbalance’ between the airline and aerospace sectors
— Some Insurers would argue that the airline sector has generated more income over the last 10 years which goes some way to justifying this ‘imbalance’, HOWEVER,
— We all understand that Insurers are in the risk transfer business and they need to generate a profit margin to their capital providers, so we asked ourselves the question, over the last 10 years, which sector has generated more profit/premium credit balance to Insurers, airline or aerospace?
— Our analysis concluded that the Aerospace sector generated 54% of the last 10 years profit/premium credit balance to aviation Insurers
34%
66%
31%
69%
20%
80%
34%
66%54% 46%
20%
80%AEROSPACEAIRLINE
32 WILLIS AEROSPACE AVIATION PRODUCTS MARkeT ReVIew 2011
— Aviation market capacity remains strong and the continued surplus of ‘A’ graded Insurers who write manufacturers aviation risks is a benefit to Clients/Buyers
— Competition amongst some of the core ‘following/co-Insurers’ should be utilised particularly with those who do not have the issue of ‘legacy’ claims and/or the protection afforded by Equitas/Lloyd’s
— We expect most Insurers to continue with individual risk analysis including actuarial reviews, however, Clients/Buyers will continue to evaluate the best use of Self Insured Retentions/Deductibles, and to review longer term risk financing strategies
— Clients/Buyers will review possible programme/captive restructures as they look ahead to 2011 and importantly, 2012, when reinsurance protection for Insurers may be more costly/restricted due to Solvency II implementation and the potential effects of natural catastrophes in the Asia Pacific region
We hope that Clients/Buyers share the same view as us and are able to utilise some of the foregoing information as strategic tools with your preferred insurance/risk management service providers to achieve the best results for your company.

WILLIS AEROSPACE AVIATION PRODUCTS MARkeT ReVIew 2011 33
“ Our analysis concluded that the Aerospace sector generated 54% of the last 10 years profit/premium credit balance to aviation Insurers.”

ClIE
nTS
bEfo
RE C
onTI
ngEn
TS

WILLIS AEROSPACE AVIATION PRODUCTS MARkeT ReVIew 2011 35
BACkgROUNDOn Tuesday, 16 February, 2010, the three global insurance brokers, Aon, Marsh and Willis, reached an agreement with regulators that ended costly compliance burdens imposed in 2005. However, the agreement also rolled back reforms that previously banned them from accepting additional payments from Insurers (contingent commissions) that are based on the growth or profitability of business placed with carriers.
Willis voluntarily stopped accepting contingent commissions in its retail insurance brokerage business in 2004. Today, in response to the regulatory changes, Willis is the only one of the global brokers to reaffirm its stand that contingent commissions represent a clear conflict of interest with clients and publicly refuse to accept them in its retail insurance brokerage business.
WhAT ARE CONTINgENT COMMISSIONS?Contingent commissions are compensation arrangements between retail insurance brokers and insurance carriers in which payment is contingent upon such factors as the growth or profitability of a book of business over time, often paid sometime after the end of a calendar year.
UNDERSTANDINg CONTINgENT COMMISSIONSAt the heart of today’s independent agent/broker model is the upfront commission, a percentage of the premium paid by the carrier to the agent or broker when business is placed. Since the rise of independent agents and brokers, carriers have devised ways to induce agents and brokers to place more business with them through incentives that go well beyond, and are in addition to, the standard upfront commission.
These incentives, historically not well disclosed to or quantified for clients, are paid by the carrier to the agent or broker based on two types of yearly calculations:
gROwTh CONTINgeNTS:Growth in the total premium placed by the agent or broker with the carrier on a year-over-year basis.
Example:If Broker/Agent X grows premiums with Insurance Company Y beyond a threshold set at the beginning of the year, Broker/Agent X can generate, for example, a 3% contingent payment in addition to the pre-agreed fee or upfront commission paid by the client or buyer.
So, by simply moving a portfolio of premium from one insurance company to another, Broker/Agent X can generate revenues equal to 3% of the total premium volume with Insurance Company Y, a 20% increase in compensation to the Broker/Agent on commission arrangements. On fee arrangements, these increases can readily generate a 50% increase in compensation to the Broker/Agent.

36 WILLIS AEROSPACE AVIATION PRODUCTS MARkeT ReVIew 2011
PROFITAbIlITy CONTINgeNTS:The size of the total annual underwriting profit earned by the carrier on aggregate premiums placed by the agent or broker with the carrier.
Example:If Broker/Agent X places profitable premium with Insurance Company Y which produces a loss ratio below a predefined threshold at the beginning of the year, Broker/Agent X can generate, for example, a 5% contingent payment in addition to the pre-agreed fee or upfront commission paid by the client or buyer.
So, by simply leaving historically profitable business with the Insurance Company, Broker/Agent X can generate revenues equal to 5% of the total premium with Insurance Company Y, a 30% increase in compensation to the Broker/Agent on commission arrangements. On fee arrangements, these increases can readily generate a 60% increase in compensation to the Broker/Agent.
A CONfLICT Of INTERESTContingent commissions create an inherent conflict of interest in retail insurance brokerage industry. In placing risk and servicing policies in a retail insurance brokerage, you can’t have two masters. But that’s what happens when these brokers are beholden to insurance companies for big bonuses dependent on growth and profitability (read: higher premiums and lower claims costs).
In the retail insurance brokerage business, claims happen all the time, and when insurance matters most, clients and carriers often find themselves on opposing sides of a claim. Data from Willis’s own claim records show that:— 50% of non-statutory claims bring ‘push-back’ from the carrier. If
the claim is large,the number spikes as high as 90%.— ‘Push-back’ – disputes, denials and reservations of rights by carriers
– is on the rise, with about 25% percent of all claims being litigated.
— Willis advocates over 50,000 claims per year, and are currently advocating over USD 1.5 billion in claims that exceed $10 million.
How can a broker truly advocate for a client’s claim to be paid if they are incentivised by the carrier to keep their book of business profitable? That sets up the conflict.
ThE PRACTICE Of PAyINg CONTINgENT COMMISSIONSSETS UP A fUNDAMENTAL CONfLICT Of INTERESTQ: How do carriers make more profit?A: Higher premiums and lower claims costs.
Q: What is in the best interests of clients?A: Lower premiums and fair and fast claim payments.
ThE COUNTER-ARgUMENTSRetail brokers who take contingent contingents will use a number of arguments to justify why they take them, including:
“ Even though we take contingent commissions, we are fully transparent about it.”
Not really: Accepting growth and/or profit-based contingents from carriers and being truly transparent are mutually exclusive. At the time of placement, a broker’s contingent compensation – dependent on a carrier’s increased volumes, renewal volumes, profit or a mixture of factors over time – cannot be known.
Even months later, after the end of the year, the true cost of contingents to any one clientcan’t be quantified. That’s because the tally isn’t based on any single client or transaction.The contingent payment is dependent on how much larger or more profitable the broker’sentire book of business is with a carrier from one year to the next. The end result? The clientmay be stuck paying an unknown tab.
“ There is no conflict of interest if we fully disclose our compensation.”
Not true: The mere fact that an agent or broker discloses to a client that they are acceptingcontingents does not eliminate the conflict.Simply saying you are taking contingents does not make it right and leaves unanswered the key question of exactly how much you are making from a client’s business.
In addition, the new regulations place the burden to request full disclosure about the nature, amount and source of the broker’s compensation on the shoulders of the insurance buyer. So if you don’t ask, you won’t know.

“ Clients can opt-out of contingent commission programs.”
If only it were that simple: Promising a client that its premium and/or losses will not be included in an Insurer’s contingent calculation doesn’t eliminate the conflict, either. And it’s impossible to verify without a forensic examination of the books. The accounting for these so-called ‘opt-outs’ is opaque at best and doesn’t unchain the broker from having two masters.
WhAT CAN yOU DO TO STOP CONTINgENTS?ASk The hARD qUeSTIONSBuyers of insurance, beware: Unless a broker tells you, upfront, who is paying them, how much they are being paid and in what form they are receiving payment, you’re not getting the whole story.
We urge CEOs, CFOs and general counsels of individual organizations to sit down with their risk managers and ask these hard questions:— Is our broker squarely on our side?— Are we getting the best coverage?— Are we paying a fair premium for
that coverage?— When something goes wrong, will our broker
be there for us to get the maximum payout for our claim and have it paid quickly?
VOTe wITh yOUR FeeTWillis has set up Clients Before Contingents to give you, the buyer of insurance, a voice and a platform to come together with other buyers and take a stand against contingent commissions.
When Willis stood up against contingents in 2004, we looked forward to the day when they would be erased from the global retail insurance brokerage industry. But now that they look set to make a come back, it falls to the buyers of insurance to vote with their feet and discourage their brokers from taking these payments.
Use ClientsBeforeContingents.com to have your say and lend your voice to an issue that calls out for change.
Willis has taken the lead in establishing itself as much more than a transactional broker, offering innovative products and value added services to our clients that are unique to Willis.
The group, together with its subsidiaries and associates, employs 17,000 people represented through a network of 400 offices in 120 countries.
Willis Aerospace is a division of Willis Group Limited, the global insurance broker and is a leading professional risk and insurance advisor to the global aerospace industry.
We employ over 290 aerospace associates based in 28 dedicated offices servicing the requirements of aerospace companies around the world, including aerospace risk management, leasing and financial consultants.
Willis Aerospace has achieved and sustained key market position over the past decade through an unswerving commitment to clients by investing heavily in new skills and resources to ensure that we meet and exceed our clients’ expectations.
Our goal is to help clients succeed by reducing and managing the risks they face.
Willis Aerospace develops and delivers professional insurance, reinsurance and risk management advice and solutions for clients in a diverse range of industries with operations across the world.
DATA SOURCeS:— Willis Aerospace Database— Ascend/Airclaims— GAMA— ATI
DISClAIMeRThis market review has been produced for information purposes only. While the information contained has been prepared after consultation with insurance markets and participants, we accept no liability for its accuracy or reproduction.

Willis Limited, Registered number: 181116 England and Wales.Registered address: 51 Lime Street, London, EC3M 7DQ.A Lloyd’s Broker. Authorised and regulated by the Financial Services Authority.
9313/02/11
Nick CoxTel: +44 (0)20 3124 7671Email: [email protected]
Craig R. DavieTel: +44 (0)20 3124 7321Email: [email protected]
Neil D. GetterTel: +1 212 915 7879Email: [email protected]
Garrett HanrahanTel: +1 972 715 6390Email: [email protected]
Daniel HubbardTel: +44 (0)20 3124 8403Email: [email protected]
John KingTel: +44 (0)20 3124 8676Email: [email protected]
Stephen J. KisorTel: +1 213 607 6316Email: [email protected]
Stephen R. LodgeTel: +44 (0)20 3124 7456Email: [email protected]
Martin E. McConnell, JrTel: +1 212 915 8224Email: [email protected]
John RooleyTel: +1 604 6055616Email: [email protected]
Charles SearleTel: +44 (0)20 3124 8862Email: [email protected]
Michael SoltynskiTel: +1 604 605 5615Email: [email protected]
Gary Standing Tel: +44 (0)20 3124 7690Email: [email protected]
Andrew WeberTel: +44 (0)20 3124 6018Email: [email protected]
For more information please contact the Leaders of the Global Aerospace Practice, of Willis Aerospace: