william m. burns, ceo roche pharmaceuticalsfbb4c0ca-2406-4018-b922-3343f0b57360/...william m. burns,...
TRANSCRIPT
1
Roche: Committed to InnovationWilliam M. Burns, CEO Roche Pharmaceuticals
2
This presentation contains certain forward-looking statements. These forward-looking statements may be identified by words such as ‘believes’, ‘expects’, ‘anticipates’, ‘projects’, ‘intends’, ‘should’, ‘seeks’, ‘estimates’, ‘future’ or similar expressions or by discussion of, among other things, strategy, goals, plans or intentions. Various factors may cause actual results to differ materially in the future from those reflected in forward-looking statements contained in this presentation, among others:
1 pricing and product initiatives of competitors;2 legislative and regulatory developments and economic conditions;3 delay or inability in obtaining regulatory approvals or bringing products to market; 4 fluctuations in currency exchange rates and general financial market conditions; 5 uncertainties in the discovery, development or marketing of new products or new uses of existing products, including without
limitation negative results of clinical trials or research projects, unexpected side-effects of pipeline or marketed products; 6 increased government pricing pressures; 7 interruptions in production 8 loss of or inability to obtain adequate protection for intellectual property rights; 9 litigation;10 loss of key executives or other employees; and11 adverse publicity and news coverage.
Any statements regarding earnings per share growth is not a profit forecast and should not be interpreted to mean that Roche’s earnings or earnings per share for this year or any subsequent period will necessarily match or exceed the historical published earnings or earnings per share of Roche.
For marketed products discussed in this presentation, please see full prescribing information on our website – www.roche.com
All mentioned trademarks are legally protected

2
3
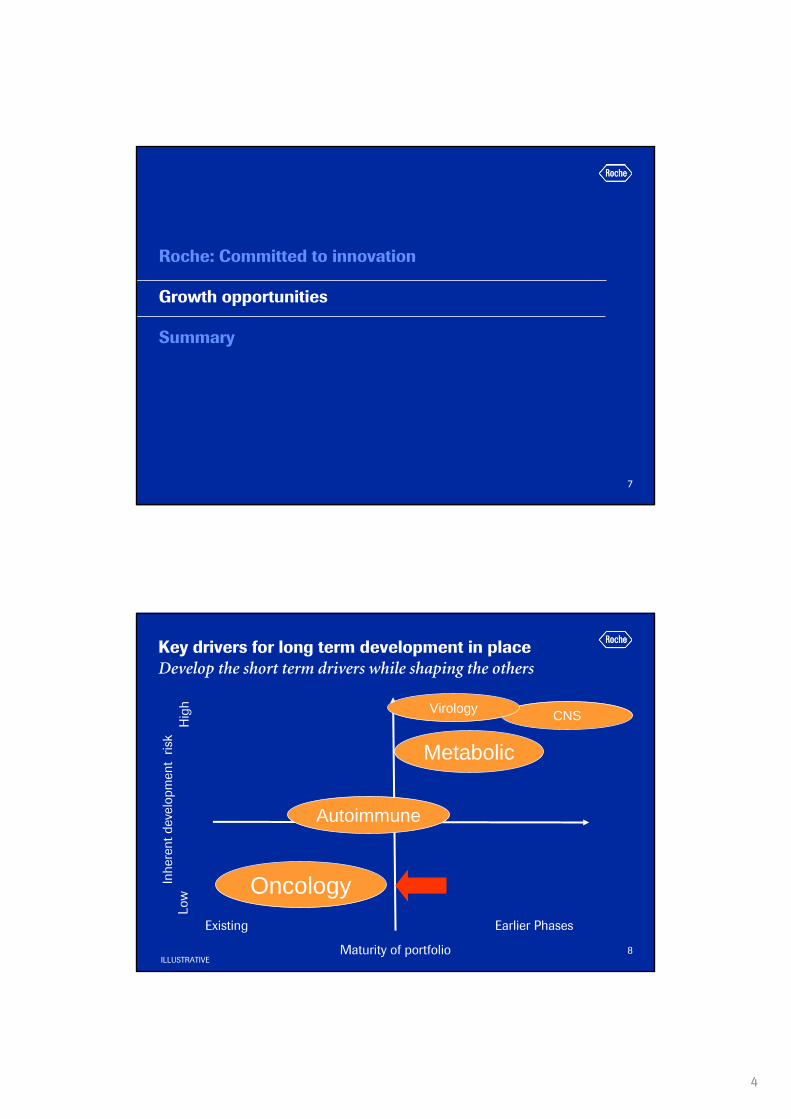
Roche: Committed to innovation
Growth opportunities
Summary
4
Roche Pharma 5,702 5,498 -4 1 11
excl. Tamiflu pandemic 5,151 5,455 6 11 22
Genentech 2,547 2,399 -6 9 9
Chugai 893 671 -25 -23 -13
excl. Tamiflu pandemic 698 669 -4 -2 11
Pharmaceuticals 9,142 8,568 -6 1 8
excl. Tamiflu pandemic 8,396 8,523 2 9 17
Pharma Q1 `08: strong underlying momentum
USDQ1’07 Q1’08 CHF local growth
% change inSales CHF m

3
5
Pharma: Strong growth at well balanced risk profile Based on multiple products
0
5
10
15
20
25
30
35
40
1997
1999
2001
2003
2005
2007
Pharma sales1 (CHF billion)
CAGR 13 %
2007 Blockbuster Sales Pyramid (CHF billion)
Continuing to focus on our core assets
XelodaCHF 1.2 bn
MabThera/Rituxan CHF 5.5 bn
Pegasys CHF 1.6 bn
TarcevaCHF 1.1 bn
Cellcept CHF 2.0 bn
NeoRecormon/EpoginCHF 2.1 bn
Avastin CHF 4.1 bn
Herceptin CHF 4.9 bn
1 Continuing businesses
6
Major growth opportunities outside the US
76 68 6253 51 48
33
24 32 3847 49 52
67
0
20
40
60
80
100
PEGASY
S
HERCEP
TIN
XELODA
TARCEV
A
CELLC
EPT
MABTH
ERA
AVASTIN
% o
f Tot
al 2
007
Sal
es
USEU / ROW (incl. Japan)
4
7
Roche: Committed to innovation
Growth opportunities
Summary
8
Existing Earlier Phases
ILLUSTRATIVE
Inhe
rent
dev
elop
men
t ris
k
Maturity of portfolio
Low
Hig
h
Oncology
Autoimmune
Metabolic
CNSVirology
Key drivers for long term development in placeDevelop the short term drivers while shaping the others
5
9
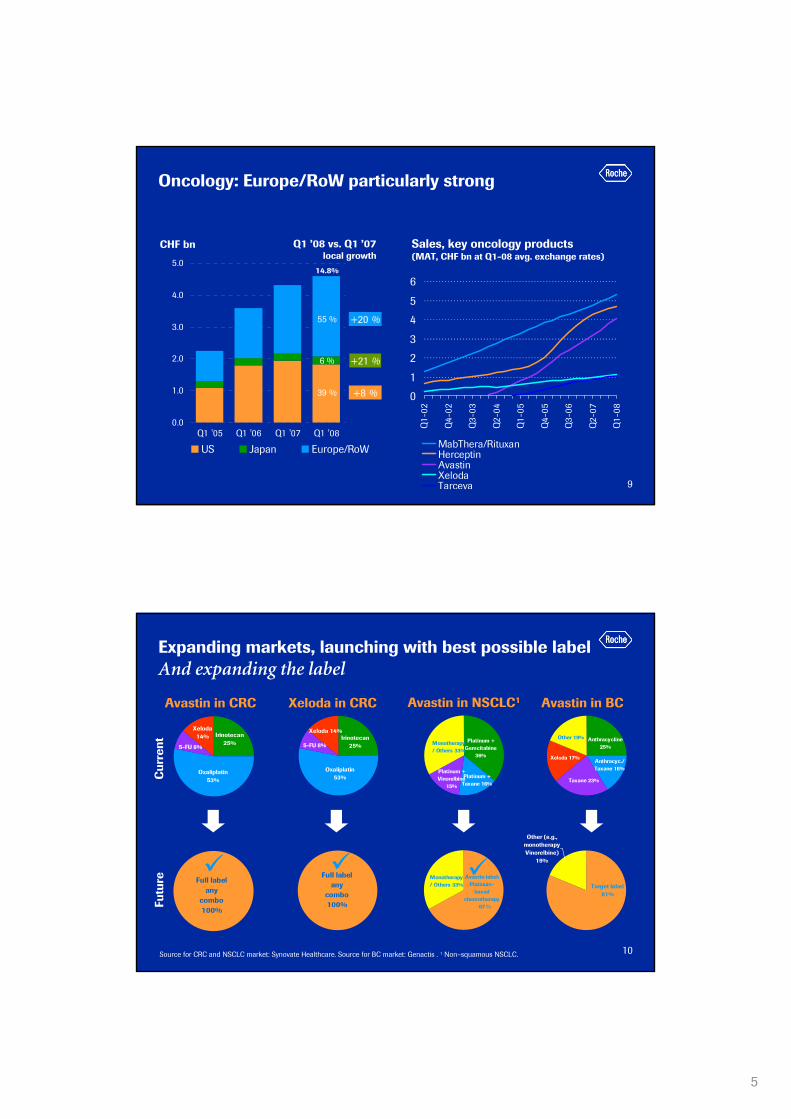
Oncology: Europe/RoW particularly strong
xx %
x %
CHF bn Q1 ’08 vs. Q1 ’07local growth
0.0
1.0
2.0
3.0
4.0
5.0
Q1 '05 Q1 '06 Q1 '07 Q1 '08
US Japan Europe/RoW
55 %
6 %
39 %
+20 %
+21 %
+8 % 0
1
2
3
4
5
6
Q1-
02
Q4-
02
Q3-
03
Q2-
04
Q1-
05
Q4-
05
Q3-
06
Q2-
07
Q1-
08
MabThera/RituxanHerceptinAvastinXelodaTarceva
Sales, key oncology products(MAT, CHF bn at Q1-08 avg. exchange rates)
14.8%
10
Expanding markets, launching with best possible labelAnd expanding the label
Xeloda 14% Irinotecan
25%
Oxaliplatin 53%
5-FU 8%
Avastin in CRC Xeloda in CRC
Oxaliplatin 53%
Irinotecan 25%5-FU 8%
Xeloda 14%
Avastin in NSCLC1
Monotherapy / Others 33%
Platinum + Gemcitabine
36%
Platinum + Vinorelbine
15%
Platinum + Taxane 16%
Avastin in BC
Anthracycline 25%
Anthracyc./ Taxane 16%
Taxane 23%
Xeloda 17%
Other 19%
Full label any
combo 100%
Full label any
combo 100%
Other (e.g., monotherapy Vinorelbine)
19%
Target label 81%
v
Cur
rent
Futu
re
Source for CRC and NSCLC market: Synovate Healthcare. Source for BC market: Genactis . 1 Non–squamous NSCLC.
Avastin label: Platinum-
based chemotherapy
67
Monotherapy / Others 33%
%
6
11
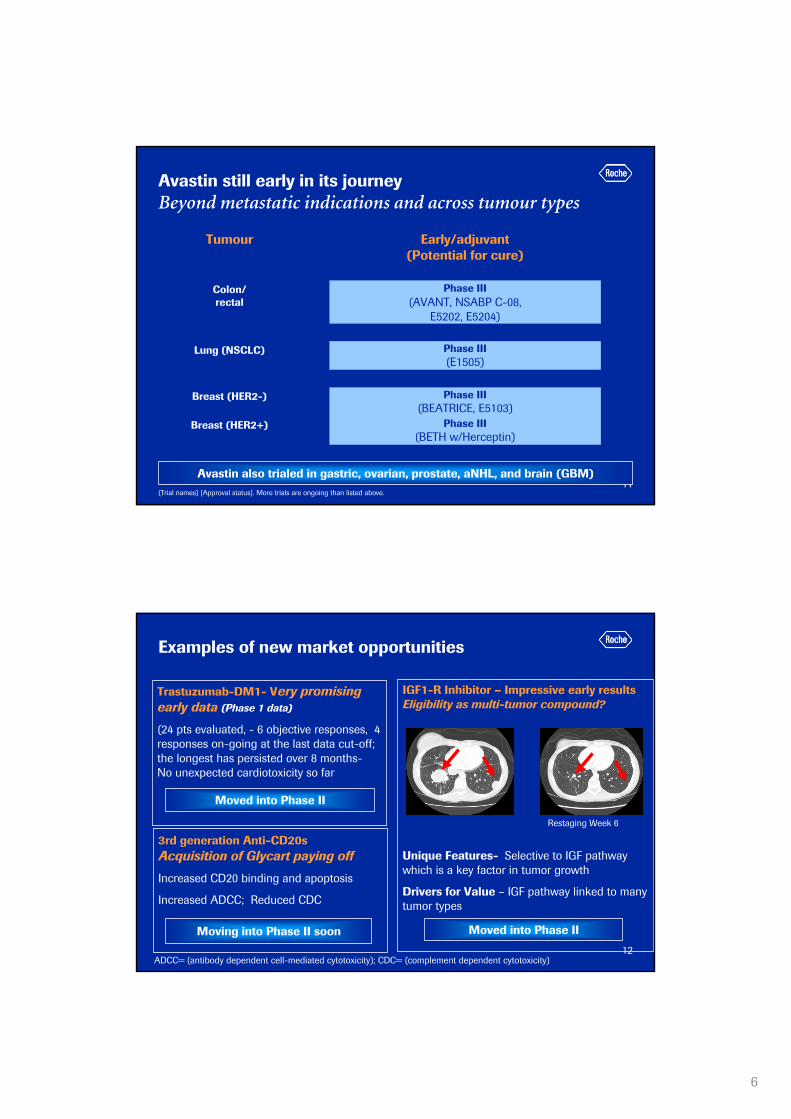
Avastin still early in its journey Beyond metastatic indications and across tumour types
Avastin also trialed in gastric, ovarian, prostate, aNHL, and brain (GBM)(Trial names) [Approval status]. More trials are ongoing than listed above.
Phase III(BETH w/Herceptin)
Breast (HER2+)
Phase III(BEATRICE, E5103)
Breast (HER2-)
Phase III(E1505)
Lung (NSCLC)
Phase III(AVANT, NSABP C-08,
E5202, E5204)
Colon/ rectal
Early/adjuvant (Potential for cure)
Tumour
12
Examples of new market opportunities
Trastuzumab-DM1- Very promising early data (Phase 1 data)
(24 pts evaluated, - 6 objective responses, 4 responses on-going at the last data cut-off; the longest has persisted over 8 months-No unexpected cardiotoxicity so far
Moved into Phase II
3rd generation Anti-CD20sAcquisition of Glycart paying off
Increased CD20 binding and apoptosis
Increased ADCC; Reduced CDC
ADCC= (antibody dependent cell-mediated cytotoxicity); CDC= (complement dependent cytotoxicity)
Moving into Phase II soon
IGF1-R Inhibitor – Impressive early resultsEligibility as multi-tumor compound?
Unique Features- Selective to IGF pathway which is a key factor in tumor growth
Drivers for Value – IGF pathway linked to many tumor types
Restaging Week 6
Moved into Phase II
7
13
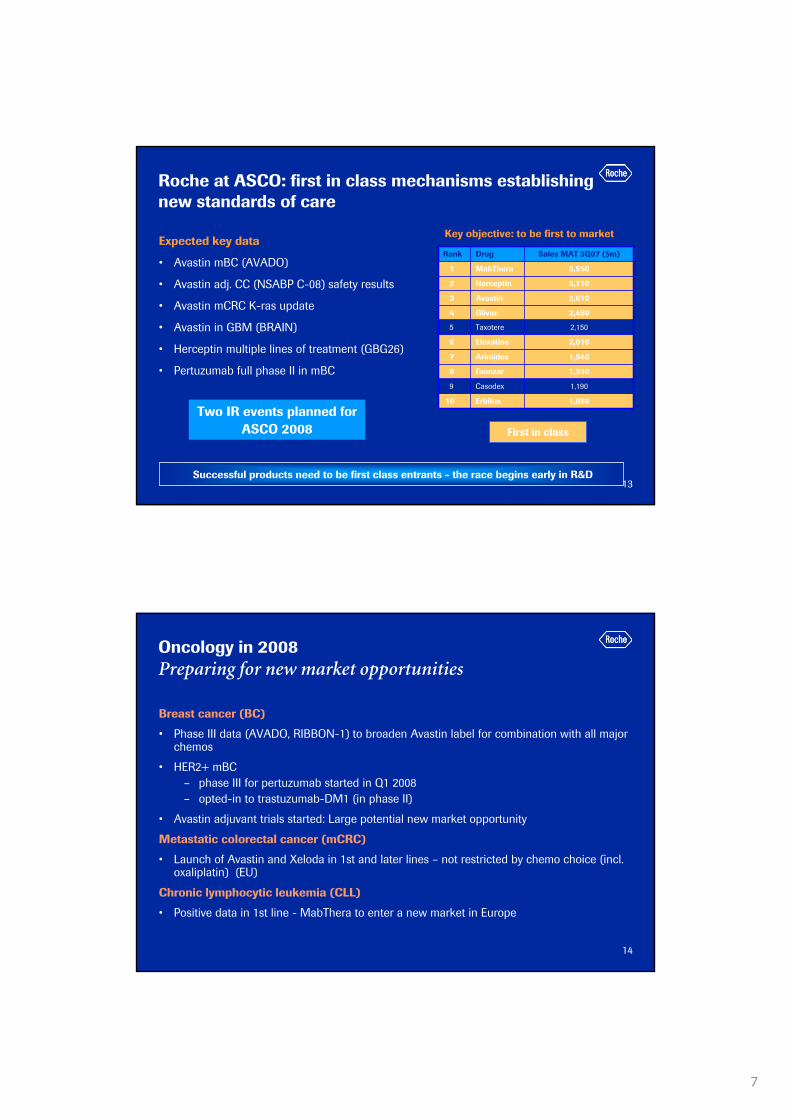
Roche at ASCO: first in class mechanisms establishing new standards of care
Expected key data
• Avastin mBC (AVADO)
• Avastin adj. CC (NSABP C-08) safety results
• Avastin mCRC K-ras update
• Avastin in GBM (BRAIN)
• Herceptin multiple lines of treatment (GBG26)
• Pertuzumab full phase II in mBC
Rank Drug Sales MAT 3Q07 ($m)
1 MabThera 3,550
2 Herceptin 3,110
3 Avastin 2,610
4 Glivec 2,450
5 Taxotere 2,150
6 Eloxatine 2,010
7 Arimidex 1,540
8 Gemzar 1,330
9 Casodex 1,190
10 Erbitux 1,080
First in class
Successful products need to be first class entrants - the race begins early in R&D
Key objective: to be first to market
Two IR events planned for ASCO 2008
14
Oncology in 2008Preparing for new market opportunities
Breast cancer (BC)
• Phase III data (AVADO, RIBBON-1) to broaden Avastin label for combination with all major chemos
• HER2+ mBC– phase III for pertuzumab started in Q1 2008– opted-in to trastuzumab-DM1 (in phase II)
• Avastin adjuvant trials started: Large potential new market opportunity
Metastatic colorectal cancer (mCRC)
• Launch of Avastin and Xeloda in 1st and later lines – not restricted by chemo choice (incl. oxaliplatin) (EU)
Chronic lymphocytic leukemia (CLL)
• Positive data in 1st line - MabThera to enter a new market in Europe

8
15
existing Earlier Phases
ILLUSTRATIVE
Inhe
rent
dev
elop
men
t ris
k
Maturity of portfolio
Low
Hig
h
Oncology
Autoimmune
Metabolic
CNSVirology
Key drivers for long term development in placeDevelop the short term drivers while shaping the others
16
332
1'522
429
0
200
400
600
800
1'000
1'200
1'400
1'600
Treated forMod/Sev
Treated with Bio Adherence
Mid to Long-Term Opportunities• Low biologic penetration Mod/Sev RA• Future growth drivers:
• Novel orals: Potent & convenient• PHC defined differentiation = premium pricing• New brand Rx combination regimens
2007 US Patient Treatment
0
200
400
600
800
1000
1200
1400
1600
2008 2010 2012 2014 2016 2018 2020
Num
ber o
f Bio
logi
c Tr
eate
d pa
tient
s in
000
s
5EUUSA
Short to mid-term growth driverBiologic treated population projected to grow 6.7% CAGR (2008-2020)
Rheumatoid Arthritis: Continued Market GrowthDriven by increased Biologic use, novel oral DMARDs & PHC

9
17
Actemra: Significant clinical benefitStrong improvement also at higher ACR scores
Source: Roche´s OPTION trial. All comparisons are to placebo + MTXCochran-Mantel-Haenszel analysis was used to calculate p-values
Δ=20.0
ACR20 ACR50 ACR70
Patie
nts
(%)
***p<0.000143.9%***
22.0%***
58.5%***
26.5%
10.8%
2.0%
12.2%***
***47.9%
31.5%***
Δ=32.0
Δ=33.1
0
10
20
30
40
50
60
70 PlaceboTCZ 4 mg/kg + MTXTCZ 8 mg/kg + MTX
18
0.0%
10.0%
20.0%
30.0%
40.0%
50.0%
60.0%
70.0%
80.0%
90.0%
100.0%
0 12 24 36 48 60 72 84
DA
S28
< 2
.6 (
%)
AMBITION RADIATE OPTION, TOWARD, LITHE
AMBITION (n) 564 546 502 438 369 262 168 87
RADIATE (n) 398 384 377 344 308 237 175 117
Pooled DMARD-IR (n)
1587 1541 1504 1380 1287 1143 963 690
Weeks
Actemra: Impressive Long-term extension data DAS28 (ESR) < 2.6 (ITT)

10
19
Next generation anti-CD20s (MabThera follow-ons)Opportunities for improvement
2nd gen. anti-CD20 (ocrelizumab)
Fully humanized
Potential clinical benefits
• Less immunogenicity
• Better tolerability
• Shorter infusion time
3rd gen. anti-CD20 (R7159)
Fc engineered (glycosylations)
• Increased CD20 binding and apoptosis
• Increased ADCC (antibody dependent cell-mediated toxicity)
• Reduced CDC (complement dependent cell toxicity)
Potential clinical benefits
• Improved efficacy/ Less infusion reactions
In phase III in RA, Phase II in RRMS to start 2008
In phase I for oncology / hematology
20
Inflammation PortfolioA rich pipeline in multiple AI indications
nn
nn nn RARγ
nn
nn
nn
nn
hMAb OX40L
Rheumatology
Respiratory
nn
P2P2P1P1P0P0LOLOLILI P3P3 MktMkt
nn
MabTheraDMARD inad resp
Actemra RA
MabTheraRA MTX naive
Actemra sJIA
Ocrelizumab RA
nn
Group OriginTPIProject origin: External Origin Line Extensions
nn
nn
nn
nn
nn
nn
nn
nn
MabThera RA
nnTransplant nn CellCept
Pain nnnn
ocrelizumabANCA vasculitis
nn
nn
Other
Ocrelizumab SLE
nn
nn nn
S1P1 Psoriasis
11
21
Key drivers for long term development in placeDevelop the short term drivers while shaping the others
existing Earlier Phases
ILLUSTRATIVE
Inhe
rent
dev
elop
men
t ris
k
Maturity of portfolio
Low
Hig
h
Oncology
Autoimmune
Metabolic
CNSVirology
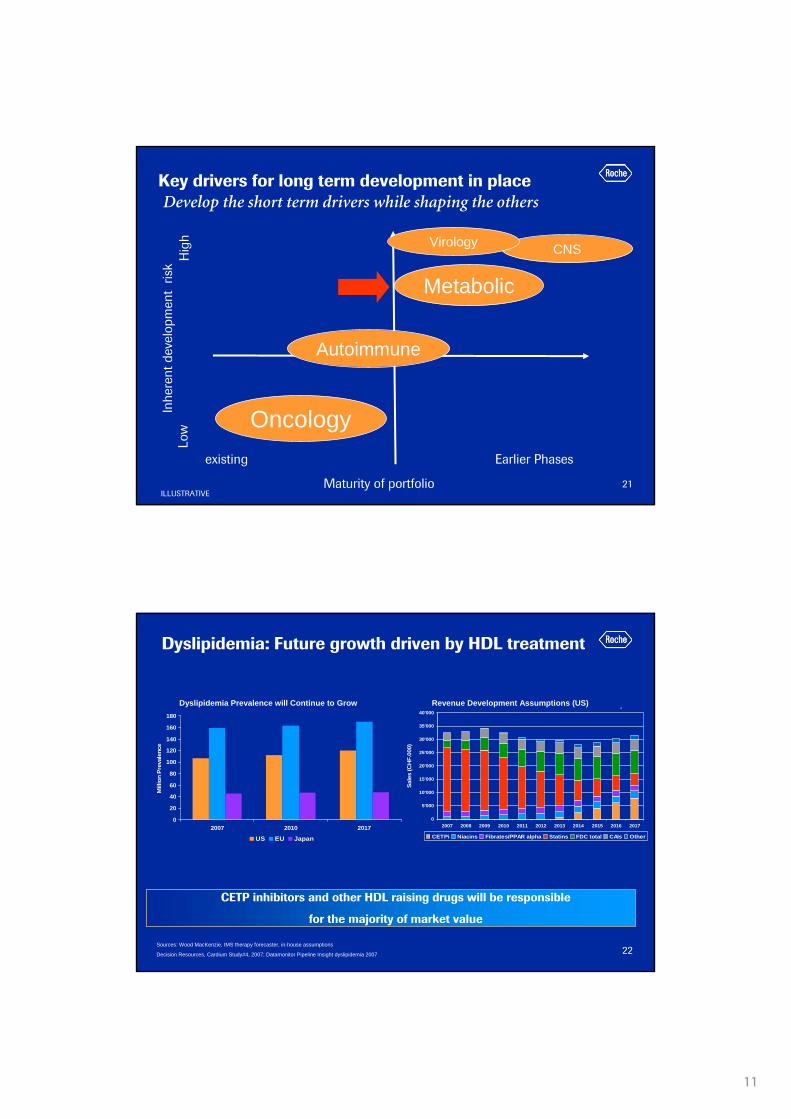
22
Revenue Development Assumption in Dyslipidemia (US)
0
5'000
10'000
15'000
20'000
25'000
30'000
35'000
40'000
2007 2008 2009 2010 2011 2012 2013 2014 2015 2016 2017
Sale
s (C
HF.
000)
CETPi Niacins Fibrates/PPAR alpha Statins FDC total CAIs Other
Sources: Wood MacKenzie, IMS therapy forecaster, in-house assumptions
Decision Resources, Cardium Study#4, 2007; Datamonitor Pipeline Insight dyslipidemia 2007
CETP inhibitors and other HDL raising drugs will be responsible
for the majority of market value
Dyslipidemia Population Development
0
20
40
60
80
100
120
140
160
180
2007 2010 2017
Mill
ion
Prev
alen
ce
US EU Japan
Dyslipidemia prevalence will continue to grow Revenue Development Assumptions in (US)Dyslipidemia Prevalence will Continue to Grow Revenue Development Assumptions (US)
Dyslipidemia: Future growth driven by HDL treatment
12
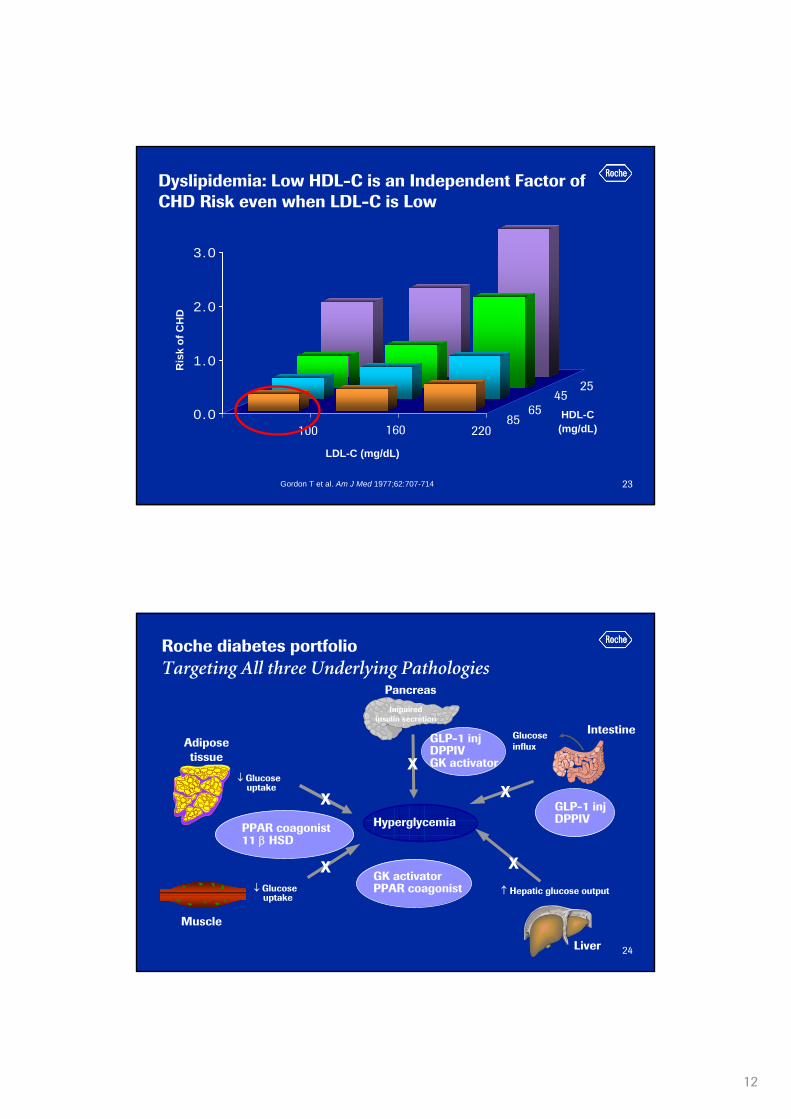
23Gordon T et al. Am J Med 1977;62:707-714.
0.0
1.0
2.0
3.0
Ris
k of
CH
D
HDL-C(mg/dL)
LDL-C (mg/dL)
100 160 220
2545
6585
Dyslipidemia: Low HDL-C is an Independent Factor of CHD Risk even when LDL-C is Low
24
Hyperglycemia
↑ Hepatic glucose output
Impairedinsulin secretion
GlucoseinfluxAdipose
tissue
↓ Glucoseuptake
GLP-1 injDPPIVGK activator
PPAR coagonist11 β HSD
GLP-1 injDPPIV
GK activatorPPAR coagonist
Muscle
↓ Glucoseuptake
X
X
X
X
X
Liver
Intestine
Pancreas
Roche diabetes portfolio Targeting All three Underlying Pathologies

13
25
Our metabolic pipeline: maturing quicklyCommitted to become a major player
PPAR-CO
nn
nn
nn
DPP-IV (3)
nnnn
nn
GLP-1
nn
nn
nn
nn
nn
nn
nn
nn
nnnn
nn
P2P2P1P1P0P0LOLOLILINMP/TANMP/TA P3P3CETP
nn
nn
nn
nn
nn
nn
nn
nnnn
nnnn
nn
RegReg
nn
nn
nn
nn
nn
nn
nn
February 04, 2008
nn
nn
nnRoche
Chugainn
nn
nn
nn
nn
nn
nn
nn
nn
nn
nn
nn
nn
SGLT2
Shanghai nn
SGLT2
26
Metabolism/Diabetes in 2008Committed to become a major player
CETP Inhibitor to move into phase III
• Safety data to be presented at major medical meetings
GLP-1 phase II data available
• Decision for phase III to be taken in H1 2008
• Publication planned for ADA
Phase II data for DPP-IV (3) and PPARαγ expected
• Looking for a differentiated profile (e.g. weight reduction for DPP-IV)
• Go/no-go decisions for phase III trials to be taken this year
SGLT2 just moved into Phase II
Investor science event
14
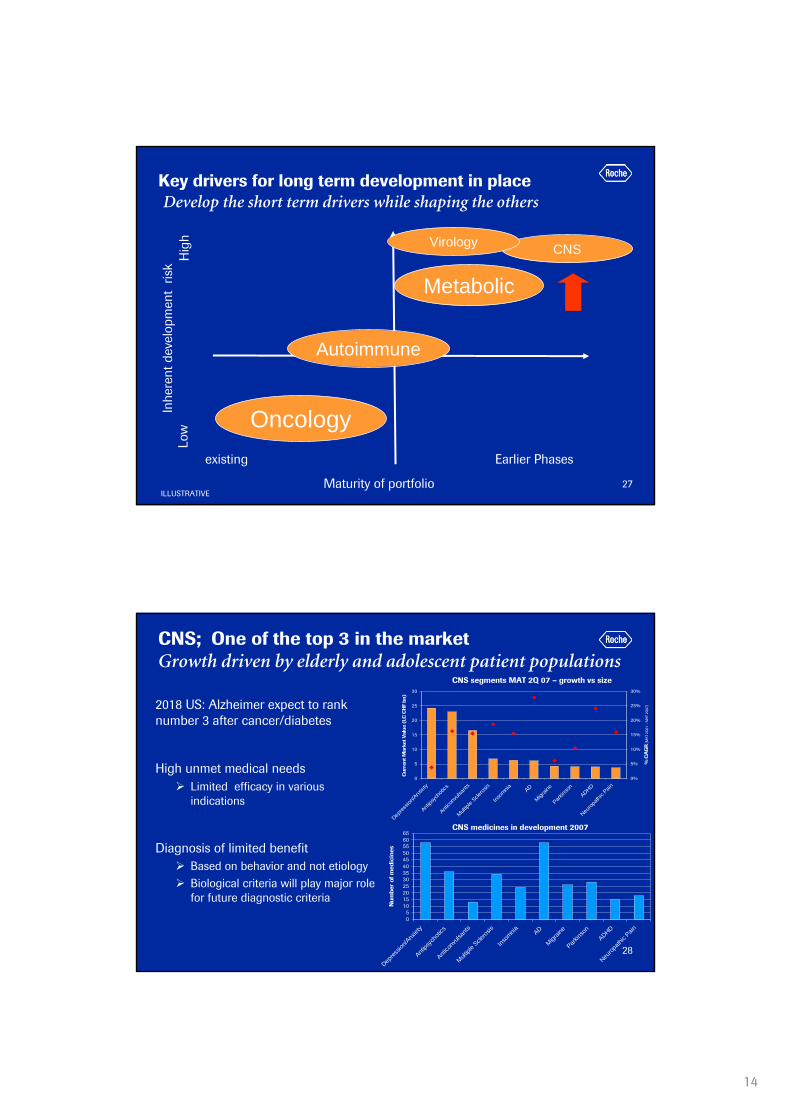
27
existing Earlier Phases
ILLUSTRATIVE
Inhe
rent
dev
elop
men
t ris
k
Maturity of portfolio
Low
Hig
h
Oncology
Autoimmune
Metabolic
CNSVirology
Key drivers for long term development in placeDevelop the short term drivers while shaping the others
28
CNS; One of the top 3 in the marketGrowth driven by elderly and adolescent patient populations
2018 US: Alzheimer expect to rank number 3 after cancer/diabetes
High unmet medical needsLimited efficacy in various indications
Diagnosis of limited benefitBased on behavior and not etiologyBiological criteria will play major role for future diagnostic criteria
05
101520253035404550556065
Depres
sion/A
nxiet
y
Antips
ycho
tics
Antico
nvuls
ants
Multipl
e Scle
rosis
Insom
nia AD
Migrain
e
Parkins
onADHD
Neurop
athic
Pain
Num
ber
of m
edic
ines
CNS medicines in development 2007
CNS segments MAT 2Q 07 – growth vs size
0
5
10
15
20
25
30
Depres
sion/A
nxiet
y
Antips
ycho
tics
Antico
nvuls
ants
Multipl
e Scle
rosis
Insom
nia AD
Migrain
e
Parkins
onADHD
Neurop
athic
Pain
Cu
rren
t Mar
ket V
alue
(LC
CH
F bn
)
0%
5%
10%
15%
20%
25%
30%
% C
AG
R (
MA
T 2Q
01 -
MA
T 2Q
07)

15
29
CNS Portfolio 2008- A clear commitment
nn
GLYT1
nn
nnnn
nn
nn
nn
nn
nn
nnnn
nn
nn
nn
nn
nn nn
Development Phase
P2P2P1P1P0P0LOLOLILITATA P3P3
Neurology
Psychiatry
nn
nn
nn
S1P1
Nic-a7 mem3454
nn
nn
nn
Ocrelizumab
Rituximab
nn
nn
nn
GLYT1(2)
30
Roche: Committed to innovation
Growth opportunities
Summary

16
31
Key drivers in place for sustainable growthCurrent and projected sources of value creation (phase IIb and III)
2007 2011 2015
AvastinmCRC,NSCLC
Herceptinadjuvant BC
MabTheraNHL
HCVPolymerase
Inhibitor
ILLUSTRATIVE
ActemraRA
Avastinadjuvant
Colon cancer CETPinhibitor
OcrelizumabRA, lupus
PertuzumabmBC
Avastinadjuvant
Breast cancerAvastinadjuvant
Lungcancer
OcrelizumabMS
GLP-1T2 diabetes
MabTheraRA
AvastinmBC
extensions
MabTheraCLL
HPV16therapeutic
vaccine
Tarceva1st line maint.
Tarceva+Avastin
combo 2nd line
Xelodaadj. BC
32

17
33
Our objectives for 2008
Sales
• High single-digit local currency sales increase for Roche Group (excl. Tamiflu pandemic1)
• Above-market sales growth1 in both divisions
Core EPS
• Core earnings per share target2 at least at record 2007 level despite significant increase in R&D investment and considerably lower Tamiflu pandemic sales
Shareholder return
• Continuous increase in dividend pay-out ratio over the next 3 years
1 Excluding government and corporate stockpiling orders of Tamiflu for pandemic use2 At constant exchange rates Barring unforeseen events
34
Major growth opportunities outside the USHerceptin leading the way
0
20
40
60
80
100
MabThera/Rituxan
Herceptin
48 %
33 %
53 %
Tarceva Avastin
68 %
% o
f Tot
al 2
007
Sale
s
USEU / ROW (incl. Japan)
62 %
Xeloda